Article

Cyclosporin A Increases Mitochondrial Buffering of Calcium: An Additional Mechanism in Delaying Mitochondrial Permeability Transition Pore Opening

by
Jyotsna Mishra
1,
Ariea J. Davani
1,
Gayathri K. Natarajan
1,
Wai-Meng Kwok
1,2,3,4,
David F. Stowe
1,2,5,6 and
Amadou K.S. Camara
1,2,4,6,*
1
Department of Anesthesiology, Medical College of Wisconsin, Milwaukee, WI 53226, USA
2
Cardiovascular Center, Medical College of Wisconsin, Milwaukee, WI 53226, USA
3
Department of Pharmacology and Toxicology, Medical College of Wisconsin, Milwaukee, WI 53226, USA
4
Cancer Center, Medical College of Wisconsin, Milwaukee, WI 53226, USA
5
Research Service, Zablocki VA Medical Center, Milwaukee, WI 53295, USA
6
Department of Physiology, Medical College of Wisconsin, Milwaukee, WI 53226, USA
*
Author to whom correspondence should be addressed.
Cells 2019, 8(9), 1052; https://doi.org/10.3390/cells8091052
Submission received: 6 July 2019 / Revised: 26 August 2019 / Accepted: 3 September 2019 / Published: 7 September 2019
(This article belongs to the Section Mitochondria)

Abstract

:
Regulation of mitochondrial free Ca2+ is critically important for cellular homeostasis. An increase in mitochondrial matrix free Ca2+ concentration ([Ca2+]m) predisposes mitochondria to opening of the permeability transition pore (mPTP). Opening of the pore can be delayed by cyclosporin A (CsA), possibly by inhibiting cyclophilin D (Cyp D), a key regulator of mPTP. Here, we report on a novel mechanism by which CsA delays mPTP opening by enhanced sequestration of matrix free Ca2+. Cardiac-isolated mitochondria were challenged with repetitive CaCl2 boluses under Na+-free buffer conditions with and without CsA. CsA significantly delayed mPTP opening primarily by promoting matrix Ca2+ sequestration, leading to sustained basal [Ca2+]m levels for an extended period. The preservation of basal [Ca2+]m during the CaCl2 pulse challenge was associated with normalized NADH, matrix pH (pHm), and mitochondrial membrane potential (ΔΨm). Notably, we found that in PO43− (Pi)-free buffer condition, the CsA-mediated buffering of [Ca2+]m was abrogated, and mitochondrial bioenergetics variables were concurrently compromised. In the presence of CsA, addition of Pi just before pore opening in the Pi-depleted condition reinstated the Ca2+ buffering system and rescued mitochondria from mPTP opening. This study shows that CsA promotes Pi-dependent mitochondrial Ca2+ sequestration to delay mPTP opening and, concomitantly, maintains mitochondrial function.

1. Introduction

Regulation of intra-mitochondrial free calcium ([Ca2+]m) is critical in cardiac physiology and pathophysiology. Under physiological conditions, a moderate increase in [Ca2+]m is believed to stimulate key enzymes of the Krebs cycle and oxidative phosphorylation and to drive mitochondrial ATP production to match cellular energy demand [1,2]. In contrast, a pathological increase in [Ca2+]m causes opening of the mitochondrial permeability transition pore (mPTP), a key factor in initiation of cell death [3,4]. Pathophysiological dysregulation of [Ca2+]m is a primary mediator in cardiac ischemia and reperfusion (IR) injury, as Ca2+ overloading can lead to apoptosis [5,6,7].
[Ca2+]m is regulated by a dynamic balance between mitochondrial Ca2+ uptake, intra-mitochondrial Ca2+ buffering, and mitochondrial Ca2+ release. Mitochondrial Ca2+ uptake is mediated primarily through the mitochondrial Ca2+ uniporter (MCU) [8,9,10], and is controlled by the large membrane potential (ΔΨm: −180 to −200 mV) across the inner mitochondrial membrane (IMM). The ΔΨm in turn is generated by the flow of electrons and proton pumping along the respiratory chain complexes [11]. When [Ca2+]m increases, this depolarizes ΔΨm, which is compensated by enhanced H+ pumping/extrusion to alkalinize the matrix. Therefore, powerful, dynamic buffering of matrix pH (pHm) and Ca2+ are required to enable sufficient recovery of ΔΨm and to avoid overloading the matrix with a high [Ca2+]. Inorganic phosphate (Pi) has been recognized as a major player in maintaining the trans-matrix pH gradient when accompanied by the effective cotransport of H+ [12] and buffering of matrix Ca2+ through the formation of amorphous calcium phosphate (Ca–Pi) granules [13,14,15]. The Ca–Pi buffer system sets the free Ca2+ at a steady-state level, enabling greater mitochondrial Ca2+ loading without impeding the Ca2+ uptake and affecting the efflux system [16,17,18]. The efflux systems that regulate [Ca2+]m are the Na+/Ca2+exchanger (NCLX) [17], and the putative Na+-independent Ca2+ exchanger/Ca2+-hydrogen exchanger (CHE) [19]. Any disruption in the uptake, and or impairment in the buffering or efflux of Ca2+ would disrupt the delicate balance of the [Ca2+]m and lead to impaired bioenergetics and to opening of the mPTP [3,4].
The opening of the high conductance mPTP channel is associated with a high degree of mitochondrial swelling, dissipation of ΔΨm, uncoupling of oxidative phosphorylation, membrane rupture and release of sequestered Ca2+, metabolites, and apoptotic signaling molecules [20,21,22,23]. Although the molecular components of the mPTP and its regulation remain largely unclear, cyclophilin D (Cyp D) is the only unambiguously recognized regulatory component of the mPTP. Cyp D is a mitochondrial matrix peptidyl-prolyl cis-trans isomerase (PPIase) that is translocated to the IMM during high matrix Ca2+ conditions; Cyp D is proposed to facilitate conformational changes in the putative mPTP core proteins thereby regulating pore opening [24,25,26].
Adenine nucleotides (AdN: ATP and ADP) have been implicated in the inhibition of Ca2+-dependent mPTP opening [27,28]. A previous study from our laboratory suggested that matrix AdN modulate [Ca2+]m, potentially by increased buffering of [Ca2+]m [29]. Oligomycin (OMN), an F0F1-ATP synthase inhibitor, influences the AdN (ATP/ADP) pool, and has been shown to modulate mPTP opening [30]. Cyclosporin A (CsA), a potent mPTP inhibitor is also believed to suppress pore opening by inhibiting matrix Cyp D, thereby preventing the Cyp D-induced conformational changes in mPTP core proteins [31,32]. CsA has long been known to desensitize mPTP from early opening during Ca2+ challenges by impeding Ca2+ interaction with Cyp D; however, the direct effects of CsA on the [Ca2+]m buffering system have not been investigated systematically. It is worth noting that in a previous study from Chalmers and Nicholls [14], it was proposed that CsA enhances the Ca2+ loading capacity of mitochondria without changing the relationship between free [Ca2+]m and total [Ca2+]m during continuous Ca2+ infusion in isolated rat liver and brain mitochondria. Altschuld et al. [33] proposed that CsA increases mitochondrial Ca2+ influx and reduces its efflux. Later, Wei et al. [34] demonstrated that although CsA had no effect on MCU activity, it inhibited NCLX activity at higher concentrations. Altogether, these findings raise important questions about how CsA delays Ca2+-induced mPTP opening while increasing net [Ca2+]m accumulation. Our study sought to answer these questions by (i) examining the effect of CsA during repeated CaCl2 challenges over an extended time-period on mitochondrial Ca2+ buffering, and (ii) by examining the underlying changes in bioenergetics during excessive Ca2+ overload.
To address our objective, we investigated systematically the effect of CsA on mitochondrial Ca2+ buffering and compared its effect with a known matrix buffering component, the AdN pool (OMN+ADP), by monitoring [Ca2+]e, [Ca2+]m, and key mitochondrial bioenergetics variables, ΔΨm, pHm, and NADH (redox state), under conditions of repeated Ca2+ loading. Furthermore, we determined the effect of CsA on the rescue of buffering capability and bioenergetics of failing mitochondria just before mPTP opening. We found that CsA enhanced the sequestration of mitochondrial Ca2+, maintained [Ca2+]m at a steady-state level, and markedly delayed mPTP opening. In addition, CsA preserved ΔΨm, NADH, and pHm during CaCl2 bolus challenges. However, in the absence of Pi, this CsA-induced matrix Ca2+ sequestration was abrogated, and in turn led to the early mPTP opening. The results described herein reveal a novel way by which CsA modulates matrix Ca2+ sequestration to maintain [Ca2+]m, despite increased Ca2+ loading. CsA-mediated Ca2+ sequestration is likely achieved via a Pi-dependent [Ca2+]m buffering system that delays Ca2+-induced mPTP opening.

2. Materials and Methods

2.1. Materials

All chemical reagents were purchased from Sigma-Aldrich (St. Louis, MO, USA), unless stated otherwise. Fluorescent probes Fura-4F, Fura-4FAM, tetramethylrhodamine methyl ester perchlorate (TMRM) and 2′,7′-Bis-(2-Carboxyethyl)-5-(and-6)-carboxyfluorescein, acetoxymethyl ester (BCECFAM) were purchased from Life Technologies (Eugene, OR, USA).

2.2. Animals

Albino Hartley guinea pigs of both sexes weighing between 250 to 350 g were procured from Kuiper Rabbit Farm (Gary, IN, USA). All procedures were carried out in accordance with the National Institutes of Health (NIH) Guide for the Care and Use of Laboratory Animals (NIH Publication No. 85-23, revised 1996) and were approved by the Institutional Animal Care and Use Committee of the Medical College of Wisconsin.

2.3. Mitochondria Isolation

Mitochondria were isolated from guinea pig hearts as described previously [29,35,36]. Briefly, the guinea pig was anesthetized with an intraperitoneal injection of 30 mg ketamine plus 700 units of heparin, for anticoagulation, and the heart was rapidly excised and minced in ice-cold isolation buffer containing 200 mM mannitol, 50 mM sucrose, 5 mM KH2PO4, 5 mM MOPS, 1 mM EGTA, and 0.1% bovine serum albumin (BSA) at pH 7.15 (adjusted with KOH). The suspension was homogenized at low speed for 20 s in ice-cold isolation buffer containing 5 U/mL protease (from Bacillus licheniformis) and the homogenate was centrifuged at 8000× g for 10 min. The supernatant was discarded, and the pellet was suspended in 25 mL isolation buffer, and centrifuged at 850× g for 10 min. The supernatant was centrifuged further at 8000× g to yield the final mitochondrial pellet, which was suspended in isolation buffer and kept on ice until experimentation. All isolation procedures were performed at 4 °C and all experiments were conducted at room temperature. Protein concentration was determined by the Bradford method and the final mitochondrial suspension was adjusted to 12.5 mg protein/mL with isolation buffer.
The functional integrity of mitochondria was determined by the respiratory control index (RCI) as described before [29,37]. Mitochondria were energized with pyruvic acid (PA, 0.5 mM; pH 7.15, adjusted with KOH) followed by ADP (250 µM) addition. RCI was defined as the ratio of state 3 (after added ADP) to state 4 respiration (after complete phosphorylation of the added ADP). Only mitochondrial preparations with RCIs ≥ 10 were used to conduct further experiments.

2.4. Experimental Groups and Protocols

Two protocols (Protocol A and Protocol B) were used to assess the effect of CsA and AdN on mitochondrial Ca2+ handling and bioenergetics in normal and Ca2+-overloaded mitochondria, as shown in Figure 1. Protocol A investigated the ability of CsA and AdN to modulate mitochondrial Ca2+ handling and delay mPTP opening. To further substantiate CsA-mediated buffering of matrix Ca2+, Protocol B was designed to test the effectiveness of CsA and AdN on rescuing a failing mitochondrial Ca2+ buffering system from imminent mPTP opening. There were five experimental groups: vehicle (DMSO), CsA, ADP, OMN, and OMN+ADP. Experiments were also conducted in the presence of deionized H2O as another vehicle (not shown). Each group was subjected to two different experimental protocols (Protocol A and Protocol B) that differed in the order of treatment and addition of CaCl2 boluses to the mitochondrial suspension in experimental buffer.
Delayed opening of mPTP (Protocol A): At t = 0 s, the experiment was initiated by suspending 0.5 mg of isolated mitochondria into the experimental buffer containing 130 mM KCl, 5 mM K2HPO4, 20 mM MOPS, 1 mM EGTA, 0.1% BSA, and EGTA ~0.036–0.040 µM at pH 7.15 (adjusted with KOH). At t = 30 s, mitochondria were treated with DMSO (1 µM), ADP (250 µM), OMN (10 µM), OMN+ADP or CsA (0.5 µM); at t = 60 s, mitochondria were energized with PA (0.5 mM). At t = 180 s, CaCl2 bolus (20 μM final concentration) was added and subsequent CaCl2 boluses added at 5 min intervals until pore opening (Figure 1A). Note that all experiments were conducted under state 2 conditions, except in the ADP-and OMN+ADP-treated groups.
Rescue of mitochondria from mPTP opening (Protocol B): The mitochondrial suspension was exposed to repetitive boluses of CaCl2 (20 μM) as described in Protocol A; rescue of mitochondria from mPTP opening with the different treatments was carried out at 1 min of the last CaCl2 bolus in which mitochondria Ca2+ uptake was observed before pore opening (Figure 1B). The onset of mPTP opening was predicted based on calcium retention capacity (CRC) of the DMSO (control)-treated group for each day’s experiment. The pulse preceding mPTP opening observed in the control was the pulse chosen for targeted intervention in all subsequent experiments. In all experiments, extrusion of Ca2+ via the Na+/Ca2+ exchanger (NCLX) was prevented by conducting all the experiments in Na+-free conditions. That is, the respiration buffer, mitochondrial substrates, and all reagents/drugs were Na+-free to prevent activation of the NCLX. Some experiments were conducted in the presence of 10 μM CGP 37157 (Tocris Bioscience), an NCLX inhibitor, which ascertained there was no potential Na+ contamination in the respiration buffer from other sources [35,38,39].

2.5. Mitochondrial Function Measurements

Fluorescence spectrophotometry (Qm-8, Photon Technology International, Horiba, Birmingham, NJ, USA) was used to measure mitochondrial function, including mitochondria extra- and intra-matrix free [Ca2+] ([Ca2+]e and [Ca2+]m, respectively), ΔΨm, redox state (NADH), and pHm. Fura-4F penta-potassium salt (1 µM, Invitrogen™, Eugene, OR) was used to measure [Ca2+]e. For [Ca2+]m measurements, mitochondria were incubated with Fura-4F AM (5 µM, Invitrogen™, Eugene, OR) for 30 min at room temperature (25 °C) followed by a final spin and resuspension to remove any residual dye. ΔΨm was assessed using the cationic lipophilic dye TMRM (1 µM, Invitrogen™, Eugene, OR, USA) in a ratiometric excitation approach [40]. NADH was measured by tissue autofluorescence, and matrix pH (pHm) was assessed by incubating mitochondria in 5 μM BCECFAM (Invitrogen, Carlsbad, CA, USA) for 30 min at room temperature (25 °C) followed by a final spin and resuspension [29,35,38,39].

2.6. Measurements of Free Ca2+

Quantification of [Ca2+]e and [Ca2+]m were made using the fluorescent Ca2+ indicator probe Fura-4F with dual-excitation wavelengths (λex) at 340/380 nm and a single emission wavelength (λem) at 510 nm. Ca2+ fluorescent intensities with Fura-4F are not influenced by background noise (e.g., NADH autofluorescence), so a background subtraction was unnecessary [38]. Fura-4F fluorescence ratios (F340/F380) were used to calculate [Ca2+] using the equation described by Grynkiewicz: [41].
[ Ca 2 + ] = K d S f 2 S b 2 ( R R min ) ( R max R ) .
The Kd value for Fura-4F binding to Ca2+ is 890 nM, which was described by us previously [38]. R is the ratio of the fluorescence intensities at λex 340 and 380 nm, Sf2/Sb2 is the ratio of fluorescence intensities measured at λex 380 nm in Ca2+-free (f)/Ca2+-saturated (Ca2+-bound, b) conditions. Rmin (Ca2+-free) and Rmax (Ca2+-saturated) are R values for Fura 4F, carried out after mPTP opening, adding 1 mM CaCl2, followed by 10 mM EGTA, pH 7.1. The free [Ca2+] in the buffer was calculated using an online version of MaxChelator program (http://www.stanford.edu/~cpatton/maxc.html) and accordingly, a standard curve was generated for the Fura-4F signal to the free [Ca2+] in the experimental solution by fitting to the Grynkiewicz equation, as described above in Equation 1 [41].

2.7. Calculation of Mitochondrial Ca2+ Buffering Capacity

The ability of mitochondria to sequester Ca2+ is an index of its Ca2+ loading capacity, without altering mitochondrial function. Here we calculated mitochondrial Ca2+ buffering capacity (mβCa) using the model described by Bazil et al. [42]. Briefly, experimental data for extra-and intra-matrix Ca2+ were fit with smooth trend curves satisfying the equation:
y ( t ) = p 1 + p 2 e ( t p 3 ) p 4 + p 5 t ,
where y(t) was either [Ca2+]e or [Ca2+]m at any given time, t. Global trend-fits were performed in MATLAB (Mathworks, Inc., MA) and parameters p1 (offset value), p2 (pre = exponential constant), p3 (time lag), p4 (decay time constant), and p5 (steady-state slope) were estimated and optimized using the lsqnonlin and fmincon functions.
Mitochondrial Ca2+ buffering capacity for the second Ca2+ pulse (a cumulative of 40 µM added Ca2+) was then calculated [42] as:
m β Ca = β Ca , e V r d [ Ca 2 + ] e dt / d [ Ca 2 + ] m dt ,
where, mβCa, is the intra-mitochondrial Ca2+ buffering power, βCa,e is the extra-mitochondrial Ca2+ buffering power determined by:
β Ca , e = 1 + [ CaEGTA ] e [ Ca 2 + ] e .
Vr is the volume ratio of the extra-mitochondrial space and matrix space (~2000), d[Ca2+]e/dt and d[Ca2+]m/dt are the rates of change of extra-and intra-mitochondrial free [Ca2+], respectively. d[Ca2+]e/dt and d[Ca2+]m/dt were estimated by evaluating the analytical derivative of Equation (2) using parameter estimates obtained from the trend fits [42].
Trend fits for data in Figure S4 were performed in Origin 2017 (OriginLab Corporation, Northampton, MA, USA).

2.8. Measurement of ΔΨm, Redox State (NADH) and Matrix pH

Membrane potential was assessed by the dual-excitation ratiometric approach using the fluorescent dye, TMRM, as described by Scaduto and Grotyohann [40] and in our published work [35,38,39]. Fluorescence changes were determined by two excitations, λex 546 and 573 nm, and a single emission λem 590 nm. The calculated ratio of λex 573/546 is proportional to ΔΨm and has the advantage of a broader dynamic range when compared to a single wavelength technique. Changes in mitochondrial redox state (NADH) were determined by autofluorescence (i.e., by exciting the energized mitochondria at λex 350 nm and collecting data at λem 456 nm). An increase in the signal reflects an increase in the redox ratio of NADH to NAD+ (i.e., a shift to a more reduced state). Matrix pH was assessed using BCECFAM (5 μM) at λex 504 nm and λem 530 nm. This fluorescent probe emits less fluorescence in an acidic environment, thus a decrease in signal indicates matrix acidification and an increase in signal indicates matrix alkalization [29].

2.9. Depletion of Endogenous Mitochondrial Phosphate

Given the important role of Pi in the mitochondrial Ca2+ buffering system [14,29], we tested the effect of Pi in CsA-induced mitochondrial Ca2+ buffering. Isolated cardiac mitochondria were depleted of endogenous Pi by pre-incubating mitochondria for 10 min at room temperature with 0.75 units/mL hexokinase, 1 mM glucose, 0.5 mM ADP, 1 mM MgCl2, and 5 mM PA, as previously described [14,43,44].

2.10. Statistical Analyses

Data were transferred from PTI FelixGX (Version 3) into Microsoft® Excel® (2007). An unpaired Student’s t-test was used to evaluate significant differences between means of CsA-treated versus DMSO- and AdN-treated groups on specific variables ([Ca2+]m, [Ca2+]e, ΔΨm, NADH, or pHm) in both Protocols A and B. The final data of a specific variable were expressed as mean ± standard error (SE) over at least 4 replicates of the same variable (n = 4). Comparisons within and between groups were performed by one-way ANOVA (analysis of variance) with Tukey’s post-hoc test to examine differences among individual groups. p < 0.05 (two-tailed) was considered significant. See Figure legends for statistical notations.

3. Results

3.1. Effect of CsA on Extra-Matrix Free [Ca2+]

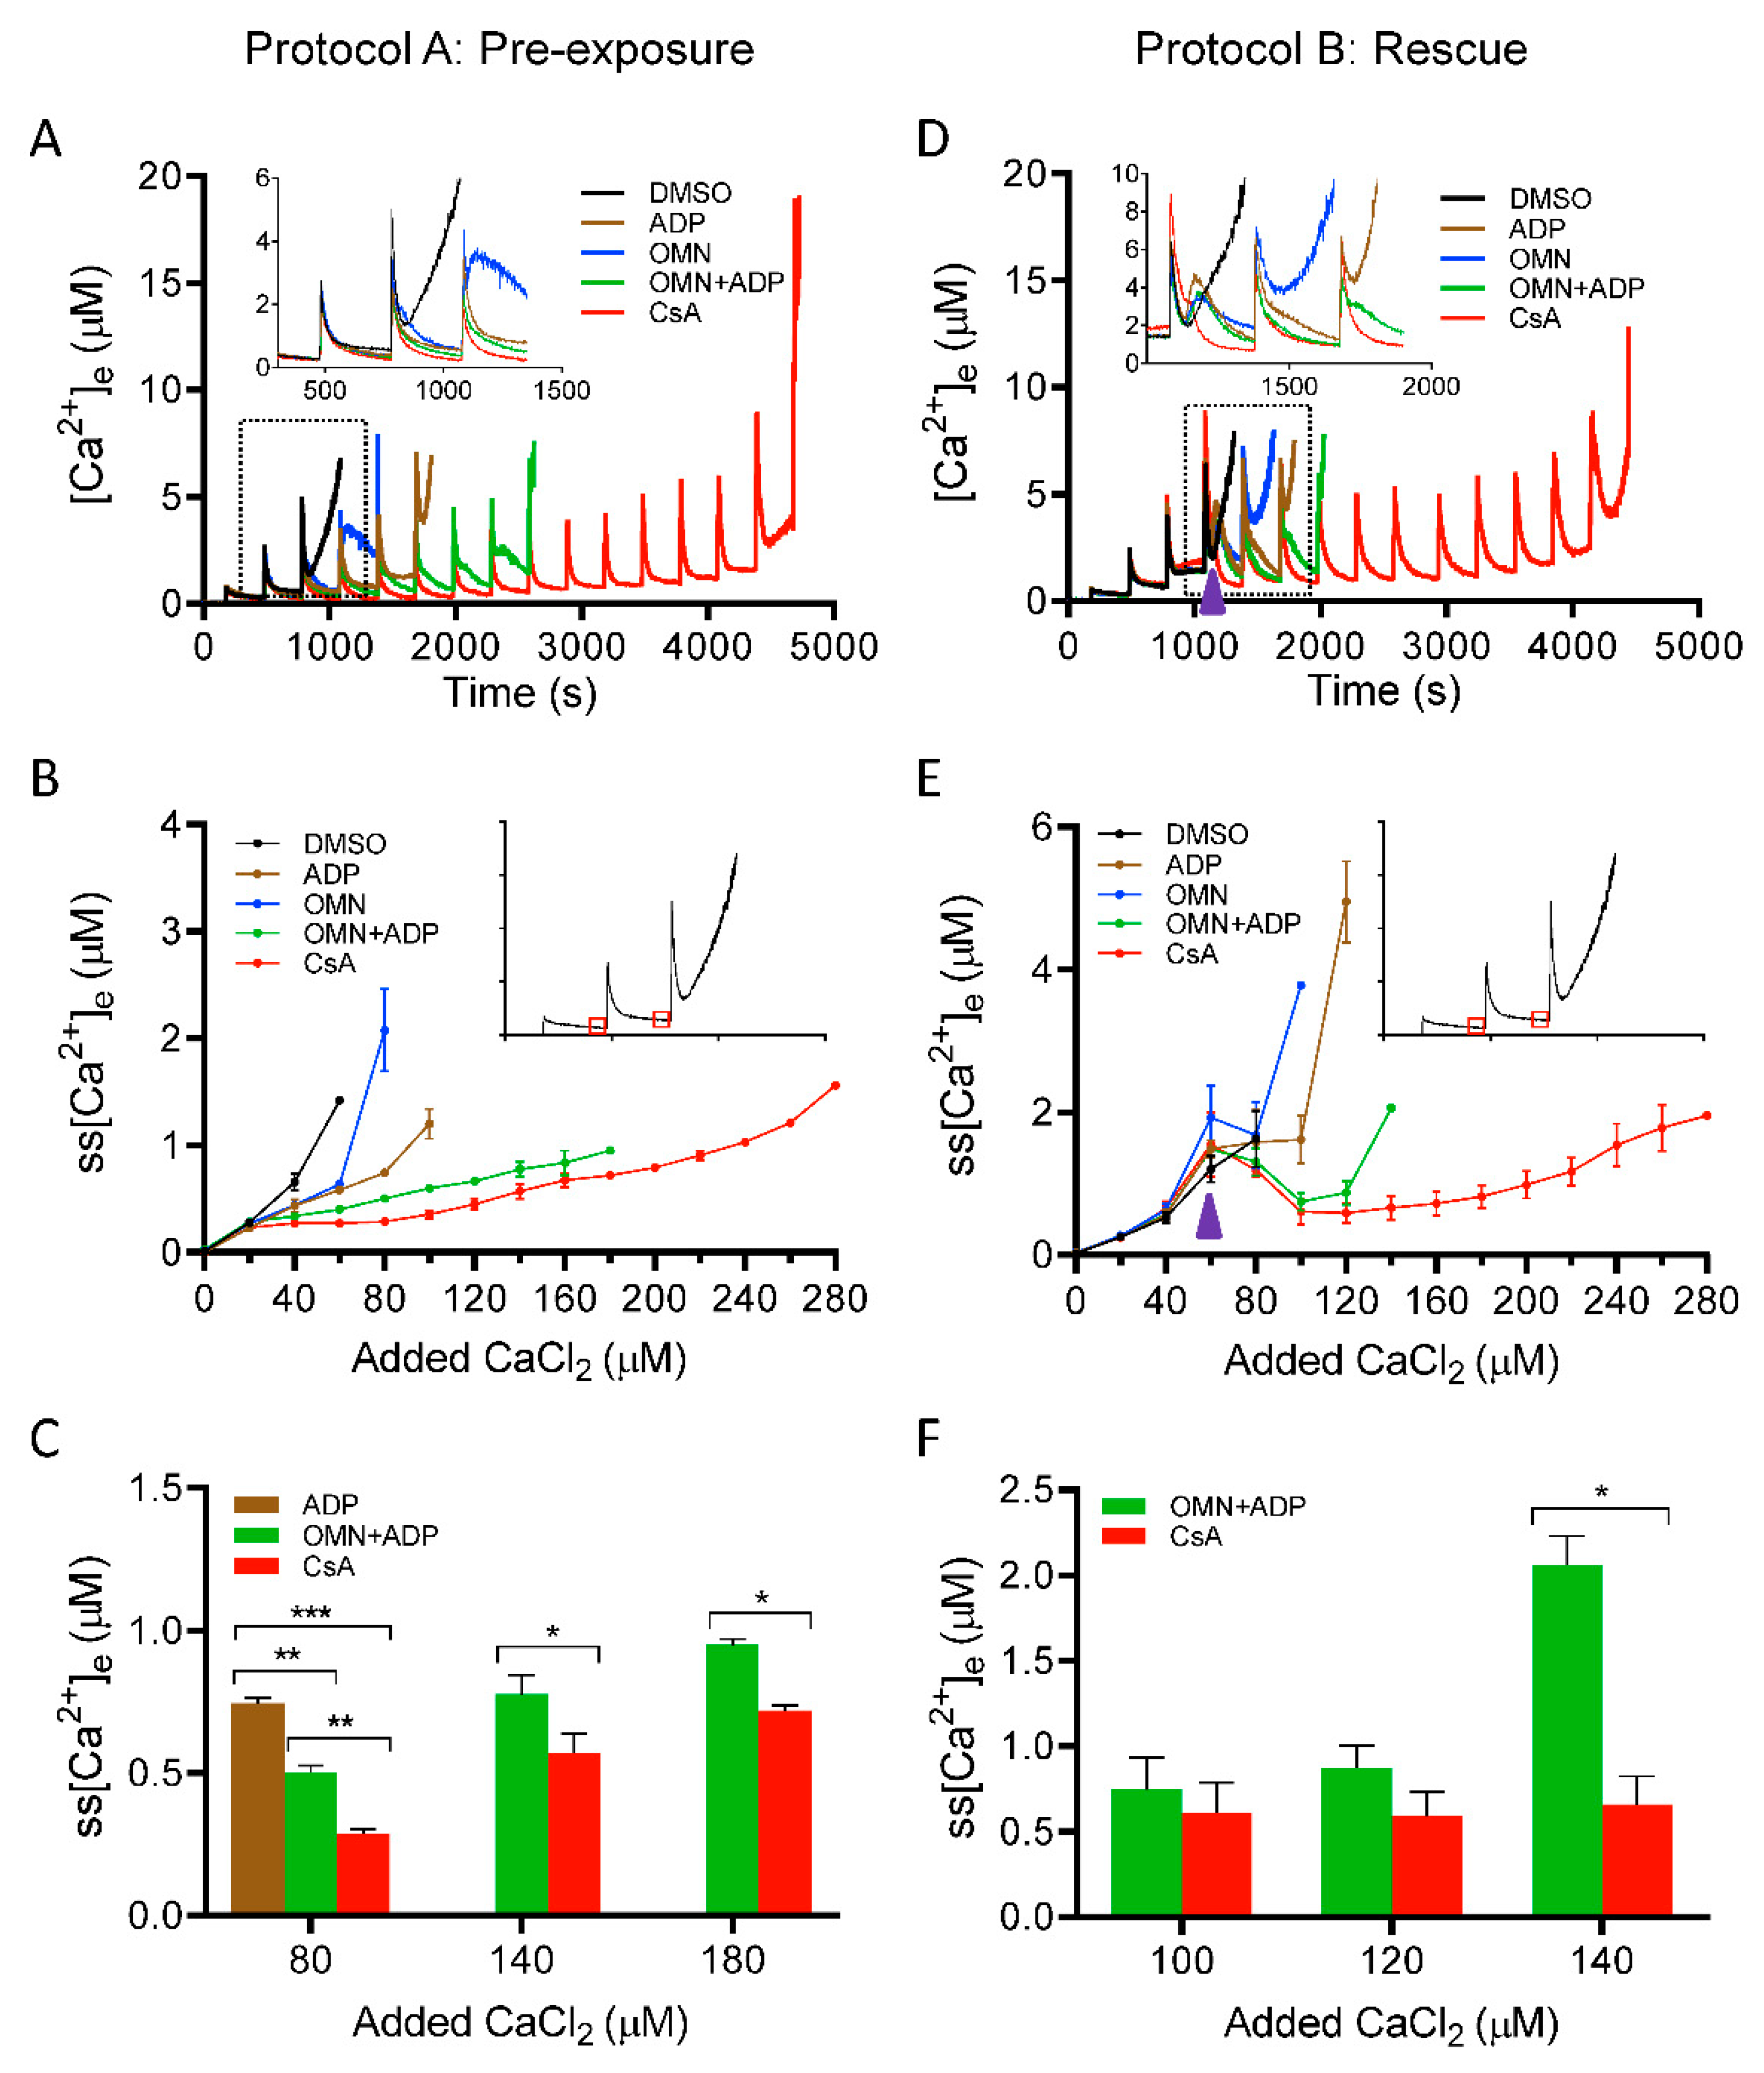
To determine the effect of CsA on matrix Ca2+ uptake, we measured [Ca2+]e during repetitive additions of 20 µM CaCl2 boluses at 5 min (300 s) intervals to allow characterization of the detailed kinetics of steady-state Ca2+ dynamics (influx and buffering). Figure 2 shows the dynamics of [Ca2+]e during CaCl2 pulse challenges, with different treatments. Panels A, B, C and panels D, E, F depict the Ca2+ dynamics profile using Protocols A and B, respectively. Each panel consists of five traces representing different treatment groups (DMSO, ADP, OMN, OMN+ADP, and CsA) in the presence of approximately 40 μM EGTA (carried over from the isolation buffer). In response to each CaCl2 pulse, an increase in Fura-4F fluorescence intensity was observed, which then returned to a baseline; the steady-state (ss) level is marked by the flat response as mitochondria take up and sequester the added Ca2+. The opening of mPTP is evident by cessation of mitochondrial Ca2+ uptake and a sharp rise in the extra-matrix dye fluorescent intensity. Ca2+ concentrations were determined from the fluorescence ratios using Equation (1).
We plotted steady-state [Ca2+]e (ss[Ca2+]e) as a function of cumulative added CaCl2 at each pulse (Figure 2B). The detailed dynamics of ss[Ca2+]e for the initial four CaCl2 pulses, in each group, are illustrated in the enlarged scale inset (Figure 2A). The exposure of mitochondria to DMSO and OMN, followed by repeated boluses of CaCl2, resulted in a gradual increase in ss[Ca2+]e with less mitochondrial Ca2+ uptake and rapid Ca2+ release by the third or fourth CaCl2 pulse. The total CRC for the DMSO and OMN were comparable (i.e., 133.3 ± 13.3 nmol Ca2+/mg protein and 146.6 ± 13.3 nmol Ca2+/mg protein, respectively) (Figure S1). In the presence of ADP, mitochondria took up more Ca2+ before pore opening and the CRC was further augmented with OMN+ADP; the CRC value increased from 213.3 ± 13.3 nmol Ca2+/mg protein for ADP alone to 373.3 ± 35.3 nmol Ca2+/mg protein for OMN+ADP (Figure S1). Mitochondria treated with CsA before the addition of CaCl2 boluses displayed a more robust Ca2+ uptake, with a significantly higher CRC value, 573.3 ± 26.6 nmol Ca2+/mg protein, compared with all other groups (Figure 2A and Figure S1). Importantly, in CsA-treated mitochondria, the addition of CaCl2 pulses (20 µM) did not significantly increase the ss[Ca2+]e until the sixth to seventh pulse (Figure 2B), suggesting enhanced Ca2+ uptake. Figure 2C, summarizes the effects of the different treatments on the ss[Ca2+]e for cumulative additions of 80, 140, and 180 µM of Ca2+, which corresponds to the fourth, seventh, and ninth CaCl2 pulses, respectively. The addition of CsA strongly blunted the Ca2+-induced increase in ss[Ca2+]e by stimulating faster and more Ca2+ uptake. We observed that the ss[Ca2+]e was significantly lower for the CsA-treated mitochondria than for OMN+ADP-treated mitochondria after the cumulative addition of CaCl2 of 80 µM (0.28 ± 0.0 µM vs. 0.50 ± 0.02 µM), 140 µM (0.57 ± 0.06 µM vs. 0.77 ± 0.06 µM), and 180 µM (0.71 ± 0.02 µM vs. 0.95 ± 0.1 µM) CaCl2, respectively (Figure 2B,C). The sustained low ss[Ca2+]e for an extended period of CaCl2 additions in the CsA-treated group indicates a maintained ΔΨm for Ca2+ uptake, resulting in enhanced Ca2+ loading capacity because of improved buffering.
We next examined [Ca2+]e dynamics in the situation in which mitochondrial matrix Ca2+ nearly reached threshold, as determined by the predicted opening of mPTP; in this case we added CsA just before the anticipated mPTP opening. Using Protocol B (Figure 1), [Ca2+]e was measured and the kinetics were compared in response to adding either DMSO, ADP, OMN, OMN+ADP, or CsA just before the onset of the mPTP opening (Figure 2D). The dynamic changes in ss[Ca2+]e during the addition of different treatments are illustrated in more detail in the inset of Figure 2D. In the DMSO-treated mitochondria, three to four Ca2+ pulses (cumulative addition of 68 ± 4.9 µM CaCl2) were sufficient to induce the release of matrix Ca2+. Addition of ADP or OMN reversed the initial pore opening and delayed matrix Ca2+ release by one to two pulses compared to DMSO. Addition of OMN+ADP also showed a significant reversal of Ca2+ release with reduction in the ss[Ca2+]e (0.74 ± 0.18 µM). Thus, there was a considerable increase in the CRC by OMN+ADP compared to DMSO (Figure 2D and Figure S1) and a further delay in mPTP opening by one additional CaCl2 bolus compared to OMN or ADP alone. More impressively, the addition of CsA not only reversed the increasing trend of ss[Ca2+]e to the baseline levels (0.42 ± 0.06 µM) (Figure 2D,E), it further maintained the ss[Ca2+]e at a constant low value for an additional twelve to thirteen Ca2+ pulses. This resulted in a four-fold and a two-fold increase in the CRC, compared to DMSO and OMN+ADP, respectively (Figure 2E,F and Figure S1).
Altogether, these results demonstrate that CsA enhances mitochondrial Ca2+ uptake, thereby inhibiting a consequent increase in free [Ca2+]e during CaCl2 pulse challenges, leading to an increase in the CRC of the mitochondria. This sustained low ss[Ca2+]e and concomitant increase in Ca2+ uptake are likely explained by enhanced [Ca2+]m buffering to maintain basal [Ca2+]m, which results in a preserved ΔΨm for Ca2+ uptake and greater CRC. To investigate further the potential for CsA on mediating Ca2+ buffering, it was necessary to examine the effects of CsA on matrix [Ca2+]m dynamics in the next set of experiments.

3.2. Effect of CsA on Matrix Free [Ca2+] Handling

Matrix Ca2+ was assessed with Fura-4 AM as described in Materials and Methods. We explored the effect of CsA on [Ca2+]m, under identical conditions and protocols as shown in Figure 1 (Protocols A,B). Mitochondrial Ca2+ buffering was measured as a function of a decrease in Ca2+ fluorescence, reaching a steady-state at approximately 270 s after each bolus of CaCl2 added. The magnitude of mitochondrial Ca2+ uptake for the first CaCl2 pulse (20 µM) was similar in all groups; however, on subsequent additions of CaCl2, the ADP- and/or OMN-treated groups showed faster declines in [Ca2+]m with lower mitochondrial steady-state [Ca2+]m (ss[Ca2+]m) and delayed mPTP opening compared to DMSO (Figure 3A,B). Interestingly, the CsA-treated group showed a small increase in ss[Ca2+]m with each CaCl2 pulse, but a gradual decline in ss[Ca2+]m was observed after [Ca2+]m exceeded 3 ± 0.10 µM with the cumulative addition of 100–150 µM CaCl2 (Figure 3A,B) and a significant increase in CRC up to fifteen to sixteen pulses. This suggested that the buffering effect of CsA on matrix Ca2+ is triggered when [Ca2+]m reaches a certain value.
To estimate the mitochondrial Ca2+ buffering capacity, the ratio of bound Ca2+:free Ca2+ was calculated from the change in [Ca2+]m (Figure 3A) to the total amount of Ca2+ taken up from the extra-matrix medium (ΣCa2+uptake): (ΣCa2+uptake-[Ca2+]m)/[Ca2+]m, as described previously [45]. Although the extent of bound Ca2+:free Ca2+ at each Ca2+ pulse was comparable in all the treated groups (Figure 3C), the addition of CsA maintained the buffering capacity, with a gradual increase in the capacity to bind Ca2+ up to fifteen or sixteen Ca2+ pulses (Figure 3C).
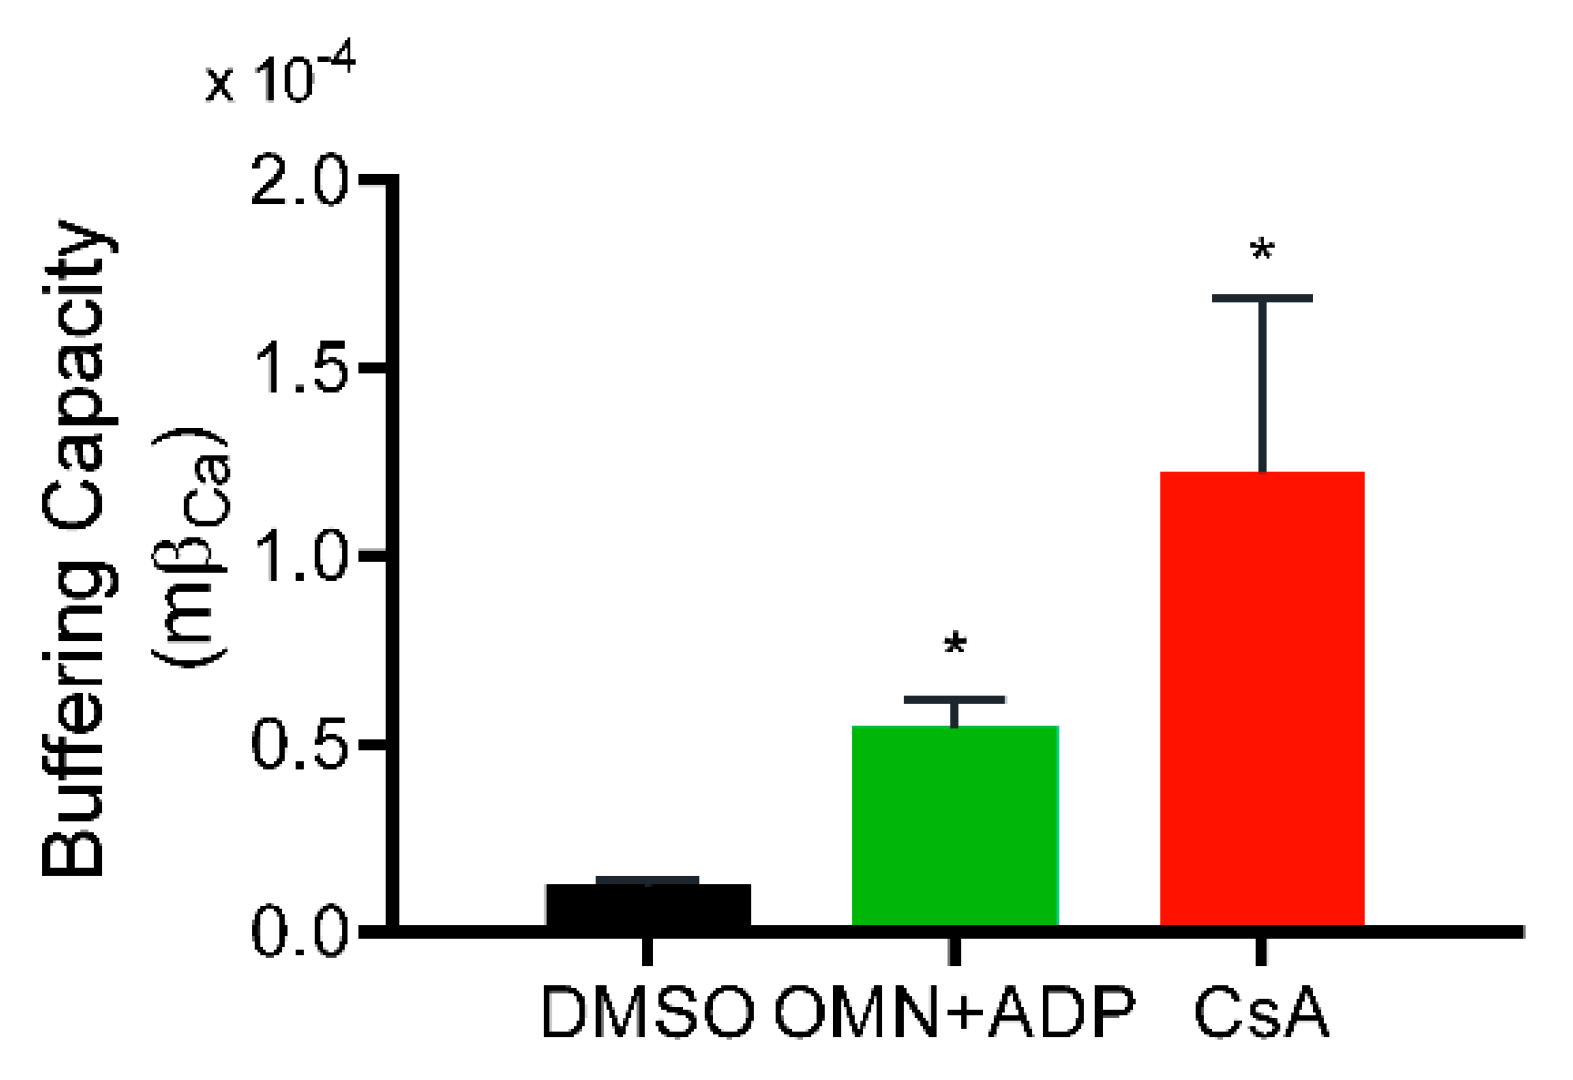
Greater uptake of Ca2+ from the extra-matrix space (indicated by lower ss[Ca2+]e), combined with lower ss[Ca2+]m, indicated a greater Ca2+ buffering capacity of mitochondria in the presence of CsA. Consistent with this notion, the calculated matrix Ca2+ buffering capacity (mβCa) in CsA-treated mitochondria was about ten-fold higher compared to DMSO and two-fold higher than with OMN+ADP (Figure 4). This CsA-mediated increase in mβCa is possibly due to an effect of CsA in triggering the matrix physiological buffers to enhance sequestration of Ca2+.
After observing the high buffering capacity of mitochondria pre-treated with CsA before the CaCl2 bolus challenges, we next examined the effect of CsA on the rescue of mitochondria from Ca2+ release when the matrix Ca2+ buffering system (MCBS) becomes overwhelmed by the added boluses of CaCl2 (Figure 1B). As shown in Figure 3D,E, OMN and ADP, each failed to reverse the mitochondrial Ca2+ efflux with added boluses; however, adding CsA or OMN+ADP at similar time points significantly reduced ss[Ca2+]m by reinstating Ca2+ sequestration. This reversal was more effective and sustained in the presence of CsA than with OMN+ADP. This observation is consistent with the calculated values of bound Ca2+: free Ca2+, which increased two-fold for CsA compared to OMN+ADP (Figure 3F). Taken together, these data demonstrate that CsA increases the mitochondrial Ca2+ threshold for mPTP opening by activating [Ca2+]m buffering that results in maintenance of a low ss[Ca2+]m.

3.3. Effect of CsA on Ca2+-Mediated Changes in ΔΨm, NADH, and Matrix pH

A major driving force for Ca2+ uptake, in addition to the chemical gradient, is a high IMM potential gradient (ΔΨm); but increased Ca2+ uptake without efflux or sequestration can decrease ΔΨm by flooding the matrix with positive charges. To strengthen the thesis that CsA increases the capacity of mitochondria to sequester Ca2+, we next investigated the effect of CsA on mitochondrial bioenergetics. ΔΨm, NADH, and pHm were assessed using the same protocols as described in Figure 1 for CRC to correlate changes in [Ca2+]m to changes in bioenergetics over time. mPTP opening was marked by a sudden rise in the TMRM signal, indicating maximal depolarization of Ψm. Correspondingly, the oxidation of NADH was marked by a decrease in matrix NADH signal intensity when mPTP opens. Figure 5 shows representative traces of ΔΨm, NADH, and pHm for each experimental condition. The rate of ΔΨm depolarization and NADH oxidation correlated well with the induction of mPTP, as seen in the CRC data. The loss of CRC coincided with total ΔΨm dissipation and NADH oxidation. DMSO-treated mitochondria (control) exhibited rapid Ca2+-induced ΔΨm depolarization and NADH oxidation (black trace) after only a few CaCl2 pulses. Addition of OMN+ADP significantly delayed the Ca2+ induced ΔΨm depolarization and NADH oxidation when compared to DMSO, with 533.3 ± 26.7 nmol Ca2+/mg protein vs. 200 ± 23 nmol Ca2+/mg protein and 546.7 ± 18.9 nmol Ca2+/mg protein vs.173.3 ± 13.3 nmol Ca2+/mg protein Ca2+ capacity, respectively (Figure 5A,B). Mitochondria treated with CsA maintained ΔΨm and NADH for a higher number of CaCl2 pulses than with OMN+ADP (666.7 ± 13.3 nmol Ca2+/mg protein, and 626.6 ± 13.3 nmol Ca2+ /mg protein, respectively) (Figure 5A,B). Mitochondrial matrix pH (pHm) is known to modulate mitochondrial Pi concentration and thus influence the matrix Ca2+ buffering [14]. The presence of CsA maintained pHm at a basal level until mPTP opened (Figure 5C).
In Protocol B, intervention with OMN + ADP or CsA maintained ΔΨm, mitochondrial NADH, and pHm (Figure 5D–F), and contributed to the improved capacity of mitochondria to take up and sequester additional Ca2+ after CaCl2 pulses. However, OMN+ADP was less effective in preserving ΔΨm, NADH, and pHm compared to CsA. This incapacity to sustain the bioenergetic status in the OMN+ADP- vs. CsA-treated mitochondria during CaCl2 challenges reflects a lower capacity to sequester Ca2+ in the matrix for a protracted time.
In summary, maintenance of ΔΨm, NADH, and pHm in the presence of CsA is consistent with changes in [Ca2+]e and [Ca2+]m that reflect greater Ca2+ sequestration (Figure S2) and uptake. Collectively, these results indicate that CsA reduced the accumulation of [Ca2+]m, by potentiating matrix Ca2+ buffering, which in turn, maintained ΔΨm, NADH, and pHm necessary for normal mitochondrial function. Together, these mitochondrial variables preserve mitochondria and protect against mPTP opening.

3.4. Time Dependent Effect of CsA Addition on Rescue of Mitochondria from Imminent Ca2+-Induced mPTP Opening

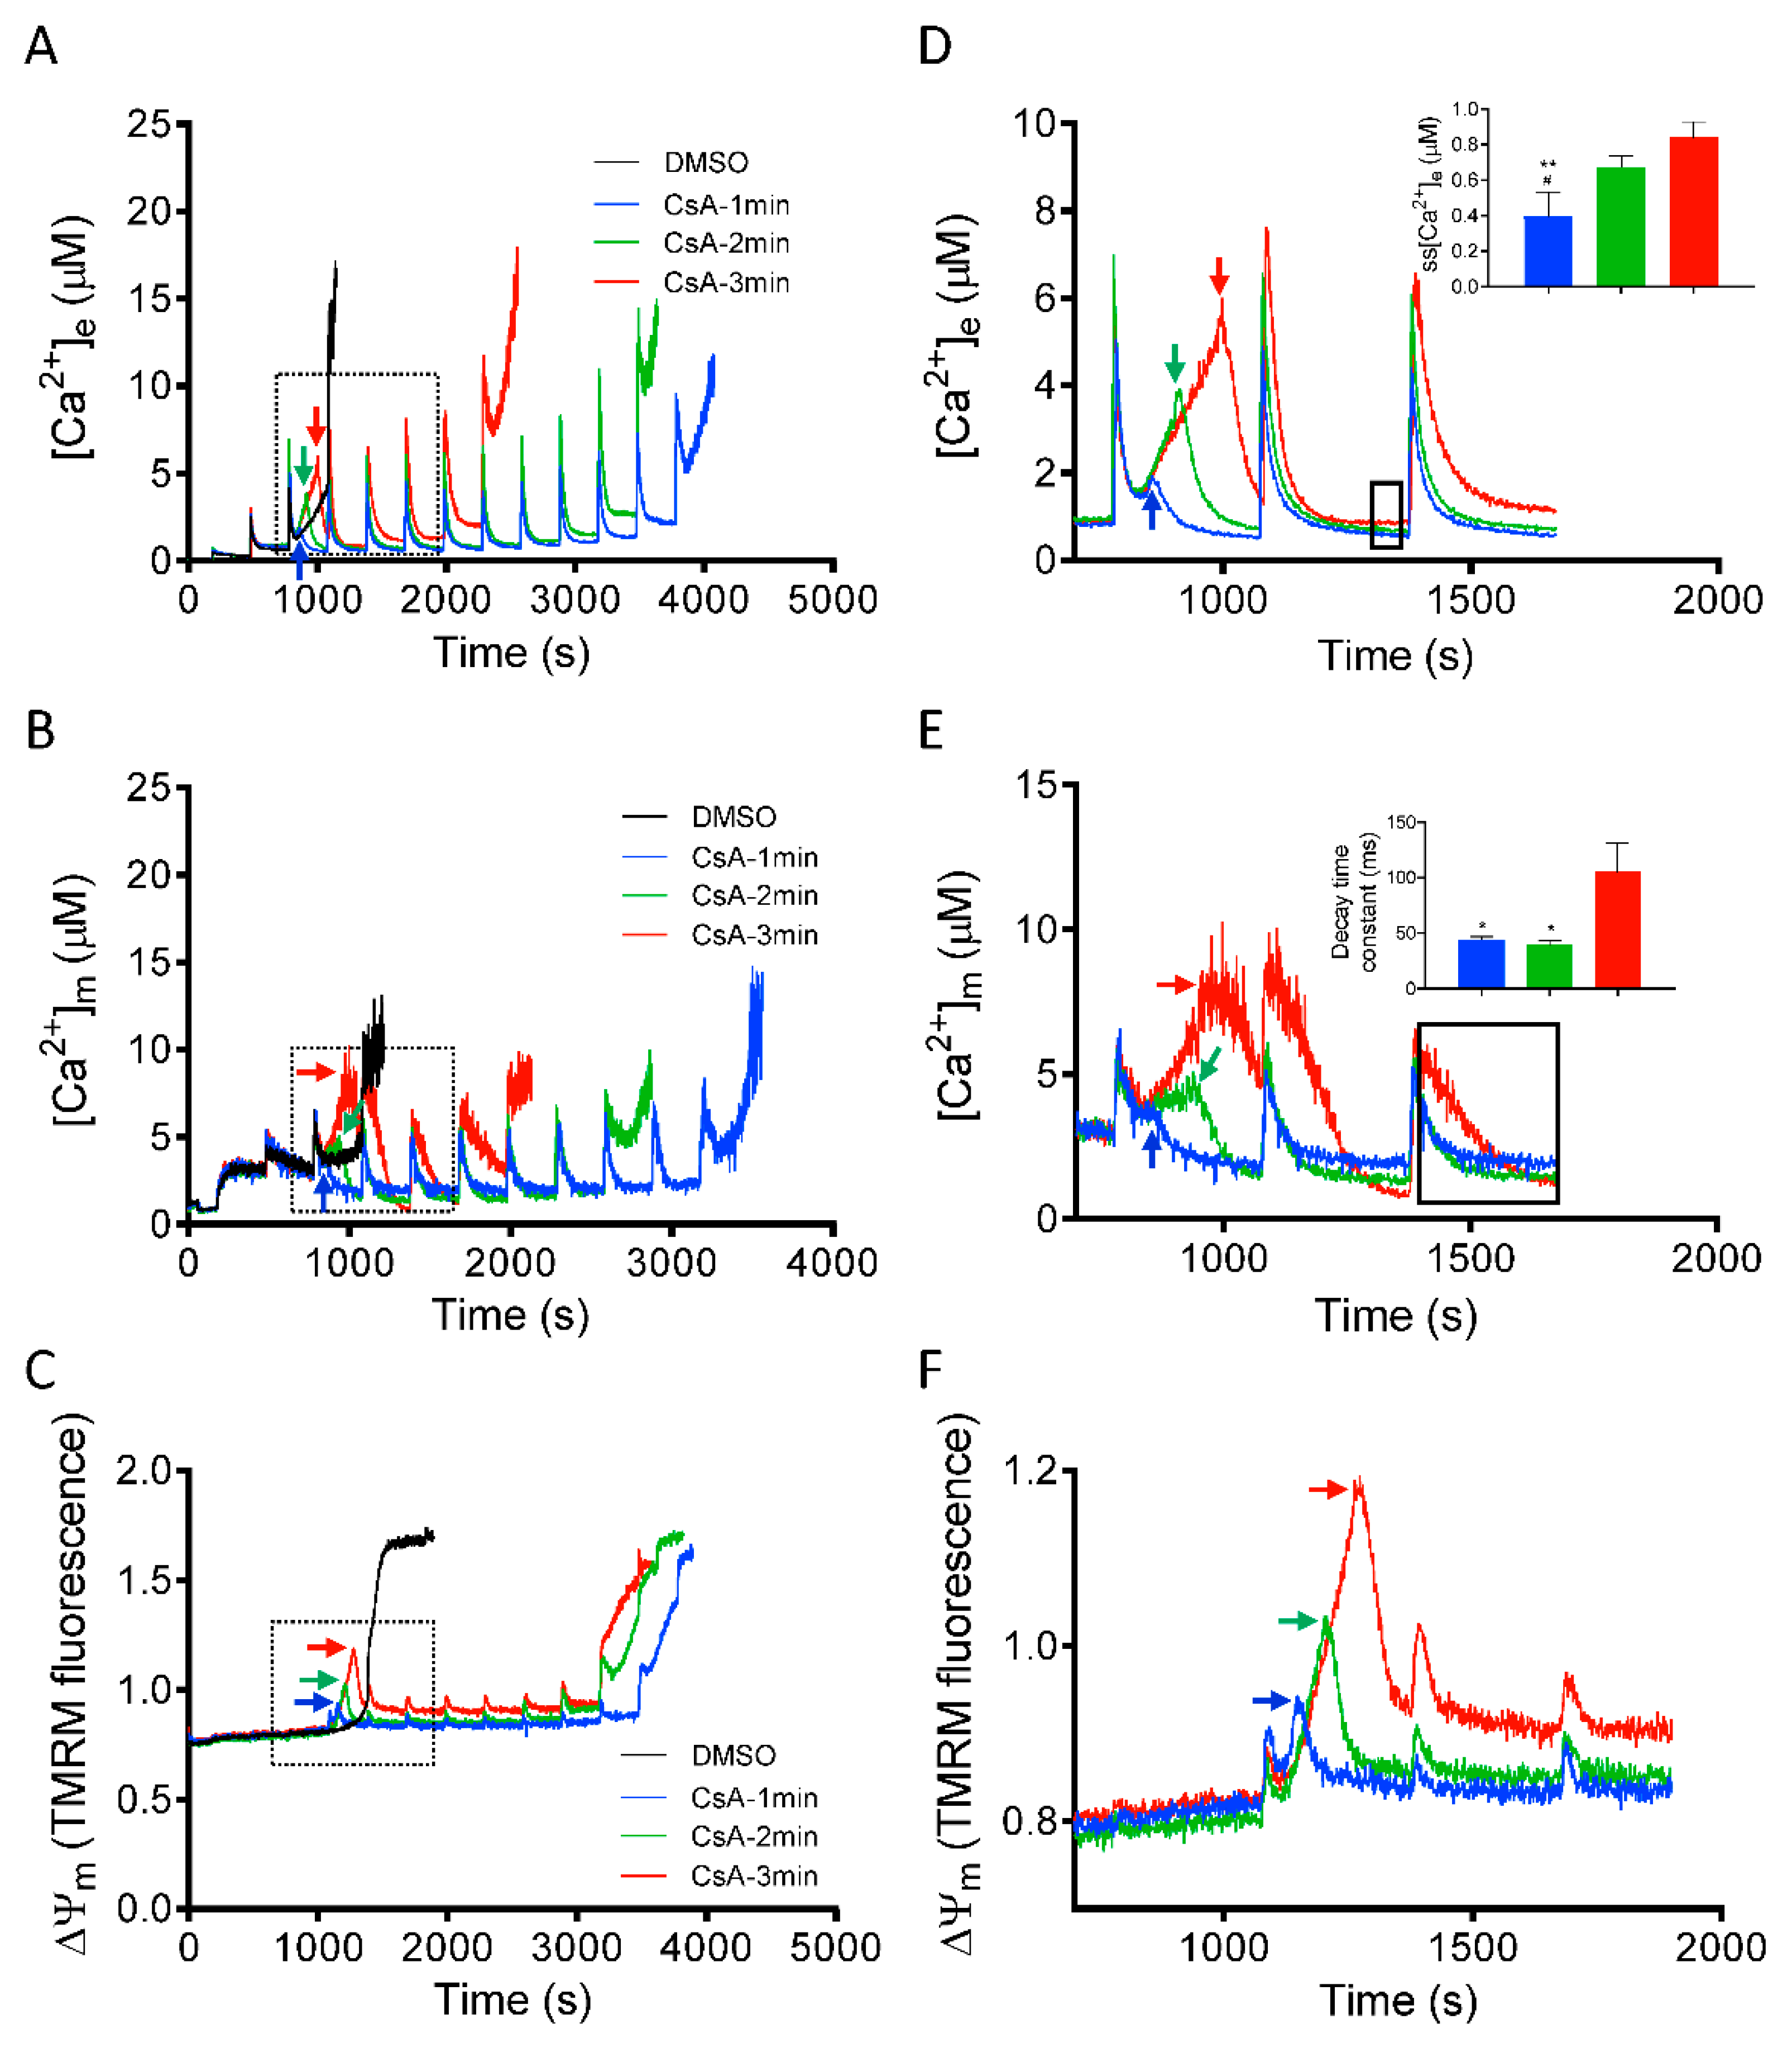
After demonstrating that CsA can reverse the induction of mPTP opening (Figure 2, Figure 3 and Figure 5), we next investigated the dynamics of [Ca2+]e, [Ca2+]m and ΔΨm, by adding CsA at three different time points, before the onset of mPTP opening. This approach allowed us to determine the threshold at which CsA can effectively restore the mitochondrial sequestration system that will protect mitochondria from Ca2+ overload-mediated pore opening. Figure 6, panels A-C, show changes in [Ca2+]e, [Ca2+]m, and ΔΨm depolarization, induced by adding CsA at 1, 2, and 3 min after the last CaCl2 bolus in which mitochondrial Ca2+ uptake was observed before pore opened. Right panels D-F show detailed (close up) comparison of kinetics of [Ca2+]e, [Ca2+]m, and ΔΨm after adding CsA at different time points. Adding CsA at all three tested time points, markedly delayed the large increase in [Ca2+]e due to mitochondrial Ca2+ release. However, the effect of CsA to prolong Ca2+ uptake, which eventually maintains ss[Ca2+]e at baseline, diminished as the interval before CsA addition and [Ca2+]e accumulation was lengthened (Figure 6A). Adding CsA at 1 min caused a decline in [Ca2+]e, with a marked decrease in ss[Ca2+]e (0.39 ± 0.07 µM) of the succeeding Ca2+ pulses, compared to adding CsA at 2 min (0.67 ± 0.03 µM) and 3 min (0.84 ± 0.05 µM) (Figure 6D; inset). In addition, we examined for changes in kinetics of [Ca2+]m with CsA added at the same time points (Figure 6B). The rate of maximal Ca2+ buffering (i.e., the time to reach steady-state [Ca2+]m) and the Ca2+ threshold for pore opening was significantly higher when CsA was added at the early time points (i.e., 1 and 2 min) compared to the late time point of 3 min (Figure 6E, inset).
Next, in a parallel study, we monitored the corresponding changes in ΔΨm profile at the same rescue time points (1, 2, or 3 min). Adding CsA reversed the Ca2+-induced ΔΨm depolarization even after a large depolarization (i.e., at 3 min; Figure 6C,F). Similar to its effect on [Ca2+]e and [Ca2+]m, CsA restored and maintained ΔΨm for a longer period at rescue points of 1 min vs. 2 and 3 min. Thus, at these points of intervention, CsA suppressed mPTP opening by increasing matrix Ca2+ buffering capacity, which maintained ΔΨm and the driving force for further Ca2+ uptake (Figure 6C). Together, these results demonstrate that the magnitude of CsA-mediated increase in Ca2+ threshold for mPTP opening and maintenance of mitochondrial integrity is dependent on the [Ca2+]m level before CsA intervention.

3.5. Role of Inorganic Phosphate in CsA-Induced [Ca2+]m Regulation.

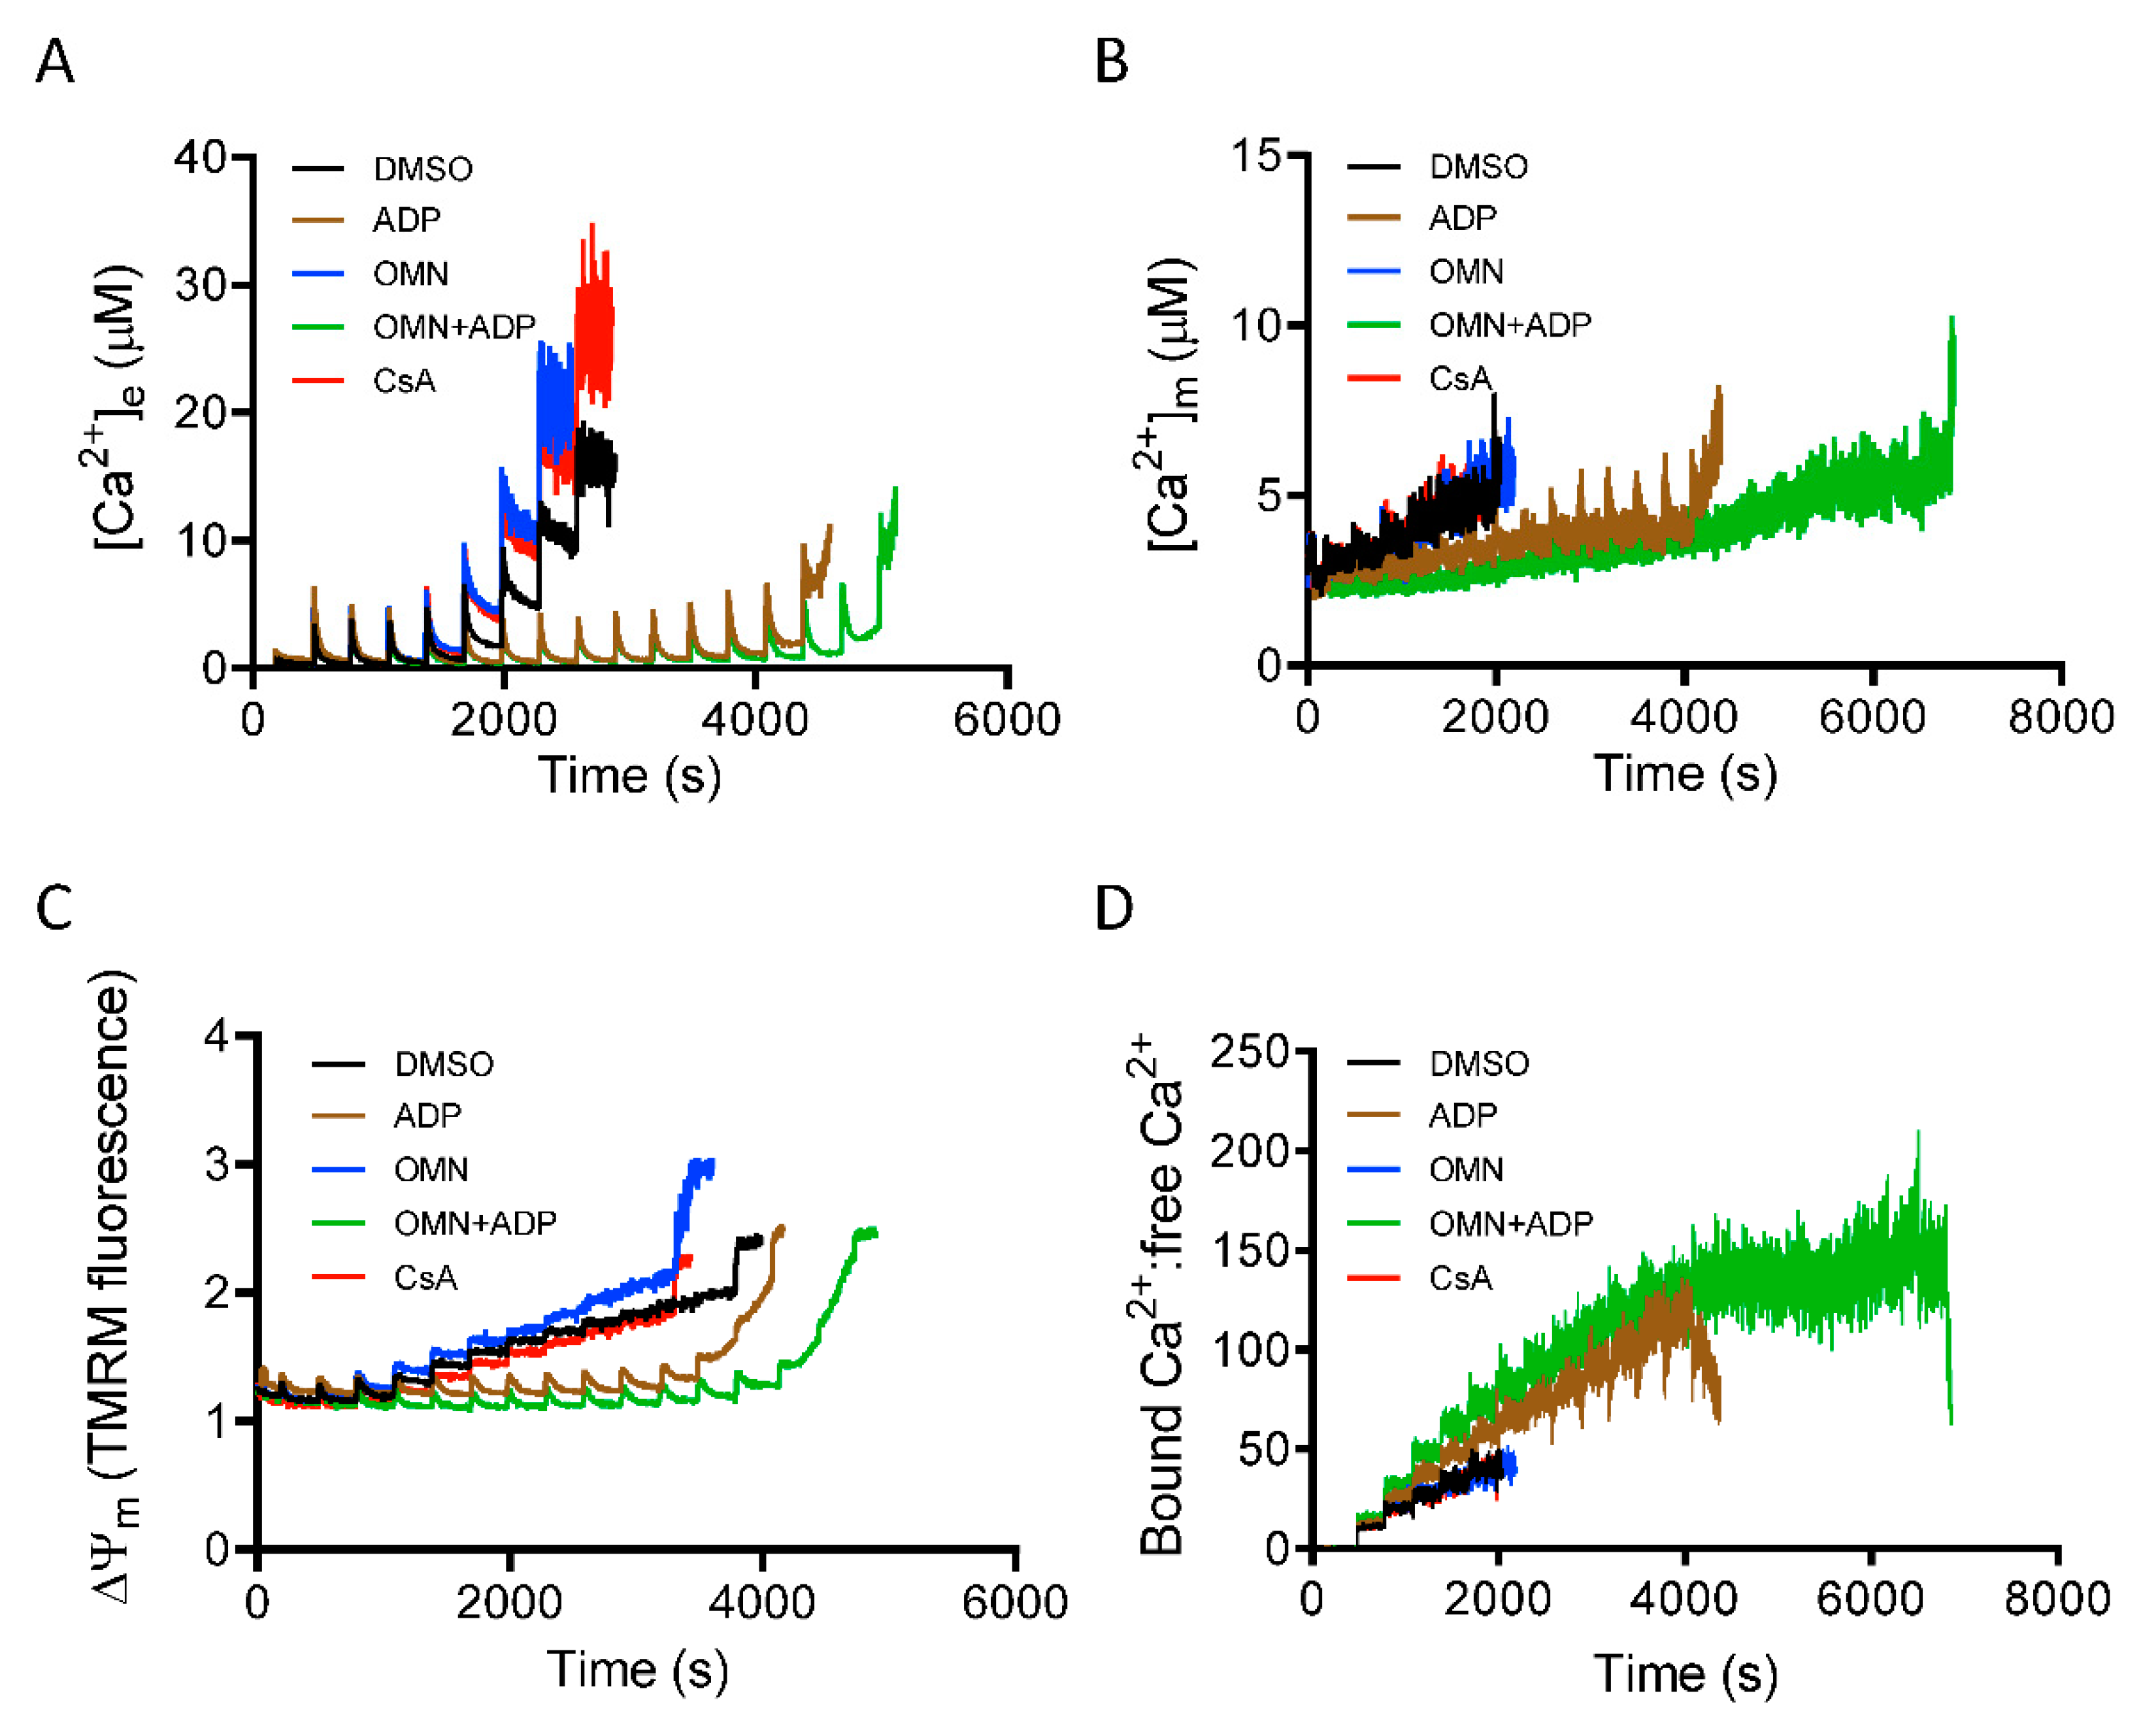
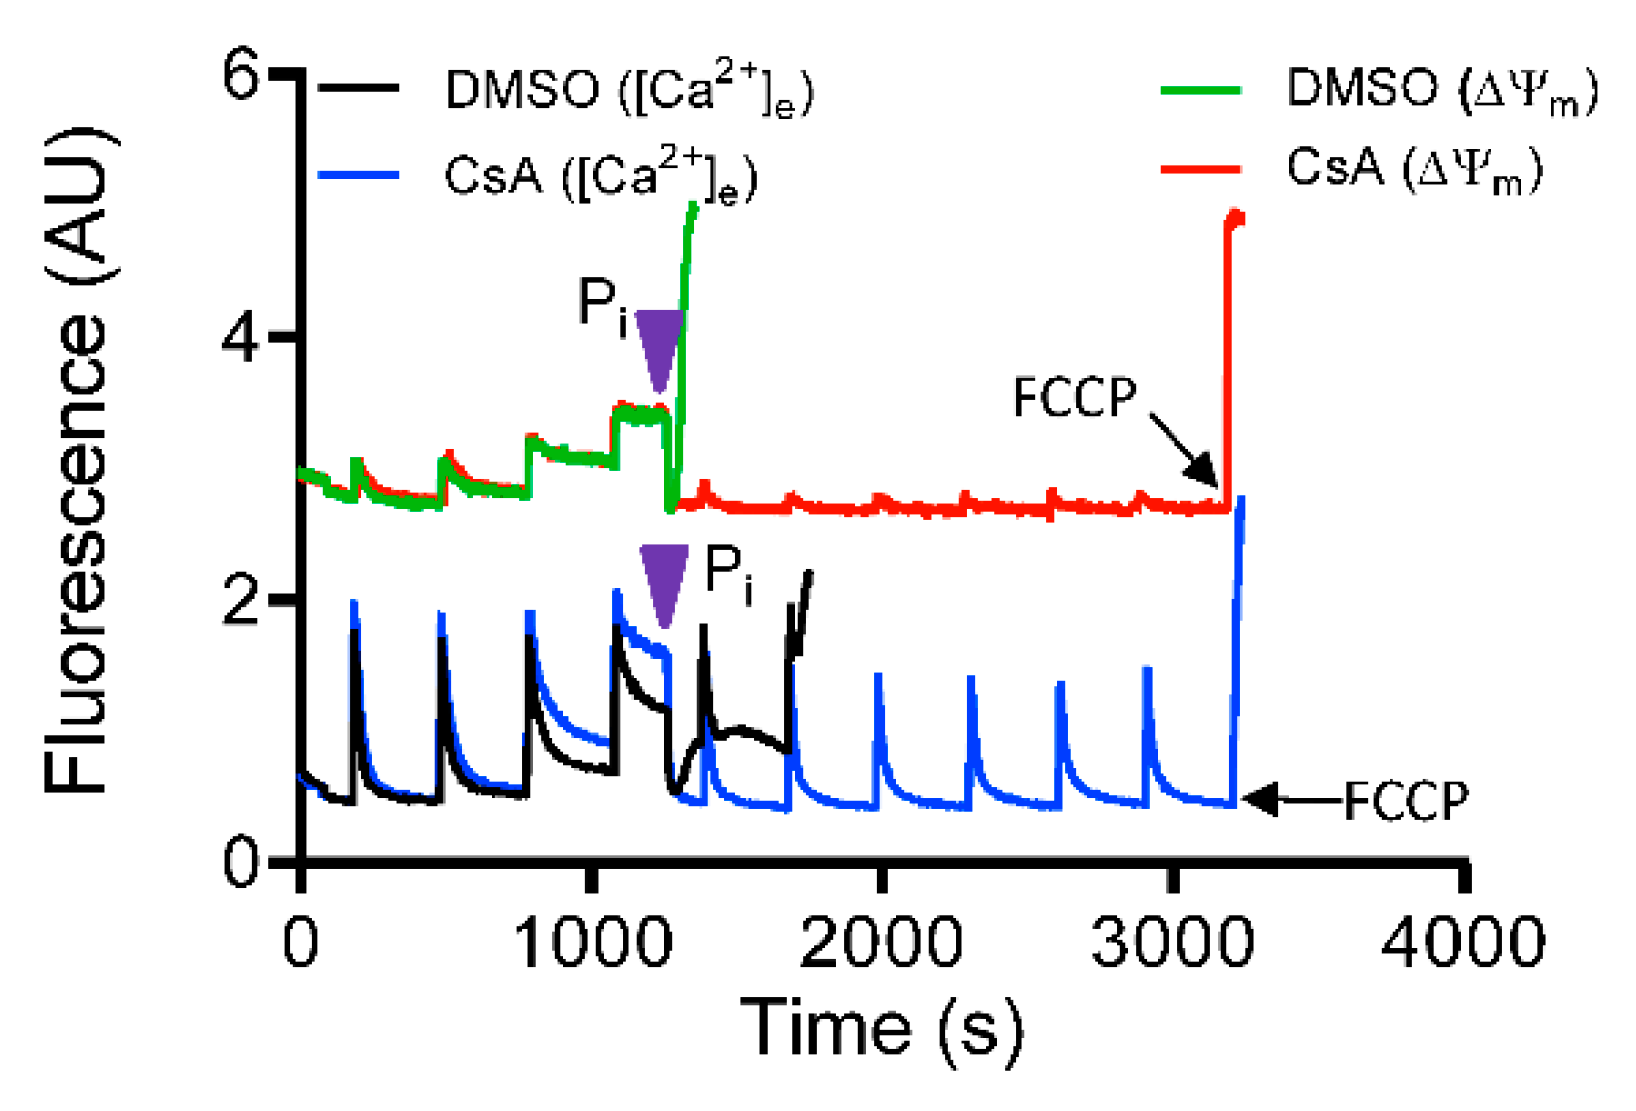
Inorganic phosphate (Pi) is a required component for mitochondrial matrix Ca2+ buffering [14,29]. To gain insight into the mechanism that underlies CsA-mediated activation of the MCBS, we monitored mitochondrial Ca2+ handling and ΔΨm during repeated boluses of 20 µM CaCl2 every 5 min, as described in Materials and Methods, but now in the absence of Pi. With mitochondria depleted of Pi, and in Pi-free media, the CRC of mitochondria treated with CsA before the CaCl2 pulses was not different from DMSO (control). In addition, these mitochondria showed a gradual increase in ss[Ca2+]e and interestingly, after cumulative additions of CaCl2 to 80 ± 15 µM, there was a significant decrease in mitochondrial Ca2+ uptake during additional CaCl2 pulses (Figure 7A). These results implicated a Pi-dependent mechanism in the CsA-mediated delay in mPTP opening. In contrast, ADP and OMN+ADP, but not OMN alone, caused a significant delay in mPTP opening (Figure 7A) in the absence of Pi.
Along with observing the Pi-mediated effect of CsA on [Ca2+]e dynamics, we also measured [Ca2+]m under identical conditions. In the absence of Pi, mitochondria showed a gradual increase in ss[Ca2+]m; matrix Ca2+ sequestration was strongly blunted in both DMSO-and CsA-treated groups. This reflected diminished buffering capacity with the increase in [Ca2+]m (Figure 7B). However, in the presence of ADP and OMN+ADP in the Pi-depleted condition, mitochondria displayed robust CRC and enhanced Ca2+ buffering and thus decreased [Ca2+]m (Figure 7B). Intriguingly, this effect was stronger than in the Pi replete condition (Figure 3). Mitochondria also showed an increased ratio of bound Ca2+:free Ca2+ in the OMN+ADP-treated group, but not in the DMSO and CsA groups (Figure 7D). These data further support the premise that Pi is crucial in CsA-induced matrix Ca2+ buffering and Pi is a requisite component of matrix calcium sequestration.
Since we observed significant attenuation of Ca2+ uptake and buffering by CsA in the absence of Pi, we addressed how the altered mitochondrial Ca2+ dynamics impacted ΔΨm. Analysis of ΔΨm in mitochondria depleted of Pi during CaCl2 bolus challenges revealed a gradual depolarization with each Ca2+ pulse over time in the DMSO-, OMN-, and CsA-treated groups (Figure 7C); this was consistent with the low CRC in these three groups due to the poor buffering after additional CaCl2 pulses. In contrast, mitochondria exposed to ADP or OMN+ADP in the Pi-depleted state exhibited restored and sustained ΔΨm, which supported a robust CRC (Figure 7C).
To further confirm the requisite role of Pi in mediating CsA-induced activation of the MCBS, a rescue experiment with 5 mM Pi was performed with DMSO-and CsA-treated groups in Pi-depleted condition. With addition of deionized H2O (vehicle), pore opening was not prevented in either group (data not shown). The addition of exogenous Pi to the buffer triggered a rapid reversal of Ca2+ release (decrease in ([Ca2+]e) in parallel with complete restoration of ΔΨm (Figure 8). In contrast, additional Ca2+ pulses in the Pi free DMSO-treated group failed to maintain ss[Ca2+]e and basal Ψm, and induced rapid Ca2+ efflux (Figure 8). However, the CsA-treated mitochondria showed a robust uptake of [Ca2+]e with low ss[Ca2+]e and sustained ΔΨm maintenance with additional CaCl2 boluses (Figure 8). Taken together, these results establish that Pi is required for CsA-mediated mitochondrial Ca2+ buffering that maintains low [Ca2+]m and preserves ΔΨm; this in turn contributes to the capacity for more Ca2+ uptake and thus increases the Ca2+ threshold for mPTP opening.

4. Discussion

Matrix free [Ca2+] ([Ca2+]m) plays two important roles: (i) Activation of Ca2+-dependent dehydrogenases for oxidative phosphorylation at low concentrations [46]; and (ii) regulation of cytosolic Ca2+ by sequestration of excess Ca2+ at high concentrations [47]. Excessive accumulation of free [Ca2+]m is a leading factor in inducing mPTP opening. It is well established that repetitive mitochondrial Ca2+ loading triggers a gradual increase in [Ca2+]m, leading to a loss of IMM integrity that results in dissipation of ΔΨm and release of Ca2+. CsA is known to delay pore opening, in part, by inhibiting the PPIase activity of Cyp-D [31]. Whether CsA-mediated delay in mPTP opening involves regulation of [Ca2+]m by Pi-induced matrix Ca2+ buffering has not been addressed before. In this study, we investigated the effects of CsA on [Ca2+]m regulation during repeated Ca2+ loading and its functional significance in mPTP opening. Additionally, we determined if changes in [Ca2+]m induced by CsA correlated with changes in mitochondrial bioenergetics under identical experimental conditions and if matrix Pi was required for the observed CsA effects.
Since the key postulate was that CsA contributes to mitochondrial Ca2+ buffering, all experiments were performed in Na+-free condition to completely block NCLX as a route for efflux of excess matrix Ca2+. This allowed us to directly assess mitochondrial Ca2+ buffering capacity under different treatments. Our major findings during repetitive CaCl2 bolus challenges are: (i) CsA maintained basal ss[Ca2+]m owing to increased mitochondrial Ca2+ buffering capacity; (ii) the effectiveness of CsA to maintain basal ss[Ca2+]m correlates well with preserved mitochondrial bioenergetics; (iii) the buffering effect of CsA in a Pi-replete buffer was more pronounced than the known buffering effect of OMN+ADP; (iv) CsA-induced buffering was abolished in Pi-depleted mitochondria and Pi-free experimental medium. We conclude that the CsA-mediated delay in mPTP opening could, in large part, be attributed to CsA-induced activation of a Pi-dependent mitochondrial Ca2+ buffering system (MCBS), which maintains a low free [Ca2+]m and preserves mitochondrial bioenergetics.

4.1. CsA-Mediated Inhibition of mPTP Opening Relates to the ss[Ca2+]m

Using the two protocols (Figure 1A,B), we examined the changes in [Ca2+]e and [Ca2+]m in response to boluses of CaCl2 in the presence of vehicle (DMSO), CsA, ADP, OMN, or OMN+ADP over time. Our experimental approaches allowed us to define the contribution of CsA in the regulation of [Ca2+]m when CsA was given before the CaCl2 boluses (Protocol A) and at the threshold for pore opening under condition of increased free [Ca2+]m accumulation (Protocol B). Our results clearly indicate that the effect of CsA on delaying mPTP opening is due largely to its efficacy in maintaining free ss[Ca2+]m by activating the MCBS in a Pi-dependent manner, and thereby preclude early mitochondrial Ca2+ overload and delay induction of mPTP opening. Sustained low ss[Ca2+]e in the CsA-treated group indicated increasing mitochondrial Ca2+ uptake driven by the enhanced sequestration of free [Ca2+]m to maintain a transmembrane Ca2+ gradient and a charged ΔΨm that facilitated additional Ca2+ uptake (Figure 2). Unlike previous studies [14,33,34], NCLX was blocked under our experimental conditions, to prevent Ca2+ efflux during the repetitive CaCl2 additions; therefore, the net free ss[Ca2+]m in our study was determined by the balance between Ca2+ uptake and Ca2+ sequestration.
Notably, the CsA-induced buffering of mitochondrial Ca2+ resulted in greater Ca2+ uptake to attain a steady-state, as shown by the gradual decrease in ss[Ca2+]m with each added CaCl2 pulse (Figure 3). Insofar as Ca2+–Pi precipitation is a major mechanism for mitochondrial Ca2+ buffering, the sustained ss[Ca2+]m after each CaCl2 bolus indicated matrix Ca2+ storage, likely in the form of various inorganic Ca–Pi complexes [14]. The low and maintained ss[Ca2+]m during continuous matrix Ca2+ uptake is consistent with formation of these complexes. Although our study did not provide direct experimental evidence for CsA-induced matrix Ca–Pi complex formation, the continuous rise in estimated bound Ca2+:free Ca2+ ratio with each CaCl2 bolus as well as the ten-fold increase in mβCa clearly reflects a CsA effect on [Ca2+]m buffering capacity (Figure 3).
The protective effect of CsA in delaying mPTP opening has long been reported [28,31,32]. Our findings; however, provide the first direct evidence for a novel effect of CsA to enhance the capacity of mitochondria to sequester Ca2+ by which it obviates Ca2+-induced mPTP formation. Moreover, the effect of CsA in mediating greater matrix Ca2+ buffering explains the sustained free [Ca2+]m reported by Chalmers and Nicholls [14] and the CsA-induced inhibition of mitochondrial Ca2+ efflux observed in other prior studies [33,34].

4.2. Underlying Mechanism of the CsA-Mediated [Ca2+]m Regulation

It is well established that mitochondria are able to sequester large amounts of Ca2+, while maintaining free [Ca2+]m over a range of 0.1 and 10 μM depending on the Ca2+ load [14]; however, the mechanism and kinetics for this are unclear. Matrix Ca2+ buffering capacity is determined by: i) The quantity of Ca2+ that can be retained, and ii) the Ca2+ threshold level for release when Ca2+ exchangers are blocked or maximally operated [48]. The role of Pi as a physiological buffer in regulation of [Ca2+]m has been extensively studied [14,44,45,49]. The major mechanism of Pi-mediated Ca2+ sequestration in mitochondria is believed to be achieved by formation of amorphous Ca2+–Pi complexes in the matrix [48,50,51], which in turn maintain the free [Ca2+]m at a low level. Hence, sustained [Ca2+]m cyclically promotes more Ca2+ uptake via the MCU due to better preservation of both the Ca2+ gradient and ΔΨm.
Though Pi plays an essential role in matrix Ca2+ buffering, Pi has also been suggested to induce mPTP opening [52]. A recent study associated Ca2+–Pi precipitation with complex I inhibition and reduced ATP synthase rate during Ca2+ overload [53]. Another report demonstrated that increasing [Pi] decreased the mitochondrial Ca2+ loading capacity [14]. It was suggested that the mPTP-sensitizing effects of Pi was likely due to its effect in decreasing matrix-free Mg2+, an mPTP inhibitor [20]. In addition, formation of polyphosphate, a known inducer of mPTP, could be a factor in regulating the Ca2+ threshold for mPTP activation [54,55]. Interestingly, two prior studies [56,57] indicated that Pi is necessary for the inhibitory effect of CsA on mPTP opening. However, two other studies reported that CsA inhibits mPTP opening even in the absence of Pi [58,59]. Conversely, in our study, the CsA-induced enhancement of matrix Ca2+ buffering was completely annulled when both mitochondria and the experimental medium were depleted of Pi (Figure 7). This loss of Ca2+ sequestration by CsA was reinstated when exogenous Pi was added just before activation of the mPTP (Figure 8). These observations provide the essential explanation for the requirement of Pi in the CsA-mediated MCBS and delay in mPTP opening.
The importance of mitochondrial matrix Ca2+ buffering via Pi is underscored by the studies of Wei et al. [44,45]. They reported that Pi modulates the total amount of Ca2+ uptake with smaller CaCl2 boluses, whereas Pi modulates Ca2+ buffering capacity with larger CaCl2 boluses. Since we had Pi in our experimental medium and the mitochondria were replete with exogenous Pi, the observation that CsA induced low ss[Ca2+]e and ss[Ca2+]m could be explained by the following: (i) CsA activates Pi-dependent matrix Ca2+ buffering potentially by maintaining the rate of Ca2+–Pi complex formation; and (ii) CsA may activate Pi transport processes (via H+/Pi transporter and/or phosphate carrier) that help to maintain both the IMM pHm and ΔΨm gradients. These processes would limit the increase in free [Ca2+]m, which in turn would contribute to more Ca2+ uptake and retention by increasing the electrochemical driving force for Ca2+ influx.

4.3. CsA vs. ADP; As a Regulator of [Ca2+]m

AdN are implicated as one of the multiple matrix factors responsible for sequestering Ca2+ by mitochondria [29,60,61,62]. AdN can potentiate mitochondrial Ca2+ buffering by maintaining high matrix Pi concentrations that can facilitate precipitation of AdN-Ca–Pi complexes, including, ATP-Mg2−/Pi2− and HADP2−/Pi2−, and thereby increase the Ca2+ threshold for mPTP opening [60,63]. In a study by Carafoli et al. [60], it was reported that mitochondrial Ca2+-buffering is proportional to mitochondrial ADP uptake. In our Pi-replete study, OMN+ADP had a relatively small effect on Ca2+ buffering compared to CsA, but it had a significantly larger effect than ADP or OMN alone (Figure 2, Figure 3 and Figure 5). A reasonable explanation could be that OMN, an ATP synthase (Complex V) inhibitor [64], could contribute towards augmenting the AdN pool and thus enhance matrix Ca2+ buffering. Consistent with our findings, a previous study also showed a greater CRC with a low-concentration of ADP with OMN compared to 10-fold larger concentration of ADP alone [30]. Thus, in agreement with Sokolova et al. [30], the observed high buffering capacity and expanded CRC with OMN+ADP is largely attributed to the ADP component of the matrix AdN pool. However, a previous study [62] reported that AdN also prevent mitochondrial Ca2+ influx by directly chelating Ca2+ by a Ca–ATP complexation [61]. Contrary to this observation, in our study, the direct effect of ADP on binding free Ca2+ was negligible, as assessed by adding ADP and CaCl2 together in mitochondria-free experimental buffer (Figure S4). Additionally, carboxyatractyloside-mediated inhibition of ADP uptake via adenine nucleotide translocase precluded matrix Ca2+ buffering and blunted the CRC by OMN+ADP or ADP alone (Figure S5). In this case, the extra-matrix ADP that accumulated did not chelate the Ca2+ added to the buffer. Altogether, these observations indicate that a direct sequestration of Ca2+ outside the mitochondria does not explain the effect of ADP alone or OMN+ADP on the enhanced CRC in our study.
A previous study [42] from our group proposed that the MCBS relies on at least two classes of Ca2+ buffers. The first class could represent classical Ca2+ buffers, including mostly metabolites (ATP, ADP, and Pi) and mobile proteins that bind a single Ca2+ ion at a single binding site. A second class of buffers could be associated with the formation of amorphous Ca2+ phosphates, which may be capable of binding multiple Ca2+ ions at a single site in a cooperative fashion [35,38,39,42]. Genge et al. [65] showed, in an in vitro study, that annexins, a diverse class of proteins, are required for Ca2+-phosphate nucleation. Additionally, many studies have suggested an AdN-dependent Ca2+-binding property of annexins [66]. Interestingly, mitochondria exposed to ADP alone or OMN+ADP retained their ability to maintain low ss[Ca2+]e and ss[Ca2+]m for an extended period of cumulative CaCl2 additions, and showed a higher Ca2+ threshold for mPTP opening without Pi compared to with Pi (Figure 7). This extended delay in mPTP opening in the Pi-depleted state compared to the Pi-replete state reflects the ability of Pi to induce early mPTP opening under certain conditions [52]. In this case, the presence of Pi appears to counteract the ADP delay effect and induce a much earlier pore opening compared to the Pi-depleted state. The mechanisms for this AdN-mediated massive matrix Ca2+ loading capacity in the absence of exogenous Pi is unclear and needs to be further investigated. A plausible hypothesis could be that, in the absence of Pi, a significant Ca2+ loading capacity of AdN might be mediated via direct interaction with annexins. CsA, on the other hand, might function as a mediator that activates a Pi-dependent Ca2+ buffering system. Another possibility is that Cyp D, as a PPIase, reduces free phosphate levels in the matrix or blocks the Ca2+ binding property of annexins; this then would be relieved by CsA’s effect to block Cyp D.

4.4. Implication of CsA-Mediated Ca2+ Buffering on Mitochondrial Bioenergetics

Elevated [Ca2+]m over the nanomolar range is reported to increase NADH generation in part by stimulating Ca2+-sensitive dehydrogenases of the TCA cycle [67,68] and activating the F0F1-ATP synthase [69], thereby accelerating oxidative phosphorylation (OXPHOS). However, excess mitochondrial free Ca2+ can dissipate ΔΨm and impede OXPHOS. The IMM ΔΨm is the key factor in generating the proton motive force across the IMM; it is also one of the primary driving forces for Ca2+ uptake via the MCU [70] and triggers Ca2+ efflux via the NCLX [71,72]. Therefore, if mitochondria continue to take up Ca2+ under increased extra-matrix Ca2+ exposure, the Ca2+ would have to be buffered or ejected to prevent excess free [Ca2+]m accumulation that could dissipate ΔΨm and increase oxidation of NADH.
The stability of Ca2+–Pi precipitates inside the mitochondrial matrix largely depends on pHm [50]. It is also proposed that the matrix [Pi] depends on the pH gradient (e.g., a change in pH from 7 to 8 has been estimated to increase [Pi] by a factor of 1000 [14,50]). Thus, matrix alkaline conditions could facilitate Ca2+–Pi precipitation, whereas matrix acidification could lead to a destabilization of the Ca2+–Pi precipitate and so enhance matrix free Ca2+ levels [14]. Consequently, we correlated the changes in [Ca2+]m with indices of mitochondrial bioenergetics (ΔΨm, NADH, and pH) (Figure 5) to have a better understanding of the CsA-mediated MCBS. Mitochondria exposed to CsA before the repetitive CaCl2 boluses, exhibited robust mitochondrial Ca2+ uptake and rapid [Ca2+]m buffering while maintaining basal ΔΨm, NADH, and an alkalinized pHm until mPTP opened (Figure 5). Maintaining ΔΨm during excess Ca2+ uptake in the absence of functioning NCLX suggests a strong matrix buffering effect that is induced by CsA.
In Protocol B, when CsA was added just before the onset of pore opening, NADH and ΔΨm levels transiently increased but immediately returned to baseline with each added CaCl2 bolus. This transient depolarization and NADH oxidation with each addition of CaCl2 was not observed in Protocol A. The reason for this is unclear. Nonetheless, the observed transient oxidation of NADH helped to restore ΔΨm after Ca2+ induced transient depolarization before the next CaCl2 bolus (Figure 5D,E). The transient redox oxidation and ΔΨm depolarization suggest that the CsA added at the point just before mPTP opening activated MCBS more slowly compared to Protocol A. In addition, CsA maintained the pHm gradient during prolonged Ca2+ pulse challenges (Figure 5C). This finding also likely excludes a contribution of the mitochondrial calcium–hydrogen exchange (mCHE) to the Ca2+ extrusion in the absence of NaCl. We have recently reported that CsA obviates mCHE activity at low extra-matrix pH [19]. However, based on our current results, it is likely that CsA triggered an enhancement of mitochondrial Ca2+ buffering so that the resulting low [Ca2+]m and maintained ΔΨm and pHm accounted for the inactivity of mCHE.

5. Conclusions

The salient observation of this study is that CsA mitigated mPTP opening by promoting the maintenance of a low [Ca2+]m, by stimulating and/or potentiating MCBS. Specifically, we showed that the presence of CsA, (i) significantly delayed the mPTP opening when compared to ADP or OMN+ADP (Protocol A); (ii) overturned the high amplitude increase in [Ca2+]m (Protocol B); (iii) maintained pHm, redox state (NADH) and basal ΔΨm, which maintains the driving force for more Ca2+ uptake and sequestration; and (iv) activates Pi-dependent mitochondrial Ca2+ sequestration to delay mPTP opening.
Our study provides a novel insight into how CsA-mediates a delay in mPTP opening by activating the MCBS, which lowers ss[Ca2+]m below the threshold for mPTP activation. This concept is shown in the scheme presented in Figure 9. Our finding supports the notion that CsA facilitates Pi-dependent matrix Ca2+ buffering, which maintains matrix free Ca2+ and enables massive Ca2+ loading capacity, without diminishing the driving force for Ca2+ influx by maintaining ΔΨm. CsA may delay mPTP opening by enhancing Pi-dependent matrix Ca2+ buffering and by inhibiting Cyp D [31,32]. The culmination of these two mechanisms, and possibly others not yet identified, might be responsible for CsA protection against mitochondrial Ca2+ overload. Together, these findings add to our understanding of the mechanism of CsA-mediated modulation of mPTP. Importantly, we believe that therapeutic approaches targeted at regulating [Ca2+]m homeostasis represent a promising strategy to reduce cardiac injury due to Ca2+ overload by delaying mPTP opening and preventing induction of apoptosis.

Supplementary Materials

The following are available online at https://www.mdpi.com/2073-4409/8/9/1052/s1. Figure S1: Quantification of calcium retention capacity (CRC) for each treatment, DMSO (control), ADP, oligomycin (OMN), OMN+ADP, and CsA during Protocol A (A) and Protocol B (B). Figure S2: Average Ca2+ added before mPTP opening, ΔΨm collapse, NADH oxidation, and matrix acidification. Figure S3: Trend-fits for calculation of buffering rate. Figure S4: Fura-4F ratio representing the change in [Ca2+]e before and after adding a 20 µM CaCl2 bolus in the absence or presence of 250 µM ADP in the mitochondria-free experimental buffer. Figure S5: Representative raw traces of extra-matrix Ca2+ fluorescence (Fura-4F ratio) and Ca2+ uptake in mitochondria pretreated with 0.5% DMSO (control), OMN+ADP, and CATR (carboxyatractyloside)+OMN+ADP prior to mPTP opening.

Author Contributions

J.M. and A.K.S.C., conceptualized and designed the experiments; J.M. and A.J.D., performed experiments; J.M., A.J.D. and G.K.N., analyzed data; J.M., W.-M.K., D.F.S. and A.K.S.C., interpreted results; J.M. and A.K.S.C., drafted the manuscript and figures; J.M., G.K.N., W.-M.K., D.F.S. and A.K.S.C., critically read/edited the manuscript. All authors have read and approved the manuscript.

Funding

This project was supported by the Veterans Administration (Merit Review BX-002539-01).

Acknowledgments

The authors are thankful to James S. Heisner for technical assistance.

Conflicts of Interest

The authors declare no conflicts of interest.

References

  1. Denton, R.M.; McCormack, J.G. The calcium sensitive dehydrogenases of vertebrate mitochondria. Cell Calcium 1986, 7, 377–386. [Google Scholar] [CrossRef]
  2. Jouaville, L.S.; Pinton, P.; Bastianutto, C.; Rutter, G.A.; Rizzuto, R. Regulation of mitochondrial ATP synthesis by calcium: Evidence for a long-term metabolic priming. Proc. Natl. Acad. Sci. USA 1999, 96, 13807–13812. [Google Scholar] [CrossRef] [PubMed] [Green Version]
  3. Bernardi, P. Mitochondrial transport of cations: Channels, exchangers, and permeability transition. Physiol. Rev. 1999, 79, 1127–1155. [Google Scholar] [CrossRef] [PubMed]
  4. Hajnoczky, G.; Csordas, G.; Das, S.; Garcia-Perez, C.; Saotome, M.; Sinha Roy, S.; Yi, M. Mitochondrial calcium signalling and cell death: Approaches for assessing the role of mitochondrial Ca2+ uptake in apoptosis. Cell Calcium 2006, 40, 553–560. [Google Scholar] [CrossRef] [PubMed] [Green Version]
  5. Brookes, P.S.; Yoon, Y.; Robotham, J.L.; Anders, M.W.; Sheu, S.S. Calcium, ATP, and ROS: A mitochondrial love-hate triangle. Am. J. Physiol. Cell Physiol. 2004, 287, C817–C833. [Google Scholar] [CrossRef] [PubMed]
  6. O’Rourke, B.; Cortassa, S.; Aon, M.A. Mitochondrial ion channels: Gatekeepers of life and death. Physiology (Bethesda) 2005, 20, 303–315. [Google Scholar] [CrossRef]
  7. Camara, A.K.; Lesnefsky, E.J.; Stowe, D.F. Potential therapeutic benefits of strategies directed to mitochondria. Antioxid. Redox Signal. 2010, 13, 279–347. [Google Scholar] [CrossRef]
  8. Gunter, T.E.; Buntinas, L.; Sparagna, G.; Eliseev, R.; Gunter, K. Mitochondrial calcium transport: Mechanisms and functions. Cell Calcium 2000, 28, 285–296. [Google Scholar] [CrossRef]
  9. Baughman, J.M.; Perocchi, F.; Girgis, H.S.; Plovanich, M.; Belcher-Timme, C.A.; Sancak, Y.; Bao, X.R.; Strittmatter, L.; Goldberger, O.; Bogorad, R.L.; et al. Integrative genomics identifies MCU as an essential component of the mitochondrial calcium uniporter. Nature 2011, 476, 341–345. [Google Scholar] [CrossRef] [Green Version]
  10. De Stefani, D.; Raffaello, A.; Teardo, E.; Szabo, I.; Rizzuto, R. A forty-kilodalton protein of the inner membrane is the mitochondrial calcium uniporter. Nature 2011, 476, 336–340. [Google Scholar] [CrossRef]
  11. Mitchell, P. Coupling of phosphorylation to electron and hydrogen transfer by a chemi-osmotic type of mechanism. Nature 1961, 191, 144–148. [Google Scholar] [CrossRef] [PubMed]
  12. Mitchell, P. Keilin’s respiratory chain concept and its chemiosmotic consequences. Science 1979, 206, 1148–1159. [Google Scholar] [CrossRef] [PubMed]
  13. Greenawalt, J.W.; Rossi, C.S.; Lehninger, A.L. Effect of Active Accumulation of Calcium and Phosphate Ions on the Structure of Rat Liver Mitochondria. J. Cell Biol. 1964, 23, 21–38. [Google Scholar] [CrossRef] [PubMed]
  14. Chalmers, S.; Nicholls, D.G. The relationship between free and total calcium concentrations in the matrix of liver and brain mitochondria. J. Biol. Chem. 2003, 278, 19062–19070. [Google Scholar] [CrossRef] [PubMed]
  15. Starkov, A.A. The molecular identity of the mitochondrial Ca2+ sequestration system. FEBS J. 2010, 277, 3652–3663. [Google Scholar] [CrossRef] [Green Version]
  16. Carafoli, E.; Tiozzo, R.; Lugli, G.; Crovetti, F.; Kratzing, C. The release of calcium from heart mitochondria by sodium. J. Mol. Cell. Cardiol. 1974, 6, 361–371. [Google Scholar] [CrossRef]
  17. Palty, R.; Silverman, W.F.; Hershfinkel, M.; Caporale, T.; Sensi, S.L.; Parnis, J.; Nolte, C.; Fishman, D.; Shoshan-Barmatz, V.; Herrmann, S.; et al. NCLX is an essential component of mitochondrial Na+/Ca2+ exchange. Proc. Natl. Acad. Sci. USA 2010, 107, 436–441. [Google Scholar] [CrossRef]
  18. Boyman, L.; Williams, G.S.; Khananshvili, D.; Sekler, I.; Lederer, W.J. NCLX: The mitochondrial sodium calcium exchanger. J. Mol. Cell. Cardiol. 2013, 59, 205–213. [Google Scholar] [CrossRef] [Green Version]
  19. Haumann, J.; Camara, A.K.S.; Gadicherla, A.K.; Navarro, C.D.; Boelens, A.D.; Blomeyer, C.A.; Dash, R.K.; Boswell, M.R.; Kwok, W.M.; Stowe, D.F. Slow Ca(2+) Efflux by Ca(2+)/H(+) Exchange in Cardiac Mitochondria Is Modulated by Ca(2+) Re-uptake via MCU, Extra-Mitochondrial pH, and H(+) Pumping by FOF1-ATPase. Front. Physiol. 2018, 9, 1914. [Google Scholar] [CrossRef]
  20. Bernardi, P.; Vassanelli, S.; Veronese, P.; Colonna, R.; Szabo, I.; Zoratti, M. Modulation of the mitochondrial permeability transition pore. Effect of protons and divalent cations. J. Biol. Chem. 1992, 267, 2934–2939. [Google Scholar]
  21. Szabo, I.; Zoratti, M. The mitochondrial megachannel is the permeability transition pore. J. Bioenerg. Biomembr. 1992, 24, 111–117. [Google Scholar] [CrossRef] [PubMed]
  22. Crompton, M. The mitochondrial permeability transition pore and its role in cell death. Biochem. J. 1999, 341 Pt 2, 233–249. [Google Scholar] [CrossRef] [PubMed]
  23. Kim, J.S.; He, L.; Lemasters, J.J. Mitochondrial permeability transition: A common pathway to necrosis and apoptosis. Biochem. Biophys. Res. Commun. 2003, 304, 463–470. [Google Scholar] [CrossRef]
  24. Nakagawa, T.; Shimizu, S.; Watanabe, T.; Yamaguchi, O.; Otsu, K.; Yamagata, H.; Inohara, H.; Kubo, T.; Tsujimoto, Y. Cyclophilin D-dependent mitochondrial permeability transition regulates some necrotic but not apoptotic cell death. Nature 2005, 434, 652–658. [Google Scholar] [CrossRef] [PubMed]
  25. Basso, E.; Fante, L.; Fowlkes, J.; Petronilli, V.; Forte, M.A.; Bernardi, P. Properties of the permeability transition pore in mitochondria devoid of Cyclophilin, D. J. Biol. Chem. 2005, 280, 18558–18561. [Google Scholar] [CrossRef] [PubMed]
  26. Baines, C.P.; Kaiser, R.A.; Purcell, N.H.; Blair, N.S.; Osinska, H.; Hambleton, M.A.; Brunskill, E.W.; Sayen, M.R.; Gottlieb, R.A.; Dorn, G.W.; et al. Loss of cyclophilin D reveals a critical role for mitochondrial permeability transition in cell death. Nature 2005, 434, 658–662. [Google Scholar] [CrossRef]
  27. Hunter, D.R.; Haworth, R.A. The Ca2+-induced membrane transition in mitochondria. I. The protective mechanisms. Arch. Biochem. Biophys. 1979, 195, 453–459. [Google Scholar] [CrossRef]
  28. Halestrap, A.P.; Connern, C.P.; Griffiths, E.J.; Kerr, P.M. Cyclosporin A binding to mitochondrial cyclophilin inhibits the permeability transition pore and protects hearts from ischaemia/reperfusion injury. Mol. Cell. Biochem. 1997, 174, 167–172. [Google Scholar] [CrossRef]
  29. Haumann, J.; Dash, R.K.; Stowe, D.F.; Boelens, A.D.; Beard, D.A.; Camara, A.K. Mitochondrial free [Ca2+] increases during ATP/ADP antiport and ADP phosphorylation: Exploration of mechanisms. Biophys. J. 2010, 99, 997–1006. [Google Scholar] [CrossRef]
  30. Sokolova, N.; Pan, S.; Provazza, S.; Beutner, G.; Vendelin, M.; Birkedal, R.; Sheu, S.S. ADP protects cardiac mitochondria under severe oxidative stress. PLoS ONE 2013, 8, e83214. [Google Scholar] [CrossRef]
  31. Griffiths, E.J.; Halestrap, A.P. Further evidence that cyclosporin A protects mitochondria from calcium overload by inhibiting a matrix peptidyl-prolyl cis-trans isomerase. Implications for the immunosuppressive and toxic effects of cyclosporin. Biochem. J. 1991, 274 Pt 2, 611–614. [Google Scholar] [CrossRef] [PubMed]
  32. Waldmeier, P.C.; Feldtrauer, J.J.; Qian, T.; Lemasters, J.J. Inhibition of the mitochondrial permeability transition by the nonimmunosuppressive cyclosporin derivative NIM811. Mol. Pharmacol. 2002, 62, 22–29. [Google Scholar] [CrossRef]
  33. Altschuld, R.A.; Hohl, C.M.; Castillo, L.C.; Garleb, A.A.; Starling, R.C.; Brierley, G.P. Cyclosporin inhibits mitochondrial calcium efflux in isolated adult rat ventricular cardiomyocytes. Am. J. Physiol. 1992, 262, H1699–H1704. [Google Scholar] [CrossRef]
  34. Wei, A.C.; Liu, T.; Cortassa, S.; Winslow, R.L.; O’Rourke, B. Mitochondrial Ca2+ influx and efflux rates in guinea pig cardiac mitochondria: Low and high affinity effects of cyclosporine A. Biochim. Biophys. Acta 2011, 1813, 1373–1381. [Google Scholar] [CrossRef] [PubMed]
  35. Blomeyer, C.A.; Bazil, J.N.; Stowe, D.F.; Pradhan, R.K.; Dash, R.K.; Camara, A.K. Dynamic buffering of mitochondrial Ca2+ during Ca2+ uptake and Na+-induced Ca2+ release. J. Bioenerg. Biomembr. 2013, 45, 189–202. [Google Scholar] [CrossRef] [PubMed]
  36. Aldakkak, M.; Stowe, D.F.; Dash, R.K.; Camara, A.K. Mitochondrial handling of excess Ca2+ is substrate-dependent with implications for reactive oxygen species generation. Free Radic. Biol. Med. 2013, 56, 193–203. [Google Scholar] [CrossRef] [PubMed]
  37. Agarwal, B.; Dash, R.K.; Stowe, D.F.; Bosnjak, Z.J.; Camara, A.K. Isoflurane modulates cardiac mitochondrial bioenergetics by selectively attenuating respiratory complexes. Biochim. Biophys. Acta 2014, 1837, 354–365. [Google Scholar] [CrossRef] [PubMed]
  38. Blomeyer, C.A.; Bazil, J.N.; Stowe, D.F.; Dash, R.K.; Camara, A.K. Mg(2+) differentially regulates two modes of mitochondrial Ca(2+) uptake in isolated cardiac mitochondria: Implications for mitochondrial Ca(2+) sequestration. J. Bioenerg. Biomembr. 2016, 48, 175–188. [Google Scholar] [CrossRef]
  39. Boelens, A.D.; Pradhan, R.K.; Blomeyer, C.A.; Camara, A.K.; Dash, R.K.; Stowe, D.F. Extra-matrix Mg2+ limits Ca2+ uptake and modulates Ca2+ uptake-independent respiration and redox state in cardiac isolated mitochondria. J. Bioenerg. Biomembr. 2013, 45, 203–218. [Google Scholar] [CrossRef]
  40. Scaduto, R.C., Jr.; Grotyohann, L.W. Measurement of mitochondrial membrane potential using fluorescent rhodamine derivatives. Biophys. J. 1999, 76, 469–477. [Google Scholar] [CrossRef]
  41. Grynkiewicz, G.; Poenie, M.; Tsien, R.Y. A new generation of Ca2+ indicators with greatly improved fluorescence properties. J. Biol. Chem. 1985, 260, 3440–3450. [Google Scholar] [PubMed]
  42. Bazil, J.N.; Blomeyer, C.A.; Pradhan, R.K.; Camara, A.K.; Dash, R.K. Modeling the calcium sequestration system in isolated guinea pig cardiac mitochondria. J. Bioenerg. Biomembr. 2013, 45, 177–188. [Google Scholar] [CrossRef] [PubMed]
  43. Zoccarato, F.; Nicholls, D. The role of phosphate in the regulation of the independent calcium-efflux pathway of liver mitochondria. Eur. J. Biochem. 1982, 127, 333–338. [Google Scholar] [CrossRef] [PubMed]
  44. Wei, A.C.; Liu, T.; O’Rourke, B. Dual Effect of Phosphate Transport on Mitochondrial Ca2+ Dynamics. J. Biol. Chem. 2015, 290, 16088–16098. [Google Scholar] [CrossRef] [PubMed] [Green Version]
  45. Wei, A.C.; Liu, T.; Winslow, R.L.; O’Rourke, B. Dynamics of matrix-free Ca2+ in cardiac mitochondria: Two components of Ca2+ uptake and role of phosphate buffering. J. Gen. Physiol. 2012, 139, 465–478. [Google Scholar] [CrossRef] [PubMed]
  46. Glancy, B.; Balaban, R.S. Role of mitochondrial Ca2+ in the regulation of cellular energetics. Biochemistry 2012, 51, 2959–2973. [Google Scholar] [CrossRef] [PubMed]
  47. Vasington, F.D.; Murphy, J.V. Ca ion uptake by rat kidney mitochondria and its dependence on respiration and phosphorylation. J. Biol. Chem. 1962, 237, 2670–2677. [Google Scholar] [PubMed]
  48. Chinopoulos, C.; Adam-Vizi, V. Mitochondrial Ca2+ sequestration and precipitation revisited. FEBS J. 2010, 277, 3637–3651. [Google Scholar] [CrossRef] [PubMed]
  49. Harris, E.J.; Zaba, B. The phosphate requirement for Ca2+-uptake by heart and liver mitochondria. FEBS Lett. 1977, 79, 284–290. [Google Scholar] [CrossRef]
  50. Nicholls, D.G.; Chalmers, S. The integration of mitochondrial calcium transport and storage. J. Bioenerg. Biomembr. 2004, 36, 277–281. [Google Scholar] [CrossRef]
  51. Kristian, T.; Pivovarova, N.B.; Fiskum, G.; Andrews, S.B. Calcium-induced precipitate formation in brain mitochondria: Composition, calcium capacity, and retention. J. Neurochem. 2007, 102, 1346–1356. [Google Scholar] [CrossRef]
  52. Kushnareva, Y.E.; Haley, L.M.; Sokolove, P.M. The role of low (<or = 1 mM) phosphate concentrations in regulation of mitochondrial permeability: Modulation of matrix free Ca2+ concentration. Arch. Biochem. Biophys. 1999, 363, 155–162. [Google Scholar] [CrossRef] [PubMed]
  53. Malyala, S.; Zhang, Y.; Strubbe, J.O.; Bazil, J.N. Calcium phosphate precipitation inhibits mitochondrial energy metabolism. PLoS Comput. Biol. 2019, 15, e1006719. [Google Scholar] [CrossRef] [PubMed]
  54. Abramov, A.Y.; Fraley, C.; Diao, C.T.; Winkfein, R.; Colicos, M.A.; Duchen, M.R.; French, R.J.; Pavlov, E. Targeted polyphosphatase expression alters mitochondrial metabolism and inhibits calcium-dependent cell death. Proc. Natl. Acad. Sci. USA 2007, 104, 18091–18096. [Google Scholar] [CrossRef] [Green Version]
  55. Seidlmayer, L.K.; Gomez-Garcia, M.R.; Blatter, L.A.; Pavlov, E.; Dedkova, E.N. Inorganic polyphosphate is a potent activator of the mitochondrial permeability transition pore in cardiac myocytes. J. Gen. Physiol. 2012, 139, 321–331. [Google Scholar] [CrossRef] [Green Version]
  56. Chavez, E.; Moreno-Sanchez, R.; Zazueta, C.; Rodriguez, J.S.; Bravo, C.; Reyes-Vivas, H. On the protection by inorganic phosphate of calcium-induced membrane permeability transition. J. Bioenerg. Biomembr. 1997, 29, 571–577. [Google Scholar] [CrossRef] [PubMed]
  57. Basso, E.; Petronilli, V.; Forte, M.A.; Bernardi, P. Phosphate is essential for inhibition of the mitochondrial permeability transition pore by cyclosporin A and by cyclophilin D ablation. J. Biol. Chem. 2008, 283, 26307–26311. [Google Scholar] [CrossRef] [PubMed]
  58. McGee, A.M.; Baines, C.P. Phosphate is not an absolute requirement for the inhibitory effects of cyclosporin A or cyclophilin D deletion on mitochondrial permeability transition. Biochem. J. 2012, 443, 185–191. [Google Scholar] [CrossRef] [Green Version]
  59. Varanyuwatana, P.; Halestrap, A.P. The roles of phosphate and the phosphate carrier in the mitochondrial permeability transition pore. Mitochondrion 2012, 12, 120–125. [Google Scholar] [CrossRef]
  60. Carafoli, E.; Rossi, C.S.; Lehninger, A.L. Uptake of Adenine Nucleotides by Respiring Mitochondria during Active Accumulation of Ca++ and Phosphate. J. Biol. Chem. 1965, 240, 2254–2261. [Google Scholar]
  61. Michailova, A.; McCulloch, A. Model study of ATP and ADP buffering, transport of Ca(2+) and Mg(2+), and regulation of ion pumps in ventricular myocyte. Biophys. J. 2001, 81, 614–629. [Google Scholar] [CrossRef]
  62. Litsky, M.L.; Pfeiffer, D.R. Regulation of the mitochondrial Ca2+ uniporter by external adenine nucleotides: The uniporter behaves like a gated channel which is regulated by nucleotides and divalent cations. Biochemistry 1997, 36, 7071–7080. [Google Scholar] [CrossRef] [PubMed]
  63. Traba, J.; Del Arco, A.; Duchen, M.R.; Szabadkai, G.; Satrustegui, J. SCaMC-1 promotes cancer cell survival by desensitizing mitochondrial permeability transition via ATP/ADP-mediated matrix Ca(2+) buffering. Cell Death Differ. 2012, 19, 650–660. [Google Scholar] [CrossRef] [PubMed]
  64. Devenish, R.J.; Prescott, M.; Boyle, G.M.; Nagley, P. The oligomycin axis of mitochondrial ATP synthase: OSCP and the proton channel. J. Bioenerg. Biomembr. 2000, 32, 507–515. [Google Scholar] [CrossRef] [PubMed]
  65. Genge, B.R.; Wu, L.N.; Wuthier, R.E. In vitro modeling of matrix vesicle nucleation: Synergistic stimulation of mineral formation by annexin A5 and phosphatidylserine. J. Biol. Chem. 2007, 282, 26035–26045. [Google Scholar] [CrossRef] [PubMed]
  66. Bandorowicz-Pikula, J.; Buchet, R.; Pikula, S. Annexins as nucleotide-binding proteins: Facts and speculations. Bioessays 2001, 23, 170–178. [Google Scholar] [CrossRef]
  67. McCormack, J.G.; Denton, R.M. Intracellular calcium ions and intramitochondrial Ca2+ in the regulation of energy metabolism in mammalian tissues. Proc. Nutr. Soc. 1990, 49, 57–75. [Google Scholar] [CrossRef] [PubMed]
  68. Rutter, G.A. Ca2(+)-binding to citrate cycle dehydrogenases. Int. J. Biochem. 1990, 22, 1081–1088. [Google Scholar] [CrossRef]
  69. Territo, P.R.; Mootha, V.K.; French, S.A.; Balaban, R.S. Ca(2+) activation of heart mitochondrial oxidative phosphorylation: Role of the F(0)/F(1)-ATPase. Am. J. Physiol. Cell Physiol. 2000, 278, C423–C435. [Google Scholar] [CrossRef] [PubMed]
  70. Chinopoulos, C.; Adam-Vizi, V. The ‘ins and outs’ of Ca2+ in mitochondria. FEBS J. 2010, 277, 3621. [Google Scholar] [CrossRef] [PubMed]
  71. Jung, D.W.; Baysal, K.; Brierley, G.P. The sodium-calcium antiport of heart mitochondria is not electroneutral. J. Biol. Chem. 1995, 270, 672–678. [Google Scholar] [CrossRef] [PubMed]
  72. Kim, B.; Matsuoka, S. Cytoplasmic Na+-dependent modulation of mitochondrial Ca2+ via electrogenic mitochondrial Na+-Ca2+ exchange. J. Physiol. 2008, 586, 1683–1697. [Google Scholar] [CrossRef] [PubMed]
Figure 1. Schema of experimental timeline used to study the effect of Cyclosporin A (CsA) and adenine nucleotide (AdN) on mitochondrial Ca2+ handling and bioenergetics during repeated CaCl2 pulses. (A) In Protocol A, at t = 0 s, mitochondria (mito, 0.5 mg) were added to the Na+-free experimental buffer solution. The mitochondrial suspension was exposed to 0.5 μM CsA, 250 μM ADP, 10 μM oligomycin (OMN), or a combination of OMN+ADP at t = 30 s. Pyruvic acid (PA, 0.5 mM), was added at t = 60 s to energize mitochondria (state 2). At t = 180 s, 20 μM of CaCl2 was added, followed by sequential additions of 20 µM CaCl2 at every 300 s intervals until mPTP (mitochondrial permeability transition pore) opened or no further Ca2+ uptake was observed. (B) In Protocol B, the mitochondrial suspension was exposed to similar treatments as in Protocol A, but given after the last consecutive CaCl2 bolus preceding the imminent onset of mPTP opening.
Cells 08 01052 g001
Figure 2. Effect of CsA and AdN on extra-mitochondrial calcium ([Ca2+]e) dynamics. Mitochondrial Ca2+ uptake and buffering for each of the treatment groups: DMSO (control; black trace), CsA (red trace), ADP (brown trace), OMN (blue trace), or OMN+ADP (green trace) are shown using the protocols depicted in Figure 1. Mitochondrial suspension was exposed to 0.5 μM CsA, 250 μM ADP, 10 μM OMN, or OMN+ADP before adding boluses of 20 μM CaCl2 (Protocol A; left column). Mitochondrial suspension was exposed to added boluses of CaCl2 (20 μM) and rescued mitochondria from mPTP opening (Protocol B; right column) with similar treatments as in Protocol A, at a time point at which it would initiate pore opening. Representative traces show change in extra-matrix free Ca2+ ([Ca2+]e) over time (A), and rescue of mitochondria from mPTP opening (D). Insets (A,D) show Ca2+ uptake kinetics in detail. Steady-state [Ca2+]e (ss[Ca2+]e), 270 s after initiation of Ca2+ uptake, plotted as function of added Ca2+ (20 µM) every 300 s, in delay of mPTP opening (B), and rescue of mitochondria from mPTP opening (E). Insets (B,E) indicate the time points at which ss[Ca2+]e was calculated. Quantification of steady-state [Ca2+]e after a cumulative of 80, 140, and 180 µM CaCl2 during delay of pore opening (C) and cumulative of 100, 120, and 140 µM CaCl2 during rescue of mitochondria from mPTP opening (F). Error bars represent mean ± SEM (* p < 0.05; ** p < 0.01; *** p < 0.005). Arrowhead indicates time of addition of DMSO, ADP, OMN, OMN+ADP, or CsA during Protocol B.
Cells 08 01052 g002
Figure 3. Effect of CsA and AdN on intra-matrix free Ca2+ ([Ca2+]m) dynamics. Mitochondrial Ca2+ uptake and buffering for each treatment groups, DMSO (control; black trace), CsA (red trace), ADP (brown trace), oligomycin (OMN, blue trace), or combination of OMN+ADP (green trace) are shown using the protocols depicted in Figure 1. Mitochondrial suspension was exposed to 0.5 μM CsA, 250 μM ADP, 10 μM OMN, or OMN+ADP before adding boluses of 20 μM CaCl2 (Protocol A; left column). Mitochondrial suspension was exposed to added boluses of CaCl2 (20 μM) and rescued from mPTP opening (Protocol B; right column) with similar interventions as in Protocol A, at a time point at which it would initiate mPTP opening. Representative traces show changes in [Ca2+]m over time in delay of mPTP opening (A) and rescue of mitochondria from mPTP opening (D). Insets (A,D) show Ca2+ uptake kinetics in detail. Steady-state [Ca2+]m (ss[Ca2+]m), 270 s after initiation of Ca2+ uptake, plotted as function of added Ca2+ (20 µM) every 300 s in delay of mPTP opening (B) and rescue of mitochondria from mPTP from opening (E). Insets (B,E) indicate the time points at which ss[Ca2+]m was calculated. Change in matrix-bound Ca2+:free Ca2+ over time in delay of mPTP opening (C) and rescue of mitochondria from mPTP opening (F). Arrowhead indicates time of addition of DMSO, ADP, OMN, OMN+ADP, or CsA during Protocol B.
Cells 08 01052 g003
Figure 4. Effect of CsA and AdN on mitochondrial Ca2+ buffering capacity. Mitochondrial Ca2+ buffering capacity calculated from trend fits of [Ca2+]e and [Ca2+]m for DMSO-(control), CsA-, and OMN+ADP-treated mitochondria as described by Equations (2)–(4) in Materials and Methods. Buffering capacity for each treatment was calculated from three-five experiments each for [Ca2+]e and [Ca2+]m and averaged. Error bars represent mean ± SEM (* p < 0.01 compared with DMSO).
Cells 08 01052 g004
Figure 5. Effect of CsA and AdN on mitochondrial bioenergetics. The bioenergetic responses during Protocols A (left column) and B (right column) were monitored using the ΔΨm sensitive dye TMRM (tetramethylrhodamine methyl ester perchlorate) (A,D), NADH autofluorescence (B,E), and pHm-sensitive dye BCECFAM (2′,7′-Bis-(2-Carboxyethyl)-5-(and-6)-carboxyfluorescein, acetoxymethyl ester AM) (C,F). Purple arrowhead indicates time of addition of DMSO (1 µM), ADP (250 µM), OMN (10 µM), OMN+ADP, or CsA (0.5 µM) during Protocol B.
Cells 08 01052 g005
Figure 6. Time-dependent effects of CsA on mitochondrial Ca2+ dynamics and bioenergetics during rescue of mitochondria from mPTP opening. Changes in (A) extra-matrix free Ca2+ ([Ca2+]e), (B) intra-matrix free Ca2+ ([Ca2+]m) and (C) ΔΨm, when CsA was added at 1 min (blue trace), 2 min (green trace), and 3 min (red trace) after the last Ca2+ bolus before another Ca2+ bolus would have caused mPTP opening. Right panels show the effect of CsA on (D) [Ca2+]e, (E) [Ca2+]m, and (F) ΔΨm dynamics during rescue of mitochondria from mPTP opening in greater detail. Insets (D,E) show relative ss[Ca2+]e and decay time constant (ms) at specified time points (black dotted box), respectively. Arrows indicate time of addition of CsA (0.5 µM). Error bars represent mean ± SEM (* p < 0.05, ** p < 0.01 vs. 3 min and # p < 0.05 vs. 2 min).
Cells 08 01052 g006
Figure 7. Effect of Pi on CsA-induced mitochondrial Ca2+ handling and bioenergetics. Time course of [Ca2+]e (A), [Ca2+]m (B), ΔΨm (C), and matrix-bound Ca2+:free Ca2+ (D) during consecutive additions of 20 μM CaCl2 to a suspension of Pi-depleted mitochondria, pre-exposed to DMSO (control), CsA, ADP, OMN, or OMN+ADP.
Cells 08 01052 g007
Figure 8. Mitochondrial Ca2+ modulation by CsA is phosphate (Pi)-dependent. Representative traces show change in extra-matrix Ca2+ fluorescence (Fura-4F Ratio) and ΔΨm during consecutive 20 μM CaCl2 boluses to induce mPTP opening in Pi-depleted mitochondria. Pi was added (purple arrowhead) at threshold point when mitochondria exhibited limited uptake of Ca2+ from the buffer.
Cells 08 01052 g008
Figure 9. Schema of the potential mechanism by which CsA mediates delay in Ca2+-induced mPTP opening. Pathological conditions, like cardiac ischemia-reperfusion injury, leads to an increase in cytosolic Ca2+ ([Ca2+]c). This in turn increases [Ca2+]m and generation of reactive oxygen species (ROS), impairs respiration and substrate utilization, and leads to uncoupling of oxidative phosphorylation. Lower ΔΨm, oxidized redox state, and dissipation of the pHm gradient, together induces mPTP opening which triggers apoptosis. These detrimental consequences that underlie IR injury could be mollified by CsA, which allows the mitochondria to maintain their basal [Ca2+]m via enhanced Pi-dependent matrix Ca2+ buffering, in addition to, or through, Cyp D inhibition. Sustained low [Ca2+]m maintains mitochondrial integrity and function and delays mPTP opening.
Cells 08 01052 g009