Next Article in Journal
Cerebrospinal Fluid Biomarkers in Relation to MRZ Reaction Status in Primary Progressive Multiple Sclerosis
Previous Article in Journal
Molecular Mechanisms to Target Cellular Senescence in Hepatocellular Carcinoma
 
 
Addendum published on 24 August 2021, see Cells 2021, 10(9), 2171.
Article

ANT2-Mediated ATP Import into Mitochondria Protects against Hypoxia Lethal Injury

1
Univ-Lyon, CarMeN Laboratory, INSERM 1060, INRA 1397, Université Claude Bernard Lyon1, INSA Lyon, Oullins, France, IHU OPERA, Groupement Hospitalier EST, Bâtiment B13, 59 boulevard Pinel, F-69500 Bron, France
2
Department of Biochemistry, Quaid-i-Azam University, Islamabad 45320, Pakistan
3
Gilbert and Rose-Marie Chagoury, School of Medicine, Lebanese American University, Byblos 4M8F+8X, Lebanon
*
Authors to whom correspondence should be addressed.
These authors share senior authorship.
Cells 2020, 9(12), 2542; https://doi.org/10.3390/cells9122542
Submission received: 2 October 2020 / Revised: 12 November 2020 / Accepted: 24 November 2020 / Published: 25 November 2020
(This article belongs to the Section Cell Signaling)

Abstract

:
Following a prolonged exposure to hypoxia–reoxygenation, a partial disruption of the ER-mitochondria tethering by mitofusin 2 (MFN2) knock-down decreases the Ca2+ transfer between the two organelles limits mitochondrial Ca2+ overload and prevents the Ca2+-dependent opening of the mitochondrial permeability transition pore, i.e., limits cardiomyocyte cell death. The impact of the metabolic changes resulting from the alteration of this Ca2+crosstalk on the tolerance to hypoxia–reoxygenation injury remains partial and fragmented between different field of expertise. >In this study, we report that MFN2 loss of function results in a metabolic switch driven by major modifications in energy production by mitochondria. During hypoxia, mitochondria maintain their ATP concentration and, concomitantly, the inner membrane potential by importing cytosolic ATP into mitochondria through an overexpressed ANT2 protein and by decreasing the expression and activity of the ATP hydrolase via IF1. This adaptation further blunts the detrimental hyperpolarisation of the inner mitochondrial membrane (IMM) upon re-oxygenation. These metabolic changes play an important role to attenuate cell death during a prolonged hypoxia–reoxygenation challenge.

1. Introduction

Despite major progress over the past decades, morbidity following acute myocardial infarction remains too high and a better understanding of mechanisms of cell death after ischemia–reperfusion is needed to improve therapy of acute coronary syndromes. Mitochondrial calcium overload plays a crucial role in myocardial ischemia–reperfusion injury in particular via the activation of the Ca2+-dependent cyclophilin D-mediated opening of the mitochondrial permeability transition pore [1]. In-vitro studies, alteration of ER-to-mitochondrial calcium homeostasis in conjunction with oxidative stress have been reported to open the mitochondrial permeability transition pore (mPTP). In turn, this causes both collapse of the mitochondrial membrane potential and swelling of mitochondria. Consequently, pyridine nucleotides and apoptosome components are released while the bioenergetics failure leads the cells to necrotic cell death [2,3,4]. Several groups have also shown that mitochondrial calcium, despite its undirect role in necrosis, could also coordinate various levels of the apoptotic process [5,6]. Mitochondrial calcium largely originates from the ER, trafficking through membrane contact points referred to as mitochondrial-associated membranes (MAMs) [7]. Mitochondrial matrix Ca2+ is however not only a trigger of the opening of the permeability transition pore (PTP), but is also a regulator of FAD-glycerol phosphate dehydrogenase, pyruvate dehydrogenase, NAD-isocitrate dehydrogenase and oxoglutarate dehydrogenase of the Krebs cycle (for review see, [8]).
We previously reported that a concomitant disruption of the Ca2+ transfer from ER to mitochondria through the IP3R-VDAC complex at MAMs decreases cardiomyocyte death after a prolonged hypoxia–reoxygenation [9]. However, we did not specifically address how this perturbation of ER-mitochondria crosstalk could also involve an energy crisis and its consequences in cell tolerance to the hypoxia–reoxygenation induced injury.
Cancer cells that survive in the hypoxic environment of the tumor core display a low MFN2 expression [10,11,12,13,14,15]. In in vivo conditions of hypoxia–reoxygenation, Hall et al. reported that hearts of MFN2-/- mice are more tolerant to acute myocardial infarction. Beyond its role in mitochondria fusion, mitofusin 2 (MFN2) contributes to the tethering of these two organelles, stabilizes MAMs and facilitates Ca2+ shuttling between the two organelles [16,17]. Depletion in MFN1/MFN2 expression induces the transcription of genes involved in glycolytic metabolism via hypoxia-inducible factor 1α [18]. MFN2-/-mitochondria exhibit a metabolic reprogramming towards glycolysis instead of aerobic metabolism (OXPHOS) [19]. We then questioned whether a modification of the cell bioenergetics secondary to MFN2 loss of function might contribute to the survival of cardiomyocytes exposed to hypoxia–reoxygenation.
In the present study, we showed that a transient decrease in MFN2 expression enhanced the tolerance to hypoxia–reoxygenation via a metabolic reprogramming including a decreased mitochondria OXPHOS activity together with an enhanced anaerobic glycolysis. This adaptative metabolic switch involves both an unexpected import of cytosolic ATP into mitochondria via ANT2 and a decrease in F1F0 ATP hydrolase activity that is caused by an increased expression of its inhibitor, IF1.

2. Results

2.1. Increased Mitochondrial ATP Despite Reduced Ca2+ Accumulation after MFN2 Loss of Function

In normoxia conditions, we confirmed that the Ca2+content in mitochondria was lower in MFN2-KD H9C2-sv40 cells than in control cells (siControl) (Figure 1A,B; protein silencing is reported in Figure S1). It has been reported in several cell models that MFN2-KD may modify the contact surface between mitochondria and ER [20,21,22] and consequently perturbates Ca2+ transfer between ER and mitochondria. However, MFN2 KD is also known to modify mitochondria biogenesis and we questioned whether changes in mitochondrial volume and organization could also have an effect on the ER-to-mitochondria exchange surface. We labeled the ER and mitochondria of H9C2 cells with D1ER and MitoTracker DeepRed, respectively (Figure S2D). Pearson’s (data not sown) and Manders’s (data not shown) co-localization coefficients reported the concomitant detection of both fluorescence in pixels of images of either CTL or MFN2-KD H9C2 cells. In line with several studies [20,21,22,23,24], we detected a reduction in the co-localization of the two fluorescent signals in MFN2-KD cells which could be due either to a decrease in the proximity between ER and mitochondria membranes or a decrease in the surface of membrane-membrane contacts. However, pixel-based analysis (i.e., Manders’ and Pearson’s colocalization coefficients) only reports the proportion of one fluorescent signal that co-localizes with the second fluorescent signal. It does not preserve and quantify the spatial information of the signal. We estimated their density and surface area by mean of image correlation spectroscopy. In MFN2-KD cells, mitochondria surface area and MAMs surface area were unchanged while their density dropped by 1.8-fold (Figure S2E) and 1.5-fold (Figure S2F), respectively. Strikingly, the total surface area of the MAMs and mitochondria compartments decreased concomitantly in MFN2 KD cells (Figure S2E,F). This result may be of importance when one would interpret changes in protein expression level detected in a cell population lysate (i.e., Western-blot) but would have no artefactual effect for any ratiometric measurement single cell or single organelle.
We next measured mitochondrial ATP levels using the “genetically-encoded ATP indicator ATeam” which enables single live cell analysis. The mitochondrial ATP content was significantly higher in MFN2-KD cells averaging 6.209 ± 0.069 ∆F versus 5.485 ± 0.069 ∆F in Control cells. Normalized fluorescence ratio (values at origin over its value after the treatment with inhibitors of glycolysis and ATP synthase) gave a similar result showing a higher steady-state mitochondrial ATP value of 1.689 ± 0.014 ∆F in MFN2-KD cells than in Control cells of 1.477 ± 0.02171 ∆F (Figure 1C and Figure S2A,B).
Cells were then exposed to hypoxia OGD (oxygen glucose deprivation). We confirmed our previous results [9] showing that loss of MFN2 function prevented Ca2+ accumulation in mitochondria following a 10-min OGD (oxygen glucose deprivation) (Figure 1D). As expected, the 10-min OGD depleted the ATP content in mitochondria (Figure 1E) and cytosol (Figure S2C) of CTL andMFN2-KD cells. ATP content following oxygen-glucose reperfusion was significantly higher in mitochondria of MFN2-KD cells following both a short (10 min OGD) and a prolonged hypoxia (3 h OGD) (Figure 1E,F). We hypothesized that this could be explained either by an increase in OXPHOS-mediated ATP production or by a non-canonical ATP import from cytosol into mitochondria.
Overall, our results showed that, at baseline, mitochondria of MFN2-KD cells had an unexpected higher ATP concentration despite a lower Ca2+ content. Importantly, upon OGD MFN2-KD cells accumulated less Ca2+ than control cells and maintained a greater ATP level.
We then questioned the unexpected pattern upon OGD of a concomitant limited accumulation of mitochondrial calcium and an enhanced ATP production. To investigate this intriguing feature, we measured mitochondrial respiration and cell bioenergetics in MFN2-KD cells.

2.2. Decreased MFN2 Expression Triggers a Shift Toward a Cytosolic ATP Import into Mitochondria

Activity of the OXPHOS complexes was monitored in live single cells at 37 °C under normoxia. Using a combination of inhibitors of complexes I and III and the A-team sensor, we detected a 1.3 and 1.9-fold decrease in Complex I- and Complex III-dependent ATP synthesis in MFN2-KD cells, that paralleled the decrease in Ca2+ concentration (Figure 2A,B). Obviously, the increased ATP concentration in mitochondria could not be due to the reduced OXPHOS activity.
We also assessed the glycolytic state of MFN2-KD cells by measuring the baseline ratio (reduced over oxidized) of nicotinamide adenine dinucleotide (NADH-NAD+) using a cytosolic fluorescent biosensor [25]. As reported in Figure 2C, we found a significantly higher NADH/ NAD+ ratio in MFN2-KD (3.053 ± 0.061∆F) when compared to control cells (2.711 ± 0.054 ∆F), consistent with an increased glycolysis [26,27,28,29].
We measured the effect of the LDH blocker oxamate on mitochondrial and cytosolic ATP levels under normoxia conditions (Figure 3A,B) and found that both cytosolic ATP and mitochondrial ATP concentration were more dependent on anaerobic glycolysis in MFN2-KD cells than in CTL cells. We checked whether this mechanism would be specific to H9C2-sv40 cells; we then repeated these experiments in a mouse cell line exhibiting typical hepatocyte features (AML12) and a mouse embryonic fibroblast cell line (MEF) (Figures S3A,B and S1C,D for shRNA validation). We obtained very comparable results suggesting that a transient suppression of MFN2 induces a shift of the molecular network toward a glycolytic metabolic phenotype in cell lines of different origins. We next investigated the mechanism that would allow ATP import from cytosol to mitochondria in MFN2KD cells.

2.3. Role of ANT2 for ATP Import into Mitochondria after MFN2 Loss of Function

Under normoxic conditions, MFN2-KD cells exhibited a near two-fold increase of ANT2 expression while ANT1expression increased slightly of 1.3 fold as compared to control (Figure 3C,D and Figure S4A,B). Regarding the decrease of the mitochondrial compartment in MFN2 KD cells (Figure S2E), these values could be underestimated. We have chosen to focus on ANT2 because it showed a greater induction and because studies reported that mitochondrial ATP import could be more dependent of ANT2 [30]. siRNA knocking down of ANT2 by 50% (Figure S4C) resulted in a significant decrease in mitochondrial ATP both in MFN2 KD and in CTL cells (Figure 3E) indicating a crucial role of ANT2 for glycolytic ATP import into mitochondria.
Pharmacological blockade of glycolysis by oxamate reduced cytosolic but not mitochondrial ATP content in control cells (Figure 3A,B). When oxamate was administered in siANT2 control cells, cytosolic ATP decreased but mitochondrial ATP increased. This indicates as expected that in control cells mitochondrial ATP is mainly synthesized in mitochondria and is exported into the cytosol. Conversely in MFN2 KD cells, both cytosolic and mitochondrial ATP content was reduced by oxamate. Additional loss of ANT2 function partially corrected the decrease in cytosolic ATP but did not significantly modify mitochondrial ATP content. This suggests that ANT2 imports cytosolic ATP into mitochondria in these cells and that unlike control cells, ANT2 plays a crucial role in MFN2-KD cells for importing cytosolic ATP formed by glycolysis into mitochondria.
We then questioned whether this metabolic shift would contribute to enhance the resistance of the cells to hypoxia–reoxygenation. We specifically explored the preservation of ATP using the OGD challenge. As expected, a transient OGD caused a rapid decrease of mitochondrial ATP in CTL cells (Figure 3F). MFN2 KD cells (ATP mean: 3.123 ± 0.311 min) exhibited a slower decrease in mitochondrial ATP content than CTL cells (ATP mean: 1.541± 0.085 min) (Figure 3F). Suppression of ANT2 alone significantly attenuated the decrease of mitochondrial ATP indicating that ANT2 either exports ATP from mitochondria to cytosol during OGD or that ANT2 favors ATP hydrolysis during OGD. As opposed to CTL cells, suppression of ANT2 accelerated, but not slowed down, the rate and amplitude of the decrease of mitochondrial ATP content in MFN2KD cells (Figure 3F) suggesting that ANT2 plays an important role for preserving mitochondrial ATP content during OGD. Altogether our data suggest that, during OGD, either ANT2 acts in a reverse mode (i.e., imports ATP into mitochondria) in MFN2KD cells or attenuate ATP hydrolysis during OGD in MFN2KD cells.
During hypoxia–reoxygenation, mitochondrial ATP hydrolysis occurs via the F1F0 ATPase or other catabolic enzymatic processes (i.e., kinases). We then assessed the activity of the F1F0 ATPase as well as the other ATP catabolic processes during OGD using the mitochondrial F1F0 ATPase inhibitor: BMS-199264 [31].
Loss of ANT2 had no effect on the F1Fo ATP hydrolase activity in CTL cells (Figure 4A). As shown previously in Figure 3F, MFN2 KD cells exhibited a decreased ATP hydrolase activity that was prevented by the concomitant suppression of ANT2, suggesting that ANT2 activity influences mitochondrial ATP hydrolysis during OGD in MFN2 KD cells. Non-F1F0 ATPase degradation processes were estimated by using BMS-199264. This inhibitor increased the mean lifetime of mitochondrial ATP content in MFN2 KD when compared to CTL cells indicating that a relative greater activation of these ATP catabolic processes in MFN2KD versus CTL cells (Figure 4B). Overall, ANT2 appears to play a dual role for preserving mitochondrial ATP content during OGD, i.e., facilitating its import and limiting its hydrolysis.

2.4. Decreased MFN2 Expression Up-Regulates the F1FoATPase Inhibitory Factor 1 and Maintain Mitochondrial Membrane Potential

The physiological ATPase inhibitory factor 1 (IF1) prevents the ATPase to switch to its ATP hydrolase form when the mitochondrial electrochemical gradient collapses as a consequence of hypoxia [32]. In cancer cells, the up-regulation of IF1 prevents a useless waste of ATP and is related to a Warburg-like metabolic shift [33].
Under normoxic conditions, MFN2-KD cells displayed a 25% decreased expression of the ATPase (ATP5a)—which could be related to the 25% decrease in the total mitochondrial compartment (Figure S2E)—and a 1.4 time increase in the IF1/ATP5a ratio that were abolished by siANT2 (Figure 4C–E). Although this latter value is probably underestimate because of the decrease in the total mitochondrial compartment (Figure S2E), it is still in agreement with our above-mentioned observation of a reduced F1F0ATPase activity in MFN2KD cells (Figure 4A). Like siANT2, loss of IF1 function prevented the decrease of F1F0 ATPase activity inMFN2 KD cells (Figure 4F).
As for mitochondria ATP content, the suppression of IF1 function in control cells had no detectable effect, whatever glycolysis was blocked or not by oxamate (Figure 4G). In MFN2 KD cells, the loss of IF1 had no significant effect on mitochondrial ATP content. Administration of oxamate in case of double IF1/MFN2 loss of function resulted in a dramatic reduction of the mitochondrial ATP content suggesting that the inhibition of F1FoATPase by IF1 prevents the hydrolysis of the glycolytic ATP imported into mitochondria (Figure 4G).
We questioned whether the combination of the increased ATP import into mitochondria with the decreased hydrolysis by theF1F0 ATPase might contribute to prevent the mitochondria inner membrane depolarization during OGD. As shown in Figure 5, CTL cells displayed a major drop in the Δψm, and the suppression of either IF1 or ANT2 alone did not modified the Δψm mean lifetime during OGD (Figure 5A–D). MFN2KD cells underwent a lesser IMM depolarization than control cells (Figure 5C). As expected, the loss of IF1 function fully reversed this pattern during OGD. Importantly, the loss of ANT2 function partly prevented the protection against the IMM depolarization in the MFN2-KD cells.
We next assessed how ANT2 and IF1 participate in the restoration of Δψm at the onset of reperfusion (Figure 5E,F). In control cells, there was a marked IMM hyperpolarization upon oxygen and glucose restoration with Δψm averaging 1.360 ± 0.692 at one hour (Figure 5F). The suppression of either siIF1 or siANT2 alone did not modified the Δψm recovery after reoxygenation with glucose. MFN2 KD cells displayed a significantly attenuated IMM hyperpolarization at the onset of reoxygenation with glucose (Figure 5F). ANT2 and IF1 knock-down prevented this limited hyperpolarization in MFN2 KD cells and even induced a greater hyperpolarization than control cells (Figure 5F). These data suggest that both ANT2 and IF1 limit IMM hyperpolarization following OGD in MFN2 KD cells.
As summarized in Figure 6, our results demonstrate that in cells knocked down for MFN2, IMM depolarization and repolarization during hypoxia–reoxygenation are modulated by F1F0 ATPase activity which depends on a minimum of two ordered reactions finely-tuned in MFN2 KD cells: (1) The ATP availability through the ANT2-mediated import into mitochondria, and (2) the F1F0ATPase reaction rate which is modulated by IF1. Subsequently, the prolonged proton pumping activity of the F1F0ATPase prevents the total dissipation of mitochondrial membrane potential.
We eventually investigated whether this metabolic shift could contribute to the protection against ischemia–reperfusion injury in MFN2 KD cells.

2.5. Import of Cytosolic ATP by Mitochondria Confers Resistance to Hypoxia

Opening of the mitochondrial permeability transition pore (PTP) plays a crucial role in cell death following a prolonged ischemia–reperfusion insult [1]. We assessed the mitochondrial Ca2+ retention capacity as measured by the calcein/cobalt method to evaluate the kinetic of PTP opening, as previously described [34].
The calcein fluorescence decay time was significantly higher in MFN2-KD than in CTL cells (1.21 ± 0.04 min and 0.99 ± 0.02, respectively) suggesting an increased resistance to calcium-induced PTP opening (Figure 7A). Loss of function of ANT2 and IF1in control cells led to an increase in the rate of PTP opening (Figure 7A). In MFN2-KD cells, loss of function of ANT2 and IF1 also increased the rate of PTP opening suggesting that both players contribute to prevention of PTP opening in these cells.
Cell death was measured after a 4-h OGD followed by 2 h of reoxygenation. Flow cytometry measurements showed that loss of MFN2 function limited OGD-induced cell death (Figure 7B). Apoptosis and necrosis assay using FACS (Caspase and Propidium iodide) revealed that 90% of the cell death type induced by our OGD-reoxygenation protocol is necrosis (Figure S5B).
In CTL cells, the loss of either siIF1or siANT2 did not significantly affect cell death after OGD, indicating that neither of the two proteins alone is sufficient for protection against hypoxia–reoxygenation injury (Figure 7B). In contrast, the invalidation of ANT2, but not that of IF1, significantly attenuated the protection afforded by loss of MFN2 function (Figure 7B). In other words, both ANT2 and IF1 modulate Δψm and PTP opening but only ANT2 plays a significant role in cell death in MFN2 KD cells, suggesting that this metabolic switch might per se protect against hypoxia–reoxygenation injury.

2.6. ANT2 and IF1 Mediate the Modulation of Mitochondria Bioenergetics and Tolerance to Hypoxia-Reoxygenation in MFN2 KD Cells

Taking in account that molecular mechanisms are organized non-linearly, multivariate analysis like principal component analysis (PCA) can be used to question the contribution of values from different experiments in the proximity or dissimilarity of behavior of the different biological conditions. As shown in Figure 7C, PCA spreads four biological conditions: Control cells, MFN2-KD cells, ANT2-KD cells, and dual MFN2+ANT2-KD cells along the two principal components in function of the variance of each of the ten experimental measures.
A strong divergence in the phenotype of control cells and MFN2 KD cells is displayed by their scattering along the first PC (67.8% of variance) and is mostly related to modifications in the glycolysis/OXPHOS proportion (assessed by ATP production in with or without oxamate: A lactate dehydrogenase inhibitor), the lifetime of ATP content decrease during OGD and Δψm during OGD, PTP opening and cell death and steady-state ATP content in mitochondria. In contrast, the lone suppression of ANT2 in control cells spreads orthogonally, along the second PC (24.3% of variable variance), and is mostly related F1F0 ATP hydrolase activity and steady-state mitochondrial ATP concentration. Strikingly, MFN2+ANT2-KD and ANT2-KD cells spread orthogonally to each other—indicating a major difference in the phenotype reported by the ten experimental measures. Consequently, no direct comparison on the role of ANT2 suppression should be drawn by comparing its effect in control and MFN2 KD cells for a single experimental variable. Finally, suppression of ANT2 in MFN2 KD cells almost fully reverse their protective bioenergetic phenotype.
The suppression of IF1 in MFN2 KD was insufficient to reverse fully the MFN2 KD phenotype (Figure S5A). Since ANT2 intervene “upstream” of IF1 in the biochemical process (Figure 6), this analysis supports the fact that ATP import in mitochondria did not only improve F1F0ATP hydrolase activity synergistically to IF1, but also likely enhanced other ATP-dependent activities.

3. Discussion

Our study shows that the protection against hypoxia–reoxygenation injury afforded by the loss of MFN2 function is partly due adaptations leading to metabolic shift towards glycolysis and overexpression of ANT2 working as an importer of cytosolic ATP into mitochondria. The concurrent modulation of the F1FoATPase by IF1 is a secondary component of the protective effect triggered by MFN2 deletion.

3.1. A Metabolic Shift to Improve Cell Tolerance to Hypoxia–Reoxygenation

Studies have previously reported that cells lacking MFN2 display glucose metabolism impairments even though they did not report major change in cell bioenergetics. To our knowledge no difference in ATP content has so far been reported. As reviewed by E. Schrepfer and L.Scorrano, in different cell models, MFN2 depletion leads to a reduction of the mitochondrial membrane potential, of cellular oxygen consumption, of mitochondrial co-enzyme Q levels and of the expression of OXPHOS complexes I, II, III, and V [16].
Reportedly, total cellular ATP level was unchanged in MFN2 KD or KO cell models [35,36]. Although we detected no difference in cytosolic ATP content before or after hypoxia, mitochondrial ATP content was increased in MFN2 KD cells under both normoxia and hypoxia. Because cell lines mainly display a glycolytic phenotype, their mitochondrial respiration is low and small differences between control and MFN2 KD cells might have been hidden. As previously proposed [16], cells lacking MFN2 might compensate the decrease in the OXPHOS-mediated ATP synthesis by increasing glucose uptake, shifting to anaerobic glycolysis and generate ATP according to the Warburg model [37]. Using the fluorescent biosensor for cytosolic NADH-NAD+ we showed that cells with a reduced MFN2 expression, do rely on anaerobic glycolysis to produce ATP. We showed the non-specificity of this Warburg-like adaptation by showing it in three cell types of different tissues and organisms.
Reports suggest that cancer cells express ANT2 in order to transport cytosolic ATP into mitochondria [30]. This process appears to drive the clonal selection occurring in the tumor core [38]. However, it is so far unclear whether this metabolic shift might occur in a non-cancer condition. The participation of ANT2 to ATP transport across the mitochondrial membrane has been challenged [39], mainly based on the only measurement of the mitochondrial membrane potential. The best way to determine whether ANT2 is really able to transport ATP in/out mitochondria is to measure changes in ATP concentration on each side of the inner mitochondrial membrane in presence of an ANT2 inhibitor or in an ANT2 knock-down/out condition. Using this approach, we demonstrated that ANT2 works as an ATP exporter in control cells and as an importer when MFN2 function is loss. However, the mechanism of this reversible ATP transport by ANT2 remains to be determined.

3.2. Respective Role of ANT2 and IF1 to Maintain Mitochondrial ATP

We demonstrated that loosening the tight coupling between ER and mitochondria via loss of MFN2 function decreases the OXPHOS metabolism and increases ANT2 expression that, in turn, runs the import of cytosolic ATP in the mitochondria. This allowed to prevent the polarization of the inner mitochondrial membrane under normoxia, restrained its depolarization during hypoxia and its hyperpolarization at the onset of reperfusion, and finally, it attenuated cell death after a prolonged hypoxia–reoxygenation. Suppression of ANT2 prevents these events confirming the requirement for ATP import into mitochondria likely to fuel F1FoATP hydrolase during hypoxia. We found a partial decoupling between ANT2-mediated ATP import and the reduced activity of F1FoATP hydrolase. This latter was mainly due to the increased expression of theF1FoATP hydrolase inhibitor IF1. This partial uncoupling between ATP import and ATP hydrolase is most likely responsible for the increased content of ATP in mitochondria of MFN2 KD cells and provides the best equilibrium between rates of ATP consumption and proton pumping during hypoxia. Indeed, in control cells, the absence of ANT2-mediated ATP import and the suppression of IF1 leads to a burst of F1FoATP hydrolase activity during hypoxia that conduct to a quick depolarization of IMM and cell death. As represented on the Figure 6, as long as ANT2 transport rate is greater than ATP hydrolase + other ATP-consuming process, the IMM potential is maintained. However, because IF-1 expression level and activity are defining the percentage of functional ATP hydrolase, it may, secondarily to ANT2, help to limit the maximal rate of ATP hydrolase reaction.

3.3. Mitochondrial ATP, Inner Membrane Polarization, and Cell Death

Although both ANT2 and IF-1 are essential for the control of IMM polarization and the Ca2+-induced PTP opening, their role in cell protection against ischemia–reperfusion remains poorly understood. We found that IF1 suppression reversed the partial depolarization of the IMM at reperfusion in MFN2 KD cells and even caused a significant hyperpolarization (Figure 5D). This confirms that IF1 is a key component of the MFN2-mediated shift in IMM polarization response to OGD and reperfusion. The same analysis also depicts a negative correlation between mitochondrial ATP content and cell death (Figure 7C). The combined IF1 and MFN2 loss of function increased the mitochondrial ATP content while protecting against cells death. Conversely to IF1 and MFN2, the combined ANT2 and MFN2 loss of function decreased mitochondrial ATP content and increased cell death following OGD-reperfusion. This analysis suggests that cytosolic ATP import in mitochondria is required for the protection afforded by MFN2 KD against OGD-reperfusion, and ATP degradation by F1F0ATP hydrolase is probably not the unique mechanism involved in the protection.
Interestingly, Ca2+ induced PTP opening did not predict cell death upon hypoxia–reoxygenation in our study (Figure 7A,B). Although IF-1 suppression reversed the MFN2 KD-mediated inhibition of PTP opening, it did not prevent the protective effect of MFN2 KD on cell death after hypoxia–reoxygenation. This suggests that even though the Ca2+-induction of PTP is restored to the control levels in MFN2/IF1 KD cells, the open probability of the PTP during hypoxia–reoxygenation might be lowered in the latter as well as in MFN2 KD cells. Since we observed that the rate of ψm loss during OGD was comparable in control and IF-1/MFN2 KD cells, it is likely that ATP hydrolase activity is restored to the control level in the latter cells. This suggests that while cytosolic ATP is shuttled towards mitochondria, ψm loss is not sufficient to trigger cell death.
In conclusion, our study brings new insights into the mechanism of cell protection against hypoxia–reoxygenation. It is commonly accepted that accumulation of Ca2+ into mitochondria plays a major role in cell death following a prolonged hypoxia–reoxygenation insult by directly triggering PTP opening. Limiting Ca2+ overload by untethering ER (e.g., via loss of MFN2 function) and mitochondria would therefore appear as a sound therapeutic option. We here showed that this ER-mitochondria uncoupling, on top of limiting mitochondria Ca2+ overload, induced a major metabolic adaptation consisting primarily in the overexpression of ANT2 to import glycolytic ATP and of IF1 to limit ATP degradation by the F1FoATPase. The subsequent preservation of mitochondria ATP and maintenance of inner mitochondria membrane polarization per se significantly contributed to prevent cell death induced by a sustained hypoxia–reoxygenation insult (Figure 8).

4. Materials and Methods

4.1. Experimental Model and Subject Details

4.1.1. pH Sensitivity of the YFP-Based Biosensor in OGD Experiments

YFP-based FRET biosensors are known to be pH sensitive, which makes them artifact prone. Indeed, the original cameleons suffered from significant pH sensitivity, which has been improved in order to decrease the pKa of the acceptor YFP. Two mutations within EYFP (V68L and Q69K) were used to decrease its pKa to 6.1 [20,21,22]. The situation becomes even worse in the specific case of the acidosis occurring during hypoxia. However, this matter has rarely been assessed in the literature. In this study, we measured the ATP-specific response of an ATeam sensor in MFN2-KD cells during ODG by quantifying its pH-sensitive drop in the FRET signal by means of an engineered cameleon fluorescent biosensor deprived of the ligand domain, “null sensor” (Figure S6). We provided a calibration of this null sensor in different pH solutions from pH 8 to pH 5.3 and estimated the cytosolic pH of our cells as 6.7 during OGD. In addition, our experiments clearly demonstrated that less than 20% of the ATeam variation was subject to pH sensitivity. Although, this result prevents a precise quantification of ATP variation, it does not prevent a qualitative analysis of the ATP level through the OGD-reperfusion sequence.

4.1.2. Transient MFN2 KD vs. KO

Many discrepancies have been published in the MFN2 field depending on the genetic perturbation, the model, and the techniques used. Cardiac myocytes (KO model), cultured neonatal rat myocytes (KD model), MEF cells (KO model), neurons (KO and KD model), and Sh-SY5Y cells (KD model) have been used since 2011 [2,6,11,23,24,25,26]. For example, in a KO model of cardiac myocytes the authors observed resistance to permeability transition opening and less tunnel positive dead cells after ischemia-reperfusion (IR), and the opposite results in a cultured neonatal rat myocytes MFN2 KD model. They proposed that the action of MFN2 on PTP is likely to be cell type specific, depending on the extent of cellular differentiation [25]. In our laboratory, we observed less cell death after IR in a KD model of rat cardiomyoblast cell line [27]. In 2015, Filadi et al. measured a 50% reduction of MCU expression in a MFN2 KO model of MEF cells, whereas they recorded no difference in MCU expression in a MFN2 KD model of SHSY cells [11].
The major drawback in KO models lies in the plasticity of the genome, which enables adaptation/compensation at the gene level, towards a novel equilibrium of the molecular network being reached. Although it is always tempting to infer that a modified phenotype is directly caused by the suppression of the target gene, this should not be assumed so casually without controlling the state of the whole molecular network. Regarding the controversies in the literature on MFN2 models, and because we aimed at measuring the early molecular adaptations to MFN2 loss and their effect on cell in hypoxia-reoxygenation, we decided to use a KD model of MFN2. As reported in this study, we observed strong phenotypic modifications only two days after silencing of MFN2, which confirmed our intuition that transient KD can be a good model to probe the early events induced by changes in the expression of a target gene.

4.2. Cell Culture

Immortalized rat cardiomyoblasts cell line H9C2-sv40 cells were grown in DMEM 4.5 g/L glucose, l-glutamine containing 10% fetal bovine serum, and 100 units/mL of penicillin and streptomycin. Cells were cultured in 95% air and 5% CO2 at 37 °C and subcultured every 5 days at a 1:10 dilution. Cells were plated either on coverslips or on plates (Ibidi GmbH Inc., Gräfelfing, Germany and MatTek Corp., Ashland, MA, USA) and grown for 24 h before transfection with siRNA and/or fluorescent proteins using Dharmafect (GE Dharmacon, Lafayette, CO, USA) duo reagent. Experiments were performed 48 h after transfection. Mitofusin-2 (MFN2) silencing was achieved with 100 nM of siRNA (Qiagen, no.SI01907395, Hilden, Germany) (Figure S1A,B). The same procedure was applied for siRNA, ANT2, and IF1 (Eurogentec, Liège, Belgium) (Figure S4C,D). In parallel, controls were transfected with 100 nM of scramble siRNA (Qiagen, no 1027281). The knock-down efficiency was verified by Western-blotting and quantitative PCR (Figure S1C,D). AML12 (alpha mouse liver 12) cell line was grown in DMEM F12 (L0090-500) containing 10% fetal bovine serum, 100 units/mL of penicillin and streptomycin, Dexomethasone (40 ng/mL, Sigma D4902-100MG, St. Louis, MO, USA), insulin solution human (5 µg/mL, Sigma I9278-5ML), Transferrine (5 µg/mL, Sigma T8158-100MG), and sodium elenite: (5 ng/mL, Sigma S5261-25G). Cells were cultured in 95% air and 5% CO2 at 37 °C. Mouse embryonic fibroblast (MEF) cell line was grown in DMEM 4.5 g/L glucose, l-glutamine containing 10% fetal bovine serum, 10 mM pyruvate, and 100 units/mL of penicillin and streptomycin. Cells were cultured in 95% air and 5% CO2 at 37 °C.

4.3. Adenovirus Infection

The infection of cells with adenovirus-mCherry-shRNA (scramble or MFN2) at 10 MOI was performed 6 h after plating of the cells (MEF or AML12 cells) and followed by transfection with fluorescent protein 24 h after plating. Knock-down efficiency was verified by Western-blotting. Adenovirus constructs were obtained from Vector Biolabs, Malvern, PA, USA (Backbone: Adenoviral-Type 5(dE1/E3), promoter U6, mouse MFN2 shRNA, tag: mCherry driven by CMV promoter) (Figure S1C,D).

4.4. Cell Lysis and Western Blotting

Cell lysates were obtained by treating the cell monolayer with RIPA buffer supplemented with 1 mM Na3VO4, 1 mM DTT, 20 mM NAF, 5mM EDTA, and a cocktail of proteases inhibitor. Total protein concentration was determined using the bicinchoninic acid method (BCA, Interchim, Montluçon, France), and 25 µg of protein from each sample was loaded on 12% sodium dodecyl sulfate polyacrylamide gel (SDS-PAGE). Migration was performed for 15 min at 90 V, followed by 60 min at 130 V. Proteins were then blotted on a polyvinylidene difluoride (PVDF) membrane by electro transfer (Trans-Blot Turbo Transfer, Bio-Rad, Hercules, CA, USA). The PVDF membrane was incubated at room temperature for 1 h with 5% milk in PBS for blocking and then incubated overnight at 4 °C in the same buffer with the primary antibody. Secondary horseradish peroxidase (HRP) coupled antibodies, an ECL (entry-level peroxidase substrate for enhanced chemiluminescence) plus kit, and Western Blotting detection system from GE Healthcare were then used to reveal antigen–antibody complexes. The band intensity was determined using ImageLab software (Bio-Rad).

4.5. Oxygen-Glucose Deprivation (OGD) Experiments

Cells were washed twice in a HEPES-buffered solution containing 140 mM NaCl, 5 mM KCl, 1 mM MgCl2, 2 mM CaCl2, 10 mM HEPES, 2 mM Na2S2O4 (pH 7.4) with NaOH at 37 °C, placed into a specifically manufactured bio-incubator (NewBrunswik, an Eppendorf company, Galaxy 48R), and connected with a 100% N2bottle at 37 °C. Oxygen levels were monitored at 0.5% O2 by the system. After the OGD period, cells were washed twice with a HEPES-buffered solution containing 10 mM glucose and cultured in complete medium for 4 h in an incubator with 95% air and 5% CO2 at 37 °C. For the OGD experiments, on the microscope an Okolab system with a specific hypoxic chamber was used which controlled the environment (temperature, humidity, oxygen levels).

4.6. Wide-Field Microscopy for ATP, NADH/NAD+, and Ca2+ Live Cell Imaging

Cells were imaged on an Leica epifluorescence microscope using 40× objective. The [Ca2+] in cytosol, mitochondria, and ER were measured with D3cpv, 4mtD3cpv, and erGAP1, respectively. [ATP] in cytosol and mitochondria was measured with ATeam-cyto and ATeam-mito. Of note, the Ateam dynamic range was characterized between 0.5 and 5 mM [16]. With a steady-state ATP concentration at the mM concentration in cells, the Ateam sensor reached its insensitivity range in basal conditions; therefore, the increases in basal ATP level are prone to underestimation (Figure 1B).
Cytosolic NADH/NAD+ ratio was measured with Peredox [15]. Fluorescence ratios were calculated in MetaFluor 6.3 (Universal Imaging, Bedford Hills, NY, USA) and analyzed in Origin Pro (OriginLab, Northampton, MA, USA) + GraphPad Prism 4 (GraphPad, San Diego, CA, USA).
The proportion of aerobic-dependent and anaerobic-dependent ATP synthesis within the dynamic range of the Ateam sensors was calculated as following:
The minimal (FYFP/FCFP) fluorescence ratio value, (FYFP/FCFP)min, corresponding to the minimal sensitivity of Ateam probes to ATP was determined in cells incubated with oxygen/glucose-deprivation in the presence of 2 µM oligomycin A. At a constant illumination power and exposure time set on the microscope, the (FYFP/FCFP)min value was 3858 ± 0.029 (n = 409). (FYFP/FCFP)min was first subtracted from the (FYFP/FCFP) fluorescence ratio values at all times to obtain the corrected (FYFP/FCFP) values. Corrected (FYFP/FCFP) values measured in presence of an inhibitor were normalized by the corrected (FYFP/FCFP) values measured in the absence of this inhibitor (control). Finally, this ratio was subtracted by (1). The whole formula is:
  Treatment-dependent   ATP   synthesis = 1 ( F Y F P / F C F P ) i n h i b i t o r ( F Y F P / F C F P ) m i n ( F Y F P / F C F P ) c o n t r o l ( F Y F P / F C F P ) m i n
Unlike Ateam and Ca-sensing probes, the Peredox probe does not utilize FRET measurements but works by the principal of direct quantification of fluorescence intensity. As the direct quantification of fluorescence intensity is biased, we applied the method proposed by [15]. In this procedure, the steady-state green/red fluorescence ratio is normalized by the that measured after a 10 mM pyruvate treatment on cells. This high dose of pyruvate enhances the lactate dehydrogenase activity, which consumes NADH at a higher rate than it can be regenerated. Normalization of the (Fgreen/Fred)basal ratio by this minimum Peredox signal, (Fgreen/Fred)pyruvate, prevents artefacts related to variations in the probe concentration.
N o r m a l i z e d   N A D H N A D + r a t i o = ( F g r e e n / F r e d ) b a s a l ( F g r e e n / F r e d ) p y r u v a t e

4.7. Calcein Cobalt Protocol

Kinetics of mPTP opening was measured in live cells by means of the well-established calcein-cobalt assay. Briefly, cells were loaded with 1 µM calcein-AM in a Ca2+-containing physiological solution (CCB) for 15 min at room temperature. Cells were washed twice and incubated for another 30 min with 2 mM cobalt chloride and 200 µM sulfinpyrazon in CCB. Using a Leica wide-field microscopy system, cells were imaged every 5 s under resting conditions for 1–2 min before application of 1 µM ionomycin, which triggers the mPTP opening. Calcein-AM was excited using a GFP excitation filter and emission was performed with a FITC filter. A decrease in mitochondrial calcein fluorescence reflected the opening of mPTP. For data analysis, the background was subtracted and curves were normalized with the basal fluorescence.

4.8. FACS Analysis of Cellular Viability and Mitochondrial Membrane Potential

FACS analyses of propidium iodide positive cells were performed 4 h after OGD. Cells were harvested with Accutase (GE Healthcare, L11-007), centrifuged, and resuspended in complete medium. PI at a 1 µg/mL final quantity was added to perform FACS analysis by Fortessa X-20 (BD Biosciences, San Jose, CA, USA) (λex 530 nm, λem 620 nm). FACS analysis of mitochondrial membrane potential was performed with two different dyes. TMRM at 20 nM (Fortessa X20::λex 561, λem 580 nm) and DILC1(5) at 20 nM (Fortessa X20::λex 640, λem 658 nm). To obtain a minimum basal value for mitochondrial membrane potential with each dye, cells were incubated with 10 µM FCCP for 10 min. TMRM fluorescence was normalized with the minimum fluorescence intensity obtained after FCCP treatment.

4.9. RNA Extraction and Real-Time PCR

Two days after transfection, cells were harvested by trypsination and total RNA isolation was performed using Trizol technique, according to the manufacturer’s protocol, and reverse-transcribed using a High-capacity RNA-to-cDNA kit (Applied Biosystems, 4387406, Foster City, CA, USA). Real-time PCR was performed using the StepOnePlus real-time PCR system (Applied Biosystems) and Fast SYBR Green Master Mix (Applied Biosystems, 4385612) according to the manufacturer’s instructions. Technical triplicates were made for each condition. All primers used are shown in the Key Resource table.

4.10. Principal Component Analysis

Data were subjected to the multivariate statistical method of principal component analysis (PCA) implemented in R language version 3.3.3, freely available at https://cran.r-project.org/ (accessed on 2 August 2021). PCA is an unsupervised method that aims to reduce data dimensionality via identifying a smaller number of uncorrelated variables known as principal components (PC). The PC1 axis represents efficiently the dataset and accounts for the highest variation in the original data. However, the second PC, perpendicular to PC1, accounts for most of the remaining variances. In order to analyze and visualize the data, the prcomp(), fviz_pca_ind(), and fviz_pca_var() functions, supplied with the “factoextra”and “ggplot2” packages, were used, respectively.

4.11. Quantification and Statistical Analysis

The significance of differences between means was established using Student’s t test for unpaired samples (* p < 0.05; ** p < 0.01; *** p < 0.001) and a non-parametric Kruskal–Wallis test with Dunn’s post hoc test.

Supplementary Materials

The following are available online at https://www.mdpi.com/2073-4409/9/12/2542/s1, Figure S1: siRNA/shRNA validation on different cell types (H9C2-sv40, MEFs, AML12 cells). Figure S2: The Calcium/ATP paradox in MFN2 KD cells. Figure S3: MFN2 loss of function induces a glycolytic phenotype. Figure S4: Validation of protein silencing. Figure S5: Related to Figure 7. PCA analysis. Figure S6: pH sensitivity of cameleon fluorescent protein.

Author Contributions

Y.G. and G.B. conceived and performed experiments, wrote the manuscript. Y.G., G.B., and M.O.: Review and editing. M.R.A., Z.H., C.C.D.S., D.B., S.B., A.D., R.H., and J.R., performed experiments. E.L. provided reagents. A.G. provided expertise. Supervision: G.B. and M.O. All authors have read and agreed to the published version of the manuscript.

Funding

This work was supported by the IHU OPeRa (ANR-10-IBHU-004), the RHU MARVELOUS (ANR-16-RHUS-0009) of Université de Lyon, within the program “Investissements d’Avenir” operated by the French National Research Agency (ANR) and by a grant from the Leducq Transatlantic Network of Excellence “Targeting Mitochondria to Treat Heart Disease ‘MitoCardia” (16 CVD 04).

Acknowledgments

We would like to thank Roger Tsien (University of California, San Diego, CA, USA), Hiromi Imamura (Japan Science and Technology Agency, Tokyo, Japan), Hiroyuki Noji (Osaka University, Suita, Japan), Gary Yellen (Harvard Medical School, Boston, MA, USA), Nicolas Demaurex (University of Geneva, Switzerland), and Maria Teresa Alonso (University of Valladolid, Valladolid, Spain) for providing the various biosensors. The D3cpv, 4mtD3cpv and D1ER constructs were provided by Roger Tsien (University of California, San Diego, CA). Cytosolic and mitochondrial FRET-based ATP indicators were provided by Hiromi Imamura (Japan Science and Technology Agency, Tokyo) and Hiroyuki Noji (Osaka University) [40,41]. pcDNA3.1-Peredox-mCherry was a gift from Gary Yellen (Addgene plasmid # 32383). Mito-Sypher pH indicator was provided by Nicolas Demaurex (University of Geneva, Switzerland). erGAP1 was a gift from Maria Teresa Alonso (University of Valladolid, Spain).

Conflicts of Interest

The authors declare no competing interests.

References

  1. Kwong, J.Q.; Molkentin, J.D. Physiological and pathological roles of the mitochondrial permeability transition pore in the heart. Cell Metab. 2015, 21, 206–214. [Google Scholar] [CrossRef] [Green Version]
  2. O’Rourke, B. Pathophysiological and protective roles of mitochondrial ion channels. J. Physiol. 2000, 529 Pt 1, 23–36. [Google Scholar] [CrossRef]
  3. Di Lisa, F.; Bernardi, P. A CaPful of mechanisms regulating the mitochondrial permeability transition. J. Mol. Cell. Cardiol. 2009, 46, 775–780. [Google Scholar] [CrossRef] [PubMed]
  4. Patron, M.; Raffaello, A.; Granatiero, V.; Tosatto, A.; Merli, G.; De Stefani, D.; Wright, L.; Pallafacchina, G.; Terrin, A.; Mammucari, C.; et al. The mitochondrial calcium uniporter (MCU): Molecular identity and physiological roles. J. Biol. Chem. 2013, 288, 10750–10758. [Google Scholar] [CrossRef] [PubMed] [Green Version]
  5. Szalai, G.; Krishnamurthy, R.; Hajnoczky, G. Apoptosis driven by IP(3)-linked mitochondrial calcium signals. EMBO J. 1999, 18, 6349–6361. [Google Scholar] [CrossRef] [PubMed]
  6. Giorgi, C.; Ito, K.; Lin, H.K.; Santangelo, C.; Wieckowski, M.R.; Lebiedzinska, M.; Bononi, A.; Bonora, M.; Duszynski, J.; Bernardi, R.; et al. PML regulates apoptosis at endoplasmic reticulum by modulating calcium release. Science 2010, 330, 1247–1251. [Google Scholar] [CrossRef] [PubMed] [Green Version]
  7. Csordas, G.; Weaver, D.; Hajnoczky, G. Endoplasmic Reticulum-Mitochondrial Contactology: Structure and Signaling Functions. Trends Cell Biol. 2018, 28, 523–540. [Google Scholar] [CrossRef]
  8. Denton, R.M. Regulation of mitochondrial dehydrogenases by calcium ions. Biochim. Et Biophys. Acta 2009, 1787, 1309–1316. [Google Scholar] [CrossRef] [Green Version]
  9. Paillard, M.; Tubbs, E.; Thiebaut, P.A.; Gomez, L.; Fauconnier, J.; Da Silva, C.C.; Teixeira, G.; Mewton, N.; Belaidi, E.; Durand, A.; et al. Depressing mitochondria-reticulum interactions protects cardiomyocytes from lethal hypoxia-reoxygenation injury. Circulation 2013, 128, 1555–1565. [Google Scholar] [CrossRef] [Green Version]
  10. Cheng, X.; Zhou, D.; Wei, J.; Lin, J. Cell-cycle arrest at G2/M and proliferation inhibition by adenovirus-expressed mitofusin-2 gene in human colorectal cancer cell lines. Neoplasma 2013, 60, 620–626. [Google Scholar] [CrossRef]
  11. Rehman, J.; Zhang, H.J.; Toth, P.T.; Zhang, Y.; Marsboom, G.; Hong, Z.; Salgia, R.; Husain, A.N.; Wietholt, C.; Archer, S.L. Inhibition of mitochondrial fission prevents cell cycle progression in lung cancer. FASEB J. Off. Publ. Fed. Am. Soc. Exp. Biol. 2012, 26, 2175–2186. [Google Scholar] [CrossRef] [Green Version]
  12. Wang, W.; Xie, Q.; Zhou, X.; Yao, J.; Zhu, X.; Huang, P.; Zhang, L.; Wei, J.; Xie, H.; Zhou, L.; et al. Mitofusin-2 triggers mitochondria Ca2+ influx from the endoplasmic reticulum to induce apoptosis in hepatocellular carcinoma cells. Cancer Lett. 2015, 358, 47–58. [Google Scholar] [CrossRef]
  13. Wang, W.; Zhu, F.; Wang, S.; Wei, J.; Jia, C.; Zhang, Y.; Zhou, L.; Xie, H.; Zheng, S. HSG provides antitumor efficacy on hepatocellular carcinoma both in vitro and in vivo. Oncol. Rep. 2010, 24, 183–188. [Google Scholar]
  14. Zhang, G.E.; Jin, H.L.; Lin, X.K.; Chen, C.; Liu, X.S.; Zhang, Q.; Yu, J.R. Anti-tumor effects of Mfn2 in gastric cancer. Int. J. Mol. Sci. 2013, 14, 13005–13021. [Google Scholar] [CrossRef] [PubMed] [Green Version]
  15. Jin, B.; Fu, G.; Pan, H.; Cheng, X.; Zhou, L.; Lv, J.; Chen, G.; Zheng, S. Anti-tumour efficacy of mitofusin-2 in urinary bladder carcinoma. Med Oncol. 2011, 28 (Suppl. 1), S373–S380. [Google Scholar] [CrossRef] [PubMed]
  16. Schrepfer, E.; Scorrano, L. Mitofusins, from Mitochondria to Metabolism. Mol. Cell 2016, 61, 683–694. [Google Scholar] [CrossRef] [PubMed] [Green Version]
  17. Hall, A.R.; Burke, N.; Dongworth, R.K.; Kalkhoran, S.B.; Dyson, A.; Vicencio, J.M.; Dorn, G.W., II; Yellon, D.M.; Hausenloy, D.J. Hearts deficient in both Mfn1 and Mfn2 are protected against acute myocardial infarction. Cell Death Dis. 2016, 7, e2238. [Google Scholar] [CrossRef] [PubMed]
  18. Son, M.J.; Kwon, Y.; Son, M.Y.; Seol, B.; Choi, H.S.; Ryu, S.W.; Choi, C.; Cho, Y.S. Mitofusins deficiency elicits mitochondrial metabolic reprogramming to pluripotency. Cell Death Differ. 2015, 22, 1957–1969. [Google Scholar] [CrossRef] [PubMed] [Green Version]
  19. Pavlova, N.N.; Thompson, C.B. The Emerging Hallmarks of Cancer Metabolism. Cell Metab. 2016, 23, 27–47. [Google Scholar] [CrossRef] [Green Version]
  20. Chen, Y.; Csordas, G.; Jowdy, C.; Schneider, T.G.; Csordas, N.; Wang, W.; Liu, Y.; Kohlhaas, M.; Meiser, M.; Bergem, S.; et al. Mitofusin 2-containing mitochondrial-reticular microdomains direct rapid cardiomyocyte bioenergetic responses via interorganelle Ca(2+) crosstalk. Circ. Res. 2012, 111, 863–875. [Google Scholar] [CrossRef] [Green Version]
  21. Schneeberger, M.; Dietrich, M.O.; Sebastian, D.; Imbernon, M.; Castano, C.; Garcia, A.; Esteban, Y.; Gonzalez-Franquesa, A.; Rodriguez, I.C.; Bortolozzi, A.; et al. Mitofusin 2 in POMC neurons connects ER stress with leptin resistance and energy imbalance. Cell 2013, 155, 172–187. [Google Scholar] [CrossRef] [PubMed] [Green Version]
  22. Sebastian, D.; Hernandez-Alvarez, M.I.; Segales, J.; Sorianello, E.; Munoz, J.P.; Sala, D.; Waget, A.; Liesa, M.; Paz, J.C.; Gopalacharyulu, P.; et al. Mitofusin 2 (Mfn2) links mitochondrial and endoplasmic reticulum function with insulin signaling and is essential for normal glucose homeostasis. Proc. Natl. Acad. Sci. USA 2012, 109, 5523–5528. [Google Scholar] [CrossRef] [PubMed] [Green Version]
  23. De Brito, O.M.; Scorrano, L. Mitofusin 2 tethers endoplasmic reticulum to mitochondria. Nature 2008, 456, 605–610. [Google Scholar] [CrossRef] [PubMed]
  24. Naon, D.; Zaninello, M.; Giacomello, M.; Varanita, T.; Grespi, F.; Lakshminaranayan, S.; Serafini, A.; Semenzato, M.; Herkenne, S.; Hernandez-Alvarez, M.I.; et al. Critical reappraisal confirms that Mitofusin 2 is an endoplasmic reticulum-mitochondria tether. Proc. Natl. Acad. Sci. USA 2016, 113, 11249–11254. [Google Scholar] [CrossRef] [Green Version]
  25. Hung, Y.P.; Albeck, J.G.; Tantama, M.; Yellen, G. Imaging cytosolic NADH-NAD(+) redox state with a genetically encoded fluorescent biosensor. Cell Metab. 2011, 14, 545–554. [Google Scholar] [CrossRef] [Green Version]
  26. Chiarugi, A.; Dolle, C.; Felici, R.; Ziegler, M. The NAD metabolome--a key determinant of cancer cell biology. Nat. Reviews. Cancer 2012, 12, 741–752. [Google Scholar] [CrossRef]
  27. DeBerardinis, R.J.; Lum, J.J.; Hatzivassiliou, G.; Thompson, C.B. The biology of cancer: Metabolic reprogramming fuels cell growth and proliferation. Cell Metab. 2008, 7, 11–20. [Google Scholar] [CrossRef] [Green Version]
  28. Heikal, A.A. Intracellular coenzymes as natural biomarkers for metabolic activities and mitochondrial anomalies. Biomark. Med. 2010, 4, 241–263. [Google Scholar] [CrossRef] [Green Version]
  29. Zhao, Y.; Hu, Q.; Cheng, F.; Su, N.; Wang, A.; Zou, Y.; Hu, H.; Chen, X.; Zhou, H.M.; Huang, X.; et al. SoNar, a Highly Responsive NAD+/NADH Sensor, Allows High-Throughput Metabolic Screening of Anti-tumor Agents. Cell Metab. 2015, 21, 777–789. [Google Scholar] [CrossRef] [Green Version]
  30. Chevrollier, A.; Loiseau, D.; Reynier, P.; Stepien, G. Adenine nucleotide translocase 2 is a key mitochondrial protein in cancer metabolism. Biochim. Et Biophys. Acta 2011, 1807, 562–567. [Google Scholar] [CrossRef] [Green Version]
  31. Grover, G.J.; Malm, J. Pharmacological profile of the selective mitochondrial F1F0 ATP hydrolase inhibitor BMS-199264 in myocardial ischemia. Cardiovasc. Ther. 2008, 26, 287–296. [Google Scholar] [CrossRef] [PubMed]
  32. Cabezon, E.; Montgomery, M.G.; Leslie, A.G.; Walker, J.E. The structure of bovine F1-ATPase in complex with its regulatory protein IF1. Nat. Struct. Biol. 2003, 10, 744–750. [Google Scholar] [CrossRef] [PubMed]
  33. Sanchez-Cenizo, L.; Formentini, L.; Aldea, M.; Ortega, A.D.; Garcia-Huerta, P.; Sanchez-Arago, M.; Cuezva, J.M. Up-regulation of the ATPase inhibitory factor 1 (IF1) of the mitochondrial H+-ATP synthase in human tumors mediates the metabolic shift of cancer cells to a Warburg phenotype. J. Biol. Chem. 2010, 285, 25308–25313. [Google Scholar] [CrossRef] [PubMed] [Green Version]
  34. Petronilli, V.; Miotto, G.; Canton, M.; Brini, M.; Colonna, R.; Bernardi, P.; Di Lisa, F. Transient and long-lasting openings of the mitochondrial permeability transition pore can be monitored directly in intact cells by changes in mitochondrial calcein fluorescence. Biophys. J. 1999, 76, 725–734. [Google Scholar] [CrossRef] [Green Version]
  35. Filadi, R.; Greotti, E.; Turacchio, G.; Luini, A.; Pozzan, T.; Pizzo, P. Mitofusin 2 ablation increases endoplasmic reticulum-mitochondria coupling. Proc. Natl. Acad. Sci. USA 2015, 112, E2174–E2181. [Google Scholar] [CrossRef] [PubMed] [Green Version]
  36. Kawalec, M.; Boratynska-Jasinska, A.; Beresewicz, M.; Dymkowska, D.; Zablocki, K.; Zablocka, B. Mitofusin 2 Deficiency Affects Energy Metabolism and Mitochondrial Biogenesis in MEF Cells. PLoS ONE 2015, 10, e0134162. [Google Scholar] [CrossRef] [PubMed]
  37. Depaoli, M.R.; Karsten, F.; Madreiter-Sokolowski, C.T.; Klec, C.; Gottschalk, B.; Bischof, H.; Eroglu, E.; Waldeck-Weiermair, M.; Simmen, T.; Graier, W.F.; et al. Real-Time Imaging of Mitochondrial ATP Dynamics Reveals the Metabolic Setting of Single Cells. Cell Rep. 2018, 25, 501–512e503. [Google Scholar] [CrossRef] [Green Version]
  38. McGranahan, N.; Swanton, C. Clonal Heterogeneity and Tumor Evolution: Past, Present, and the Future. Cell 2017, 168, 613–628. [Google Scholar] [CrossRef]
  39. Maldonado, E.N.; DeHart, D.N.; Patnaik, J.; Klatt, S.C.; Gooz, M.B.; Lemasters, J.J. ATP/ADP turnover and import of glycolytic ATP into mitochondria in cancer cells is independent of the adenine nucleotide translocator. J. Biol. Chem. 2017, 292, 16969. [Google Scholar] [CrossRef] [Green Version]
  40. Nakano, M.; Imamura, H.; Nagai, T.; Noji, H. Ca(2)(+) regulation of mitochondrial ATP synthesis visualized at the single cell level. ACS Chem. Biol. 2011, 6, 709–715. [Google Scholar] [CrossRef]
  41. Imamura, H.; Nhat, K.P.; Togawa, H.; Saito, K.; Iino, R.; Kato-Yamada, Y.; Nagai, T.; Noji, H. Visualization of ATP levels inside single living cells with fluorescence resonance energy transfer-based genetically encoded indicators. Proc. Natl. Acad. Sci. USA 2009, 106, 15651–15656. [Google Scholar] [CrossRef] [PubMed] [Green Version]
Figure 1. 
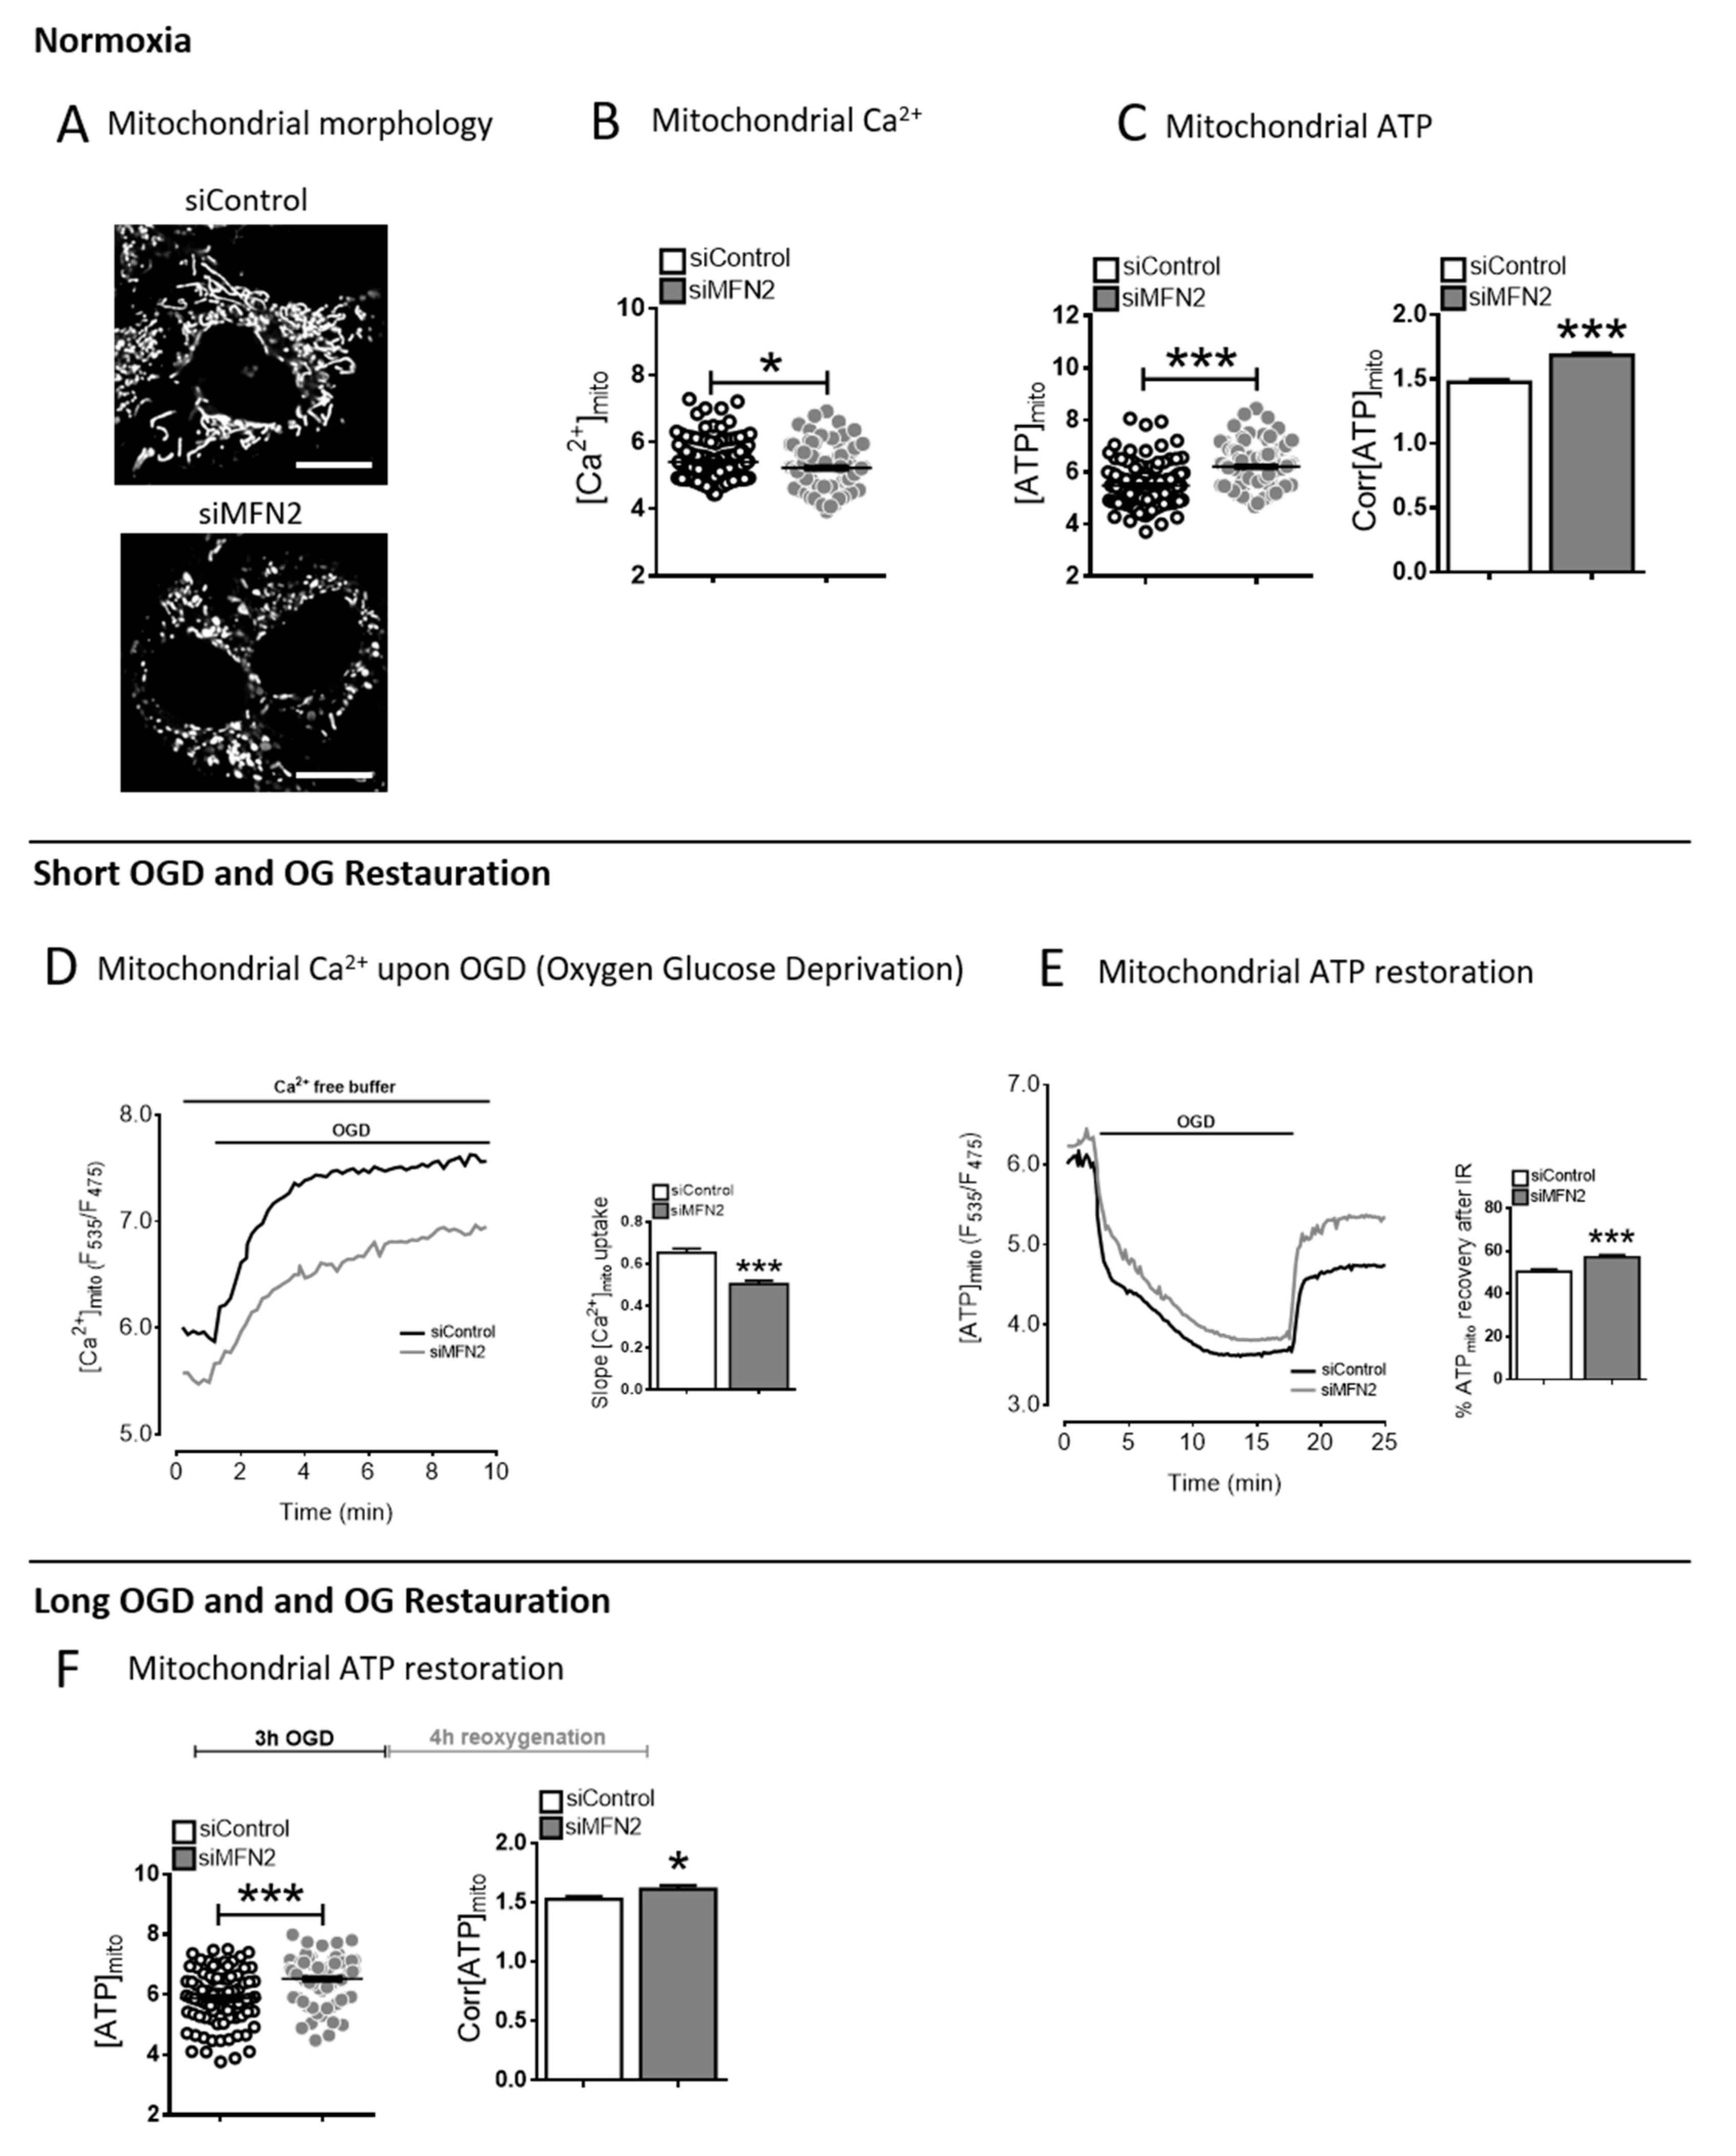
The Calcium/ATP paradox in mitofusin 2 (MFN2)-KD cells. (A) Confocal images of H9C2-sv40 cells expressing the mitochondrial Ateam sensor in siControl and MFN2-KD conditions (Scale bars, 10 μm). (B) Dot plot of steady-state mitochondrial Ca2+ level in siControl (black) and siMFN2 (grey) H9C2-sv40 cells (F535/F475). n = 125, 116 cells for siControl and siMFN2 H9C2-sv40 cells, respectively. Data shown represent the mean ± SEM of 4 independent experiments. * p < 0.05. (C) (left inset) Dot plot of steady-state mitochondrial ATP level in control (black) and MFN2-KD (grey) H9C2-sv40 cells (F535/F475). (right inset) Corrected steady-state mitochondrial ATP level (Corr[ATP]mito) calculated as ratio of Ateam values before/after 2-Deoxyglucose and oligomycin A for each cell (see Figure S2). n = 126, 139 cells respectively. Data shown represent the mean ± SEM of 4 independent experiments. (D) Mitochondrial calcium measurement during oxygen glucose deprivation (OGD) in siControl (black) and siMFN2 (grey) H9C2-sv40 cells. Maximal slope analysis of mitochondrial Ca2+ entry upon OGD in H9C2-sv40 cells. n = 125, 116 cells for siControl and siMFN2 H9C2-sv40 cells, respectively. Data shown represent the mean ± SEM of 4 independent experiments. *** p < 0.001. These experiments have been performed in absence of external calcium. (E) Measurement of the mitochondrial ATP level during a 15 min-oxygen glucose deprivation (OGD) and a 5 min-reoxygenation with glucose (reox + Glucose), in siControl (black) and siMFN2 (grey) H9C2-sv40 cells. Inset: Percentage of mitochondrial ATP recovery calculated as Ateam ratioat reperfusion divided by its steady-state value in siControl (white) and siMFN2 (grey) H9C2-sv40 cells. n = 85, 164 cells for siControl and siMFN2 H9C2-sv40 cells, respectively. Data shown represent the mean ± SEM of 4 independent experiments. (F) Measurements of steady-state mitochondrial ATP level after a 3 h-OGD and a 4 h-reoxygenation with glucose (reox + Glucose). (left inset) Dot-plot shows the steady-state mitochondrial ATP level ([ATP]mito) in each cell (F535/F475). (right inset) Corrected steady-state mitochondrial ATP level (Corr[ATP]mito). n = 75 cells for siControl and siMFN2 H9C2-sv40 cells. Data shown represent the mean ± SEM of 3 independent experiments, * p < 0.05; *** p < 0.001.
Cells 09 02542 g001
Figure 2. Decreased MFN2 expression induces a glycolytic phenotype. (A) Measurements of mitochondrial ATP level before and after a 1 µM rotenone treatment was performed in order to figure out the proportion of complex I-dependent ATP production. n = 40, 46 cells for siControl and siMFN2 H9C2-sv40 cells, respectively. Data shown represent the mean ± SEM of 3 independent experiments (See method details for the formula). (B) same as (A) with a 500 nM antimycin A treatment to calculate the proportion of complex III-dependent ATP level in the mitochondria. n = 20, 21 cells for siControl and siMFN2 H9C2-sv40 cells, respectively. Data shown represent the mean ± SEM of 3 independent experiments. (C) NADH/NAD+ ratio measurements obtained in control (black) and MFN2-KD (grey) H9C2-sv40 cells. A 10mM Pyruvate treatment, in absence of glucose, is achieved to determine the minimal NADH/NAD+ ratio value corresponding to the NADH insensitivity threshold of the probe (free NADH is consumed by the lactate dehydrogenase). (inset) Value represent mean ± SEM variation of NADH/NAD+ ratio between time 0 and post-pyruvate treatment (Normalized NADH/NAD+ ratio) obtained from 4 independent experiments. n = 81, 115 cells for siControl and siMFN2 H9C2-sv40 cells, respectively, ** p < 0.01, *** p < 0.001.
Cells 09 02542 g002
Figure 3. MFN2 loss of function induces an ANT2-dependent ATP import into mitochondria. (A) Estimation of the proportion of mitochondrial ATP originated from the cytosolic anaerobic glycolysis determined by mitochondrial ATP measurements in basal condition and after incubation with oxamate (20 mM) in control (white), siANT2 (stripped) MFN2-KD (grey) and siMFN2 + siANT2 (dashed) H9C2-sv40 cells. n = 125, 113, 122, 103, 106, 97, 104, 117 cells for siControl, siMFN2 and siMFN2 + siANT2 H9C2-sv40 cells, respectively. Data shown represent the mean ± SEM of 3 independent experiments. (B) Estimation of the proportion of cytosolic ATP originated from the cytosolic anaerobic glycolysis determined by cytosolic ATP measurements in basal condition and after incubation with oxamate (20 mM) in the cytosol of control (white), siANT2 (stripped), MFN2-KD (grey) and siMFN2 + siANT2 (dashed). n = 150, 195, 157, 121, 154, 131, 188, 134 cells for siControl, siMFN2 and siMFN2 + siANT2 H9C2-sv40 cells, respectively. Data shown represent the mean ± SEM of 3 independent experiments. ** p < 0.01; *** p < 0.001. (C) Western-blot showing ANT1 protein level in siControl (white) and siMFN2 (grey) H9C2-sv40 cells. ANT1 expression was normalized by the one of Tom20. *** p < 0.001 (see S4A for blot). (D) Western-blot of ANT2 protein normalized to Tom20 protein in siControl (white) and siMFN2 (grey) H9C2-sv40 cells. Data shown represent the mean ± SEM of 3 independent experiments (see S4B for blot). (E) Measurement of steady-state mitochondrial ATP in siControl, siANT2, siMFN2 and siMFN2 + siANT2 transfected cells. n = 226, 226, 188, and 217. Data shown represent the mean ± SEM of 3 independent experiments (F) Decay of the mitochondrial ATP content was measured by mean of mito-Ateam during oxygen glucose deprivation (OGD), in siControl (black), siANT2 (dotted), siMFN2 (grey) and siMFN2 + siANT2 (dashed) H9C2-sv40 cells. (inset) Mean lifetime of an exponential decay fit for mitochondrial ATP evoked by OGD in siControl, siANT2, siMFN2 and siMFN2 + siANT2. n = 153, 19, 231, and 89 cells. Data shown represent the mean ± SEM of 3–4 independent experiments. ** p < 0.01; *** p < 0.001.
Cells 09 02542 g003
Figure 4. MFN2 loss upregulates ATPase inhibitory factor 1. (A) Estimation of F1F0 ATP hydrolase activity calculated as the difference in mitochondrial ATP decay during OGD with or without the F1F0 ATP hydrolase inhibitor BMS-199264 (10 µM) in siControl, siANT2, siMFN2, and siMFN2+siANT2 transfected cells. n = 48, 20, 62, and 48 cells. Mean lifetime of an exponential decay fit is used to calculate the mitochondrial ATP decay during OGD. δ1 = Mean lifetime in control condition and δ2 = Mean lifetime in presence of BMS. Data shown represent the mean ± SEM of 4 independent experiments. (B) Histogram showing the contribution of other ATP-catabolic processes during OGD in presence of F1F0ATP hydrolase inhibitor BMS-199264in H9C2-sv40 cells. Activity of these other ATP catabolic processes was quantified as the averaged mitochondrial ATP decay figured out by the mean lifetime of an exponential decay fitting the Ateam sensor fluorescence ratio over time. n = 65 (control), 73 (siMFN2), 48 (siMFN2 + siANT2) and 20 (siANT2) cells. Data shown represent the mean ± SEM of 3–4 independent experiments * p < 0.05. (C) Western-blot (WB) of ATP5a and IF1 protein normalized to Tubulin protein in siControl (white), siMFN2 (grey) and siMFN2+siANT2 (grey dashed line) in H9C2-sv40 cells. (D) Fold change of ATP5a WB density normalized to Tubulin protein represents the variation in ATP5a protein expression. (E) Fold change of IF1 WB density normalized to ATP5a protein represents the variation in negative regulatory IF-1 protein expression as compared to F1F0ATP synthase/hydrolase activity. Data shown represent the mean ± SEM of 4 independent experiments. * p < 0.05. (F) ATP hydrolase activity (calculated as explain in the Figure 4A) in siControl, siIF1, siMFN2, siMFN2 + siIF1, and siIF1 transfected cells. n = 48, 30, 62, and 48 cells. δ1 = Mean lifetime in control condition and δ2 = Mean lifetime in presence of BMS. Data shown represent the mean ± SEM of 4 independent experiments. (G) Estimation of the proportion of mitochondrial ATP originated from the cytosolic anaerobic glycolysis. Mitochondrial ATP measurements were achieved with mito-Ateam sensor expressed in basal condition and after incubation with oxamate (20 mM) in control, IF1, MFN2-KD and siMFN2 + siIF1 transfected H9C2-sv40 cells. n = 125, 113, 100, 106, 106, 97, 96, 84 cells, respectively. Data shown represent the mean ± SEM of 3 independent experiments * p < 0.05, ** p < 0.01; *** p < 0.001.
Cells 09 02542 g004
Figure 5. MFN2 loss upregulates ATPase inhibitory factor 1 preserving mitochondrial membrane potential. (A) Wide-field images of siControl H9C2-sv40 cells loaded with TMRM dye before and after a 10 min OGD (Scale bars, 20 μm). (B) Wide-field images of MFN2-KD H9C2-sv40 cells loaded with TMRM dye before and after an 10 min OGD (Scale bars, 20 μm). (C) Dissipation of mitochondrial membrane potential, Δψm, during OGD as measured by the variation in TMRM fluorescence in mitochondria of siControl (black), siMFN2 (grey), siMFN2 + siANT2 (dashed) and siMFN2 + siIF1 (dotted) transfected H9C2-sv40 cells (representative curves). (D) Δψm is characterized by the mean lifetime of an exponential decay fit on TMRM fluorescent time-lapse recordings. n = 276 (siControl), 383 (siANT2), 352 (siIF1), 289 (siMFN2), 192 (siMFN2 + siANT2), and 184 (siMFN2 + siIF1) cells. Mean lifetime of each condition has been normalized with the control’s mean lifetime of the experiment day. Data shown represent the mean ± SEM of 6 independent experiments. (E) Restoration of Δψm upon 60 min-reoxygenation with glucose after a 40 min-OGD as measured by the variation in TMRM fluorescence in mitochondria of H9C2-sv40 cells. (F) Values show mean ± SEMΔψm recovery after OGD and reoxygenation (reox + Glucose). (Δ2/Δ1) in4 independent experiments. H9C2-sv40 cells. n = 232 (siControl), 172 (siANT2), 284 (siIF1), 221 (siMFN2), 242 (siMFN2 + siANT2), 152 (siMFN2 + siIF1) cells. Δψm recovery of each condition has been normalized with the control’s Δψm recovery of the experiment day. *** p < 0.001.
Cells 09 02542 g005
Figure 6. ANT2 and inhibitory factor 1 (IF1) mediate the modulation of mitochondria bioenergetics. Scheme summarizing the organization of cytosolic ATP import in mitochondria and IF-1 activity on the biochemical reaction of ATP hydrolysis and maintenance of Δψm in mitochondria of MFN2-KD cells. In the inset, curves represent a rough estimate of the relation between inner mitochondrial membrane (IMM) potential (ψm) and ATP concentration in mitochondria ([ATP]mito) in 3 cell populations transfected either with siCTL, siMFN2, or siANT2. This graph schematizes the effects of MFN2 KD shifting mitochondrial ATP concentration towards higher values and decreasing, in parallel, the maximal consumption rate of F1F0 ATP hydrolase via an increase in IF-1 expression. Cells knocked down for ANT2 show impaired ATP import which result in a shift of ATP concentration in mitochondria towards lower values.
Cells 09 02542 g006
Figure 7. MFN2 loss triggers a metabolic reprogramming which confers resistance to hypoxic injury. (A) Calcein/cobalt experiment assesses the kinetic of PTP opening after treatment with ionomycin in siControl, siANT2, siIF1, siMFN2, and siMFN2 + siANT2 H9C2-sv40 cells. (left inset) Decay time of the calcein fluorescence decreases upon ionomycin treatment (right inset) n = 756, 110, 362,219, 282 and 365cells for siControl, siANT2, siIF1, siMFN2, siMFN2 + siANT2, and siMFN2 + siIF1 H9C2-sv40 cells, respectively. Data shown represent the mean ± SEM of 5 independent experiments. (B) Percentage of propidium iodide positive cells measured by FACS after 4 h OGD and 2 h reoxygenation in siControl, siANT2, siIF1, siMFN2, siMFN2 + siANT2, and siMFN2 + siIF1 H9C2-sv40 cells. Data shown represent the mean ± SEM of 9 independent experiments * p < 0.05; *** p < 0.001. (C) Principal component analysis shows the first and second principle components of the multi-variate scattering of 4 experimental conditions: Control (siCTL), MFN2 KD cells (siMFN2), ANT2 KD cells (siA) and MFN2/ANT2 KD cells (siAM) by the variance of mean values of 10 experimental variables: Steady-state cytosolic ATP concentration ([ATP]c), steady-state mitochondrial ATP concentration ([ATP]m), anaerobic glycolysis-dependent ATP level in cytosol ([ATP]c-LDH), mitochondrial ATP originated from cytosolic anaerobic glycolysis ([ATP]m-LDH), mPTP opening, cell death, ATP hydrolase activity during OGD (F1F0 ATP hydrolase), lifetime of the drop in mitochondrial ATP concentration during OGD ([ATP]m decay), lifetime of the drop in IMM potential during OGD (ψm decay) and the recovery of IMM potential after OGD-reoxygenation (ψm recovery). This shows that, regarding the 10 experimental variables, the phenotypes of cells knock-down for both ANT2 and MFN2 are similar to control cells. Conversely to control cells, single knocked-down cells either for MFN2 or for ANT2 display a dispersion along PC1 and PC2, respectively, demonstrating that they do not share an identical phenotype.
Cells 09 02542 g007
Figure 8. ANT2-mediated ATP import into mitochondria protects against cardiac hypoxia lethal injury. Ischemia-reperfusion injury triggers an endoplasmic reticulum (ER) Ca2+ transfer to mitochondria (Mito), leading to membrane potential imbalance and opening of the permeability transition pore (PTP). Loss of MFN2 disrupts ER-mitochondria contact sites, lessened ER-to-mitochondria Ca2+ transfer and caused a metabolic reprogramming (Warburg shift) of the cell bioenergetics. The increased import of cytosolic ATP into mitochondria via ANT2 and the fine-tuning of F1F0ATP hydrolase by IF1 overexpression allowed a better tolerance to hypoxia by mean of the prevention of the collapse of the mitochondrial membrane potential associated to a delayed opening of the permeability transition pore and a higher steady-state ATP content during hypoxia associated with a greater cell survival.
Cells 09 02542 g008
Publisher’s Note: MDPI stays neutral with regard to jurisdictional claims in published maps and institutional affiliations.

