Article

Human Astrocytes Model Derived from Induced Pluripotent Stem Cells

1
Department of Physiology, Keio University School of Medicine, Tokyo 160-8582, Japan
2
Keio University Graduate School of Science and Technology, Kanagawa 223-8522, Japan
3
Laboratory for Marmoset Neural Architecture, RIKEN Center for Brain Science, Wako City, Saitama 351-0198, Japan
4
Department of Neurology and Stroke, Saitama Medical University International Medical Center, 1397-1 Yamane, Hidaka-shi, Saitama 350-1298, Japan
*
Author to whom correspondence should be addressed.
Co-first author.
Cells 2020, 9(12), 2680; https://doi.org/10.3390/cells9122680
Submission received: 15 November 2020 / Revised: 4 December 2020 / Accepted: 10 December 2020 / Published: 13 December 2020
(This article belongs to the Special Issue Neuron-Glia Interactions)

Abstract

:
Induced pluripotent stem cell (iPSC)-based disease modeling has a great potential for uncovering the mechanisms of pathogenesis, especially in the case of neurodegenerative diseases where disease-susceptible cells can usually not be obtained from patients. So far, the iPSC-based modeling of neurodegenerative diseases has mainly focused on neurons because the protocols for generating astrocytes from iPSCs have not been fully established. The growing evidence of astrocytes’ contribution to neurodegenerative diseases has underscored the lack of iPSC-derived astrocyte models. In the present study, we established a protocol to efficiently generate iPSC-derived astrocytes (iPasts), which were further characterized by RNA and protein expression profiles as well as functional assays. iPasts exhibited calcium dynamics and glutamate uptake activity comparable to human primary astrocytes. Moreover, when co-cultured with neurons, iPasts enhanced neuronal synaptic maturation. Our protocol can be used for modeling astrocyte-related disease phenotypes in vitro and further exploring the contribution of astrocytes to neurodegenerative diseases.

Graphical Abstract

1. Introduction

Accumulating evidence is now supporting the role of astrocytes in the initiation and maintenance of neurodegenerative diseases [1,2,3,4]. However, the exact contribution of astrocytes, the largest cell population in the central nervous system (CNS), to the development of neurodegenerative diseases has not been clarified due to limited accessibility to patients’ astrocytes. Human astrocytes and those of animal models exhibit essential differences in critical parameters such as the ratio of astrocytes to neurons [5], the spatial distribution and the complexity of astrocytes [6] or the molecular signatures and dominant signaling pathways [7]. The use of induced pluripotent stem cells (iPSCs) offers the possibility to circumvent these limitations by generating astrocytes of human origin in vitro. Previous studies have in fact demonstrated the interest of iPSC technology for studying the involvement of astrocytes in neurodegenerative diseases [8,9]. Unfortunately, the iPSC-derived astrocyte-like cells used in these studies were only partially characterized. Accurate modeling of astrocyte pathogenesis requires that iPSC-derived astrocytes recapitulate not only an astrocytic gene expression pattern but also perform the functions of genuine astrocytes. For example, it is necessary that the function of astrocytes in CNS energetic metabolism, through glycolysis, be investigated [10]. Astrocytes also regulate neuronal synapses by promoting synaptogenesis [11] or by modulating synaptic transmission through the transport of various amino acids, such as glutamate [12,13]. While previous reports have relied mainly on transcriptome and protein expression analyses [14] or calcium imaging studies [15,16] to characterize iPSC-astrocytes derived lines, only a few groups have performed co-culture with neurons [17,18] or investigated their glucose metabolism [19,20] and to the best of our knowledge, none has conducted all these analyses concurrently.
In the present report, we report an original protocol for generating iPSC-derived astrocytes (iPasts) and perform its validation at the cellular and functional levels. The gene expression profile of iPasts was compatible to human primary astrocytes and their functionality was confirmed in various aspects, including calcium dynamics, glutamate uptake, neuronal synapse maturation and glucose metabolism. Therefore, our protocol can generate iPasts that harbor key physiological features of human primary astrocytes. Considering the ever-increasing social and economic burdens of neurodegenerative diseases in our aging societies, iPasts represent an important new tool that will help to decipher the astrocyte-related mechanisms of neurodegeneration.

2. Materials and Methods

2.1. Research Involving Human Subjects

The study was conducted in accordance with the Declaration of Helsinki and the protocol was approved by the Ethics Committee of Keio University (No. 20080016, date of approval: 23 June 2020).

2.2. iPSC Culture

Human iPSCs were cultured on mitomycin-C-treated SNL murine fibroblast feeder cells in gelatin-coated (0.1%) tissue culture dishes. Human iPSCs were maintained in human ES medium (DMEM/F12, Wako, Tokyo) containing 20% KnockOut™ serum replacement (KSR, Gibco, Tokyo, Japan), 1% L-Glutamine 200 mM (Gibco), 0.8% non-essential amino acids (NEAA, Nacalai, Kyoto, Japan), 0.1 mM 2-mercaptoethanol (Sigma, St. Louis, MO, USA), 4 ng/mL fibroblast growth factor 2 (FGF-2, PeproTech, Tokyo, Japan) and Penicillin/Streptomycin at 37 °C in a humidified atmosphere of 3% CO2.

2.3. iPSC-Derived Astrocytes (iPasts) Induction In Vitro

Embryoid Bodies (EBs) Formation Phase (day 0 to 16): to differentiate iPSCs into iPasts, iPSC colonies were detached from feeder layers using a dissociation solution (0.25% trypsin, 100 μg/mL collagenase IV (Invitrogen, Carlsbad, CA, USA), 1 mM CaCl2 and 20% KSR) and cultured one night in suspension in ES medium without FGF-2 and with 10 µM Y-27632 (Nacalai, San Diego, CA, USA) to form EBs in a humidified atmosphere of 3% CO2. From day 1 to day 3, 3 µM dorsomorphin (Sigma), 3 µM SB431542 (Sigma) and 3 µM CHIR99021 (Focus Biomolecules, Philadelphia, PA, USA) were added to EB medium (DMEM/F12 containing 5% KSR, 1% L-Glutamine 0.8% NEAA, 0.1 mM 2-mercaptoethanol and Penicillin/Streptomycin) to enhance the differentiation into neural lineage. At day 4, the medium was changed to fresh EB medium supplemented with 1 µM retinoic acid (Sigma). At day 7, 10 and 13, the medium was changed to fresh EB medium with 1 µM retinoic acid and 1 μM purmorphamine (Cayman, Tokyo, Japan) and was maintained until day 16.
Primary Neurosphere Formation Phase (day 17 to 31): at day 16, EBs were enzymatically dissociated into single cells using TrypLE Select (Thermo Fisher Scientific, Waltham, MA, USA) and dissociated cells were cultured in suspension at a density of 1 × 10⁵–4 × 10⁵ cells/mL in neurosphere medium consisting of media hormone mix (MHM) [21] supplemented with 2% B-27 (Nacalai), 0.8% NEAA, 1 μM purmorphamine, 20 ng/mL FGF-2, 10 ng/mL epidermal growth factor (EGF, PeproTech, Rocky Hill, NJ, USA) in a humidified atmosphere of 5% CO2. The medium was changed every 4–6 days to form primary neurospheres.
Secondary Neurospheres Formation Phase (day 32 to 47): at day 32, primary neurospheres were dissociated as described above and cultured at a density of 1 × 10⁵–4 × 10⁵ cells/mL in neurosphere medium without purmorphamine.
Terminal Differentiation Phase (A0 iPast: day 48 to 76): at day 48, secondary neurospheres were dissociated and cultured at a density of 4 × 10⁵–1 × 10⁶ cells/well in 6-well plates coated with 200× diluted growth-factor-reduced Matrigel (Corning, Corning, NY, USA) and iPasts differentiation medium consisting of MHM supplemented with 2% B-27, 0.8% NEAA, 10 ng/mL of brain-derived neurotrophic factor (BDNF, R&D, Minneapolis, MN, USA), 10 ng/mL of glial cell-derived neurotrophic factor (GDNF, Alamone, Tel Aviv, Israel) in a humidified atmosphere of 5% CO2. The medium was changed every 4–7 days depending on the medium color.
Astrocytes Purification Phase. A1 iPasts (day 77 to 83): at day 77, A0 iPasts were enzymatically dissociated into single cells using Accutase (Nacalai) and the dissociated cells were plated at a density of approximately 1 × 10⁶ cells/well in 6-well plates coated with 200× diluted growth-factor-reduced Matrigel and cultured in iPast-differentiation medium. The medium was changed after 3–4 days depending on the medium color. A2 iPasts (day 84 to 90): A1 iPasts were dissociated and cultured as described above. A3 iPasts (day 91 to 97): A2 iPasts were dissociated and cultured as described above. A4 iPasts (from day 98): at day 98 iPasts were dissociated as described above and used for experiments. A4 iPasts were also stored in serum-free CellBanker2 (Zenoaq, Koriyama, Japan) at −196 °C.

2.4. RNA-Sequencing (RNA-Seq)

For RNA-Seq, RNA from EBs, neurospheres and iPasts were extracted using RNeasy kit (QIAGEN, Hilden, Germany). The indexed cDNA libraries were prepared using the Nextera XT library preparation kit (Illumina, Tokyo, Japan) and were sequenced using a NovaSeq6000 (Illumina) to obtain 150-bp paired-end reads. Published RNA-Seq data of primary astrocytes [7] and iPSC-derived astrocytes [22,23] were downloaded via the National Center for Biotechnology Information (NCBI) Short Read Archive (Supplemental Table S1). Raw FASTQ files were trimmed for adapters by Cutadapt [24] and aligned to the GRCh37 genome build using HISAT2 [25]. Counts were calculated using featureCounts [26] and normalized by variance-stabilizing transformation using the DESeq2 [27]. Differentially expressed genes were identified using a cutoff of 0.01 for Benjamini-Hochberg adjusted p-values and a cutoff of 4 for fold-change ratio. A comparative analysis of our dataset with fetal and adult astrocytes was performed across a set of astrocyte-specific genes used in Tchieu et al. [23] (Supplemental Table S2). The RNA-Seq dataset including raw data and preprocessed data has been deposited in the NCBI Gene Expression Omnibus and is accessible through GEO series accession number GSE161024.

2.5. Quantitative RT-PCR

Total RNA was isolated with a RNeasy mini kit or micro kit (QIAGEN) with DNase I (QIAGEN) treatment and cDNA was prepared by using an iScript cDNA Synthesis Kit (Bio-Rad, Tokyo, Japan). Quantitative RT-PCR was performed using SYBR Premix Ex Taq II (Takara Bio, Kusatsu, Japan) on a ViiA 7 Real-Time PCR System (Thermo fisher Scientifics, Tokyo, Japan). The details of qRT-PCR primers are described in the Supplementary Table S3.

2.6. Control Human Astrocyte Lines

For quantitative RT-PCR, total RNA from human fetal astrocytes (ScienCell, #SCR 1815, Cosmobio, Tokyo, Japan) (referred to as FA in the text) and a frozen sample from the frontal lobe of a 75-year-old male (referred to as HB in the text) were used. The use of this human sample was approved by the committee of Ethics of Mihara Memorial Hospital (Approval No. 087-03).
For cell culture, human fetal astrocytes (referred to as FAC in the text) from Lonza Pharma&Biotech (#CC-2565), grown according to the manufacturers’ instructions, were used.2.7. Immunofluorescence Analysis.
Cells were fixed with 4% paraformaldehyde for 20 min at room temperature and then incubated with blocking buffer (PBS containing 2% normal goat serum, 2% BSA and 0.2% Triton X-100) for 1 h at room temperature. Cells were then incubated overnight at 4 °C with primary antibodies (Supplemental Table S3), diluted in blocking buffer without Triton X-100. The cells washed with PBS were then incubated with secondary antibodies Alexa Fluor 488, Alexa Fluor 555 or Alexa Fluor 647 (Supplemental Table S3) and 10 µg/mL Hoechst 33258 (Dojindo, Shanghai, China) for 1 h at room temperature. Slides/coverslips were mounted with Permafluor (Thermo Fisher).

2.7. Microscopy

Cells were examined with a BZ-9000 microscope (Keyence, Osaka, Japan), IN Cell Analyzer 6000 (Cytiva, Tokyo, Japan) and LSM700 (Zeiss, Oberkochen, Germany) confocal microscope. Bright field images were captured using Nikon DS-L3 system (Nikon, Tokyo, Japan).

2.8. Calcium Imaging

Astrocytes induced from iPSCs by culture in iPast-differentiation medium were cultured for 5 days before performing calcium imaging assay. Cells were washed once with PBS, then loaded with 1 μg/mL Fluo-8 AM (AAT Bioquest, Sunnyvale, CA, USA) in recording medium (20 mm HEPES, 115 mm NaCl, 5.4 mm KCl, 0.8 mm MgCl2, 1.8 mm CaCl2 and 13.8 mm glucose-Dojindo) containing 0.02% Cremophor EL (Dojindo) and incubated for 20 min at 37 °C and 5% CO2. After washing with PBS, the medium was changed for the recording medium. Fluorescent images were obtained using an IX83 inverted microscope (Olympus, Kyoto, Japan) equipped with an Electron Multiplying CCD Camera (Hamamatsu Photonics, Hamamatsu, Shizuoka, Japan) and LED illumination system pE-4000 (CoolLED, Andover, UK). MetaMorph Image Analysis Software (Molecular Devices, Tokyo, Japan) was used to analyze the live cell calcium traces. Six hundred and one frames were recorded at 2 Hz using the stream acquisition mode. For imaging data analysis, a miniscope 1-photon-based calcium imaging signal extraction pipeline (MIN1PIPE) software was used [28]. This software automatically subtracts the background and corrects plate moves occurring during acquisition. Locations of astrocytes and region of interests were then extracted. The rising phase of each calcium transient is identified as the calcium event when the 1st derivative of ΔF/F0 = F ( t ) F 0 F 0 (where F(t) is the intensity of fluorescence at ‘t’ and F0 the intensity of fluorescence at the beginning of the rising phase) rises above 0 and continues to increase above 2 standard deviations of baseline fluctuation.

2.9. Glutamate Uptake Assay

iPasts were seeded at a density of 20,000 cells per well in a 24-well plate in iPast cell culture medium for seven days. On day 7, medium was removed and replaced by MHM containing glutamate at the concentration of 250 µM. Glutamate concentration after 1, 2 and 4 h was measured using the L-Glutamate assay kit (Yamasa Neo, Choshi, Japan) on an iMark microplate reader (Bio-Rad), according to the manufacturer’s protocol. Concentration of glutamate were normalized to the total protein concentration measured also on iMark microplate reader by BCA protein method (ThermoFisher).

2.10. Co-Culture of iPasts With Neurons

Cortical neuronal induction of iPSCs was performed as described previously [29,30] with some modifications. Briefly, adhesive iPSCs were cultured with dual SMAD inhibitors and a Wnt inhibitor to obtain forebrain neural precursors. These precursors were then cultured with GDNF, BDNF, ascorbic acid, dibutyryl cAMP and γ-secretase inhibitor, to obtain forebrain excitatory neurons. Three days after plating 2 × 10⁵ iPasts per 6.5 mm Matrigel-coated polycarbonate trans-well inserts (0.4 µm pores) (Corning), 1 × 10⁵ neurons derived from 1210B2-iPSCs were seeded and co-cultured with iPasts in Neurobasal medium (Gibco) supplemented with 2% B-27 for additional 5 days before immunofluorescent staining with anti-Synapsin-1 and anti-MAP2A antibodies (Supplemental Table S3). Cells were imaged using a LSM710 confocal microscope and Synapsin-1+ puncta on MAP2+ neurites were measured by IN Cell Analyzer 6000 (Cytiva).

2.11. Measurement of the Rate of D-[1-14C]-glucose and D-[6-14C]-glucose Oxidation to 14CO2

D-[1-14C]-glucose (2.035 GBq/mmol) and D-[6-14C]-glucose (2.035 GBq/mmol) were obtained from American Radiolabeled Chemicals. Two hundred thousand iPasts suspended in iPast-differentiation medium with 33 mM D-glucose were placed into 12.5 cm² culture flasks coated with 200× diluted growth-factor-reduced Matrigel at 37 °C in humidified air containing 5% CO2. The cells were used for assays when they had reached confluence (typically on day 4). The rate of [14C]-glucose oxidation to 14CO2 was measured as previously described with some modifications [31]. Briefly, cells were washed twice with glucose-free PBS; then 2 mM D-glucose labeled with 1 µL/mL D-[1-14C]-glucose or D-[6-14C]-glucose (original concentrations: 3.7 MBq/mL) in Dulbecco’s balanced salt solution (110 mM NaCl, 5.4 mM KCl, 1.8 mM CaCl2, 0.8 mM MgSO4, 0.9 mM NaH2PO4 and 44 mM NaHCO3) were added and cells were incubated at 37 °C for 60 min. Flasks were capped with rubber stoppers containing a center well (Kimble/Kontes) with a cotton ball containing 100 µL of hyamine hydroxide 10-X (PerkinElmer, Waltham, MA, USA), through which 14CO2 was trapped. The reactions were terminated by the injection of 250 µL of 60% perchloric acid through the rubber stopper and the flasks were kept at 4 °C overnight to trap 14CO2. The cotton balls were then transferred to 20-mL glass scintillation counter vials and 500 µL of ethanol and 10 mL of Insta-Fluor Plus (PerkinElmer) were added. The 14C content of the vials was evaluated using a liquid scintillation counter (Tri-Carb 3100TR; PerkinElmer Life Sciences). Because a substantial 14C count can be obtained from a flask without cells [32], the 14C count obtained from a cell-free flask in which the reaction had been stopped at 60 min was regarded as the background value. The cell layers remaining in flasks after the removal of the reaction mixtures were digested with 5 mL of 0.1 mol/L NaOH and their protein contents were determined. We measured the rates of total glucose oxidation (pmol glucose/µg protein/60 min) based on the conversion from [1-14C]-glucose to 14CO2 over 60 min. TCA cycle consumption was measured by the conversion rate from [6-14C]-glucose to 14CO2. Pentose phosphate pathway (PPP) activity was calculated as the difference between the total glucose consumption and the TCA cycle consumption [33,34].

2.12. Statistical Analyses

The statistical tests and sample sizes (n) are indicated in the respective figure legends. Tests were performed using GraphPad software (v8.2.1). Significances: ****, ***, **, * indicate p-values (p) < 0.0001, < 0.001, < 0.01 and ≤ 0.05, respectively.

3. Results

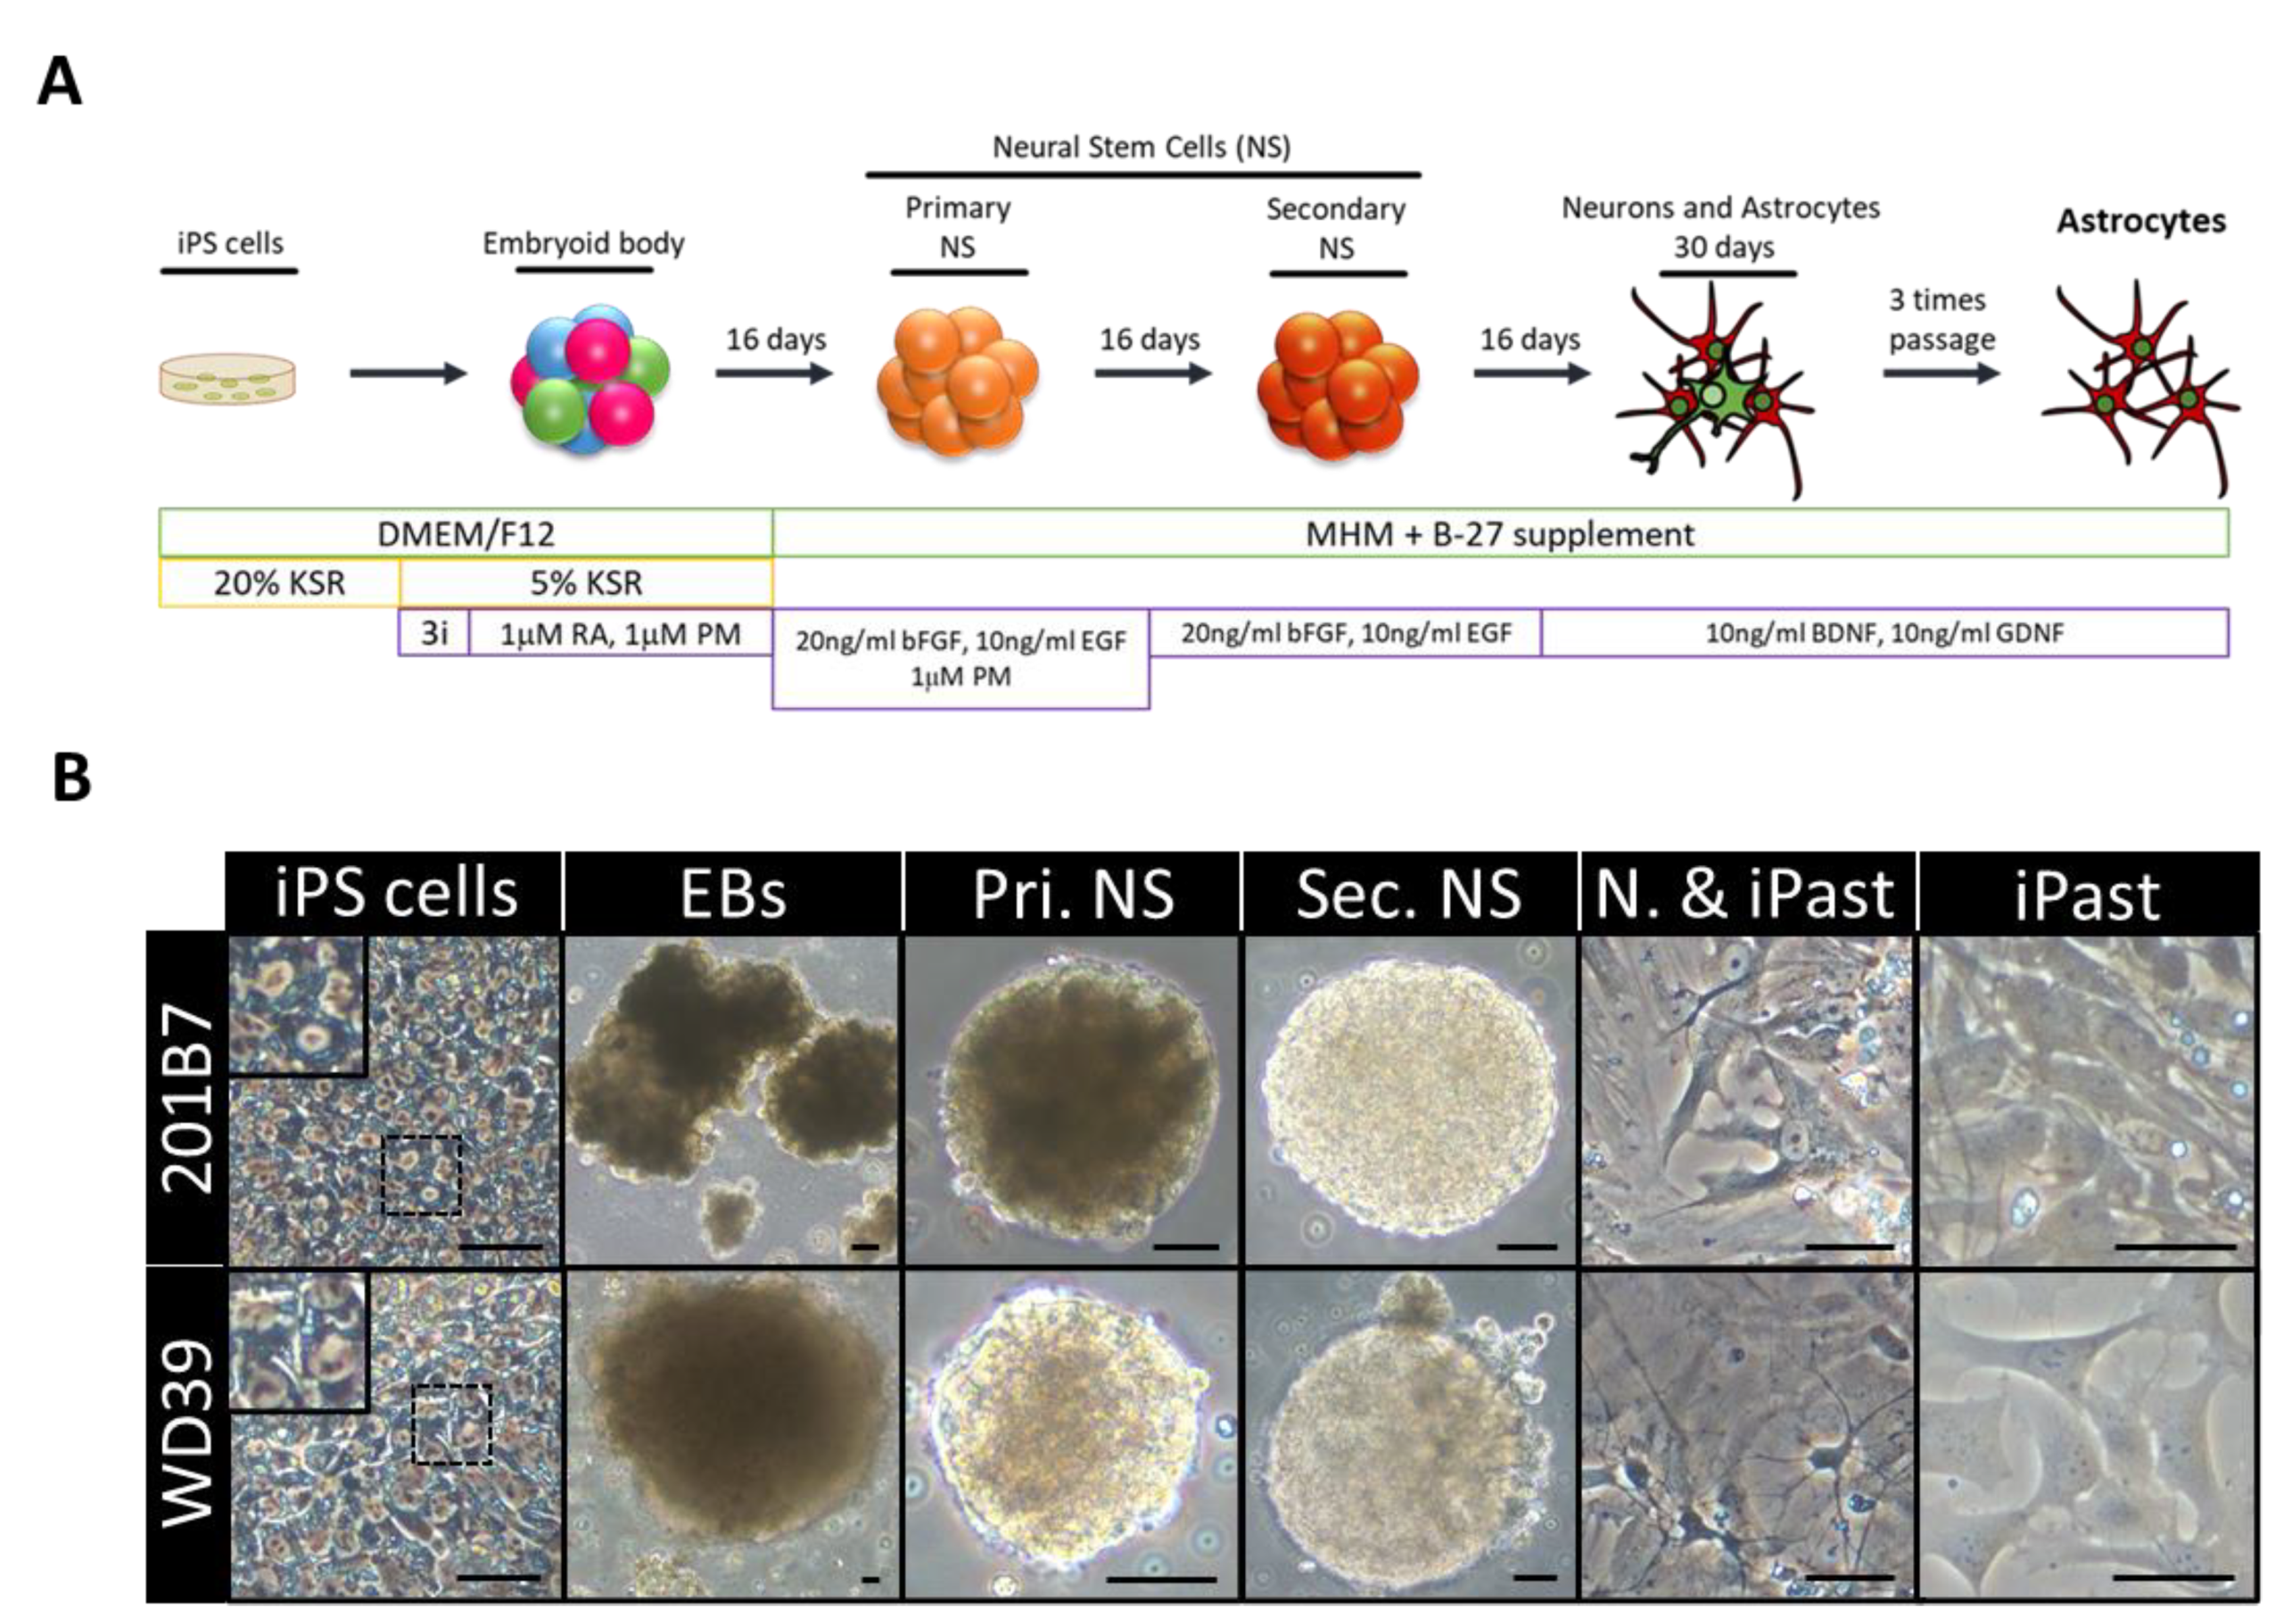
3.1. Differentiation of 201B7 and WD39 iPSC Lines Into iPasts

In the present study, we used as starting material two control iPSC lines that were previously reported—201B7 iPSC line derived from a 36-year-old healthy female [35] and WD39 iPSC line from a 16-year-old female [36]. We first evaluated the expression of the pluripotency markers SOX2, NANOG, SSEA4 and Tra1-81 by immunofluorescence to assess the quality of iPSCs (Figure S1A). Embryoid bodies (EBs) were generated from iPSCs and were directedly differentiated toward the neural lineage by the treatment with the bone morphogenetic protein inhibitor Dorsomorphin and the TGFβ inhibitor SB431542 to prevent the differentiation toward mesendodermal and non-neural ectodermal lineages [37] and with the GSK3β inhibitor CHIR99021, to direct the growth of embryoid cells into stable neuronal and glial differentiation [38] (Figure 1A). To commit the cells into the neural lineage, EBs were grown with retinoic acid [39] and purmorphamine [40] from day 7. Cells were then expanded for one month as neurospheres (NS) and differentiated into neural cells in adherent culture with brain-derived neurotrophic factor (BDNF) and glial cell-derived neurotrophic factor (GDNF) for three additional weeks. At this time point, neuron-like cells with neurites were observed, along with astrocyte-like cells with characteristic processes (Figure 1B). To eliminate neuron-like cells and purify astrocytes from the culture, the cells were repeatedly dissociated and replated. Neuron-like cells could not survive during the passages and their number decreased in culture from one passage to the other, resulting in the enrichment in astrocytic-like cells.
Finally, the obtained cells exhibited a homogenous astrocytic morphology, which prompted us to proceed to their cellular and functional characterization (Figure 1B).

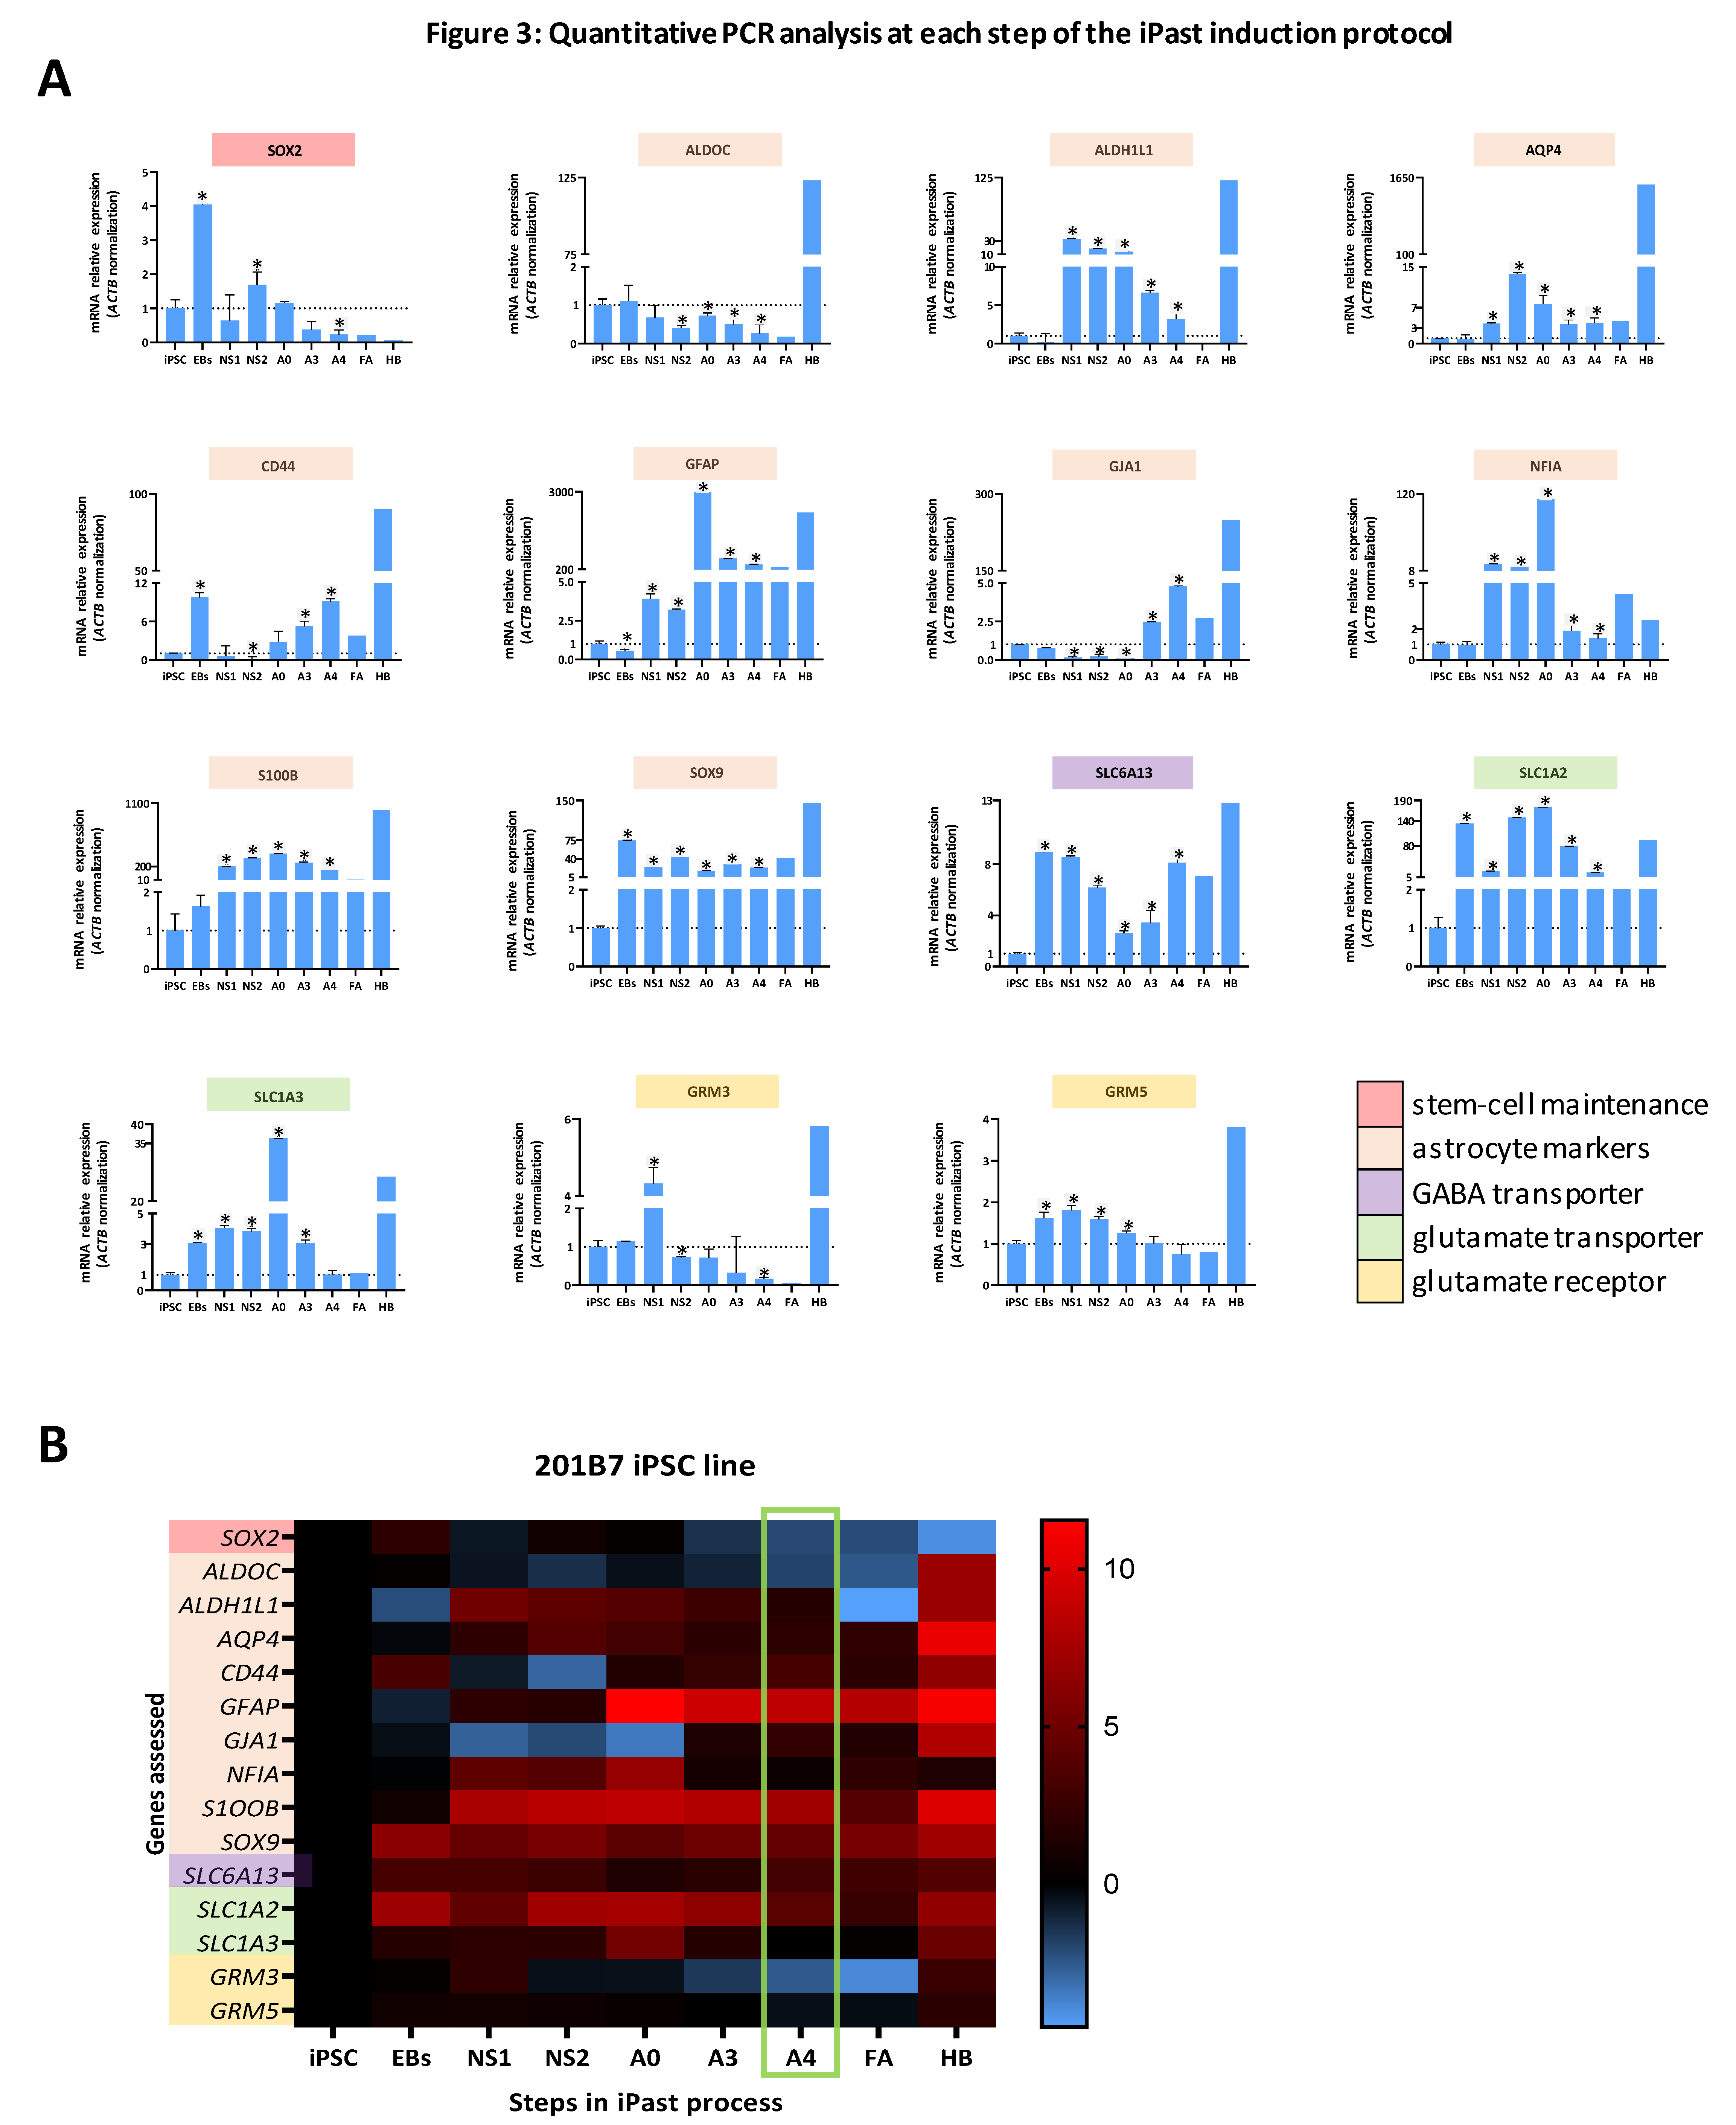
3.2. iPasts are Transcriptionally Committed to the Astrocytic Lineage

First, we examined by RNA sequencing (RNA-Seq) the transcriptomic changes during the process of cell differentiation from the state of embryoid bodies to iPasts. Principle component analysis (PCA) revealed that the gene expression profiles of iPasts were different from EBs and NS (Figure 2A): 1050 and 964 genes were significantly upregulated in iPasts and NS, respectively, compared to EBs. The neural stem cell marker SOX1 [41] and master regulators of neuronal differentiation, NEUROG2 and NEUROD1 [42], were highly upregulated in NS. On the other hand, genes known to be expressed by astrocytes such as CD44 [43], GFAP and GJA1 [44], were enriched in iPasts (Figure 2B). We then carried out a meta-analysis to compare the results of the RNA-Seq of iPasts with those of iPSC-derived astrocytes obtained by previously reported protocols [22,23] (Supplementary Table S1). We examined the expression of gene markers related to the neuronal, oligodendrocytic and astrocytic lineages (Figure 2C). All iPSC-derived astrocytes, including iPasts, expressed high levels of astrocytic markers and, conversely, poorly expressed neuronal/oligodendrocytic markers. Next, we compared these iPSC-derived astrocytes by PCA and found that the two lines of iPasts appeared closer to each other than astrocyte-lines induced by other protocols were to their relatives (Figure 2D). Finally, we examined how close iPasts were from fetal and adult human astrocytes [7]. A comparative analysis of iPasts RNA-Seq data with those of fetal and adult human astrocytes revealed that iPasts were transcriptionally closer to fetal human astrocytes than to adult astrocytes (Figure 2E).
These results indicate that iPasts have a transcriptional profile similar to previously reported iPSC-derived astrocytes, which resembles primary fetal astrocytes.

3.3. iPasts are Transcriptionally Close to Fetal Astrocytes

To support the transcriptomic data from RNA-Seq, quantitative real-time polymerase chain reaction (RT-PCR) analyses were performed (Figure 3A,B and Figure S2A,B). Genes involved in neural stem cell maintenance (SOX2), astrocyte differentiation (ALDOC, ALDH1L1, AQP4, CD44, GFAP, GJA1, NFIA, S100B and SOX9), GABA transport (SLC6A13), glutamate transport (SLC1A2 and SLC1A3) and glutamate receptors (GRM3 and GRM5) were selected. A fetal astrocyte cell line (referred to as FA) and a human brain sample (referred to as HB) were used as control samples. The expression of the transcription factor SOX2, which indicates an undifferentiated state in neural stem cells, was high in EBs and, to a lesser extent, in NS, whereas its expression was gradually decreased in iPasts along passaging. Conversely, most of the astrocyte differentiation markers were upregulated along iPasts differentiation. Importantly, the expression levels of those markers in iPasts were similar to their level in human FA. We also noted a statistically significant burst in the transcription of SLC1A3, observable in A0-step for the cell line 201B7 and in A3-step for the cell line WD39. For both iPast lines, the expression level of SLC1A3 in A4-step had decreased to the level in FA. Consistently, SLC1A2 was significantly increased in A4-iPasts compared to FA. These results demonstrate the mature differentiation of iPasts as SLC1A3 is known to be preferentially expressed in the developing brain, whereas SLC1A2 is found in the adult brain [45]. Conversely, GRM3 and GRM5, known to be highly expressed in adult human brains, were only weakly expressed in iPasts and FA.
Collectively, our results indicate that A4-iPasts are transcriptionally closer to fetal astrocytes rather than to mature astrocytes.

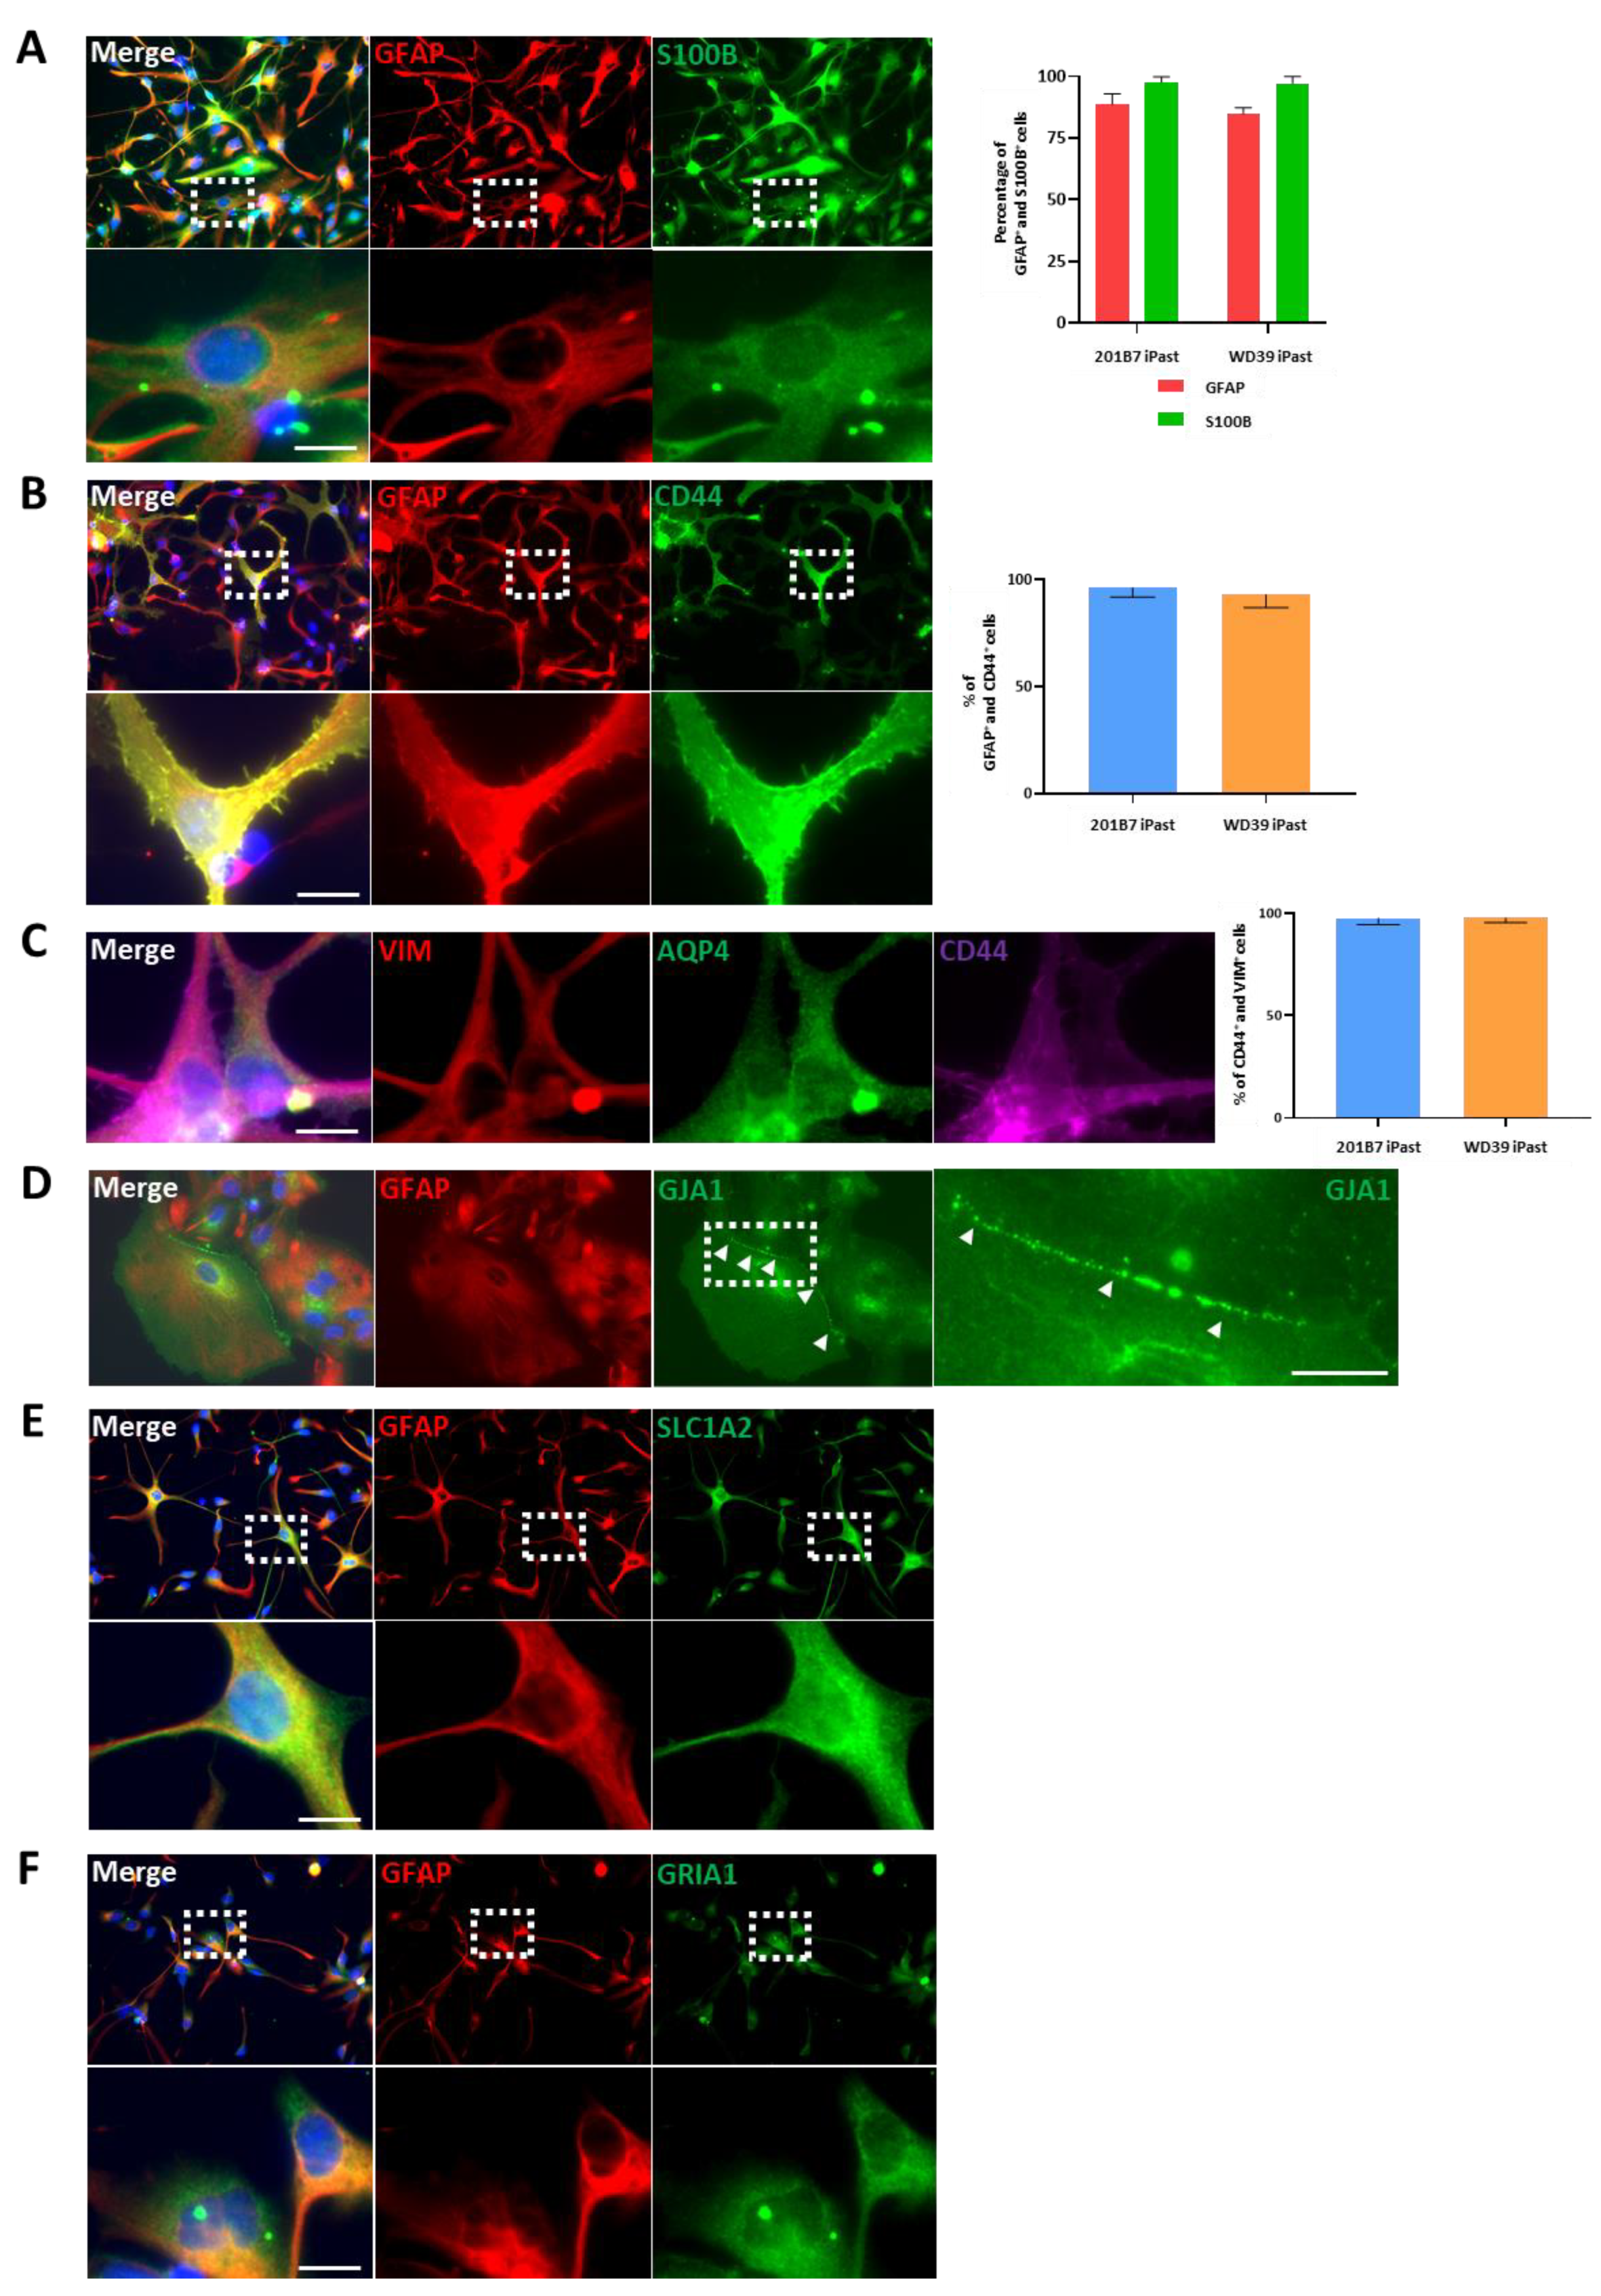
3.4. iPasts Express Proteins of the Astrocytic Lineage

After having characterized iPast lines at the RNA (transcriptome) level, we examined by immunofluorescence the expression of various proteins: TUBB3 (neuronal lineage), O4/OLIG2 (oligodendrocytic lineage) or AIF1 (microglia/macrophage activation marker) could not be detected (Figure S1B,C, upper panels) in iPasts. The effective detection of these proteins with our antibodies was confirmed using positive controls (Figure S3A–C,E). We then sought to determine whether iPasts expressed key proteins of the astrocyte lineage, such as GFAP and S100B (Figure 4A, left panel, S2C and S3K). Our results showed that while iPasts are predominantly GFAP+ (> 80%), they are almost exclusively S100B+ (>95%) (Figure 4, right panel). Based on this result, we next investigated whether iPasts expressed CD44 (Figure 4B, left panel, Figures S2D and S3I), as astrocytes co-expressing GFAP, S100B and CD44 are considered to be relatively immature astrocytes [46]. GFAP+ iPasts were also positive for CD44, confirming that iPasts are most likely immature astrocytes. This notion was also supported by the expression of Vimentin (Figure 4C left panel, Figures S2E and S3G), which is expressed by immature astrocytes [47]. We next examined the expression of AQP4 (Figure 4C left, Figures S2E and S3G), a water channel which is expressed during astrocytic maturation [15]. However, we found that only a sub-population of astrocytes expressed AQP4 (less than 10%). On the other hand, GJA1, a protein of intercellular gap junction complexes, which is expressed in astrocytes during the perinatal period [48], was strongly expressed (Figure 4D, Figures S2C and S3J), in particular at the junction between two iPasts (Figure 4D-right panel). We also confirmed the expression of SLC1A2 and GRIA1, which regulate glutamate dynamics in astrocytes (Figure 4E,F, Figures S2F,G and S3D,F).
These results demonstrate that iPasts express key markers of astrocytic identity and suggest the functionality of iPasts.

3.5. iPasts Can Become Reactive Astrocytes

To investigate the capacity of iPasts to turn from quiescent to reactive astrocytes, we questioned the effect of culture medium regarding the transcription of key genes of the astrocytic lineage. Therefore, we compared the influence of our differentiation medium (iPast medium) vs. DMEM/F12 supplemented with 10% FBS or 100 ng/µL FGF-2 on the transcription of GFAP, S100B, SLC1A2 and SLC1A3 in iPasts (Figure 5A). When cultured with FGF-2, iPasts showed a reduced transcription of these four genes. Regarding GFAP, this result is consistent with previous work showing that FGF-2 decreases astrocyte activation by reducing the level of GFAP expression [49]. Conversely, iPasts cultured with FBS showed an increased transcription of GFAP and SLC1A2, genes associated with the status of activated mature astrocytes but had fewer transcripts for S100B and SLC1A3 than iPasts grown in our medium. Using automatic image analysis by IN Cell Analyzer, we analyzed the distribution of GFAP+-iPasts depending on the individual mean GFAP intensity. iPasts were cultured in iPast medium or in the presence of 10% FBS and human fetal astrocytes cell culture (FAC) were used as positive control (Figure 5B). iPasts were classified into six classes of GFAP-fluorescence. Our data confirmed that culture in 10% FBS induced a significant shift toward a higher GFAP-immunofluorescence in the three sources of astrocytes examined.
These experiments indicate that iPasts can adapt their transcriptional profile depending on the medium and turn from quiescent to reactive astrocytes if cultured with FBS.

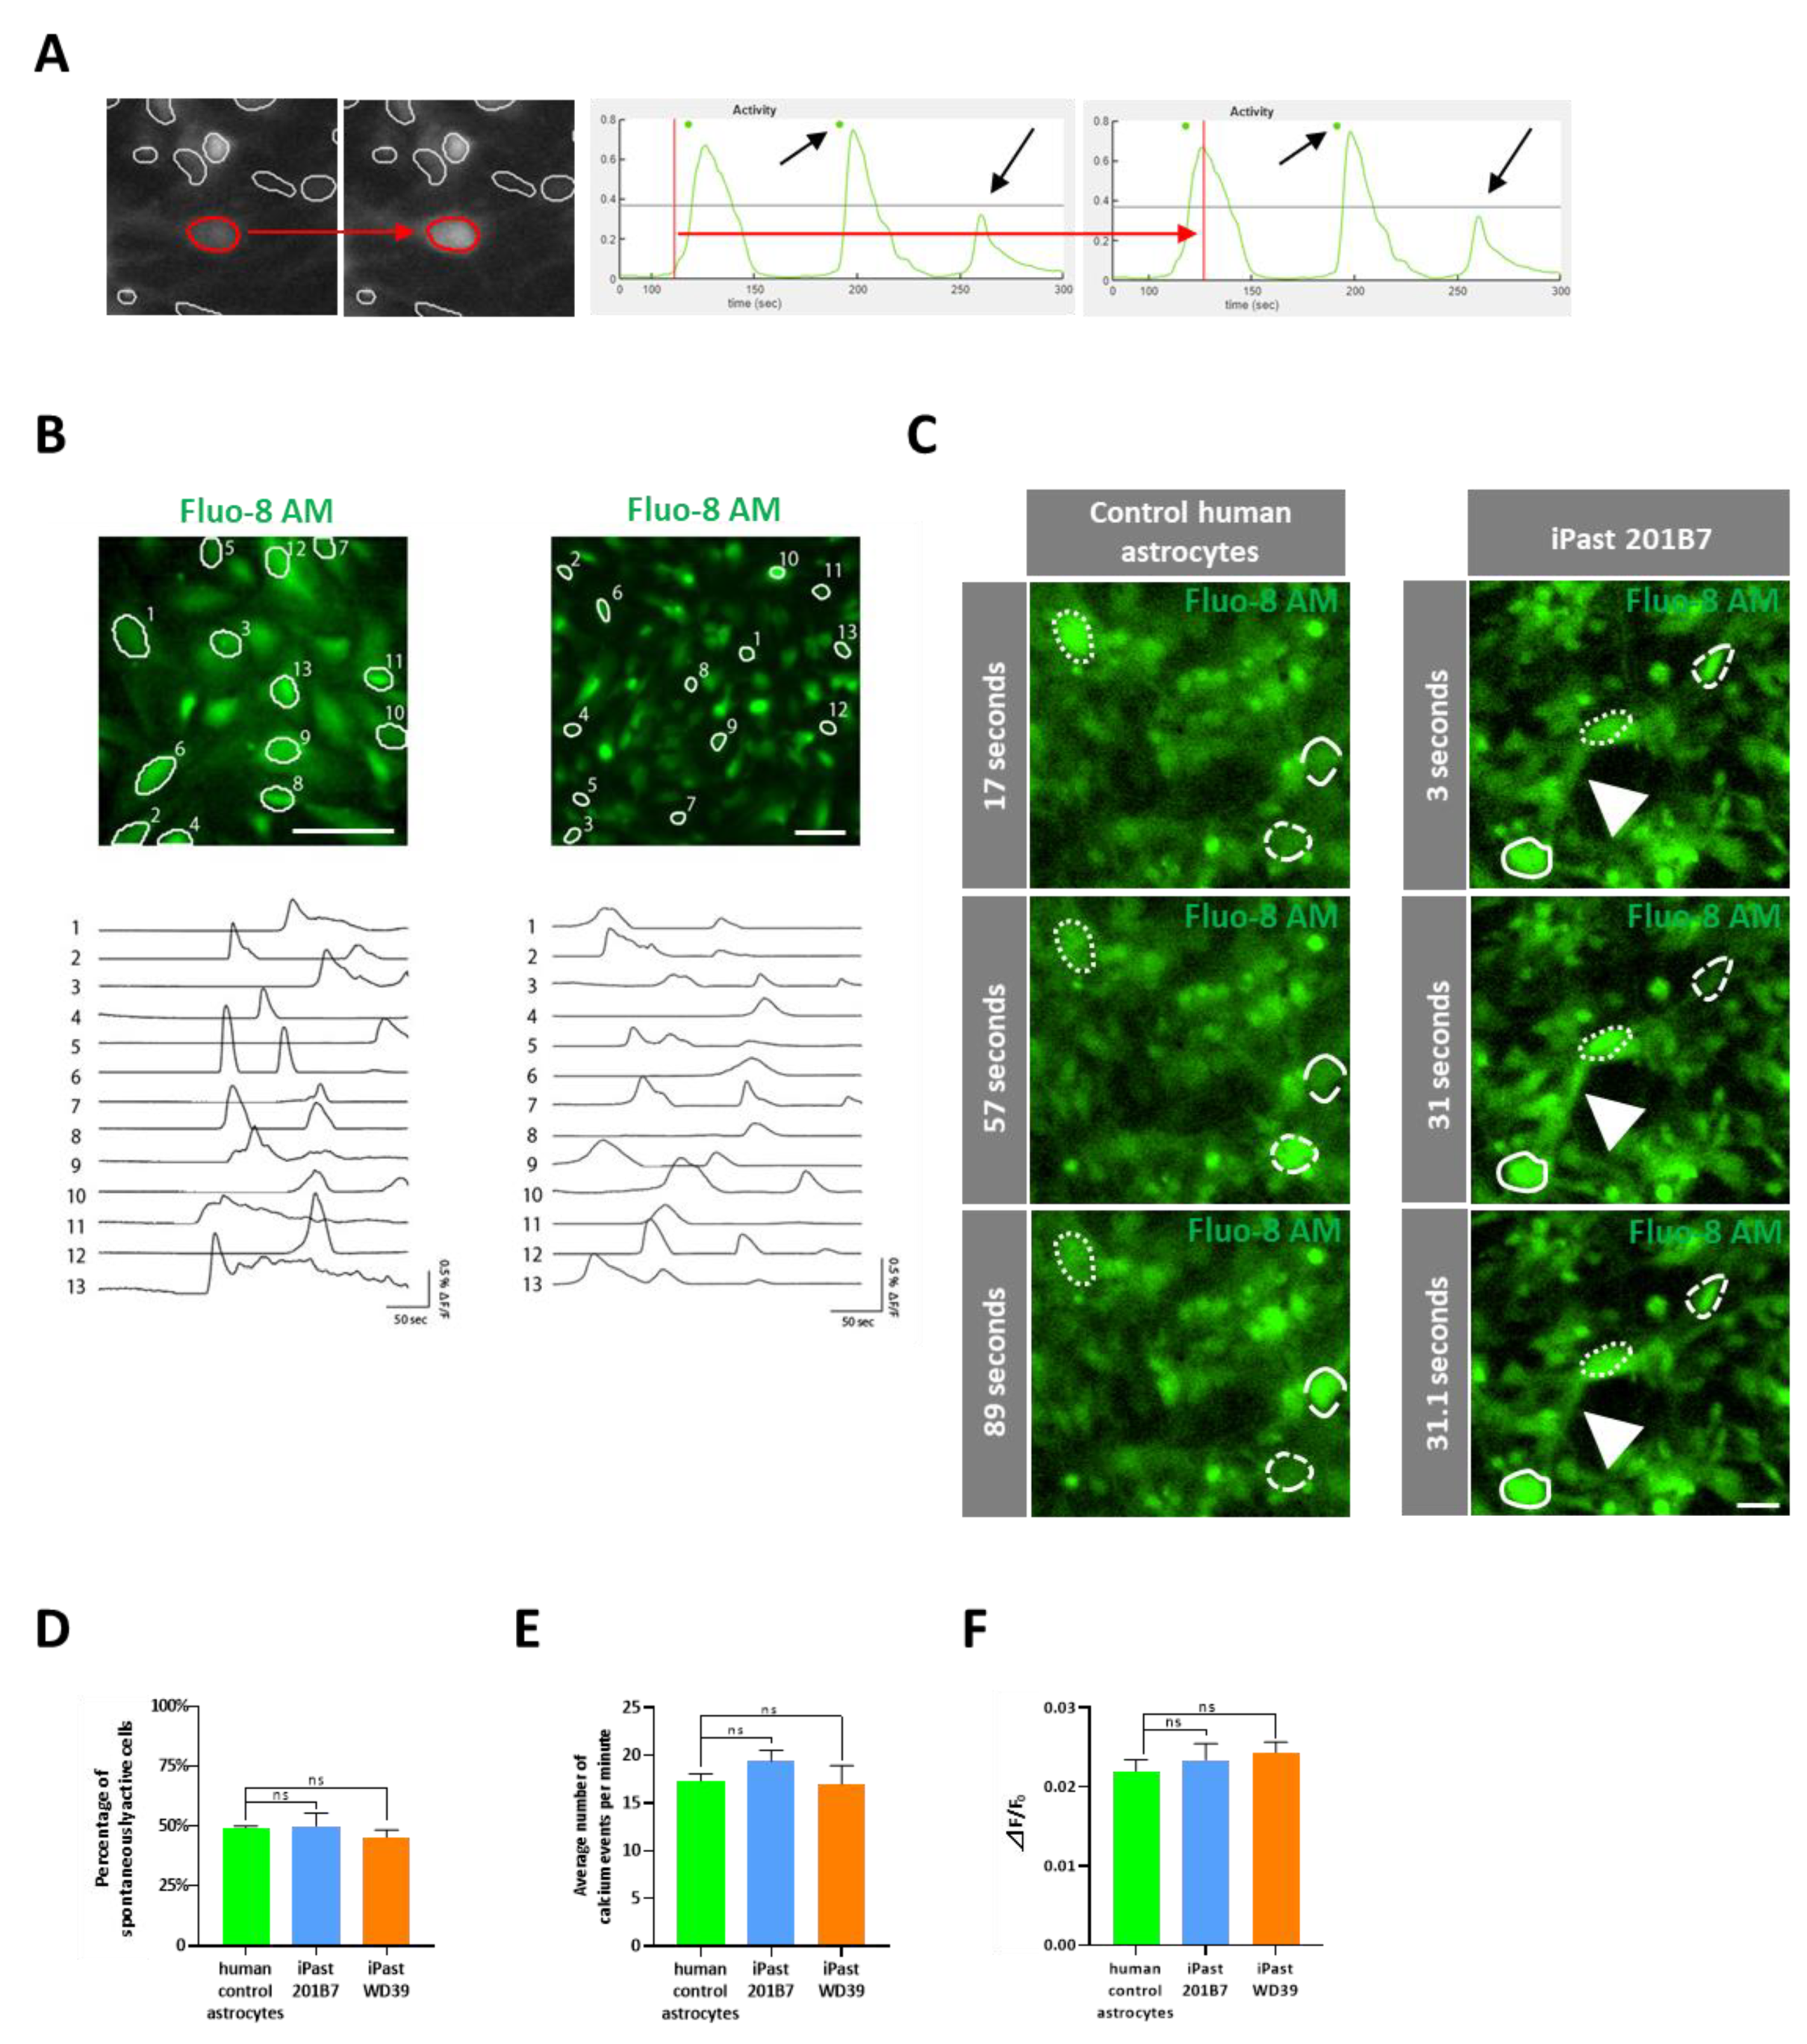
3.6. iPasts are Functional

Based on recent reports which underscored the importance of calcium levels in astrocytes to modulate neuronal functionality [50,51], in order to elucidate the functionality of iPasts, we first investigated astrocytic calcium signaling, indicative of the intercellular communication network between astrocytes [52,53,54]. To monitor calcium dynamics, we performed calcium imaging using Fluo-8 AM, a calcium indicator that has twice the fluorescence intensity of Fluo-4 AM. Image analysis was performed with custom scripts based on MIN1PIPE [28] to facilitate semi-automated detection and analysis of calcium dynamics in astrocyte (Figure 6A). iPasts displayed spontaneous and periodic calcium transients, as observed in control human FA (Figure 6B, Figure S2H and Supplementary movie 1). This result is in favor of an astrocytic phenotype, given that neuronal calcium activity is much faster. The calcium activity could be observed both in the soma and processes of astrocytes (Figure 6C). There were no differences in the percentage of spontaneously active cells (Figure 6D), the number of calcium events per minute (Figure 6E) and the amplitude of calcium events (Figure 6F) between the human control astrocytes and iPasts. These data imply that iPasts exhibit calcium dynamics features similar to primary human fetal astrocytes.
We next addressed the effect of iPasts on neurons. Indirect co-culture of iPasts with iPSC-derived neurons revealed that Synapsin1 expression in neurons was drastically upregulated in the presence of iPasts (Figure 7A and Figure S3E,G). Given that Synapsin1 has an essential function in neuronal synapse regulation [55,56,57,58], our results indicate that iPasts have a supporting effect on neuronal maturation.
In connection with the high expression in iPasts of SLC1A2 glutamate transporter (Figure 4E), which contributes to ~90% of glutamate uptake by astrocytes [45] and because glutamate clearance from the synaptic cleft terminates glutamatergic transmission in vivo and prevents glutamatergic excitotoxicity, we next assessed whether iPasts could uptake glutamate. Using the starting iPSC lines as negative controls and the human astrocyte line as a positive control, we exposed iPasts to 250 µM of glutamate and quantified the glutamate uptake one, two and four hours after the incorporation of glutamate (Figure 7B). Our experiments demonstrated that iPasts were capable of taking up glutamate in a time-dependent manner and in the same order of magnitude that the human fetal control astrocytes, in contrast with the starting iPSC lines.
Astrocytes have a characteristic glucose metabolism in which glycolysis dominates tricarboxylic acid (TCA) cycle activity. Accordingly, pyruvate is mainly converted into lactate, which is transported from astrocytes to neurons, through monocarboxylate transporters (MCTs). In neurons, lactate is subsequently oxidized into pyruvate by LDH1, resulting in a neuronal TCA cycle activity that predominates over the intracytoplasmic glycolysis. Therefore, we finally questioned whether iPasts could have any glycolytic activity. For this purpose, we quantified the rate of [1-14C]-glucose and [6-14C]-glucose oxidation. [1-14C]-glucose is metabolized both in TCA cycle and pentose-phosphate pathway (PPP), whereas [6-14C]-glucose is metabolized only in TCA cycle. iPasts exhibited a substantial metabolic capacity of total glucose oxidation but a negligible oxidative metabolism through the TCA cycle, indicative of a low mitochondrial glycolytic activity (Figure 7C). These results in iPasts mirror the metabolic preferences observed in rodent astrocytic cells in vitro [59,60].

4. Discussion

In the present study, we characterized iPasts obtained from iPSC lines by our original protocol and provided pieces of evidence of essential astrocytic functions in iPasts. The transcriptomic and protein expression analyses suggest that iPasts are immature astrocytes. Nonetheless, we found that iPasts exhibited several important aspects of functional astrocytes, including calcium dynamics, neuronal synapse maturation, glutamate uptake activity and glucose metabolism.
During the embryonic development, astrogenesis follows neurogenesis [61]. The transition from neurogenesis to astrogenesis is a complex process governed by genetic/epigenetic intracellular mechanisms [61,62,63,64,65,66] and by extracellular factors [63,67]. In our protocol, although we did not intentionally modulate any signaling involved in astrogenesis, the long-term culture of iPSC-derived neural cells appears to mirror the developmental transition from neurogenesis to astrogenesis. The choice of our initial culture method, that is, adherent culture vs. embryoid bodies, is based on the relevant literature. First, the expression of GFAP was lower in astrocytes generated from adherent cultures compared with astrocytes generated from embryoid bodies [15,68]. Accordingly, a large proportion of iPasts express GFAP. Second, adherent culture seemed less relevant to the natural developmental process characterized by numerous intercellular contacts than 3D cultures such as embryoid bodies and neurospheres. Finally, it should be emphasized that the embryoid bodies approach allowed us to compare our RNA-Seq data set with the results of other research groups that also used non-adherent cultures.
Our protocol has the advantage of generating a highly homogeneous population of iPasts, which would be helpful for disease modeling in vitro (Figure S1B,C lower panels). In our present protocol, the three final passages are likely to play a crucial role in obtaining high-purity cultures of astrocytes by eliminating neuronal cells. Indeed, the neuronal marker TUBB3 was significantly downregulated from A0-step to A4-step (Figure S1C). Thus, this final-passages stage constitutes an improvement of the present method compared with other protocols [16,18] for the enrichment of iPSCs-derived astrocytes. On the other hand, this purity might also interfere with the functionality of astrocytes. Previous studies have indeed reported the important role of neurons in astrocyte differentiation and gene expression [69,70,71]. In vitro, neurons can modulate the expression of glutamate transporters in astrocytes. Polygonal cortical astrocytes turn into SLC1A2+-astrocytes with a stellar shape when co-cultured with neurons [69]. In addition, previous reports showed that the expression of SLC1A2 and SLC1A3 in astrocytes was modulated by neuronal soluble factors [72,73], indicating that normal protein expression by astrocytes requires neuronal upstream signaling. In our cultures, the expression of some markers, including ALDOC, ALDH1L1 and GRM5, were reduced in parallel with the progressive elimination of neuronal cells. This may suggest that iPasts co-cultured with neurons could become transcriptionally more mature. While we have demonstrated the effect of co-culture on neuronal maturation, its effect on astrocytic maturation should be investigated in a future study.
When considering the robustness of our iPast protocol, our gene expression analyses revealed several differences between 201B7 and WD39 iPSC lines-derived iPasts in terms of timing (e.g., A0 vs. a later passage) or magnitude of the changes observed (see e.g., AQP4, NFIA or SLC1A3). It has already been reported that 201B7 and WD39 iPSC lines differ in their propensity to naturally differentiate into different lineages. Indeed, while 201B7 iPSCs can spontaneously differentiate easily toward the ectodermal lineage, WD39 iPSCs preferentially express markers characteristic of the mesendodermal lineage [74]. Thus, it is possible that the terminal differentiation of iPSCs into iPasts is partly governed by the clonal variations of iPSC lines. Nevertheless, the treatment with dual SMAD inhibitors along with GSK3β inhibitor can overcome these clonal variations to some extent [38] and the whole gene expression pattern of iPasts from each iPSC lines are very similar (Figure 2D). Thus, despite some differences, our iPast protocol can generate homogenous astrocytes, independently from the starting iPSC clones and should be helpful for generating astrocytes from disease-specific iPSC lines.
Regarding glycolytic metabolism, we provided pieces of evidence of a highly glycolytic metabolism but a low mitochondrial activity in iPasts. We can hypothesize that this low mitochondrial metabolism mirrors the in vivo actual metabolism of glucose. In fact, neurons do not have any direct contacts with micro-vessels despite their strict dependence on a continuous supply of glucose and oxygen through the cerebral blood flow. In contrast, 99% of the surfaces of brain capillaries are covered by astrocytic processes (end-feet), indicating that all essential nutrients supplied from the cerebral circulation must interact with astroglia before reaching the neurons [75]. As astrocytes are interposed between neurons and cerebral micro-vessels, we can assume that glycolytic metabolism, among other metabolic functions, occurs in astrocytes for the benefit of neurons [60]. Considering that most evidence is based on in vitro studies using rodent neural cell cultures that might not be an appropriate model for human brain cells [76], the high glycolytic metabolic activity associated with lactate production might be a characteristic of rodent cell cultures only. Importantly, however, the present study demonstrated for the first time that human astrocytes may also possess a high glycolytic activity.
The use of differentiated cells from iPSCs technology, as in the present report, enables the evaluation of human astroglia in vitro and their relationship with neurons, through co-cultures.

5. Conclusions

In the present study, we report a culture protocol to generate astrocytes from human iPSCs (iPasts). Based on the expression of various markers, iPasts are likely to correspond to immature astrocytes. However, iPasts showed functional characteristics of astrocytes such as spontaneous calcium oscillation, glutamate uptake, dominant anaerobic glycolytic activity and supporting effects on neuronal maturation. Thus, the availability of iPasts will help to address the contribution of astrocytes to the development of neurodegenerative diseases and open the possibility of testing candidate drugs in an in vitro context firstly, before eventually developing in vivo models.

Supplementary Materials

The following are available online at https://www.mdpi.com/2073-4409/9/12/2680/s1, Figure S1: Quality control of the lineage of the cell lines by immunofluorescence, Figure S2: Characterization of the iPast lines differentiated from WD39 iPSC line, Figure S3: Controls for immunofluorescent stainings, Table S1: Published RNA-seq data used in this study, Table S2: Gene sets used in Figure 2E, Table S3: List of primers and antibodies used, Video S1: The movie shows representative calcium imaging data from human control-astrocytes and iPasts.

Author Contributions

S.M. designed the protocol of cell culture. N.L. and S.M. performed the experiments, analyzed the data and wrote the manuscript. K.I. performed the RNA-Seq analysis. Y.S. preprocessed the data of calcium imaging by MIN1PIPE and designed the software for interpretation. S.T. and K.M. performed the experiments on cell metabolism and provided a grant to the study. M.I. instructed, supervised cell culture and prepared the samples for RNA-Seq. I.S. grew the microglial cells, performed the immunostaining and imaged the cells. T.K. designed the software for calcium imaging interpretation. H.W. instructed, supervised cell culture and prepared the samples for RNA-Seq. H.O. corrected the manuscript, provided the grants and oversaw the research program. All authors have read and agreed to the published version of the manuscript.

Funding

The work was supported by the Research Center Network for Realization Research Centers/Projects of Regenerative Medicine (the program for Intractable Disease Research Utilizing Disease-specific iPS Cells) from AMED (grant nos. JP17bm0804014, JP18bm0804014 and JP19bm0804014 to M.I.; JP15bm0609003, JP16bm0609003, JP17bm0609003, JP17bm0804003, JP18bm0804003, JP19bm0804003 and JP20bm0804003 to H.O.), a grant-in-aid of the Research Consortium of Kii ALS/PDC from the Japan Agency for Medical Research and Development from AMED (grant nos. JP17ek0109139 to M.I), the research Project for Practical Application of Regenerative Medicine from AMED (grant nos. JP15bk0104027, JP 16bk0104016 and JP 17bk0104016 to H.O.) and the Japan Society for the Promotion of Science KAKENHI (grant nos. 15J03921 and 19K17002 to S.M., 17K09762 and 19K08002 to S.T., 20K16502 to K.M.). This research was also supported by internal budgets from Keio University including the Program for the Advancement of Research in Core Projects on Longevity of the Keio University Global Research Institute from Keio University (to H.O.).

Acknowledgments

The authors would like to thank Satoshi Okamoto, Miho Isoda, Zhou Zhi, Shiho Nakamura and Fumiko Ozawa (Keio University) for technical supports and all the members of the H.O. laboratory for their encouragement and kind support, as well as Charlotte Huguet for graphical abstract help. We thank Masaki Takao and Mitsutoshi Tano (Mihara Memorial Hospital) for preparing the frozen human control brain sample provided by the Platform of Supporting Cohort Study and Biospecimen Analysis, Grant-in-Aid for Scientific Research on Innovative Areas-Platforms for Advanced Technologies and Research Resources, Ministry of Education, Culture, Sports, Science and Technology, Japan. We would also like to thank Takashi Sasaki (Keio University) for RNA-Seq analysis, Shinya Yamanaka, Keisuke Okita and Makoto Nakagawa (Kyoto University) for kindly providing 201B7 and 1210B2 iPSC lines. The final draft of this manuscript has been edited by Francois Renault-Mihara (ClearBioEditing).

Conflicts of Interest

H.O. is a scientific consultant for SanBio, Co. Ltd. and K Pharma Inc. The other authors declare neither financial nor non-financial competing interests.

References

  1. Cassina, P.; Cassina, A.; Pehar, M.; Castellanos, R.; Gandelman, M.; De León, A.; Robinson, K.M.; Mason, R.P.; Beckman, J.S.; Barbeito, L.; et al. Mitochondrial Dysfunction in SOD1G93A-Bearing Astrocytes Promotes Motor Neuron Degeneration: Prevention by Mitochondrial-Targeted Antioxidants. J. Neurosci. 2008, 28, 4115–4122. [Google Scholar] [CrossRef] [Green Version]
  2. Merlini, M.; Meyer, E.P.; Ulmann-Schuler, A.; Nitsch, R.M. Vascular β-amyloid and early astrocyte alterations impair cerebrovascular function and cerebral metabolism in transgenic arcAβ mice. Acta Neuropathol. 2011, 122, 293–311. [Google Scholar] [CrossRef] [Green Version]
  3. Almad, A.A.; Doreswamy, A.; Gross, S.K.; Richard, J.-P.; Huo, Y.; Haughey, N.; Maragakis, N.J. Connexin 43 in astrocytes contributes to motor neuron toxicity in amyotrophic lateral sclerosis. Glia 2016, 64, 1154–1169. [Google Scholar] [CrossRef] [PubMed] [Green Version]
  4. Qian, K.; Huang, H.; Peterson, A.; Hu, B.; Maragakis, N.J.; Ming, G.-L.; Chen, H.; Zhang, S.-C. Sporadic ALS Astrocytes Induce Neuronal Degeneration In Vivo. Stem Cell Rep. 2017, 8, 843–855. [Google Scholar] [CrossRef] [PubMed]
  5. Nedergaard, M.; Ransom, B.; Goldman, S.A. New roles for astrocytes: Redefining the functional architecture of the brain. Trends Neurosci. 2003, 26, 523–530. [Google Scholar] [CrossRef] [PubMed]
  6. Oberheim, N.A.; Takano, T.; Han, X.; He, W.; Lin, J.H.C.; Wang, F.; Xu, Q.; Wyatt, J.D.; Pilcher, W.; Ojemann, J.G.; et al. Uniquely Hominid Features of Adult Human Astrocytes. J. Neurosci. 2009, 29, 3276–3287. [Google Scholar] [CrossRef]
  7. Zhang, Y.; Sloan, S.A.; Clarke, L.E.; Caneda, C.; Plaza, C.A.; Blumenthal, P.D.; Vogel, H.; Steinberg, G.K.; Edwards, M.S.; Li, G.; et al. Purification and Characterization of Progenitor and Mature Human Astrocytes Reveals Transcriptional and Functional Differences with Mouse. Neuron 2016, 1, 37–53. [Google Scholar] [CrossRef] [Green Version]
  8. Kondo, T.; Funayama, M.; Miyake, M.; Tsukita, K.; Era, T.; Osaka, H.; Ayaki, T.; Takahashi, R.; Inoue, H. Modeling Alexander disease with patient iPSCs reveals cellular and molecular pathology of astrocytes. Acta Neuropathol. Commun. 2016, 1, 69. [Google Scholar] [CrossRef] [Green Version]
  9. Oksanen, M.; Petersen, A.J.; Naumenko, N.; Puttonen, K.; Lehtonen, S.; Gubert Olive, M.; Shakirzyanova, A.; Leskela, S.; Sarajarvi, T.; Viitanen, M.; et al. Psen1 mutant ipsc-derived model reveals severe astrocyte pathology in alzheimer’s disease. Stem Cell Rep. 2017, 9, 1885–1897. [Google Scholar] [CrossRef] [Green Version]
  10. Sofroniew, M.V.; Vinters, H.V. Astrocytes: Biology and pathology. Acta Neuropathol. 2009, 119, 7–35. [Google Scholar] [CrossRef] [Green Version]
  11. Lin, C.C.J.; Yu, K.; Hatcher, A.; Huang, T.W.; Lee, H.K.; Carlson, J.; Weston, M.C.; Chen, F.; Zhang, Y.; Zhu, W.; et al. Identification of diverse astrocyte populations and their malignant analogs. Nat. Neurosci. 2017, 3, 396405. [Google Scholar]
  12. Bezzi, P.; Volterra, A. A neuron-glia signalling network in the active brain. Curr. Opin. Neurobiol. 2001, 3, 387–394. [Google Scholar] [CrossRef]
  13. Santello, M.; Volterra, A. Neuroscience: Astrocytes as aide-mémoires. Nature 2010, 7278, 169–170. [Google Scholar] [CrossRef] [PubMed]
  14. Janssen, K.; Bahnassawy, L.; Kiefer, C.; Korffmann, J.; Terstappen, G.C.; Lakics, V.; Reinhardt, P. Generating Human iPSC-Derived Astrocytes with Chemically Defined Medium for In Vitro Disease Modeling 2019. In Cell-Based Assays Using iPSCs for Drug Development and Testing; Mandenius, C.F., Ross, J., Eds.; Methods in Molecular Biology: New York, NY, USA, 1994. [Google Scholar]
  15. Roybon, L.; Lamas, N.J.; Garcia-Diaz, A.; Yang, E.J.; Sattler, R.; Jackson-Lewis, V.; Kim, Y.A.; Kachel, C.A.; Rothstein, J.D.; Przedborski, S.; et al. Human Stem Cell-Derived Spinal Cord Astrocytes with Defined Mature or Reactive Phenotypes. Cell Rep. 2013, 4, 1035–1048. [Google Scholar] [CrossRef] [PubMed] [Green Version]
  16. Soubannier, V.; Maussion, G.; Chaineau, M.; Sigutova, V.; Rouleau, G.; Durcan, T.M.; Stifani, S. Characterization of human iPSC-derived astrocytes with potential for disease modeling and drug discovery. Neurosci. Lett. 2020, 731, 135028. [Google Scholar] [CrossRef] [PubMed]
  17. Krencik, R.; Zhang, S.-C. Directed differentiation of functional astroglial subtypes from human pluripotent stem cells. Nat. Protoc. 2011, 6, 1710–1717. [Google Scholar] [CrossRef] [PubMed] [Green Version]
  18. Hedegaard, A.; Monzón-Sandoval, J.; Newey, S.E.; Whiteley, E.S.; Webber, C.; Akerman, C.J. Pro-maturational Effects of Human iPSC-Derived Cortical Astrocytes upon iPSC-Derived Cortical Neurons. Stem Cell Rep. 2020, 1, 38–51. [Google Scholar] [CrossRef]
  19. Palm, T.; Bolognin, S.; Meiser, J.; Nickels, S.; Träger, C.; Meilenbrock, R.-L.; Brockhaus, J.; Schreitmüller, M.; Missler, M.; Schwamborn, J.C. Rapid and robust generation of long-term self-renewing human neural stem cells with the ability to generate mature astroglia. Sci. Rep. 2015, 5, 16321. [Google Scholar] [CrossRef] [Green Version]
  20. Aldana, B.I.; Zhang, Y.; Jensen, P.; Chandrasekaran, A.; Christensen, S.K.; Nielsen, T.T.; Nielsen, J.E.; Hyttel, P.; Larsen, M.R.; Waagepetersen, H.S.; et al. Glutamate-glutamine homeostasis is perturbed in neurons and astrocytes derived from patient iPSC models of frontotemporal dementia. Mol. Brain 2020, 13, 1–17. [Google Scholar] [CrossRef]
  21. Okada, Y.; Matsumoto, A.; Shimazaki, T.; Enoki, R.; Koizumi, A.; Ishii, S.; Itoyama, Y.; Sobue, G.; Okano, H. Spatiotemporal Recapitulation of Central Nervous System Development by Murine Embryonic Stem Cell-Derived Neural Stem/Progenitor Cells. Stem Cells 2008, 26, 3086–3098. [Google Scholar] [CrossRef]
  22. Tcw, J.; Wang, M.; Pimenova, A.A.; Bowles, K.R.; Hartley, B.J.; Lacin, E.; Machlovi, S.I.; Abdelaal, R.; Karch, C.M.; Phatnani, H.; et al. An Efficient Platform for Astrocyte Differentiation from Human Induced Pluripotent Stem Cells. Stem Cell Rep. 2017, 9, 600–614. [Google Scholar] [CrossRef] [PubMed] [Green Version]
  23. Tchieu, J.; Calder, E.L.; Guttikonda, S.R.; Gutzwiller, E.M.; Aromolaran, K.A.; Steinbeck, J.A.; Goldstein, P.A.; Studer, L. NFIA is a gliogenic switch enabling rapid derivation of functional human astrocytes from pluripotent stem cells. Nat. Biotechnol. 2019, 37, 267–275. [Google Scholar] [CrossRef] [PubMed]
  24. Kechin, A.; Boyarskikh, U.; Kel, A.; Filipenko, M. cutPrimers: A New Tool for Accurate Cutting of Primers from Reads of Targeted Next Generation Sequencing. J. Comput. Biol. 2017, 24, 1138–1143. [Google Scholar] [CrossRef] [PubMed]
  25. Kim, D.; Paggi, J.M.; Park, C.; Bennett, C.; Salzberg, S.L. Graph-based genome alignment and genotyping with HISAT2 and HISAT-genotype. Nat. Biotechnol. 2019, 37, 907–915. [Google Scholar] [CrossRef]
  26. Liao, Y.; Smyth, G.K.; Shi, W. featureCounts: An efficient general purpose program for assigning sequence reads to genomic features. Bioinformatics 2013, 30, 923–930. [Google Scholar] [CrossRef] [Green Version]
  27. Love, M.I.; Huber, W.; Anders, S. Moderated estimation of fold change and dispersion for RNA-seq data with DESeq2. Genome Biol. 2014, 12, 550. [Google Scholar] [CrossRef] [Green Version]
  28. Lu, J.; Li, C.; Singh-Alvarado, J.; Zhou, Z.C.; Fröhlich, F.; Mooney, R.; Wang, F. MIN1PIPE: A Miniscope 1-Photon-Based Calcium Imaging Signal Extraction Pipeline. Cell Rep. 2018, 23, 3673–3684. [Google Scholar] [CrossRef]
  29. Telezhkin, V.; Schnell, C.; Yarova, P.L.; Yung, S.; Cope, E.; Hughes, A.; Thompson, B.A.; Sanders, P.; Geater, C.; Hancock, J.M.; et al. Forced cell cycle exit and modulation of GABAA, CREB and GSK3β signaling promote functional maturation of induced pluripotent stem cell-derived neurons. Am. J. Physiol.-Cell Physiol. 2016, 310, C520–C541. [Google Scholar] [CrossRef] [Green Version]
  30. Camacho, I.M.E.; Michelsen, K.A.; Gall, D.; Linaro, D.; Hasche, A.; Bonnefont, J.; Bali, C.; Orduz, D.; Bilheu, A.; Herpoel, A.; et al. Pyramidal Neurons Derived from Human Pluripotent Stem Cells Integrate Efficiently into Mouse Brain Circuits In Vivo. Neuron 2013, 77, 440–456. [Google Scholar] [CrossRef] [Green Version]
  31. Abe, T.; Takahashi, S.; Suzuki, N. Oxidative Metabolism in Cultured Rat Astroglia: Effects of Reducing the Glucose Concentration in the Culture Medium and of D-Aspartate or Potassium Stimulation. Br. J. Pharmacol. 2005, 26, 153–160. [Google Scholar] [CrossRef] [Green Version]
  32. Waniewski, R.A.; Martin, D.L. Astrocytes and synaptosomes transport and metabolize lactate and acetate differently. Neurochem. Res. 2004, 29, 209–217. [Google Scholar] [CrossRef] [PubMed]
  33. Hothersall, J.S.; Baquer, N.Z.; Greenbaum, A.; McLean, P. Alternative pathways of glucose utilization in brain. Changes in the pattern of glucose utilization in brain during development and the effect of phenazine methosulfate on the integration of metabolic routes. Arch. Biochem. Biophys. 1979, 198, 478–492. [Google Scholar] [CrossRef]
  34. Takahashi, S.; Izawa, Y.; Suzuki, N. Astroglial Pentose Phosphate Pathway Rates in Response to High-Glucose Environments. ASN Neuro 2012, 4, AN20120002. [Google Scholar] [CrossRef] [PubMed] [Green Version]
  35. Takahashi, K.; Tanabe, K.; Ohnuki, M.; Narita, M.; Ichisaka, T.; Tomoda, K.; Yamanaka, S. Induction of pluripotent stem cells from adult human fibroblasts by defined factors. Cell 2007, 5, 861–872. [Google Scholar] [CrossRef] [PubMed] [Green Version]
  36. Matsumoto, T.; Fujimori, K.; Andoh-Noda, T.; Ando, T.; Kuzumaki, N.; Toyoshima, M.; Tada, H.; Imaizumi, K.; Ishikawa, M.; Yamaguchi, R.; et al. Functional Neurons Generated from T Cell-Derived Induced Pluripotent Stem Cells for Neurological Disease Modeling. Stem Cell Rep. 2016, 6, 422–435. [Google Scholar] [CrossRef] [PubMed] [Green Version]
  37. Chambers, S.M.; Fasano, C.A.; Papapetrou, E.P.; Tomishima, M.; Sadelain, M.; Studer, L. Highly efficient neural conversion of human ES and iPS cells by dual inhibition of SMAD signaling. Nat. Biotechnol. 2009, 3, 275–280. [Google Scholar] [CrossRef] [Green Version]
  38. Fujimori, K.; Matsumoto, T.; Kisa, F.; Hattori, N.; Okano, H.; Akamatsu, W. Escape from Pluripotency via Inhibition of TGF-β/BMP and Activation of Wnt Signaling Accelerates Differentiation and Aging in hPSC Progeny Cells. Stem Cell Rep. 2017, 9, 1675–1691. [Google Scholar] [CrossRef] [Green Version]
  39. Tonge, P.D.; Andrews, P.W. Retinoic acid directs neuronal differentiation of human pluripotent stem cell lines in a non-cell-autonomous manner. Differentiation 2010, 80, 20–30. [Google Scholar] [CrossRef]
  40. Mak, S.K.; Huang, Y.A.; Iranmanesh, S.; Vangipuram, M.; Sundararajan, R.; Nguyen, L.; Langston, J.W.; Schüle, B. Small Molecules Greatly Improve Conversion of Human-Induced Pluripotent Stem Cells to the Neuronal Lineage. Stem Cells Int. 2012, 2012, 1–12. [Google Scholar] [CrossRef]
  41. Pevny, L.H.; Sockanathan, S.; Placzek, M.; Lovell-Badge, R. A role for SOX1 in neural determination. Development 1998, 125, 1967–1978. [Google Scholar]
  42. Bertrand, N.; Castro, D.S.; Guillemot, F. Proneural genes and the specification of neural cell types. Nat. Rev. Neurosci. 2002, 3, 517–530. [Google Scholar] [CrossRef] [PubMed]
  43. Dzwonek, J.; Wilczynski, G.M. CD44: Molecular interactions, signaling and functions in the nervous system. Front. Cell. Neurosci. 2015, 9, 175. [Google Scholar] [CrossRef] [PubMed] [Green Version]
  44. Giaume, C.; Fromaget, C.; El Aoumari, A.; Cordier, J.; Glowinski, J.; Grost, D. Gap junctions in cultured astrocytes: Single-channel currents and characterization of channel-forming protein. Neuron 1991, 6, 133–143. [Google Scholar] [CrossRef]
  45. Kim, K.; Lee, S.-G.; Kegelman, T.P.; Su, Z.-Z.; Das, S.K.; Dash, R.; Dasgupta, S.; Barral, P.M.; Hedvat, M.; Diaz, P.; et al. Role of Excitatory Amino Acid Transporter-2 (EAAT2) and glutamate in neurodegeneration: Opportunities for developing novel therapeutics. J. Cell. Physiol. 2010, 226, 2484–2493. [Google Scholar] [CrossRef] [PubMed] [Green Version]
  46. Liu, Y.; Han, S.S.; Wu, Y.; Tuohy, T.M.; Xue, H.; Cai, J.; Back, S.A.; Sherman, L.S.; Fischer, I.; Rao, M.S. CD44 expression identifies astrocyte-restricted precursor cells. Dev. Biol. 2004, 276, 31–46. [Google Scholar] [CrossRef] [Green Version]
  47. Dahl, D.; Rueger, D.C.; Bignami, A.; Weber, K.; Osborn, M. Vimentin, the 57,000 molecular weight protein of fibroblast filaments, is the major cytoskeletal component in immature glia. Eur. J. Cell Biol. 1981, 24, 191–196. [Google Scholar]
  48. Dermietzel, R.; Traub, O.; Hwang, T.K.; Beyer, E.; Bennett, M.V.; Spray, D.C.; Willecke, K. Differential expression of three gap junction proteins in developing and mature brain tissues. Proc. Natl. Acad. Sci. USA 1989, 86, 10148–10152. [Google Scholar] [CrossRef] [Green Version]
  49. Ye, L.; Yang, Y.; Zhang, X.; Cai, P.; Li, R.; Chen, D.; Wei, X.; Zhang, X.; Xu, H.; Xiao, J.; et al. The Role of bFGF in the Excessive Activation of Astrocytes Is Related to the Inhibition of TLR4/NFκB Signals. Int. J. Mol. Sci. 2015, 17, 37. [Google Scholar] [CrossRef]
  50. Adamsky, A.; Kol, A.; Kreisel, T.; Doron, A.; Ozeri-Engelhard, N.; Melcer, T.; Refaeli, R.; Horn, H.; Regev, L.; Groysman, M.; et al. Astrocytic Activation Generates De Novo Neuronal Potentiation and Memory Enhancement. Cell 2018, 1, 59–71. [Google Scholar] [CrossRef] [Green Version]
  51. Nagai, J.; Rajbhandari, A.K.; Gangwani, M.R.; Hachisuka, A.; Coppola, G.; Masmanidis, S.C.; Fanselow, M.S.; Khakh, B.S. Hyperactivity with Disrupted Attention by Activation of an Astrocyte Synaptogenic Cue. Cell 2019, 5, 1280–1292. [Google Scholar] [CrossRef]
  52. Stout, C.E.; Costantin, J.L.; Naus, C.C.G.; Charles, A.C. Intercellular Calcium Signaling in Astrocytes via ATP Release through Connexin Hemichannels. J. Biol. Chem. 2002, 277, 10482–10488. [Google Scholar] [CrossRef] [PubMed] [Green Version]
  53. Rusakov, D.A. Disentangling calcium-driven astrocyte physiology. Nat. Rev. Neurosci. 2015, 16, 226–233. [Google Scholar] [CrossRef] [PubMed]
  54. Bazargani, N.; Attwell, D. Astrocyte calcium signaling: The third wave. Nat. Neurosci. 2016, 19, 182–189. [Google Scholar] [CrossRef] [PubMed]
  55. Lu, B.; Greengard, P.; Poo, M.-M. Exogenous synapsin I promotes functional maturation of developing neuromuscular synapses. Neuron 1992, 8, 521–529. [Google Scholar] [CrossRef]
  56. Rosahl, T.W.; Geppert, M.; Spillane, D.; Herz, J.; Hammer, R.E.; Malenka, R.C.; Sudhof, T.C. Short-term synaptic plasticity is altered in mice lacking synapsin I. Cell 1993, 75, 661–670. [Google Scholar] [CrossRef]
  57. Melloni, R.H.; DeGennaro, L.J. Temporal onset of synapsin I gene expression coincides with neuronal differentiation during the development of the nervous system. J. Comp. Neurol. 1994, 342, 449–462. [Google Scholar] [CrossRef]
  58. Wang, S.; Cesca, F.; Loers, G.; Schweizer, M.; Buck, F.; Benfenati, F.; Schachner, M.; Kleene, R. Synapsin I is an oligomannose-carrying glycoprotein, acts as an oligomannose-binding lectin and promotes neurite outgrowth and neuronal survival when released via glia-derived exosomes. J. Neurosci. 2011, 31, 7275–7290. [Google Scholar] [CrossRef]
  59. Takahashi, S.; Izawa, Y.; Suzuki, N. Astrogliopathy as a loss of astroglial protective function against glycoxidative stress under hyperglycemia. Rinsho Shinkeigaku 2012, 52, 41–51. [Google Scholar] [CrossRef] [Green Version]
  60. Takahashi, S. Metabolic compartmentalization between astroglia and neurons in physiological and pathophysiological conditions of the neurovascular unit. Neuropathology 2020, 40, 121–137. [Google Scholar] [CrossRef] [Green Version]
  61. Okano, H.; Temple, S. Cell types to order: Temporal specification of CNS stem cells. Curr. Opin. Neurobiol. 2009, 19, 112–119. [Google Scholar] [CrossRef]
  62. Naka, H.; Nakamura, S.; Shimazaki, T.; Okano, H. Requirement for COUP-TFI and II in the temporal specification of neural stem cells in CNS development. Nat. Neurosci. 2008, 11, 1014–1023. [Google Scholar] [CrossRef] [PubMed]
  63. Nakashima, K.; Yanagisawa, M.; Arakawa, H.; Kimura, N.; Hisatsune, T.; Kawabata, M.; Miyazono, K.; Taga, T. Synergistic signaling in fetal brain by STAT3-Smad1 complex bridged by p300. Science 1999, 5413, 479–482. [Google Scholar] [CrossRef] [PubMed]
  64. Namihira, M.; Kohyama, J.; Abematsu, M.; Nakashima, K. Epigenetic mechanisms regulating fate specification of neural stem cells. Philos. Trans. R. Soc. B: Biol. Sci. 2008, 363, 2099–2109. [Google Scholar] [CrossRef] [PubMed] [Green Version]
  65. Sloan, S.A.; Barres, B.A. Mechanisms of astrocyte development and their contributions to neurodevelopmental disorders. Curr. Opin. Neurobiol. 2014, 27, 75–81. [Google Scholar] [CrossRef] [PubMed] [Green Version]
  66. Yasui, T.; Uezono, N.; Nakashima, H.; Noguchi, H.; Matsuda, T.; Noda-Andoh, T.; Okano, H.; Nakashima, K. Hypoxia Epigenetically Confers Astrocytic Differentiation Potential on Human Pluripotent Cell-Derived Neural Precursor Cells. Stem Cell Rep. 2017, 8, 1743–1756. [Google Scholar] [CrossRef] [PubMed] [Green Version]
  67. Johe, K.K.; Hazel, T.G.; Muller, T.; Dugich-Djordjevic, M.M.; McKay, R.D. Single factors direct the differentiation of stem cells from the fetal and adult central nervous system. Genes Dev. 1996, 10, 3129–3140. [Google Scholar] [CrossRef] [PubMed] [Green Version]
  68. Zhou, S.; Szczesna, K.; Ochalek, A.; Kobolák, J.; Varga, E.; Nemes, C.; Chandrasekaran, A.; Rasmussen, M.; Cirera, S.; Hyttel, P.; et al. Neurosphere Based Differentiation of Human iPSC Improves Astrocyte Differentiation. Stem Cells Int. 2016, 2016, 1–15. [Google Scholar] [CrossRef] [Green Version]
  69. Swanson, R.A.; Liu, J.; Miller, J.W.; Rothstein, J.D.; Farrell, K.; Stein, B.A.; Longuemare, M.C. Neuronal Regulation of Glutamate Transporter Subtype Expression in Astrocytes. J. Neurosci. 1997, 17, 932–940. [Google Scholar] [CrossRef] [Green Version]
  70. Gomes, F.C.A.; Paulin, D.; Moura Neto, V. GFAP: Modulation by growth factors and its implication in astrocyte differentiation. Braz. J. Med. Biol. Res. 1999, 32, 615–631. [Google Scholar] [CrossRef] [Green Version]
  71. Gomes, F.C.A.; Garcia-Abreu, J.; Galou, M.; Paulin, D.; Moura Neto, V. Neurons induce glial fibrillary acidic protein (GFAP) gene promoter of astrocytes derived from transgenic mice. Glia 1999, 26, 97–108. [Google Scholar]
  72. Gegelashvili, G.; Dehnes, Y.; Danbolt, N.C.; Schousboe, A. The high-affinity glutamate transporters GLT1, GLAST and EAAT4 are regulated via different signaling mechanisms. Neurochem. Int. 2000, 37, 163–170. [Google Scholar] [CrossRef]
  73. Perego, C.; Vanoni, C.; Bossi, M.; Massari, S.; Basudev, H.; Longhi, R.; Pietrini, G. The GLT-1 and GLAST Glutamate Transporters Are Expressed on Morphologically Distinct Astrocytes and Regulated by Neuronal Activity in Primary Hippocampal Cocultures. J. Neurochem. 2002, 75, 1076–1084. [Google Scholar] [CrossRef] [PubMed]
  74. Veraitch, O.; Kobayashi, T.; Imaizumi, Y.; Akamatsu, W.; Sasaki, T.; Yamanaka, S.; Amagai, M.; Okano, H.; Ohyama, M. Human Induced Pluripotent Stem Cell–Derived Ectodermal Precursor Cells Contribute to Hair Follicle Morphogenesis In Vivo. J. Investig. Dermatol. 2013, 133, 1479–1488. [Google Scholar] [CrossRef] [PubMed] [Green Version]
  75. Mathiisen, T.M.; Lehre, K.P.; Danbolt, N.C.; Ottersen, O.P. The perivascular astroglial sheath provides a complete covering of the brain microvessels: An electron microscopic 3D reconstruction. Glia 2010, 58, 1094–1103. [Google Scholar] [CrossRef]
  76. Bedner, P.; Jabs, R.; Steinhäuser, C. Properties of human astrocytes and NG2 glia. Glia 2020, 68, 756–767. [Google Scholar] [CrossRef]
Figure 1. Induction of Human Astrocytes (iPasts). (A) Design of the human iPast induction protocol under serum free condition. Abbreviations: DMEM/F12: Dulbecco’s Modified Eagle Medium: Nutrient Mixture F-12; MHM: Media Hormone mix; B-27™: optimized serum-free supplement; KSR: KnockOut™ Serum Replacement; 3i: 3 µM CHIR99021, 3 µM 431542, 3 µM Dorsomorphine; RA: Retinoic acid; PM: Purmorphamine; bFGF (FGF-2): Basic fibroblast growth factor; EGF: Epidermal Growth Factor; BDNF: Brain-Derived Neurotrophic Factor; GDNF: Glial cell line-Derived Neurotrophic Factor. (B) Representative images of cells at each step of iPast induction process from the two iPSC control lines 201B7 and WD39. Abbreviations: EBs: Embryoid Bodies; Pri. NS: primary neurospheres; Sec. NS: secondary neurospheres; N. & iPasts: Neurons and iPasts; iPasts: human iPSC-derived astrocytes. The cells in the insets at iPSC stage are higher magnifications of cells in dashed boxes and indicative of good quality iPSCs with clear perinuclear halos. Scale bars: 50 µm (20 µm for iPast stage).
Cells 09 02680 g001
Figure 2. Transcriptome Analyses of iPasts. (A) Principal component analysis (PCA) plot of iPSC-derived cells differentiated along astrocyte lineage by the iPast protocol. (B) Volcano plot showing differential expressed genes between neurospheres (in blue) and astrocytes (in yellow). (C) Heatmap showing the expression of trilineage markers in iPSC-derived astrocytes obtained by the iPast protocol or previously described protocols. (D) PCA plot of iPSC-derived astrocytes, EBs and NS. (E) Heatmap of genes associated with astrocyte identity in iPSC-derived astrocytes and human primary astrocytes.
Cells 09 02680 g002
Figure 3. Longitudinal Analysis by Quantitative PCR During iPast Induction Protocol. (A) Quantitative real-time polymerase chain reaction of indicated markers in cells derived from the 201B7 iPSC line. Markers are arranged by family according to the indicated color code (stem-cell maintenance, astrocyte markers, GABA transporter, glutamate transporters and receptors). FA stands for control fetal astrocytes and HB for human brain. Values are normalized to ACTB quantification and represent the fold change ratio value relative to iPSC value. n = 3 passages in duplicate. Data shown are mean ± SEM. Statistical test used: Wilcoxon Matched-pairs test. * indicates p-value ≤ 0.05 (B) Heatmap summing up gene transcription by quantitative RT-PCR in A. iPasts A4 status is highlighted by the green box. Values are logarithm to base 2 of fold changes from A.
Cells 09 02680 g003
Figure 4. Representative Immunofluorescence Stainings of 201B7 iPasts. (A) GFAP (red) and S100B (green) immunostaining of 201B7 iPasts. Lower pictures are high magnification of white dotted-line boxes. Right-hand panel, quantitative analyses of GFAP+ and S100B+ cells from 5 fields (10,000 µm²) for 201B7 and WD39 iPasts. (B) GFAP (red) and CD44 (green) immunostaining. The lower panel is a high magnification of the white dotted-line boxes. Right-hand panel, percentage of GFAP+/CD44+ from 5 fields (10,000 µm²) for 201B7 iPasts and WD39 iPasts. (C) Immunostaining for Vimentin (VIM) (red), AQP4 (green) and CD44 (magenta). Right-hand panel, analysis of CD44+/VIM+ cells from 5 fields (10,000 µm²) for 201B7 iPasts and WD39 iPasts. (D) Immunostaining for GFAP (red) and GJA1 (green). Arrowheads point to GJA1+ gap junction proteins. The picture on the extreme right is a high magnification of the adjacent white dotted-line box. (E) Immunostaining for GFAP (red) and SLC1A2 (green). The lower panel represents a high magnification of the corresponding white dotted-line boxes. (F) Immunostaining for GFAP (red) and Glutamate Ionotropic Receptor AMPA Type Subunit 1 (GRIA1) (green). Bottom pictures are high magnifications of white dotted-line boxes. Nuclei are stained with Hoechst 33258. n = 3 independent astrocytes induction experiments. Scale bars: 10 µm.
Cells 09 02680 g004
Figure 5. Effect of the Culture Medium on the Transcription of Various Genes in iPasts. (A) Cells were cultured in iPast medium, DMEM/F12 with 10% fetal bovine serum (FBS) or 100 ng/mL FGF-2. Quantification of indicated mRNAs was assessed by quantitative RT-PCR. Values were normalized to ACTB and represent the fold change ratio value (value/iPSC value). n = 3 passages. Statistical test: One-way ANOVA with post-hoc Tukey. **** and * indicate p-values (p) < 0.0001 ≤ 0.05, respectively. (B) Analysis of the distribution of GFAP+-iPasts depending on the individual mean GFAP intensity, using automatic immunofluorescence analysis by IN Cell Analyzer. Control human astrocytes, 201B7 and WD39 iPasts were cultured in iPast culture medium or DMEM/F12 plus 10% FBS. n = 3 passages. Statistical test used: Kolmogorov-Smirnov test. ** and * indicate p-values (p) < 0.01 and ≤ 0.05, respectively while ns stands for non significant.
Cells 09 02680 g005
Figure 6. Spontaneous Calcium Fluctuations in Control Human Astrocytes, 201B7 and WD39 iPasts. (A) Representative ROI (red line) after automatic preprocessing by miniscope 1-photon-based calcium imaging signal extraction pipeline (MIN1PIPE) software, before and at the peak of fluorescence (left pictures). Illustration of the method of analysis: the determination of a threshold and duration of calcium fluctuation for each same event results in considering 2 calcium transients (green dots) rather than 3 peaks (black arrows) (right panels). (B) Representative calcium transients in human control-astrocytes (left) and iPasts (right). Time traces of corresponding cells delineated with white outlines. Scale bars: 20 µm. (C) Representative experiments of Fluo-8 AM-stained human control astrocytes and 201B7 iPasts at different time points. The dotted circles indicate calcium transients captured during the acquisition, while white arrowheads point to a transient calcium fluctuation along an intercellular process. Scale bar: 10 µm. (D) Percentage of spontaneously active cells in human control-astrocytes, 201B7 iPasts and WD39 iPasts. (E) Average number of calcium events per minute in human control-astrocytes, 201B7 iPasts and WD39 iPasts. (F) Average variation of calcium transients amplitude for human control-astrocytes, 201B7 iPasts and WD39 iPasts. Data shown are represent mean ± SEM. n = 3 passages. Statistical test: Mann-Whitney test. ns stands for non significant.
Cells 09 02680 g006
Figure 7. iPasts are Functional Cells. (A) Healthy cortical neurons in indirect co-culture with iPasts. Neurons were immunostained for Synapsin-1 (green) and MAP2 (magenta). Histograms show the analysis of Synapsin-1+ dots in MAP2+ neurons. n = 3 independent experiments. Scale bar: 20 µm. Individual data are shown as • and ▪ and error bars are mean ± SEM. Statistical test used: Student’s t-test. ** indicates p-value (p) < 0.01. (B) Glutamate uptake of iPast lines was compared to iPSCs (negative control) and human control astrocytes (positive control) at 1, 2 and 4 h after adding glutamate at 250 µM. n = 9 passages. Statistical test used: Mann-Whitney test. **** indicates p-value (p) < 0.0001. (C) Rates of 14CO2 production from the oxidation of [1-14C]-glucose and [6-14C]-glucose and rate of the PPP in iPasts. Values are means ± SEM for quadruplicate flasks.
Cells 09 02680 g007
Publisher’s Note: MDPI stays neutral with regard to jurisdictional claims in published maps and institutional affiliations.

