Abstract
The mammalian target of rapamycin (mTOR) kinase is a well-known master regulator of growth-dependent gene expression in higher eukaryotes. Translation regulation is an important function of the mTORC1 pathway that controls the synthesis of many ribosomal proteins and translation factors. Housekeeping genes such as β-actin (ACTB) are widely used as negative control genes in studies of growth-dependent translation. Here we demonstrate that translation of both endogenous and reporter ACTB mRNA is inhibited in the presence of mTOR kinase inhibitor (Torin1) and under amino acid starvation. Notably, 5’UTR and promoter of ACTB are sufficient for the mTOR-dependent translational response, and the degree of mTOR-sensitivity of ACTB mRNA translation is cell type-dependent.
1. Introduction
The mTOR (mammalian target of rapamycin) signaling pathway is a well-known regulator of cell growth that responds to various growth stimuli, nutrients, energy, and stresses. As a master regulator of protein biosynthesis, the mTORC1 pathway is involved in cancer progression, obesity, diabetes, autism and aging [1,2,3]. Disturbance of the mTORC1 pathway is typical for various types of cancer, which makes mTOR one of the promising targets for chemotherapy [4]. Translation of mRNA of ribosomal and other translation-related proteins, such as elongation and initiation factors, is specifically reduced under mTOR inhibition [5,6]. This class of mRNA targets share a common TOP motif (terminal oligopyrimidine tract) located at the extreme 5’end and described as an uninterrupted stretch of 5–14 pyrimidines [7,8]. As shown recently, with inhibited cell growth, the translation initiation factor eIF4E can discriminate 2–3 nucleotides at the mRNA 5’ end [9]. Therefore, translation of TOP mRNAs is most sensitive to phosphorylation of 4EBP1 because when hypophosphorylated, the latter binds to eIF4E [10,11]. However, there are other mRNAs exhibiting growth-dependent translation inhibition, such as mRNAs with short 5’ UTRs carrying a specific TISU motif (translation initiator of short 5’UTR) [12] and some mRNAs with structured 5’ UTRs that are sensitive to RNA helicases [13,14]. Furthermore, growth-dependent translation regulation also involves eIF2 phosphorylation [15], codon optimality [16] and RNA-binding proteins [17,18,19].
Glyceraldehyde 3-phosphate dehydrogenase (GAPDH) [20,21,22,23,24] and β-actin (ACTB) [19,23,24,25,26,27,28,29] are the most popular negative control genes used in studies of growth-dependent translation. However, GAPDH was shown to be the mTOR target mRNA [16,30,31] carrying an almost canonical TOP [9,22,32,33]. ACTB is still used as the negative control [19,28], while changes of its mRNA translation are considered to be nonspecific and attributed to general consequences of mTOR inhibition.
Here we present an analysis of translation of endogenous ACTB mRNA and ACTB reporter mRNA under conditions of mTOR inhibition and amino acid and serum starvation. We report that ACTB mRNA exhibits growth-dependent translation whose inhibition in HEK293T and HeLa cells is comparable in magnitude with the canonical mTOR target mRNA of the ribosomal protein RPL32.
2. Materials and Methods
2.1. Plasmids
Promoter regions and 5’UTR were amplified from HEK293T genomic DNA. Genomic DNA was purified using GenElute Mammalian Genomic DNA Miniprep Kit (Merck KGaA, Darmstadt, Germany) following the manufacturer’s protocol. Sequences were amplified in the GC-rich buffer using Phusion High-Fidelity PCR Kit (Thermo Fisher Scientific, Waltham, MA, USA) and primers (Table S1). The primers had additional 20 nts per sequence for ligation-independent cloning (SLIC) into the pNL2.2 vector (Promega, Madison, WI, USA). Purified PCR products were cloned into the promoter-free pNL2.2 vector by SLIC. Briefly, 50 ng of amplified and DpnI-treated pNL2.2 was mixed with a fivefold molar excess of PCR product (promoter and 5’UTR). To obtain overlapping sticky-ends, the mixture was treated with T4-DNA polymerase (NEB, Upswich, MA, USA) in 1x NEBuffer 2.1 for 20 min at 22 °C. The reaction was stopped by addition of dCTP to the final concentration of 0.5 mM and incubation on ice for 5 min. To improve annealing, the mixture was incubated at 75 °C for 20 min and then at 50 °C for 10 min and transformed to Escherichia coli. The resulting constructs were named pNL2.2 SLU7-NlucP, pNL2.2 ACTB-NlucP, pNL2.2 RPL32-NlucP, pNL2.2 YB-1-NlucP.
2.2. Cell Cultures
HEK293T, HeLa, PC3 and SK-N-SH cells (originally obtained from ATCC, American Type Culture Collection) were kindly provided by Dr. Elena Nadezhdina (Institute of Protein Research, Russian Academy of Sciences, Pushchino, Russia). HEK293T cells were cultivated in DMEM (Dulbecco Modified Eagle Medium), HeLa and SK-N-SH cells—in DMEM/F12, and PC3 cells in RPMI (Roswell Park Memorial Institute Medium). The media were supplemented with 10% fetal bovine serum, 2 mM glutamine, 100 U/mL penicillin, and 100 μg streptomycin (PanEco, Moscow, Russia). The cells were kept at 37 °C in a humidified atmosphere containing 5% CO2. The cells were cultivated by standard methods. To inhibit the mTOR kinase, Torin1 (solved in DMSO, 500 nM; Tocris Bioscience, Bristol, UK), or DMSO (control) was added to the medium for 2 h. For amino acid and serum starvation, the cells were washed once with PBS then incubated for 2 h in Earle’s balanced salt solution (Thermo Fisher Scientific) supplemented with 1× MEM vitamin solution (Thermo Fisher Scientific).
2.3. Western Blotting
For Western blot analysis, the cells were rinsed two times with phosphate buffered saline and lysed in SDS electrophoresis sample buffer. Proteins were separated by SDS-PAGE and transferred onto a nitrocellulose membrane. The membrane was blocked for 1 h at room temperature with 5% nonfat milk in TBS (10 mM Tris-HCl, pH 7.6, and 150 mM NaCl) and incubated overnight at 4 °C in TBS-T (10 mM Tris-HCl, pH 7.6, and 150 mM NaCl, 0.05% Tween 20) supplemented with BSA (5%) and appropriate antibodies. The membrane was washed three times with TBS-T, incubated for 1 h with 5% nonfat milk in TBS-T and horseradish peroxidase conjugated goat anti-rabbit IgG (1:4000, 7074, Cell Signaling Technology, Danvers, MA, USA) and then washed three times with TBS-T. Immunocomplexes were detected using an ECL Prime kit (GE Healthcare, Chicago, IL, USA) according to the manufacturer’s recommendations. The rabbit monoclonal primary antibodies were from Abcam (ACTB, ab8227, Cambridge, UK) and Cell Signaling Technology: phospho-eIF2 S51 (D9G8), phospho-p70 S6 Kinase T389 (108D2), phospho-S6 ribosomal protein S235/236 (D57.2.2E), S6 ribosomal protein (5G10), phospho-4EBP1 T37/46 (236B4), 4EBP1 (53H11), histone H3 (D1H2). Histone H3 antibodies were used as 1:10000 dilution, other primary antibodies were used as 1:2000 dilution.
2.4. DNA Transfection
The cells were plated onto a six-well (or 10 cm) dish 24 h prior to transfection. The cells were transfected using Lipofectamine 3000 (Thermo Fisher Scientific). For transfection, 400 ng (2.4 μg per 10 cm dish) of background plasmid pcDNA3.1HA [14] and 200 ng (1.2 μg per 10 cm dish) of pNL2.2 plasmid were incubated with 1.2 μl (6.2 μl per 10 cm dish) of P3000 and 1.8 μl (10.8 μl per 10 cm dish) of Lipofectamine 3000 in 100 μl (600 μl per 10 cm dish) Opti-MEM (Thermo) for 15 min and then added to the growth medium. 4–6 h later, the cells were plated onto a 48-well dish (NLucP activity or RNA analysis) or onto a new 10 cm dish (polysome analysis) and cultivated for 16–20 h prior to the experiment. For each particular reporter, we performed transfection in a single dish and then plated the transfected cells onto smaller dishes to avoid transfection efficiency bias, which were then used for technical replicates of test and control conditions. Transfection of different reporters was performed simultaneously.
2.5. NLucP half-life Time Measurement and Luciferase Assay
For half-life time measurements, the cells were cultivated in normal conditions or in the presence of Torin1 or under amino acid and serum starvation for 2 h. Then cycloheximide (0.1 mg/mL) was added, and the cells were additionally incubated for 0, 15, 30, 60, 90 min. After incubation with cycloheximide, the cells were lysed and luciferase activities were measured.
NlucP activity was measured using Nano-Glo Luciferase Assay System (Promega). Cultured cells were lysed with passive lysis buffer (PLB, Promega) for 15 min at 37 °C. Enzymatic activities of NanoLuc luciferase (NlucP) were assayed using GloMax 20/20 Luminometer (Promega). All transfections were repeated several times in different cell passages.
2.6. Polysome Analysis
Cells (typically 70% confluent cells per 10 cm dish) were collected in ice-cold PBS + cycloheximide (0.1 mg/mL), rinsed once with ice-cold PBS + cycloheximide (0.1 mg/mL) and lysed in 250 μl of polysome buffer (15 mM Tris-HCl (pH 7.6), 15 mM MgCl2, 300 mM NaCl, 1% Triton X-100, 0.1 mg/mL cycloheximide). Lysates were passed through a 26G needle, incubated on ice for 10 min, and centrifuged to remove cell debris at 4 °C at 12,000 g for 15 min. Lysates were loaded onto a linear 15–45% sucrose gradient (15 mM Tris-HCl (pH 7.6), 5 mM MgCl2, 100 mM NaCl, 0.01 mg/mL cycloheximide) and fractionated by ultracentrifugation in a SW-60 rotor (Beckman Coulter, Brea, CA, USA) of Oplima L-90K Ultracentrifuge (Beckman Coulter) at 45,000 rpm at 4 °C for 1 h. The sucrose gradients were divided into 16 fractions of 250 μl each. Fractions corresponding to polysomes (including mRNAs loaded with two or more ribosomes) and subpolysomes (including monosomes, ribosomal subunits, and mRNP) were united, and 10 ng of in vitro transcribed firefly luciferase (fluc) mRNA was added to each fraction for normalization. RNA was extracted from each fraction and analyzed by qPCR.
2.7. RNA Isolation, cDNA Synthesis and In Vitro Transcription
Cells for RNA isolation were collected in ice-cold PBS. To each sample 2.5 ng of in vitro transcribed fluc mRNA was added as an internal control. RNA from cells or gradient fractions was isolated using TRIzol LS (Thermo Fisher Scientific) according to the manufacturer’s manual. Total RNA was treated with dsDNase, and cDNAs were synthesized using Maxima H Minus First Strand cDNA Synthesis Kit (Thermo Fisher Scientific) according to the manual.
Fluc cap(+) polyA(+) mRNA was transcribed by SP6 RNA polymerase from pSP36T-5’UTRYB1-Fluc-3’UTRYB1A50 linearized with HpaI and capped using a ScriptCap m7G Capping System (CellScript, Madison, WI, USA) as described previously [34].
2.8. 5’RACE
cDNAs for the 5’RACE analysis were synthesized using a Mint RACE cDNA amplification set (Evrogen, Moscow, Russia) according to the manufacturer’s recommendations. PlugOligo adapter and oligodT18 (Table S1) were used for cDNA synthesis. The first round of PCR was performed using NlucP- and PlugOligo-specific primers (Table S1) carrying additional Illumina adaptor sequences. PCR products were purified using Agencourt AMPure XP (Beckman Coulter) according to the manufacturer’s recommendations. The second round of PCR was performed using primers from NEBNext Dual Index Primers Set 1 for Illumina (NEB). PCR products were purified using AMPure XP and sequenced on a NextSeq (Illumina, San Diego, CA, USA) platform. The resulting reads were processed with cutadapt v. 1.18 [35] to remove adapter sequences and 5’ poly-G tracks produced by Mint reverse transcriptase. The read mapping to pNL2.2 ACTB-NlucP, pNL2.2 RPL32-NlucP sequences was performed with bowtie 1.1.1 [36]. The cumulative coverage by 5’ read ends was computed using bedtools v 2.27.0 [37]. The total number of reads mapped within the windows surrounding the transcription start sites was no less than 700 for ACTB and 900 for RPL32.
2.9. qPCR
Transcript abundance was determined by quantitative PCR (qPCR) using a DTlite Real-Time PCR System (DNA Technology, Moscow, Russia), qPCRmix-HS SYBR+LowROX (Evrogen), and primers specific for each transcript (Table S1). The efficiency of each primer pair was determined by a series of dilutions. Transcript abundance data were normalized to the abundance of fluc mRNA.
2.10. Statistical Analysis
We performed two-tailed Student’s t-test to determine the significance of the difference between NlucP activities or mRNA levels as indicated in Figure Legends.
3. Results
3.1. Translation of Reporter mRNA with Promoter and 5’ UTR of ACTB is mTOR-Sensitive in HEK293T Cells
The 5’end is important for mTOR-dependent translation. Therefore, we used a reporter system with the promoter and 5’UTR (Figure 1A) to ensure that reporter mRNAs receive 5’ ends similar to those of native RNAs. As a reporter gene, instead of traditionally used firefly luciferase (half-life time ~3 h [38]), we used the short-living Nano luciferase, NLucP (half-life time ~15 min, Figure 1C). This allowed measuring differences in protein synthesis resulting from short-term treatments. The scheme of the experimental workflow is shown in Figure 1B. For promoter regions we took −400 bp regions upstream of the CAGE (cap analysis gene expression) peak maxima (HEK293 data, [32]) and the respective full-length 5’ UTRs for the following genes: RPL32 and YB-1 (mTOR translational targets), ACTB, and SLU7 (pre-mRNA splicing factor, negative control, translation of SLU7 mRNA does not change upon mTOR inhibition according to Ribo-Seq data [10,11]).
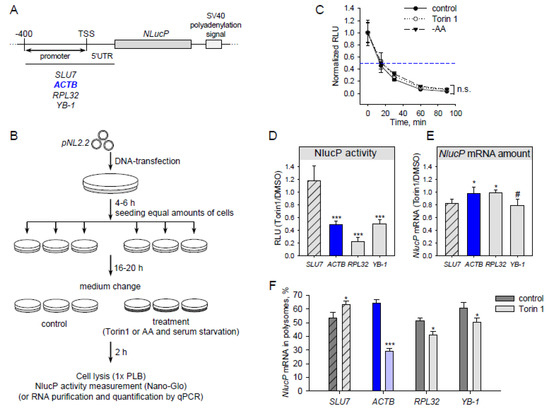
Figure 1.
Translation of reporter mRNA with β-actin 5’UTR is sensitive to mTOR (mammalian target of rapamycin) inhibition. (A) Scheme of the pNL2.2 plasmid used in this study (TSS—transcription start site). (B) Scheme of an experiment with pNL2.2. Cells were transfected with pNL2.2; after 4-6 h equal amounts of cells with the same transfection were seeded to smaller dishes to grow for 16-20 h. Cells were treated for 2h with DMSO (control) or 500 nM Torin1 or subjected to amino acid starvation (EBSS—Earle’s balanced salt solution). Two hours later, luciferase activity or mRNA abundance was measured. (C) HEK293T cells were transfected with pNL2.2-SLU7-NlucP; 24 h later the cells were treated with DMSO (control) or 500 nM Torin1 or EBSS (-AA) for 2 h, then CHX was added for 0, 15, 30, 60, or 90 min. After that, luciferase activity was measured. For each condition, the luciferase activity (Y-axis) was normalized to the value at the zero min time point. (D–F) HEK293T cells were transfected with pNL2.2. After 2h cell treatment with DMSO (control) or 500 nM Torin1 they were collected and luciferase activity (D), NlucP mRNA abundance (E), and polysome distribution (F) were measured. A polysome fraction was calculated as (mRNA in polysome)/(mRNA in polysome + mRNA in subpolysome). Values are the means of at least three independent experiments. Error bars show standard deviations. Student’s t-test was used to estimate the statistical significance versus the SLU7 control (D,E) or versus control treatment (C,F), *** p < 0.001; * p < 0.05; #, n.s., nonsignificant.
Particular mTOR inhibitors are able to stabilize proteins [30]. To avoid such a case, we measured NLucP activity at various time points of the translation elongation arrest (cycloheximide treatment) in normal conditions and upon mTOR inhibition. The NlucP protein half-life time was about 15 min in all tested conditions (Figure 1С).
Upon mTOR inhibition by Torin1, translation of SLU7 mRNA remained unchanged (Figure 1D). Surprisingly, ACTB mRNA translation decreased after Torin1 treatment to a degree similar to that of well-known mTOR-sensitive mRNAs (RPL32 and YB-1). This effect does not result from changes in reporter mRNA abundance (Figure 1E). To ensure that the reduction in luciferase luminescence is indeed a result of decreased translation, we analyzed the reporter mRNA distribution in sucrose gradient fractions in normal conditions and after Torin1 treatment (Figure 1F and Figure S1). In the latter case, the amount of reporter ACTB mRNA was lower in the polysome fraction. This result, together with decreasing NlucP activity, indicates that ACTB reporter mRNA translation is inhibited after Torin1 treatment.
3.2. Translation of Endogenous ACTB mRNA is Sensitive to Growth Stimulus in HEK293T Cells
To further verify the result, we tested endogenous mRNAs in the same conditions as those for the reporter constructs. After Torin1 or DMSO treatment, we lysed the cells and analyzed the distribution of endogenous mRNAs in sucrose gradient fractions using qPCR (Figure 2A). In contrast to SLU7, the abundance of mRNAs of ACTB, RPL32, RPL14, and YB-1 decreased in the polysome fraction after Torin1 treatment, with this effect being even more prominent as compared to the reporter constructs.
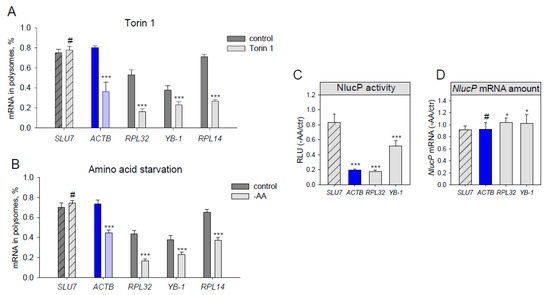
Figure 2.
Translation of endogenous β-actin mRNA decreases under amino acid starvation and mTOR inhibition. (A–B) HEK293T cells were treated for 2h with DMSO (control), 500 nM Torin1 (A), or subjected to amino acid and serum starvation (B). The cells were lysed, fractionated at a sucrose gradient of 15–45%, and mRNA abundance of endogenous SLU7, ACTB, RPL32, RPL14 and YB-1 in polysome- and subpolysome fractions was measured by qPCR. A polysome fraction was estimated as (mRNA in polysome)/(mRNA in polysome + mRNA in subpolysome). (C–D) HEK293T cells were transfected with pNL2.2; after 2h of amino acid and serum starvation (-AA) the cells were collected, and luciferase activity (C) and NlucP mRNA abundance (D) were measured. Student’s t-test was used to estimate the statistical significance versus control treatment (A–B) or versus the SLU7 control (C–D), *** p < 0.001; *p < 0.05; #—nonsignificant.
Lastly, we checked if ACTB mRNA translation decreased not only due to direct chemical mTOR inhibition but also as a result of amino acid and serum starvation (which also leads to mTORC1 inhibition, Figure 3C). Translation of both endogenous (Figure 2B) and reporter (Figure 2С,D) ACTB mRNAs appeared to be inhibited to the degree similar to that of RPL32. Thus, we conclude that ACTB mRNA translation is growth-dependent.
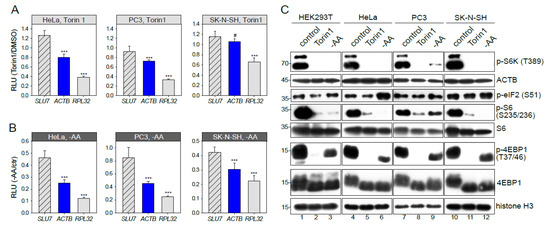
Figure 3.
mTOR-sensitivity of β-actin mRNA translation is cell type-dependent. HeLa, PC3 or SK-N-SH cells were transfected with pNL2.2. After 2h of 500 nM Torin1 treatment (A) or amino acid and serum starvation, -AA (B) the cells were lysed, and luciferase activity was measured. Student’s t-test was used to estimate the statistical significance versus SLU7. (C) HEK293T, HeLa, PC3 or SK-N-SH cells were treated for 2h with DMSO (control), 500 nM Torin1, or subjected to amino acid and serum starvation (-AA). Cells were lysed and analyzed by Western blotting using the indicated antibodies. *** p < 0.001; #—nonsignificant.
3.3. mTOR-Sensitivity of ACTB mRNA Translation is Cell Type-Dependent
The ACTB mRNA was not recognized as an mTOR target in previous ribosome profiling studies [10,11] using other cell lines. Here we report that the response of ACTB translation to mTOR inhibition (Figure 3A) and amino acid and serum starvation (Figure 3B) is different in different cell types. Our experiments on HeLa and PC3 cells demonstrated the ACTB inhibition similar to that in HEK293T. However, in SK-N-SH cells, translation of reporter ACTB mRNA remained unchanged in the presence of Torin1 (Figure 3A). Quite the contrary, upon amino acid and serum starvation (Figure 3B), translation of ACTB mRNA visibly decreased, though to a lower degree than in the RPL32 case. Thus, mTOR-sensitivity of ACTB mRNA translation is cell type-dependent.
The cell type-specificity of translational response could be attributed to a different degree of mTORC1 pathway inactivation upon growth inhibition. We analyzed the phosphorylation status of 4EBP1, S6 kinase, and S6 ribosomal protein (Figure 3C). As expected, phosphorylation of S6K, S6, and 4EBP1 was significantly decreased after Torin1 treatment and a bit less upon amino acid and serum starvation. Surprisingly, we did not find any major difference between the studied cell lines. Thus, the degree of mTORC1 pathway inactivation does not explain the cell type-specificity of translational response. Of note, we did not detect any decrease of the total ACTB protein level (Figure 3C). ACTB is an abundant and stable protein with an average protein half-life time of about 20 h [39] masking protein abundance changes in a limited time of 2h unless the protein is specifically degraded.
Next, we studied S51 phosphorylation of eIF2 (Figure 3C) which is known to be increased upon amino acid starvation. However, after 2 h, amino acid and serum starvation a significant increase of p-eIF2 (S51) was detected only in HeLa cells. This observation could explain the overall translational decline in HeLa upon amino acid and serum starvation but not the increased inhibition of ACTB and RPL32 translation. Thus, the p-eIF2 (S51) is not a key factor of cell-type specificity either.
The activity of transcription start sites (TSS) differs from one cell line to another and can interfere with mTOR-dependent translational response [9,40,41]. We used 5’ RACE to determine the 5’ends of ACTB (Figure 4A) and RPL32 (Figure 4B) reporter mRNAs in the studied cell lines. Distribution of the 5’ends of reporter mRNAs was almost identical in the tested cell lines and was in agreement with the CAGE data [32], for both ACTB and RPL32. Thus, cell-type specificity of ACTB translation mTOR response cannot be attributed to differences in regulatory elements of the cell type-specific 5’ UTRs.
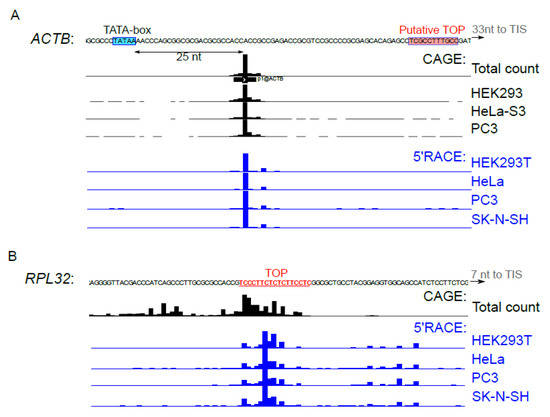
Figure 4.
TSS activity in the studied cell types. (A–B) HEK293T, HeLa, PC3 or SK-N-SH cells were transfected with pNL2.2-ACTB (A) or pNL2.2-RPL32 (B). After 24 h, the total RNA was extracted and 5’ends of the reporter mRNAs were analyzed by 5’RACE. HeliscopeCAGE signal [32] in the vicinity of ACTB or RPL32 transcription start sites in HEK293, HeLa, PC3 cells and the average signal across all FANTOM5 cell types are presented. The TATA-box is shown in blue, putative TOP [22] (ACTB) and TOP (RPL32) are shown in red.
All in all, mTOR-sensitivity of ACTB mRNA translation is cell type-specific. Nevertheless, this cell specificity cannot be attributed to alteration of 4EBP1 phosphorylation or altered TSS activity.
4. Discussion
Negative controls are crucial for the analysis of gene regulation. In growth-dependent translation studies, a typical approach is to use housekeeping genes such as ACTB or GAPDH [19,20,21,23,24,25,26,27,28,29,42,43]. In this study, we have shown that both endogenous and reporter ACTB mRNAs are sensitive to amino acid and serum starvation and to mTOR inhibition by Torin1. Of note, the changes of ACTB mRNA translation upon mTOR inhibition were observed in previous studies, but they were either ignored [44,45] or attributed to a nonspecific response [11,30,46]. Here we demonstrated that the magnitude of ACTB translational response is nearly the same as that for the canonical mTOR target RPL32 mRNA.
There were studies where ACTB mRNA translation did not respond to mTOR inhibition [19,23,24,25,26,27,28,29,47]. Probably, in some cases, this is connected with a particular experimental setup. Specifically, in [13,28,29] only three and more ribosomes were considered as a polysome fraction, which allowed identification of an additional set of mTOR-sensitive TISU-containing mRNAs. However, many canonical targets were missed, e.g., mRNA of ribosomal proteins. This probably can be explained by the fact that some of them mostly fall into light polysome fractions (2–3 Rs), at least in some cell lines [11,17,21,40,48]. In some cases, the difference can be attributed to cell type-specificity (Figure 3). This effect was observed even for canonical targets [49,50], which can result from the specificity of particular mTOR inhibitors [50], cell type-specific transcription start sites [9,40,41], different levels of expression of regulatory proteins, or activity of different branches of the mTOR signaling pathway [15].
Here we demonstrated that translation of reporter ACTB mRNA is mTOR-dependent and thus the respective regulatory element should be located within 5’UTR and/or promoter region. Notably, regulatory elements within promoter regions can influence translational response either by facilitating binding of specific RNA binding proteins to the nascent mRNA [51,52] or by dictating specific RNA modifications [53]. Thus, it cannot be ruled out that the promoter regions may be involved in the mTOR-dependent translational response.
The canonical mTOR target mRNAs of ribosomal proteins are transcribed from TCT-promoters whose functioning requires a pyrimidine-rich element that undergoes partial transcription and becomes incorporated in the 5’region of the incipient mRNA, thereby forming TOP [54]. Interestingly, a putative TOP was found for mouse ACTB mRNA [22], but it was not confirmed in large-scale studies [32,33]. Human ACTB promoter is a classical TATA-box promoter [32]; in the majority of cell types, it has a narrow transcription initiation region located about 25 nt downstream of the TATA-box (Figure 4A). The pyrimidine-rich sequence speculated to serve as TOP is located downstream in 5’UTR, and it is not clear whether it can participate in translational control.
Furthermore, regulation of growth-dependent translation of housekeeping genes can dramatically differ from that of ribosomal proteins probably not involving TOP at all. In particular, it was found that codon optimality can affect translational control in conditions of amino acid starvation, which is true for ACTB mRNA [16]. However, we detected mTOR sensitivity not only for endogenous but also for reporter mRNA lacking the ACTB coding region. Therefore, for ACTB, there should exist means of mTOR-dependent translational control other than codon optimality. Recently it was shown that (m6A) mRNA methylation determines translational efficiency and depends on the rate of transcription elongation [53]. Also, it was shown that the translation of many cellular mRNAs becomes mTOR-dependent upon N6-adenosine-methyltransferase catalytic subunit METTL3 knockdown [55]. Interestingly, the primary mTOR targets such as ribosomal proteins are highly expressed mRNAs which are almost free of m6A methylation [56]. We hypothesize that mRNAs of housekeeping genes, including ACTB, are highly expressed, and hence only slightly methylated, thus resulting in mTOR-dependent translation. So, non-housekeeping and/or weakly expressed genes such as SLU7 can serve as a better negative control.
In sum, we have demonstrated that translation of ACTB mRNA is inhibited by amino acid and serum starvation and mTOR inhibition. The 5’UTR and a promoter are sufficient for growth-dependent regulation. The translational response of ACTB mRNA varies from one cell type to another and is more prominent in conditions of amino acid and serum starvation as compared to the chemical mTOR inhibition.
Supplementary Materials
The following are available online at http://www.mdpi.com/2073-4425/10/2/96/s1, Figure S1: Polysome profiles of HEK293T cells, Table S1: Primers for promoter cloning, qPCR and 5’ RACE.
Author Contributions
I.E., M.V. conducted experiments, I.E. designed experiments and wrote the original draft. I.E., L.O supervised the project and acquired findings. All authors were involved in data analysis, the revision of the manuscript and approved the final manuscript.
Funding
Acknowledgments
We thank Janna Afonina and Vladimir Shirokov for assistance in sucrose gradient fractionation; Skoltech Genomics Core Facility and personally Maria Logacheva for performing high-throughput sequencing for RACE experiments; Ivan Kulakovskiy for assistance with high-throughput sequencing analysis, Dmitry Lyabin for fruitful discussions; Evgenia Serebrova for help in manuscript preparation.
Conflicts of Interest
The authors declare no conflicts of interest.
References
- Saxton, R.A.; Sabatini, D.M. mTOR signaling in growth, metabolism, and disease. Cell 2017, 168, 960–976. [Google Scholar] [CrossRef] [PubMed]
- Zoncu, R.; Efeyan, A.; Sabatini, D.M. MTOR: From growth signal integration to cancer, diabetes and ageing. Nat. Rev. Mol. Cell Biol. 2011, 12, 21–35. [Google Scholar] [CrossRef]
- Wang, X.; Proud, C.G. MTORC1 signaling: What we still dont know. J. Mol. Cell Biol. 2011, 3, 206–220. [Google Scholar] [CrossRef] [PubMed]
- Thoreen, C.C.; Kang, S.A.; Chang, J.W.; Liu, Q.; Zhang, J.; Gao, Y.; Reichling, L.J.; Sim, T.; Sabatini, D.M.; Gray, N.S. An ATP-competitive mammalian target of rapamycin inhibitor reveals rapamycin-resistant functions of mTORC1. J. Biol. Chem. 2009, 284, 8023–8032. [Google Scholar] [CrossRef] [PubMed]
- Thoreen, C.C. The molecular basis of mTORC1-regulated translation. Biochem. Soc. Trans. 2017, 45, 213–221. [Google Scholar] [CrossRef]
- Masvidal, L.; Hulea, L.; Furic, L.; Topisirovic, I.; Larsson, O. mTOR-sensitive translation: Cleared fog reveals more trees. RNA Biol. 2017, 14, 1299–1305. [Google Scholar] [CrossRef]
- Meyuhas, O.; Kahan, T. The race to decipher the top secrets of TOP mRNAs. Biochim. Biophys. Acta Gene Regul. Mech. 2015, 1849, 801–811. [Google Scholar] [CrossRef]
- Meyuhas, O. Synthesis of the translational apparatus is regulated at the translational level. Eur. J. Biochem. 2000, 267, 6321–6330. [Google Scholar] [CrossRef]
- Tamarkin-Ben-Harush, A.; Vasseur, J.J.; Debart, F.; Ulitsky, I.; Dikstein, R. Cap-proximal nucleotides via differential eIF4E binding and alternative promoter usage mediate translational response to energy stress. eLife 2017, 6, e21907. [Google Scholar] [CrossRef]
- Hsieh, A.C.; Liu, Y.; Edlind, M.P.; Ingolia, N.T.; Janes, M.R.; Sher, A.; Shi, E.Y.; Stumpf, C.R.; Christensen, C.; Bonham, M.J.; et al. The translational landscape of mTOR signalling steers cancer initiation and metastasis. Nature 2012, 485, 55–61. [Google Scholar] [CrossRef]
- Thoreen, C.C.; Chantranupong, L.; Keys, H.R.; Wang, T.; Gray, N.S.; Sabatini, D.M. A unifying model for mTORC1-mediated regulation of mRNA translation. Nature 2012, 485, 109–113. [Google Scholar] [CrossRef] [PubMed]
- Sinvani, H.; Haimov, O.; Svitkin, Y.; Sonenberg, N.; Tamarkin-Ben-Harush, A.; Viollet, B.; Dikstein, R. Translational tolerance of mitochondrial genes to metabolic energy stress involves TISU and eIF1-eIF4GI cooperation in start codon selection. Cell MeTable 2015, 21, 479–492. [Google Scholar] [CrossRef] [PubMed]
- Gandin, V.; Masvidal, L.; Hulea, L.; Gravel, S.P.; Cargnello, M.; McLaughlan, S.; Cai, Y.; Balanathan, P.; Morita, M.; Rajakumar, A.; et al. NanoCAGE reveals 5’ UTR features that define specific modes of translation of functionally related MTOR-sensitive mRNAs. Genome Res. 2016, 26, 636–648. [Google Scholar] [CrossRef] [PubMed]
- Lyabin, D.N.; Ovchinnikov, L.P. Selective regulation of YB-1 mRNA translation by the mTOR signaling pathway is not mediated by 4E-binding protein. Sci. Rep. 2016, 6, 22502. [Google Scholar] [CrossRef] [PubMed]
- Han, K.; Jaimovich, A.; Dey, G.; Ruggero, D.; Meyuhas, O.; Sonenberg, N.; Meyer, T. Parallel measurement of dynamic changes in translation rates in single cells. Nat. Methods 2014, 11, 86–93. [Google Scholar] [CrossRef]
- Saikia, M.; Wang, X.; Mao, Y.; Wan, J.; Pan, T.; Qian, S.B. Codon optimality controls differential mRNA translation during amino acid starvation. RNA 2016, 22, 1719–1727. [Google Scholar] [CrossRef] [PubMed]
- Fonseca, B.D.; Zakaria, C.; Jia, J.J.; Graber, T.E.; Svitkin, Y.; Tahmasebi, S.; Healy, D.; Hoang, H.D.; Jensen, J.M.; Diao, I.T.; et al. La-related protein 1 (LARP1) represses terminal oligopyrimidine (TOP) mRNA translation downstream of mTOR complex 1 (mTORC1). J. Biol. Chem. 2015, 290, 15996–16020. [Google Scholar] [CrossRef] [PubMed]
- Lahr, R.M.; Mack, S.M.; Héroux, A.; Blagden, S.P.; Bousquet-Antonelli, C.; Deragon, J.M.; Berman, A.J. The La-related protein 1-specific domain repurposes HEAT-like repeats to directly bind a 5’TOP sequence. Nucleic Acids Res. 2015, 43, 8077–8088. [Google Scholar] [CrossRef] [PubMed]
- Tcherkezian, J.; Cargnello, M.; Romeo, Y.; Huttlin, E.L.; Lavoie, G.; Gygi, S.P.; Roux, P.P. Proteomic analysis of cap-dependent translation identifies LARP1 as a key regulator of 5′TOP mRNA translation. Genes Dev. 2014, 28, 357–371. [Google Scholar] [CrossRef] [PubMed]
- Zhu, J.; Hayakawa, A.; Kakegawa, T.; Kaspar, R.L. Binding of the La autoantigen to the 5′ untranslated region of a chimeric human translation elongation factor 1A reporter mRNA inhibits translation in vitro. Biochim. Biophys. Acta Gene Struct. Exp. 2001, 1521, 19–29. [Google Scholar] [CrossRef]
- Zhu, J.; Spencer, E.D.; Kaspar, R.L. Differential translation of TOP mRNAs in rapamycin-treated human B lymphocytes. Biochim. Biophys. Acta Gene Struct. Exp. 2003, 1628, 50–55. [Google Scholar] [CrossRef]
- Yamashita, R.; Suzuki, Y.; Takeuchi, N.; Wakaguri, H.; Ueda, T.; Sugano, S.; Nakai, K. Comprehensive detection of human terminal oligo-pyrimidine (TOP) genes and analysis of their characteristics. Nucleic Acids Res. 2008, 36, 3707–3715. [Google Scholar] [CrossRef] [PubMed]
- Reiter, A.K.; Bolster, D.R.; Crozier, S.J.; Kimball, S.R.; Jefferson, L.S. AMPK represses TOP mRNA translation but not global protein synthesis in liver. Biochem. Biophys. Res. Commun. 2008, 374, 345–350. [Google Scholar] [CrossRef] [PubMed]
- Dowling, R.J.O.; Topisirovic, I.; Alain, T.; Bidinosti, M.; Fonseca, B.D.; Petroulakis, E.; Wang, X.; Larsson, O.; Selvaraj, A.; Liu, Y.; et al. mTORCI-mediated cell proliferation, but not cell growth, controlled by the 4E-BPs. Science 2010, 328, 1172–1176. [Google Scholar] [CrossRef] [PubMed]
- Levy, S.; Avni, D.; Hariharan, N.; Perry, R.P.; Meyuhas, O. Oligopyrimidine tract at the 5’ end of mammalian ribosomal protein mRNAs is required for their translational control. Proc. Natl. Acad. Sci. USA 1991, 88, 3319–3323. [Google Scholar] [CrossRef]
- Biberman, Y.; Meyuhas, O. Substitution of just five nucleotides at and around the transcription start site of rat β-actin promoter is sufficient to render the resulting transcript a subject for translational control. FEBS Lett. 1997, 405, 333–336. [Google Scholar] [CrossRef]
- Tang, H.; Hornstein, E.; Stolovich, M.; Levy, G.; Livingstone, M.; Templeton, D.; Avruch, J.; Meyuhas, O. Amino acid-induced translation of TOP mRNAs Is fully dependent on phosphatidylinositol 3-Kinase-mediated signaling, is partially inhibited by rapamycin, and is independent of S6K1 and rpS6 phosphorylation. Mol. Cell. Biol. 2001, 21, 8671–8683. [Google Scholar] [CrossRef]
- Morita, M.; Gravel, S.P.; Chénard, V.; Sikström, K.; Zheng, L.; Alain, T.; Gandin, V.; Avizonis, D.; Arguello, M.; Zakaria, C.; et al. MTORC1 controls mitochondrial activity and biogenesis through 4E-BP-dependent translational regulation. Cell MeTable 2013, 18, 698–711. [Google Scholar] [CrossRef]
- Larsson, O.; Morita, M.; Topisirovic, I.; Alain, T.; Blouin, M.-J.; Pollak, M.; Sonenberg, N. Distinct perturbation of the translatome by the antidiabetic drug metformin. Proc. Natl. Acad. Sci. USA 2012, 109, 8977–8982. [Google Scholar] [CrossRef]
- Huo, Y.; Iadevaia, V.; Yao, Z.; Kelly, I.; Cosulich, S.; Guichard, S.; Foster, L.J.; Proud, C.G. Stable isotope-labelling analysis of the impact of inhibition of the mammalian target of rapamycin on protein synthesis. Biochem. J. 2012, 444, 141–151. [Google Scholar] [CrossRef]
- Livingstone, M.; Sikström, K.; Robert, P.A.; Uzé, G.; Larsson, O.; Pellegrini, S.P. Assessment of mTOR-dependent translational regulation of interferon stimulated genes. PLoS ONE 2015, 10, e0133482. [Google Scholar] [CrossRef] [PubMed]
- Forrest, A.R.R.; Kawaji, H.; Rehli, M.; Baillie, J.K.; de Hoon, M.J.L.; Lassmann, T.; Itoh, M.; Summers, K.M.; Suzuki, H.; Daub, C.O.; et al. A promoter-level mammalian expression atlas. Nature 2014, 507, 462–470. [Google Scholar] [CrossRef] [PubMed]
- Suzuki, A.; Kawano, S.; Mitsuyama, T.; Suyama, M.; Kanai, Y.; Shirahige, K.; Sasaki, H.; Tokunaga, K.; Tsuchihara, K.; Sugano, S.; et al. DBTSS/DBKERO for integrated analysis of transcriptional regulation. Nucleic Acids Res. 2018, 46, D229–D238. [Google Scholar] [CrossRef]
- Lyabin, D.N.; Eliseeva, I.A.; Ovchinnikov, L.P. YB-1 Synthesis is regulated by mTOR signaling pathway. PLoS ONE 2012, 7, e52527. [Google Scholar] [CrossRef] [PubMed]
- Martin, M. Cutadapt removes adapter sequences from high-throughput sequencing reads. EMBnet J. 2011, 17, 10. [Google Scholar] [CrossRef]
- Langmead, B.; Trapnell, C.; Pop, M.; Salzberg, S.L. Ultrafast and memory-efficient alignment of short DNA sequences to the human genome. Genome Biol. 2009, 10, R25. [Google Scholar] [CrossRef] [PubMed]
- Quinlan, A.R. BEDTools: The Swiss-Army tool for genome feature analysis. Curr. Protoc. Bioinform. 2014, 47, 11.12.1–11.12.34. [Google Scholar] [CrossRef] [PubMed]
- Thorne, N.; Inglese, J.; Auld, D.S. Illuminating insights into firefly luciferase and other bioluminescent reporters used in chemical biology. Chem. Biol. 2010, 17, 646–657. [Google Scholar] [CrossRef]
- Boisvert, F.-M.; Ahmad, Y.; Gierliński, M.; Charrière, F.; Lamont, D.; Scott, M.; Barton, G.; Lamond, A.I. A Quantitative spatial proteomics analysis of proteome turnover in human cells. Mol. Cell. Proteomics 2012, 11, 1429. [Google Scholar] [CrossRef]
- Kleene, K.C.; Cataldo, L.; Mastrangelo, M.-A.A.; Tagne, J.-B.B. Alternative patterns of transcription and translation of the ribosomal protein L32 mRNA in somatic and spermatogenic cells in mice. Exp. Cell Res. 2003, 291, 101–110. [Google Scholar] [CrossRef]
- Eliseeva, I.; Vorontsov, I.; Babeyev, K.; Buyanova, S.; Sysoeva, M.; Kondrashov, F.; Kulakovskiy, I. In silico motif analysis suggests an interplay of transcriptional and translational control in mTOR response. Translation 2013, 1, 18–24. [Google Scholar] [CrossRef] [PubMed]
- Avni, D.; Shama, S.; Loreni, F.; Meyuhas, O. Vertebrate mRNAs with a 5’-terminal pyrimidine tract are candidates for translational repression in quiescent cells: Characterization of the translational cis-regulatory element. Mol. Cell. Biol. 1994, 14, 3822–3833. [Google Scholar] [CrossRef] [PubMed]
- Jefferies, H.B.J.; Thomas, G.; Thomas, G. Elongation factor-1α mRNA is selectively translated following mitogenic stimulation. J. Biol. Chem. 1994, 269, 4367–4372. [Google Scholar] [PubMed]
- Gao, X.; Wan, J.; Liu, B.; Ma, M.; Shen, B.; Qian, S.B. Quantitative profiling of initiating ribosomes in vivo. Nat. Methods 2015, 12, 147–153. [Google Scholar] [CrossRef] [PubMed]
- Grolleau, A.; Bowman, J.; Pradet-Balade, B.; Puravs, E.; Hanash, S.; Garcia-Sanz, J.A.; Beretta, L. Global and specific translational control by rapamycin in T cells uncovered by microarrays and proteomics. J. Biol. Chem. 2002, 277, 22175–22184. [Google Scholar] [CrossRef] [PubMed]
- Morita, T.; Sobuě, K. Specification of neuronal polarity regulated by local translation of CRMP2 and tau via the mTOR-p70S6K pathway. J. Biol. Chem. 2009, 284, 27734–27745. [Google Scholar] [CrossRef] [PubMed]
- Zhang, Z.C.; Nechushtan, H.; Jacob-Hirsch, J.; Avni, D.; Meyuhas, O.; Razin, E. Growth-dependent and PKC-mediated translational regulation of the upstream stimulating factor-2 (USF2) mRNA in hematopoietic cells. Oncogene 1998, 16, 763–769. [Google Scholar] [CrossRef][Green Version]
- Hagner, P.R.; Mazan-Mamczarz, K.; Dai, B.; Balzer, E.M.; Corl, S.; Martin, S.S.; Zhao, X.F.; Gartenhaus, R.B. Ribosomal protein S6 is highly expressed in non-Hodgkin lymphoma and associates with mRNA containing a 5′ terminal oligopyrimidine tract. Oncogene 2011, 30, 1531–1541. [Google Scholar] [CrossRef]
- Avni, D.; Biberman, Y.; Meyuhas, O. The 5′ terminal oligopyrimidine tract confers translational control on TOP mRNAs in a cell type-and sequence context-dependent manner. Nucleic Acids Res. 1996, 25, 995–1001. [Google Scholar] [CrossRef]
- Choo, A.Y.; Yoon, S.-O.; Kim, S.G.; Roux, P.P.; Blenis, J. Rapamycin differentially inhibits S6Ks and 4E-BP1 to mediate cell-type-specific repression of mRNA translation. Proc. Natl. Acad. Sci. USA 2008, 105, 17414–17419. [Google Scholar] [CrossRef]
- Zid, B.M.; O’Shea, E.K. Promoter sequences direct cytoplasmic localization and translation of mRNAs during starvation in yeast. Nature 2014, 514, 117–121. [Google Scholar] [CrossRef] [PubMed]
- Bregman, A.; Avraham-Kelbert, M.; Barkai, O.; Duek, L.; Guterman, A.; Choder, M. Promoter elements regulate cytoplasmic mRNA decay. Cell 2011, 147, 1473–1483. [Google Scholar] [CrossRef] [PubMed]
- Slobodin, B.; Han, R.; Calderone, V.; Vrielink, J.A.F.O.; Loayza-Puch, F.; Elkon, R.; Agami, R. Transcription impacts the efficiency of mRNA translation via co-transcriptional N6-adenosine methylation. Cell 2017, 169, 326–337.e12. [Google Scholar] [CrossRef] [PubMed]
- Parry, T.J.; Theisen, J.W.M.; Hsu, J.Y.; Wang, Y.L.; Corcoran, D.L.; Eustice, M.; Ohler, U.; Kadonaga, J.T. The TCT motif, a key component of an RNA polymerase II transcription system for the translational machinery. Genes Dev. 2010, 24, 2013–2018. [Google Scholar] [CrossRef] [PubMed]
- Coots, R.A.; Liu, X.-M.; Mao, Y.; Dong, L.; Zhou, J.; Wan, J.; Zhang, X.; Qian, S.-B. m6A Facilitates eIF4F-independent mRNA Translation. Mol. Cell 2017, 68, 504–514.e7. [Google Scholar] [CrossRef] [PubMed]
- Meyer, K.D.; Saletore, Y.; Zumbo, P.; Elemento, O.; Mason, C.E.; Jaffrey, S.R. Comprehensive analysis of mRNA methylation reveals enrichment in 3′ UTRs and near stop codons. Cell 2012, 149, 1635–1646. [Google Scholar] [CrossRef]
© 2019 by the authors. Licensee MDPI, Basel, Switzerland. This article is an open access article distributed under the terms and conditions of the Creative Commons Attribution (CC BY) license (http://creativecommons.org/licenses/by/4.0/).