Article

The Conserved Non-Coding Sequence 2 (CNS2) Enhances CD69 Transcription through Cooperation between the Transcription Factors Oct1 and RUNX1

1
Microbiology National Center, Instituto de Salud Carlos III, Majadahonda, 28220 Madrid, Spain
2
Department of Experimental and Health Science, University Pompeu Fabra, 08003 Barcelona, Spain
*
Author to whom correspondence should be addressed.
Genes 2019, 10(9), 651; https://doi.org/10.3390/genes10090651
Submission received: 27 June 2019 / Revised: 29 July 2019 / Accepted: 23 August 2019 / Published: 28 August 2019
(This article belongs to the Section Molecular Genetics and Genomics)

Abstract

:
The immune regulatory receptor CD69 is expressed upon activation in all types of leukocytes and is strongly regulated at the transcriptional level. We previously described that, in addition to the CD69 promoter, there are four conserved noncoding regions (CNS1-4) upstream of the CD69 promoter. Furthermore, we proposed that CNS2 is the main enhancer of CD69 transcription. In the present study, we mapped the transcription factor (TF) binding sites (TFBS) from ChIP-seq databases within CNS2. Through luciferase reporter assays, we defined a ~60 bp sequence that acts as the minimum enhancer core of mouse CNS2, which includes the Oct1 TFBS. This enhancer core establishes cooperative interactions with the 3′ and 5′ flanking regions, which contain RUNX1 BS. In agreement with the luciferase reporter data, the inhibition of RUNX1 and Oct1 TF expression by siRNA suggests that they synergistically enhance endogenous CD69 gene transcription. In summary, we describe an enhancer core containing RUNX1 and Oct1 BS that is important for the activity of the most potent CD69 gene transcription enhancer.

1. Introduction

In mammals, 95% of the genome is noncoding, and 40% of the noncoding region plays a role in transcription regulation [1]. In combination with gene promoters, cis-regulatory elements contribute to gene transcriptional regulation as enhancers or repressors. Cis-regulatory elements are often identified as conserved noncoding sequences (CNS) with DNase I hypersensitivity. Cis-regulatory elements contain binding sites for trans-acting transcription factors (TFBSs) and serve as centers of epigenetic changes [2,3]. These elements can be located around or within genes and can affect their transcription from as far as megabases [4]. The three-dimensional conformation of the genome seems to be important to promote contacts between distant elements and their target genes. Thus, these sequences form complex regulatory landscapes within the noncoding genome.
CD69 is a leukocyte activation marker that plays an important role in the regulation of immune responses [5,6,7,8]. CD69 is dully expressed on the membrane of some leukocyte subsets in a steady state [9,10,11], and it is strongly and rapidly upregulated on all leukocytes upon activation. By the study of CD69-deficient mice, CD69 has been defined as a regulator of the immune response in different murine models of tumor, infection, autoimmune disease and other inflammatory models [6,7,8,12,13,14,15,16]. Galectin-1, S100A8/A9 and myosin light chains 9 and 12 have been proposed as CD69 ligands [5,17,18]. In T cells, CD69 is upregulated in response to TCR engagement [19,20], cytokines [21,22,23] and PKC activators [11,24,25,26,27]. This upregulation is strongly dependent on transcriptional induction [20,25,28]. Human and mouse CD69 promoters are able to direct transcription in resting cells, as well as to increase CD69 transcription in stimulated cells [29]. This inducibility is attributed to cis-elements located in the promoter interacting with Erg-1, Erg-3, ATF-3/CREB, AP-1 and NFkB transcription factors [29,30,31].
We previously described the existence of, in addition to the CD69 promoter, another five cis-regulatory regions: A non-conserved hypersensitivity site (HS) located within the first intron of the CD69 gene and four conserved noncoding regions (CNS1-4) upstream of the CD69 promoter [32,33]. In murine T cells, these regions showed DNaseI sensitivity and specific histone modifications. Moreover, CNS2 and CNS4 had constitutive and inducible enhancer activity in reporter assays, with CNS2 being the region with the highest inducible enhancer capacity [32,33]. Furthermore, in a recent work, we proposed that CNS2 is the main enhancer of CD69 promoter transcription in vivo [34] based on the characterization of TFBSs conserved between 6 mammal species and explored the contribution of some of its regulatory features to its enhancing capacity. However, that study did not take into account sequences to which transcription factors bind. In the present study, we mapped TFBSs on mouse CNS2 according to updated ChIP-seq data; and, based on their distribution, we divided them into five different regions. Then, we determined the enhancer activity of CNS2 and identified its location through luciferase reporter assays. With this approach, we found a minimum enhancer core of ~60 bp that includes an Oct1 (POU2F1) BS. This core functionally interacts with adjacent regions at the 5′ end, which contains RUNX1 BSs, and at the 3′ end, which contains SRF BSs, via a cooperative modular model that leads to CD69 promoter induced enhancement of transcription. Moreover, we assessed the roles of Oct1 and RUNX1 in the transcriptional regulation of the endogenous CD69 gene by siRNA. In agreement with the luciferase reporter data, the gene silencing results also indicate synergistic cooperation between these TFs to enhance CD69 transcription.
In summary, our work strengths support indicating that CNS2 is a potent enhancer of mouse CD69 promoter transcription and defines an enhancer core that acts together with flanking cis-interacting TFs through a cooperative modular model to increase CD69 promoter induced enhancement of transcription.

2. Materials and Methods

Data-mining, identification and mapping of conserved TFBSs within CNS2. The CNS2 sequences of several mammal species were downloaded and analyzed for the presence of conserved TFBSs, as previously described [34]. Transcription factor binding data determined by chromatin immunoprecipitation followed by sequencing (ChIP-seq) in different cell lines were obtained from the ENCODE consortium for human (hg19 genome) data [35] and both the ChIP Atlas [36] (Database Center for Life Science, Kyushu University, Fukuoka, Japan) and the ChIPBase v2.0 (version 2.3.4, Qu Lab, School of Science, Sun Yat-Sen University, Guangzhou, China) for mouse (mm10 genome) data [37] and were displayed using the SnapGene® software (GSL Biotech; available at www.snapgene.com) to create a comprehensive map of the TFBSs contained within CNS2.
Mouse luciferase plasmids. The mouse CD69 promoter (−1 to −609, BAC clone RP24-188C4) was cloned into BglII and HindIII restriction enzyme (RE) cloning sites of the commercial luciferase vector pGL3 basic (Promega, E1751, Madison, WI, USA, [Addgene sequence]) (pPr plasmid). Then, the CNS2 region (mouse 2010 chr6: 129,234,359–129,235,318) was cloned into KpnI and XhoI RE sites, with the introduction of an EcoRI site by KpnI for further cloning (pPr2 plasmid). Modified CNS2 constructs containing different regions or specific TFBSs were generated by PCR amplification of pPr2 employing custom primers (Table 1), followed by cloning of the fragments into EcoRI and XhoI sites in the plasmid containing the mouse CD69 promoter (Table 2). The resulting luciferase plasmids were validated through Sanger sequencing (Figure 1).
Luciferase assays. Human Jurkat T cells (5–7 × 10⁵) were transfected with 1 µg of modified firefly luciferase plasmid (purified with the Plasmid Maxi Kit from Qiagen 12163) plus 20 ng of pRL-TK (Renilla luciferase plasmid, Promega E224, Madison, USA [Addgene sequence]) to standardize the luciferase activity independent of the efficiency of transfection between samples) using Effectene (Qiagen 301425) following the manufacturer’s protocol. After transfection, the cells were cultured at 37°C with 5% CO2 for 24 h and were then stimulated with 10 ng/mL PMA and 500 ng/mL Ionomycin for an additional 24 h. Forty-eight hours after transfection, cells were lysed with passive lysis buffer (Promega E1941, Madison, WI USA), and luciferase activity (firefly/renilla) was measured with a dual luciferase kit (Promega E1910, Madison, WI USA) using the Orion II microplate luminometer (Berthold 11300010, Bad Wildbad, Germany).
Design of dicer substrate small interfering RNA (DsiRNA). All DsiRNAs described were synthetized by IDT (Integrated DNA Technologies, Coralville, IA, USA). Three DsiRNAs were designed for each gene to be silenced in addition to two additional DsiRNAs and a negative control targeting NC1. The genome reference used for DsiRNA design was mm10. Table 3 provides the sequence and cross-reacting properties of DsiRNAs against POU2F1 (Oct1) and RUNX1 mRNAs.
DsiRNA transfection and CD69 characterization. Mouse EL-4 T cells (105) were transfected with a 1 µM pool of three DsiRNAs against POU2F1 (Oct1) or RUNX1 in a 1:1:1 ratio or a negative control DsiRNA against NC1. RNA of transfected cells were extracted, and a qPCR was performed to assess mRNA levels of RUNX1 and POU2F1 (Oct1).
Transfected cells were cultured in a 96-well plate at 37 °C with 5% CO2 for 16 h and then stimulated or not with 10 ng/mL PMA and 500 ng/mL ionomycin for an additional 6 h. Twenty-two hours after transfection, CD69 surface expression was measured by flow cytometry as follows: cells were washed twice in cold 1X PBS and stained for 30 min at 4 °C with 0.5 µg of an α-mCD69/PE-Cy7 monoclonal antibody (Clone H1.2F3, eBioscience 25-0691-81, San Diego, CA, USA). Samples were acquired with a FACSCanto (Becton Dickinson, Franklin Lakes, NJ USA) flow cytometer, and data were analyzed using FlowJo software. The percentage of inhibition of CD69 expression with respect to its expression in the NC-1 control was represented using GraphPad Prism 7 (version 7, San Diego, CA, USA).
Data representation and statistical analysis. Luciferase assay and flow cytometry data were plotted with GraphPad Prism 7. Significant differences between multiple conditions were tested with a nonparametric one-way ANOVA test performed with GraphPad Prism 7.

3. Results

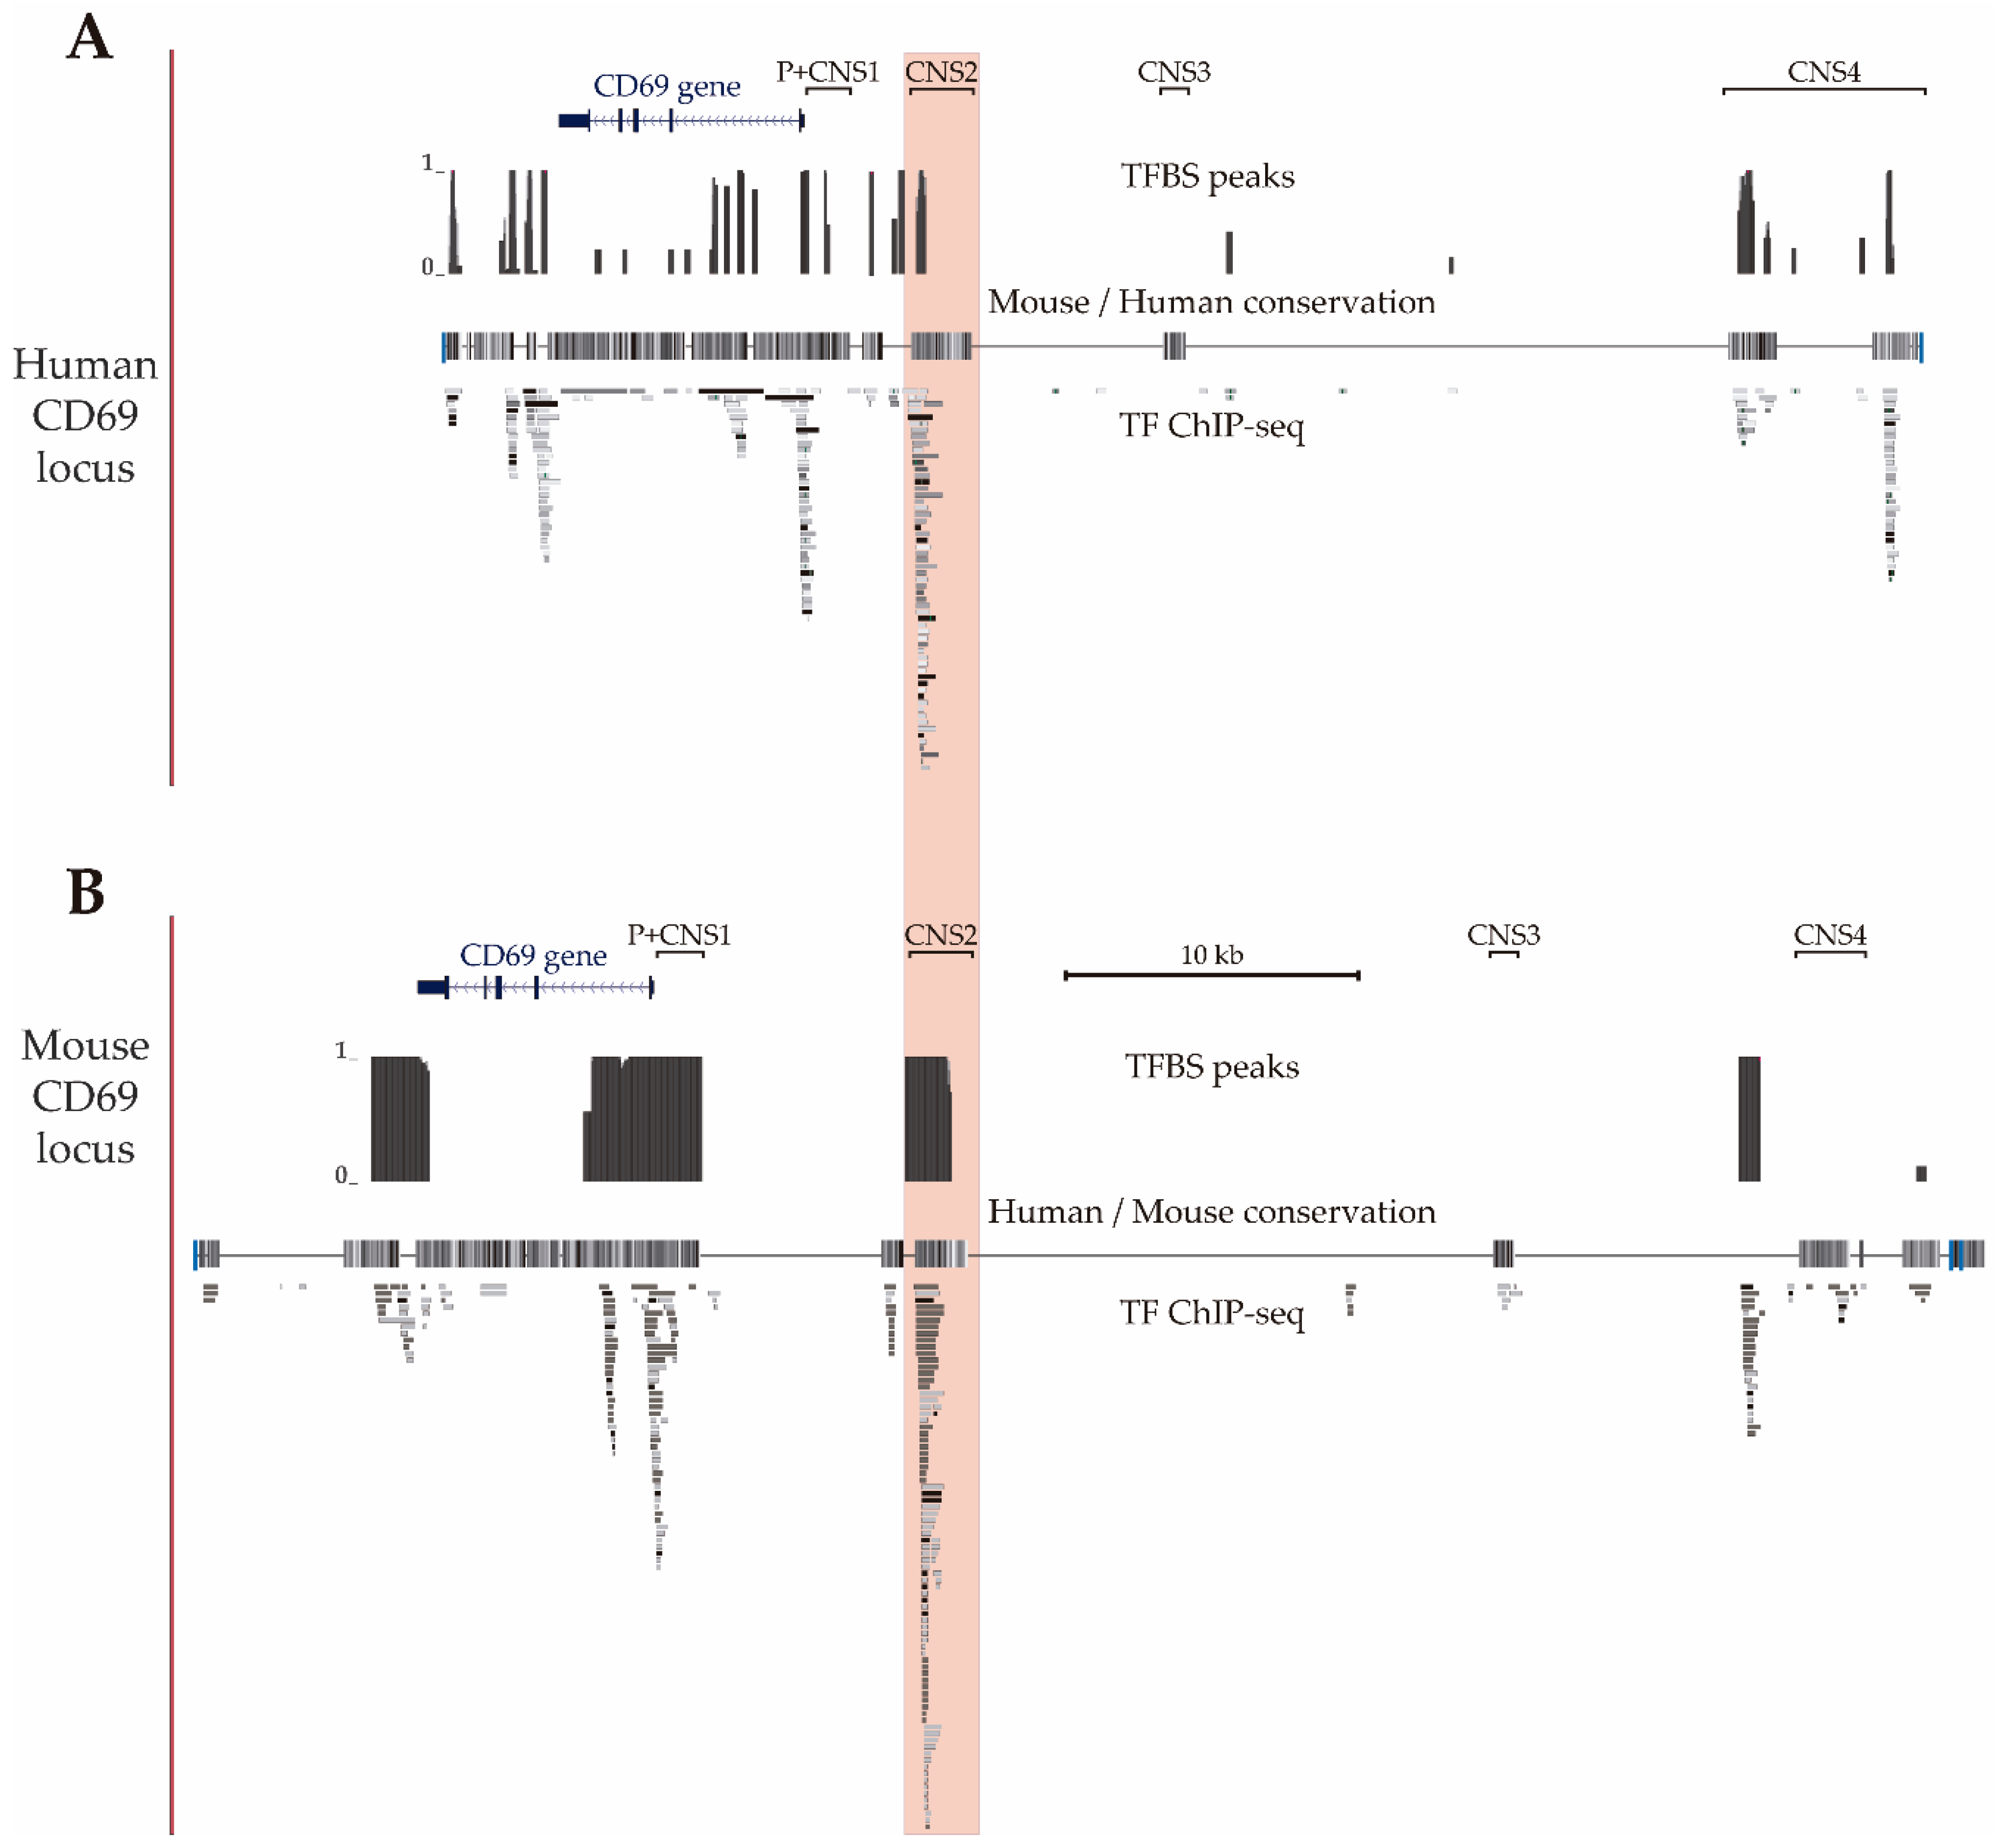
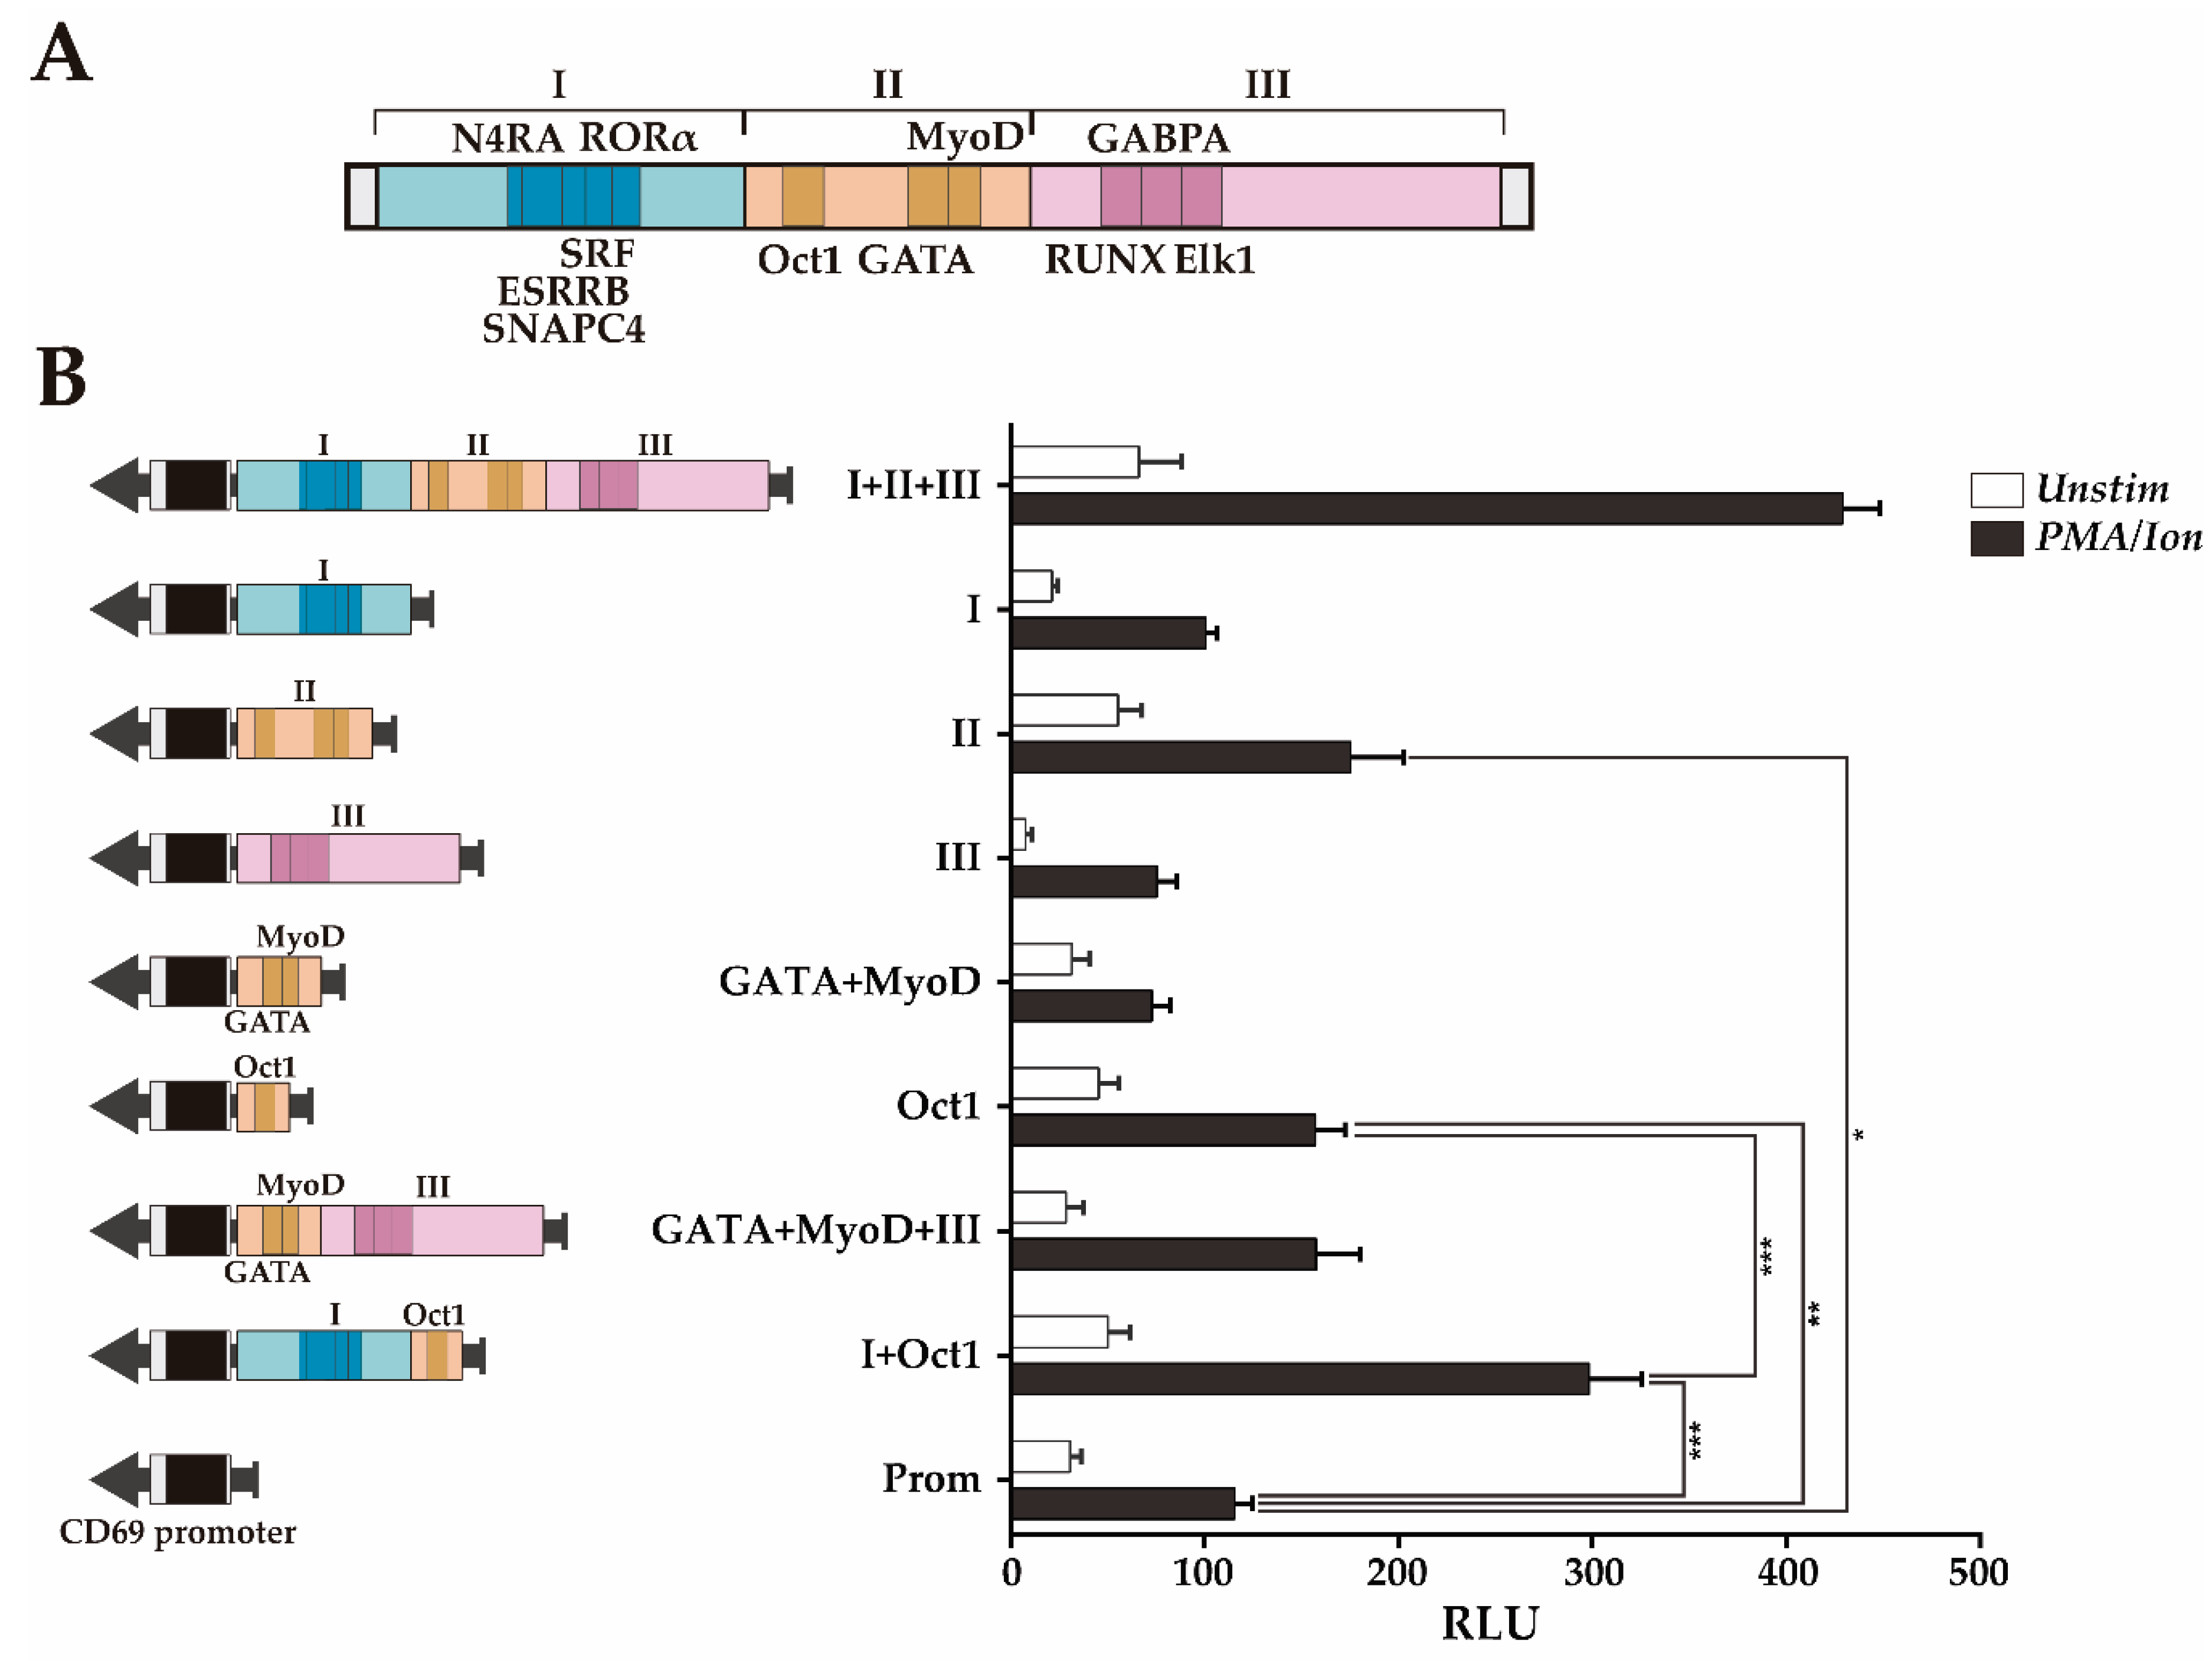
3.1. Mapping of Transcription Factor Binding Sites within Mouse CNS2 Enhancer

In a previous data-mining study of the regulatory features of the CNSs of the CD69 gene, we proposed that CNS2 is the putative main enhancer based on the enrichment of chromatin accessibility, modifications and bound TF [34]. Given the availability of new Chip-seq data, in the present work, we updated the map of TFBSs in the human locus using Chip-seq data from human hematopoietic cell lines available from the ENCODE consortium (Figure 2A) and also mapped bound TF to the mouse locus using data from murine primary B and T cells available from the ChIP Atlas and ChIPBase v2.0 databases (Figure 2B) to compare them. These maps showed that the human CD69 3′untranslated region, intron 1, promoter, CNS1, CNS2 and CNS4 and in the murine 3′untranslated region, promoter, CNS1 and CNS2 have a higher density of TFBSs (TFBSs per 100 bp) than the rest of noncoding sequence within the CD69 locus. Thus, the 3′untranslated region, promoter, CNS1 and CNS2 of both species contain numerous TFBSs, which suggests that they may play a particularly important role in the transcriptional regulation of the CD69 promoter. In agreement with our previous observations, mouse CNS2 also shows a higher total number of TFBSs compared to the other regulatory regions within CD69 locus.
In our previous work [34], we subdivided CNS2 into different subregions based on the presence of TFBSs conserved between 6 mammal species and tested their contribution to the enhancer capacity of CNS2. However, that characterization left undefined regions where bound TFs have subsequently been identified and could play a relevant role. Moreover, considering that some regulatory mechanisms may have diverted during evolution and that, consequently, some important TFBS might not be conserved, in the present work, we subdivided the mouse CNS2 into five regions based on the abovementioned updated ChIP-seq data, taking into account all bound TFs, as well as those bound to sites that are not conserved between six mammal species (Figure 3A). Regions II and III contain more than 70% of TFs bound to non-conserved sites, while regions I and IV contains TFs bound only to conserved BSs. Region V has intermediate characteristics.

3.2. Transcriptional Enhancer Capacity of the CNS2 Region and Its Enhancer Core Activity

Then, we assessed the contribution of the different regions to mouse CNS2 enhancer capacity using a luciferase reporter assay in Jurkat cells stimulated or not with PMA plus ionomycin. In this experiment, we compared the capacity of the complete CNS2 sequence (Prom+I-V) to enhance transcription from the mouse CD69 promoter with those of different CNS2 fragments: I+II+III, II+III and I+II (Prom+I-III, Prom+II-III and Prom+I-II). As shown in Figure 3B regions II+III have an inducible enhancer activity similar to that of regions I+II+III, while regions I+II have lower enhancer potential. Therefore, regions II+III seem to contain the most of the relevant enhancing features for transcription for the CD69 promoter upon PMA/ionomycin activation, while those of regions I, IV and V have a more modest contribution.
While region III contains three overlapping BSs, region II has two separate subregions with TFBSs: One with an Oct1 BS and another with GATA+MyoD TFBSs. We further assessed the contribution of the individual regions I, II and III, as well as the subregions of region II separately or in combination with the region I or III, but keeping, within the tested fragment, the original sequence with the endogenous TFBSs distribution. Figure 4 shows that region II (Prom+II) significantly increases CD69 promoter transcriptional activity upon activation, but neither region I (Prom+I) nor region III (Prom+III) increases CD69 promoter transcriptional activity upon activation (Figure 4B).
The ~60 bp sequence of region II containing the Oct1 TFBS (Prom+Oct1) significantly increases the inducible enhancer activity in a similar manner as region II (Prom+II), while the ~65 bp sequence containing GATA+MyoD TFBSs (Prom+GATA+MyoD) did not significantly increase the inducible enhancer activity. These results suggest that the subregion that contains the Oct1 TFBS constitutes the most relevant regulatory feature of region II. Moreover, considering that regions I and III alone do not show enhancing activity, these data indicate that the ~60 bp sequence containing the Oct1 TFBS is the shortest sequence identified within regions I+II+III that has transcriptional enhancer activity, likely acting as the enhancer core of CD69 transcription. Furthermore, the combination of this sequence with region I (Prom+I+Oct1, ~200 bp) had a transcriptional enhancing capacity as high as half of that of region I-III and similar to that of regions I and II together (Figure 3B and Figure 4B). Although the combination of region III with the ~65 bp sequence GATA+MyoD (Prom+GATA+MyoD+III, ~190 bp) increased the transcriptional activity twofold compared to the sequences containing the BS of each TF individually, it did not reach transcription levels significantly higher than those of the promoter alone. Since GATA and MyoD BS are between Oct1 and RUNX1, it is not possible to test Oct1+RUNX1 without altering the original TFBSs distribution. Thus, considering that regions II+III have almost as much enhancer activity as regions I-III (Figure 3B), it is suggested that the Oct1 TFBS also needs to cooperate with region III to enhance transcription. Thus, the Oct1 TFBS seems to act as the enhancer core of CD69 transcription and can synergize with either region I or region III or with both of them to achieve greater enhancement of transcription from the CD69 promoter. Altogether, these data suggest a cooperative modular model between the TFs in region II and those in regions I and III.

3.3. RUNX1 and Oct1 Silencing Affects the Transcriptional Regulation of CD69

Given the synergy observed between the Oct1 BS and region III and the fact that the latter contains a BS for RUNX1, an important TF during development and homeostasis of immune cells, we evaluated the relative contribution of Oct1 and RUNX1 to CD69 transcriptional regulation. To do so, we silenced them individually or in combination using siRNA in the mouse T cell line EL-4 and analyzed the effect of silencing on surface CD69 protein in unstimulated cells or cells activated with PMA/Ion. Under both conditions, inhibition of RUNX1 and Oct1 individually resulted in a CD69 expression reduction of ~40%, and the joint inhibition of both TFs did not further reduce CD69 expression (Figure 5). Therefore, RUNX1 and Oct1 contribute to enhancing CD69 expression both at resting and after stimulation. Moreover, the fact that the effect of their individual silencing was the same as that of their combined deletion suggests that they need each other to increase CD69 expression, which supports the cooperative model of enhancing transcription.

4. Discussion

In this work, we deepened the understanding of the enhancer function of mouse conserved noncoding sequence 2 (CNS2) on CD69 promoter transcriptional regulation. Using ChIP-seq data, we mapped the TFBS within CNS2 and used the TFBS distribution to define different regions. Then, we tested the effect of these regions on transcription induced by the CD69 promoter in response to PMA/ionomycin activation in luciferase reporter assays. In this way, we defined a minimal sequence with intrinsic enhancer capacity that contained a conserved Oct1 BS that could further enhance transcription if it was accompanied by either a 3′ flanking region containing a conserved SRF BS or a 5′ flanking region containing conserved RUNX1, GABPA and Elk-1 TFBSs and could enhance transcription to even higher levels in the presence of both of them. These results suggest cooperation between these TFs. We further tested the effect of Oct1 and RUNX1 silencing on CD69 protein expression. It these experiments, the observed synergy seemed even more striking because the effect of each TF depended on the presence of the other.
In previous studies, we observed that among the different CNSs, CNS2 had the most potent enhancer activity on CD69 transcription. In the present work, the mapping of TFBSs on the CD69 locus showed that several of the TFs that have been shown to bind to CNS2 also bind the promoter region, which suggests their importance in the transcriptional regulation of CD69. Despite the fact that there are fewer data available for the TFs bound to the mouse CD69 locus than to the human CD69 locus, similar to humans, mouse CNS2 is also the region with the highest enrichment of TFBSs. Occupancy by specific TF has been described to be a predictor of enhancer activity of a given region [38]. Thus, these results highlight the importance of CNS2 as a transcriptional enhancer of CD69.
The present results regarding the enhancer capacity of CNS2 regions are in agreement with our previous work, in which the regions with the highest enhancer capacity comprises regions I, II and III, described in the current study [34]. In the present study, the further subdivision of this regions into smaller regions allowed us to identify an Oct1 BS-containing minimum enhancer core that can cooperate with either an adjacent region at the 3′ end (region I, containing an SRF TFBS) or 5′ end (region III, containing a RUNX1 TFBS) or with both of them to reach greater enhancer activity. Interestingly, although region I did not have enhancer activity per se, it could increase that of Oct1 BS. This could be explained by an interaction of TFBSs in region I with the transcriptional machinery that bounds to the region containing the Oct1 BS. Altogether, these data suggest a cooperative modular model of transcription factors that synergistically enhances transcription. Cooperation between transcription factors may occur based on their physical association, a mechanism frequently described for enhancer sequences that affect the transcriptional behavior of several immune system genes [39,40,41].
Although Oct1 has been widely studied as a regulator of transcription in many cell types [42,43], its precise role is still unclear. Oct1 is known to have both activating [44,45,46] and silencing activity [47,48,49]; moreover, this TF has been described to play a role in CD4+ T cell differentiation [50] and memory formation [51], orchestrating the fate and function of CD4+ effector T cells as a switchable stabilizer of the repressed and inducible state [52], acting at hypersensitivity sites that are distant from promoters of target genes in several cases. RUNX1 has been implicated in the development and homeostasis of different immune subpopulations [53].
As is the case for CNS2, many enhancers are located far from their target genes, but are able to specifically communicate with distal promoters over large distances [54,55,56] through the formation of a chromatin loop [57,58]. Thus, chromosome topology is critical for the interactions between distant enhancers and promoters. However, the relevance of particular interactions for target gene transcription is difficult to assess because they have not always been related to functional outcomes [59,60].
Because of the lack of a genomic context in reporter plasmids, luciferase assay data do not reflect the effects of chromosome topology on transcription. However, the luciferase assay can still be used as a predictor of the regulatory capacity of elements that can be further characterized in a more physiologic context. With that aim, we tested the effects of RUNX1 and Oct1 silencing on the expression of the endogenous CD69 gene. Silencing of these TFs separately in the mouse EL-4 T cell line reduced CD69 expression as much as their joint silencing, suggesting that they can enhance CD69 expression, but only if the other TF is also present. This result suggests a mode of action that is completely synergic. Given the predominant enhancer role of CNS2 in CD69 transcription and, within it, of the Oct1 TFBS, and its observed cooperation with region I, we believe that these results might reflect, to some extent, the role of Oct1 and RUNX1 acting on the BSs described in regions I and II of CNS2. However, we cannot rule out that they might also be influenced by the action of these TFs on other BSs within the CD69 locus. The ChIP-seq databases show two RUNX1 BS found in CD69 promoter sequence. However, since these regions have a much more modest enhancing capacity, we propose that the main enhancer effect of RUNX1 is through the BS in CNS2. Future experiments using ChIP, TF silencing and TFBS mutagenesis might shed more light on the role of the studied TF in CD69 transcription in the genomic context.
In summary, our results strengthen evidence of the role of CNS2 as an essential enhancer of mouse CD69 promoter transcription. Despite the need for further studies on the role of CNS2 in the genomic context, to our knowledge, no detailed studies on the composition and function of regulatory elements within this enhancer have been published. Our work is, therefore, a step forward in understanding how CNS2 regulates CD69 expression.

Author Contributions

M.G.F. performed the literature search, data collection and figures. M.G.F., L.N., E.L., E.A.-P. and P.L. designed experiments and discussed data. M.G.F., E.A.-P. and P.L. performed manuscript writing. P.L. was responsible for the project design and management.

Funding

This work was supported by the Spanish Ministry of Science, Innovation and Universities and the Carlos III National Health Institute (ISCIII)—RITCC (RD12/0036/15649). Miguel Gómez Fontela was supported by a pre-doctoral fellowship (FPU, FPU 15/05605) from the Spanish Ministry of Education, Culture and Sports (MECD).

Conflicts of Interest

The authors declare no conflict of interest. The funders had no role in the design of the study; in the collection, analyses, or interpretation of the data; in the writing of the manuscript; or in the decision to publish the results.

References

  1. Stamatoyannopoulos, J.A. What does our genome encode? Genome Res. 2012, 22, 1602–1611. [Google Scholar] [CrossRef] [PubMed] [Green Version]
  2. Kanno, Y.; Vahedi, G.; Hirahara, K.; Singleton, K.; O’Shea, J.J. Transcriptional and Epigenetic Control of T Cell Lineage Specification: Molecular Mechanisms Underlying Commitment and Plasticity. Annu. Rev. Immunol. 2012, 30, 707–731. [Google Scholar] [CrossRef] [PubMed]
  3. Lee, G.R.; Kim, S.T.; Spilianakis, C.G.; Fields, P.E.; Flavell, R.A. T Helper Cell Differentiation: Regulation by cis Elements and Epigenetics. Immunity 2006, 24, 369–379. [Google Scholar] [CrossRef] [PubMed] [Green Version]
  4. Montavon, T.; Duboule, D. Landscapes and archipelagos: Spatial organization of gene regulation in vertebrates. Trends Cell Biol. 2012, 22, 347–354. [Google Scholar] [CrossRef] [PubMed]
  5. Esplugues, E.; Sancho, D.; Vega-Ramos, J.; Martínez-A, C.; Syrbe, U.; Hamann, A.; Engel, P.; Sánchez-Madrid, F.; Lauzurica, P. Enhanced Antitumor Immunity in Mice Deficient in CD69. J. Exp. Med. 2003, 197, 1093–1106. [Google Scholar] [CrossRef] [PubMed] [Green Version]
  6. Viedma, F.; De La Fuente, H.; Sancho, D.; Gomez, M.; Esplugues, E.; Gordon-Alonso, M.; García-López, M.A.; Martínez-A, C.; Lauzurica, P.; Sánchez-Madrid, F. CD69 downregulates autoimmune reactivity through active transforming growth factor-β production in collagen-induced arthritis. J. Clin. Investig. 2003, 112, 872–882. [Google Scholar]
  7. Notario, L.; Alari-Pahissa, E.; De Molina, A.; Lauzurica, P. CD69 Deficiency Enhances the Host Response to Vaccinia Virus Infection through Altered NK Cell Homeostasis. J. Virol. 2016, 90, 6464–6474. [Google Scholar] [CrossRef] [PubMed] [Green Version]
  8. Vega-Ramos, J.; Alari-Pahissa, E.; Valle, J.D.; Carrasco-Marin, E.; Esplugues, E.; Borras, M.; Martinez, A.C.; Lauzurica, P. CD69 limits early inflammatory diseases associated with immune response to Listeria monocytogenes infection. Immunol. Cell Biol. 2010, 88, 707–715. [Google Scholar] [CrossRef] [PubMed]
  9. Alari-Pahissa, E.; Vega-Ramos, J.; Zhang, J.-G.; Castaño, A.R.; Turley, S.J.; Villadangos, J.A.; Lauzurica, P. Differential effect of CD69 targeting on bystander and antigen-specific T cell proliferation. J. Leukoc. Biol. 2012, 92, 145–158. [Google Scholar] [CrossRef] [PubMed]
  10. Lanier, L.L. Interleukin 2 activation of natural killer cells rapidly induces the expression and phosphorylation of the Leu-23 activation antigen. J. Exp. Med. 1988, 167, 1572–1585. [Google Scholar] [CrossRef] [PubMed]
  11. Hara, T. Human T cell activation. III. Rapid induction of a phosphorylated 28 kD/32 kD disulfide-linked early activation antigen (EA 1) by 12-o-tetradecanoyl phorbol-13-acetate, mitogens, and antigens. J. Exp. Med. 1986, 164, 1988–2005. [Google Scholar] [CrossRef] [PubMed]
  12. Matloubian, M.; Lo, C.G.; Cinamon, G.; Lesneski, M.J.; Xu, Y.; Brinkmann, V.; Allende, M.L.; Proia, R.L.; Cyster, J.G. Lymphocyte egress from thymus and peripheral lymphoid organs is dependent on S1P receptor 1. Nature 2004, 427, 355–360. [Google Scholar] [CrossRef] [PubMed]
  13. Sancho, D.; Gómez, M.; Del Hoyo, G.M.; Lamana, A.; Esplugues, E.; Lauzurica, P.; Martinez-A, C.; Sánchez-Madrid, F.; Sancho-Madrid, D. CD69 targeting differentially affects the course of collagen-induced arthritis. J. Leukoc. Biol. 2006, 80, 1233–1241. [Google Scholar] [CrossRef]
  14. Esplugues, E.; Vega-Ramos, J.; Cartoixà, D.; Vazquez, B.N.; Salaet, I.; Engel, P.; Lauzurica, P. Induction of tumor NK-cell immunity by anti-CD69 antibody therapy. Blood 2005, 105, 4399–4406. [Google Scholar] [CrossRef] [PubMed] [Green Version]
  15. Martin, P.; Gómez, M.; Lamana, A.; Marín, A.M.; Cortés, J.R.; Ramirez-Huesca, M.; Barreiro, O.; López-Romero, P.; Gutiérrez-Vázquez, C.; De La Fuente, H.; et al. The leukocyte activation antigen CD69 limits allergic asthma and skin contact hypersensitivity. J. Allergy Clin. Immunol. 2010, 126, 355–365. [Google Scholar] [CrossRef] [PubMed]
  16. Gomez, M.; Sanz-Gonzalez, S.M.; Abu Nabah, Y.N.; Lamana, A.; Sanchez-Madrid, F.; Andres, V. Atherosclerosis development in apolipoprotein E-null mice deficient for CD69. Cardiovasc. Res. 2009, 81, 197–205. [Google Scholar] [CrossRef] [PubMed]
  17. Cruz-Adalia, A.; Jiménez-Borreguero, L.J.; Ramírez-Huesca, M.; Chico-Calero, I.; Barreiro, O.; López-Conesa, E.; Fresno, M.; Sánchez-Madrid, F.; Martín, P. CD69 Limits the Severity of Cardiomyopathy After Autoimmune Myocarditis. Circulation 2010, 122, 1396–1404. [Google Scholar] [CrossRef] [Green Version]
  18. Cibrián, D.; Sánchez-Madrid, F. CD69: From activation marker to metabolic gatekeeper. Eur. J. Immunol. 2017, 47, 946–953. [Google Scholar] [CrossRef]
  19. Rutella, S.; Rumi, C.; Lucia, M.B.; Barberi, T.; Puggioni, P.L.; Lai, M.; Romano, A.; Cauda, R.; Leone, G. Induction of CD69 antigen on normal CD4+ and CD8+ lymphocyte subsets and its relationship with the phenotype of responding T-cells. Cytometry 1999, 38, 95–101. [Google Scholar] [CrossRef]
  20. Testi, R.; Phillips, J.H.; Lanier, L.L. T cell activation via Leu-23 (CD69). J. Immunol. 1989, 143, 1123–1128. [Google Scholar]
  21. Shiow, L.R.; Rosen, D.B.; Brdičková, N.; Xu, Y.; An, J.; Lanier, L.L.; Cyster, J.G.; Matloubian, M. CD69 acts downstream of interferon-α/β to inhibit S1P1 and lymphocyte egress from lymphoid organs. Nature 2006, 440, 540–544. [Google Scholar] [CrossRef] [PubMed]
  22. Feng, H.; Zhang, D.; Palliser, D.; Zhu, P.; Cai, S.; Schlesinger, A.; Maliszewski, L.; Lieberman, J. Listeria-Infected Myeloid Dendritic Cells Produce IFN-β, Priming T Cell Activation. J. Immunol. 2005, 175, 421–432. [Google Scholar] [CrossRef] [PubMed]
  23. Lin, S.-J.; Chao, H.-C.; Kuo, M.-L. The Effect of Interleukin-12 and Interleukin-15 on CD69 Expression of T-Lymphocytes and Natural Killer Cells from Umbilical Cord Blood. Neonatology 2000, 78, 181–185. [Google Scholar] [CrossRef] [PubMed]
  24. Sánchez-Mateos, P.; Cebrián, M.; Acevedo, A.; López-Botet, M.; De Landázuri, M.O.; Sánchez-Madrid, F. Expression of a gp33/27,000 MW activation inducer molecule (AIM) on human lymphoid tissues. Induction of cell proliferation on thymocytes and B lymphocytes by anti-AIM antibodies. Immunology 1989, 68, 72–79. [Google Scholar] [PubMed]
  25. Cebrián, M.; Redondo, J.M.; De Landázuri, M.O.; Rodríguez-Tarduchy, G.; López-Rivas, A.; Rodriguez-Tarduchy, G.; Sánchez-Madrid, F.; López-Rivas, A.; Rodríguez-Tarduchy, G.; Sánchez-Madrid, F. Expression and function of AIM, an activation inducer molecule of human lymphocytes, is dependent on the activation of protein kinase C. Eur. J. Immunol. 1989, 19, 809–815. [Google Scholar] [CrossRef] [PubMed]
  26. Bjorndahl, J.M.; Nakamura, S.; Hara, T.; Jung, L.K.; Fu, S.M. The 28-kDa/32-kDa activation antigen EA 1. Further characterization and signal requirements for its expression. J. Immunol. 1988, 141, 4094–4100. [Google Scholar] [PubMed]
  27. Risso, A.; Smilovich, D.; Capra, M.C.; Baldissarro, I.; Yan, G.; Bargellesi, A.; E Cosulich, M. CD69 in resting and activated T lymphocytes. Its association with a GTP binding protein and biochemical requirements for its expression. J. Immunol. 1991, 146, 4105–4114. [Google Scholar] [PubMed]
  28. Ziegler, S.F.; Levin, S.D.; Johnson, L.; Copeland, N.G.; Gilbert, D.J.; Jenkins, N.A.; Baker, E.; Sutherland, G.R.; Feldhaus, A.L.; Ramsdell, F. The mouse CD69 gene. Structure, expression, and mapping to the NK gene complex. J. Immunol. 1994, 152, 1228–1236. [Google Scholar] [PubMed]
  29. López-Cabrera, M.; Muñoz, E.; Blázquez, M.V.; Ursa, M.A.; Santis, A.G.; Sánchez-Madrid, F. Transcriptional regulation of the gene encoding the human C-type lectin leukocyte receptor AIM/CD69 and functional characterization of its tumor necrosis factor-alpha-responsive elements. J. Biol. Chem. 1995, 270, 21545–21551. [Google Scholar] [CrossRef]
  30. Castellanos, M.D.C.; López-Giral, S.; López-Cabrera, M.; De Landázuri, M.O. Multiple cis-acting elements regulate the expression of the early T cell activation antigen CD69. Eur. J. Immunol. 2002, 32, 3108–3117. [Google Scholar] [CrossRef]
  31. Castellanos, M.C.; Muñoz, C.; Montoya, M.C.; Lara-Pezzi, E.; López-Cabrera, M.; De Landázuri, M.O. Expression of the leukocyte early activation antigen CD69 is regulated by the transcription factor AP-1. J. Immunol. 1997, 159, 5463–5473. [Google Scholar] [PubMed]
  32. Vazquez, B.N.; Laguna, T.; Notario, L.; Lauzurica, P. Evidence for an intronic cis-regulatory element within CD69 gene. Genes Immun. 2012, 13, 356–362. [Google Scholar] [CrossRef] [PubMed] [Green Version]
  33. Vazquez, B.N.; Laguna, T.; Carabana, J.; Krangel, M.S.; Lauzurica, P. CD69 gene is differentially regulated in T and B cells by evolutionarily conserved promoter-distal elements1. J. Immunol. 2009, 183, 6513–6521. [Google Scholar] [CrossRef] [PubMed]
  34. Laguna, T.; Notario, L.; Pippa, R.; Fontela, M.G.; Vazquez, B.N.; Maicas, M.; Aguilera-Montilla, N.; Odero, M.D.; Lauzurica, P.; Corbí Ángel, L.; et al. New insights on the transcriptional regulation of CD69 gene through a potent enhancer located in the conserved non-coding sequence 2. Mol. Immunol. 2015, 66, 171–179. [Google Scholar] [CrossRef] [PubMed] [Green Version]
  35. Consortium, E.P. An integrated encyclopedia of DNA elements in the human genome. Nature 2012, 489, 57–74. [Google Scholar] [CrossRef]
  36. Oki, S.; Ohta, T.; Shioi, G.; Hatanaka, H.; Ogasawara, O.; Okuda, Y.; Kawaji, H.; Nakaki, R.; Sese, J.; Meno, C. ChIP-Atlas: A Data-Mining Suite Powered by Full Integration of Public ChIP-Seq Data; Reports; EMBO: Heidelberg, Germany, December 2018. [Google Scholar]
  37. Zhou, K.R.; Liu, S.; Sun, W.J.; Zheng, L.L.; Zhou, H.; Yang, J.H.; Qu, L.H. ChIPBase v2.0: Decoding transcriptional regulatory networks of non-coding RNAs and protein-coding genes from ChIP-seq data. Nucleic Acids Res. 2017, 45, D43–D50. [Google Scholar] [CrossRef] [PubMed]
  38. Dogan, N.; Wu, W.; Morrissey, C.S.; Chen, K.-B.; Stonestrom, A.; Long, M.; Keller, C.A.; Cheng, Y.; Jain, D.; Visel, A.; et al. Occupancy by key transcription factors is a more accurate predictor of enhancer activity than histone modifications or chromatin accessibility. Epigenetics Chromatin 2015, 8, 16. [Google Scholar] [CrossRef]
  39. Tsytsykova, A.V.; Rajsbaum, R.; Falvo, J.V.; Ligeiro, F.; Neely, S.R.; Goldfeld, A.E. Activation-dependent intrachromosomal interactions formed by the TNF gene promoter and two distal enhancers. Proc. Natl. Acad. Sci. USA 2007, 104, 16850–16855. [Google Scholar] [CrossRef]
  40. Li, L.; Zhang, J.A.; Dose, M.; Kueh, H.Y.; Mosadeghi, R.; Gounari, F.; Rothenberg, E.V. A far downstream enhancer for murine Bcl11b controls its T-cell specific expression. Blood 2013, 122, 902–911. [Google Scholar] [CrossRef] [Green Version]
  41. Schönheit, J.; Kuhl, C.; Gebhardt, M.L.; Klett, F.F.; Riemke, P.; Scheller, M.; Huang, G.; Naumann, R.; Leutz, A.; Stocking, C.; et al. PU.1 Level-Directed Chromatin Structure Remodeling at the Irf8 Gene Drives Dendritic Cell Commitment. Cell Rep. 2013, 3, 1617–1628. [Google Scholar] [CrossRef] [Green Version]
  42. Herr, W.; Cleary, M.A. The POU domain: Versatility in transcriptional regulation by a flexible two-in-one DNA-binding domain. Genes Dev. 1995, 9, 1679–1693. [Google Scholar] [CrossRef] [PubMed]
  43. Rosenfeld, M.G. POU-domain transcription factors: Pou-er-ful developmental regulators. Genes Dev. 1991, 5, 897–907. [Google Scholar] [CrossRef] [PubMed]
  44. Duncliffe, K.N.; Bert, A.G.; Vadas, M.A.; Cockerill, P.N. A T Cell–Specific Enhancer in the Interleukin-3 Locus Is Activated Cooperatively by Oct and NFAT Elements within a DNase I–Hypersensitive Site. Immunity 1997, 6, 175–185. [Google Scholar] [CrossRef]
  45. Fletcher, C.; Heintz, N.; Roeder, R.G. Purification and characterization of OTF-1, a transcription factor regulating cell cycle expression of a human histone H2b gene. Cell 1987, 51, 773–781. [Google Scholar] [CrossRef]
  46. Zhou, L.; Nazarian, A.A.; Xu, J.; Tantin, D.; Corcoran, L.M.; Smale, S.T. An Inducible Enhancer Required for Il12b Promoter Activity in an Insulated Chromatin Environment. Mol. Cell. Biol. 2007, 27, 2698–2712. [Google Scholar] [CrossRef] [PubMed]
  47. dela Paz, N.G.; Simeonidis, S.; Leo, C.; Rose, D.W.; Collins, T. Regulation of NF-kappaB-dependent gene expression by the POU domain transcription factor Oct-1. J. Biol. Chem. 2007, 282, 8424–8434. [Google Scholar] [CrossRef] [PubMed]
  48. Kakizawa, T.; Miyamoto, T.; Ichikawa, K.; Takeda, T.; Suzuki, S.; Mori, J.; Kumagai, M.; Yamashita, K.; Hashizume, K. Silencing mediator for retinoid and thyroid hormone receptors interacts with octamer transcription factor-1 and acts as a transcriptional repressor. J. Biol. Chem. 2001, 276, 9720–9725. [Google Scholar] [CrossRef] [PubMed]
  49. Schwachtgen, J.L.; Remacle, J.E.; Janel, N.; Brys, R.; Huylebroeck, D.; Meyer, D.; Kerbiriou-Nabias, D. Oct-1 is involved in the transcriptional repression of the von willebrand factor gene promoter. Blood 1998, 92, 1247–1258. [Google Scholar]
  50. Hwang, S.S.; Kim, L.K.; Lee, G.R.; Flavell, R.A. Role of OCT-1 and partner proteins in T cell differentiation. Biochim. Biophys. Acta (BBA) Gene Regul. Mech. 2016, 1859, 825–831. [Google Scholar] [CrossRef]
  51. Shakya, A.; Goren, A.; Shalek, A.K.; German, C.N.; Snook, J.; Kuchroo, V.K.; Yosef, N.; Chan, R.C.; Regev, A.; Williams, M.A.; et al. Oct1 and OCA-B are selectively required for CD4 memory T cell function. J. Exp. Med. 2015, 212, 2115–2131. [Google Scholar] [CrossRef]
  52. Shakya, A.; Kang, J.; Chumley, J.; Williams, M.A.; Tantin, D. Oct1 is a switchable, bipotential stabilizer of repressed and inducible transcriptional states. J. Biol. Chem. 2011, 286, 450–459. [Google Scholar] [CrossRef] [PubMed]
  53. Ebihara, T.; Seo, W.; Taniuchi, I. Roles of RUNX Complexes in Immune Cell Development. Results Probl. Cell Differ. 2017, 962, 395–413. [Google Scholar]
  54. Tolhuis, B.; Palstra, R.J.; Splinter, E.; Grosveld, F.; de Laat, W. Looping and interaction between hypersensitive sites in the active beta-globin locus. Mol. Cell 2002, 10, 1453–1465. [Google Scholar] [CrossRef]
  55. Amano, T.; Sagai, T.; Tanabe, H.; Mizushina, Y.; Nakazawa, H.; Shiroishi, T. Chromosomal Dynamics at the Shh Locus: Limb Bud-Specific Differential Regulation of Competence and Active Transcription. Dev. Cell 2009, 16, 47–57. [Google Scholar] [CrossRef] [PubMed] [Green Version]
  56. Yokoshi, M.; Fukaya, T. Dynamics of transcriptional enhancers and chromosome topology in gene regulation. Dev. Growth Differ. 2019, 61, 343–352. [Google Scholar] [CrossRef] [PubMed]
  57. Kulaeva, O.I.; Nizovtseva, E.V.; Polikanov, Y.S.; Ulianov, S.V.; Studitsky, V.M. Distant Activation of Transcription: Mechanisms of Enhancer Action. Mol. Cell. Biol. 2012, 32, 4892–4897. [Google Scholar] [CrossRef] [Green Version]
  58. Levine, M.; Cattoglio, C.; Tjian, R. Looping Back to Leap Forward: Transcription Enters a New Era. Cell 2014, 157, 13–25. [Google Scholar] [CrossRef] [Green Version]
  59. Bender, M.A.; Byron, R.; Ragoczy, T.; Telling, A.; Bulger, M.; Groudine, M. Flanking HS-62.5 and 3′ HS1, and regions upstream of the LCR, are not required for β-globin transcription. Blood 2006, 108, 1395–1401. [Google Scholar] [CrossRef]
  60. Vernimmen, D.; De Gobbi, M.; Sloane-Stanley, J.A.; Wood, W.G.; Higgs, D.R. Long-range chromosomal interactions regulate the timing of the transition between poised and active gene expression. EMBO J. 2007, 26, 2041–2051. [Google Scholar] [CrossRef]
Figure 1. Sanger sequencing of mouse CNS2 sequence containing regions I, II and III. Primers used to amplify the CNS2 sequences used in the luciferase experiments are depicted as purple arrows.
Genes 10 00651 g001
Figure 2. CD69 gene locus. UCSC genome browser showing the human (A) (GRCh37/hg19 assembly, chr12: 9,900,752-9,952,771) and mouse (B) (GRCm38/mm10 assembly, chr6: 129,259,289–129,321,308) CD69 locus and the four upstream conserved noncoding regions (CNS1-4). The alignment of the mouse and human genomes are displayed as a grayscale density plot that indicates the alignment quality, where darker values indicate higher levels of overall conservation. Transcription factor binding site peaks (TFBS peaks) show the proportion (between 0 and 1) of ChIP-seq data sets reporting TF binding at each location. The grey boxes represent different transcription factors found by ChIP-seq in human cell lines H1-hESC, A549, GM12878, HeLa-S3, IMR90, K562, HepG2, MCF-7, SK-N-SH, SK-N-SH_RA, HUVEC, AG04449, AG04450, AG09309, AG09319, AG10803, AoAF, BE2_C, BJ, Caco-2, Dnd41, ECC-1, Fibrobl, GM06990, GM08714, GM10847, GM12801, GM12864, GM12865, GM12872, M12873, GM12874, GM12875, GM12891, GM12892, GM15510, GM18505, GM18526, GM18951, GM19099, GM19193, GM19238, GM19239, GM19240, Gliobla, HA-sp, HAc, HBMEC, HCFaa, HCM, HCPEpiC, HCT-116, HEEpiC, HEK293, HEK293-T-REx, HFF, HFF-Myc, HL-60, HMEC, HMF, HPAF, HPF, HRE, HRPEpiC, HSMM, HSMMtube, HVMF, MCF10A-Er-Src, NB4, NH-A, NHDF-Ad, NHDF-neo, NHEK, NHLF, NT2-D1, Osteobl, PANC-1, PBDE, PBDEFetal, PFSK-1, ProgFib, RPTEC, Raji, SAEC, SH-SY5Y, SK-N-MC and T-47D (available at UCSC) and in mouse primary T CD4+, T CD8+ and B lymphocytes (TF-ChIP-seq, available at ChIP Atlas and ChIP-Base v2.0).
Genes 10 00651 g002
Figure 3. Luciferase activity of CNS2 regions II+III is similar to that of the whole CNS2 sequence. (A) Map of the CNS2 regions and TFBS defined by ChIPSeq data. Color boxes indicate transcription factor binding sites conserved among six mammals species, as previously described [34]; grey boxes indicate non-conserved TFBSs identified by public ChIP-seq experiment databases. (B) Jurkat cells were transfected with luciferase constructs carrying the mouse CD69 promoter alone or together with the whole CNS2 or regions I+II, II+III or I-III. The bars show the mean RLU of three independent experiments. The error bars show the standard deviation. One-way ANOVA was applied; * (p < 0.05), ** (p < 0.01), and *** (p < 0.001). RLU: Relative luciferase units.
Genes 10 00651 g003
Figure 4. Transcriptional enhancer activity of the CNS2 regions I+II+III and region II subregions. (A) Map of regions I-III and the conserved TFBSs within them. (B) Measurement of the luciferase activity after stimulation of Jurkat cells transfected with constructs carrying the mouse CD69 promoter alone or in combination with the different regions and subregions (I+II+III, I, II, II, GATA+MyoD, OctI, GATA+MyoD+III, Oct1+I). The bars show the mean RLU. The error bars show the standard deviation of three independent experiments with duplicate measurements. One factor ANOVA was applied to test for significant differences, with * (p < 0.05), ** (p < 0.01), and *** (p < 0.001). RLU: Relative luciferase units.
Genes 10 00651 g004
Figure 5. RUNX1 and Oct1 (POU2F1) silencing downregulates mouse CD69 protein expression. (A) EL-4 T cells were transfected with a 1 µM pool of three DsiRNAs against RUNX1, POU2F1 (Oct1), a combination of both, or a non-targeting DsiRNA (NC-1) and were cultured for 16 h. They were then stimulated or not stimulated with PMA/Ion, and the CD69 surface levels were measured 6 h later. The bars represent the mean ± SEM of the % relative inhibition with respect to CD69 expression in the NC-1 control of 2 different experiments in which each transfection was performed in duplicate. (B) mRNA expression of RUNX1 and POU2F1 was analyzed by qPCR 22 h after DsiRNA transfection, compared with the NC1 DsiRNA control. Data are presented as means ± SD of two independent experiments (* p < 0.05).
Genes 10 00651 g005
Table 1. List of the primers used to amplify the sequences within CNS2 for further cloning and sequencing. The sequence in italics indicates the extra bases that allow restriction enzymes to cut; bold sequences indicate XhoI and EcoRI target sequences; plain text indicates the CNS2 sequence.
PrimerSequence 5′ → 3′
I_FwGAGGAATTCTTTCAGAAACCTCCCTCCGG
I_RvAGACTCGAGCAGCATCTGTTGTGATTAGCAT
I+II+III_FwCCGAATTCCCAGTACCTCATTCACTCACTG
I+OCT_FwAAAAGAATTCAGCTGCCGTGATAAGGACTGTA
III_FwATAAAGAATTCCCAGTACCTCATTCACTCACTG
I+OCT_RvAGTCTCGAGCACTAAAACCCAGTGCAGTTCT
III+OCT_FwAAAGAATTCCCAGTACCTCATTCACTCACTG
OCT_FwAAAAGAATTCAGCTGCCGTGATAAGGACTGTA
OCT_RvAAACTCGAGCTGAAAGGAAATGATGTAATGT
III_RvAAACTCGAGGCCTTAGTGGTATGTGTTCAAAG
I+II_FwAAAAGAATTCTGGTTCCTTTGAACACATAC
III-GATA_RvAAAACTCGAGAGGAAGGCAGGGTGT
MyoD+GATA_RvAAACTCGAGAGGAAGGCAGGGTGTACA
RV3_Fw *CTAGCAAAATAGGCTGTCCC
Prom_Seq_Rv *TGACATGGGAAAAGCACTGGA
* indicates the primers used for sequencing and validation of the resulting plasmids.
Table 2. Primers used for the amplification of luciferase plasmids, and length of the expected amplicon. Below is displayed the primers in the DNA sequence of regions I–III.
ConstructPrimers UsedAmplicon Length
I+II+IIII+II+III_Fw + I + Oct1_Rv297 bp
II+IIIIII+Oct1_Fw + Oct1_Rv227 bp
I+IIOct1_Fw + I + Oct1_Rv177 bp
II_Fw + I+Oct1_Rv70 bp
III+II_Fw + Oct1_Rv107 bp
IIIIII_Fw + III_Rv120 bp
GATA+MyoDI+II_Fw + MyoD + GATA_Rv65 bp
Oct1Oct1_Fw + Oct1_Rv60 bp
GATA+MyoD+IIIIII_Fw + III-GATA_Rv156 bp
I+Oct1I+Oct1_Fw + I+Oct1_Rv142 bp
Table 3. Nucleotide sequences of the sense and antisense strands and cross-reaction of the DsiRNAs used to silence RUNX and POU2F1 (Oct1).
DsiRNASequencesCross-Reacting Transcript
Runx1.13.15′-AAGAAAGAUAUCAAGUACUACAUtt-3′
3′-AAUUCUUUCUAUAGUUCAUGAUGUAAA-5′
NM_001111022
NM_001111021
NM_001111023
NM_009821
Runx1.13.25′-AUGGCAGGCAACGAUGAAAACUAct-3′
3′-AGUACCGUCCGUUGCUACUUUUGAUGA-5′
NM_009821
NM_001111023
NM_001111021
NM_001111022
Runx1.13.35′-GAAGAACCAGGUAGCGAGAUUCAac-3′
3′-UACUUCUUGGUCCAUCGCUCUAAGUUG-5′
NM_001111022
NM_001111021
NM_001111023
NM_009821
Pou2f1.13.15′-UAAAUUUCAUGAAAGCUUUACUUgt-3′
3′-CGAUUUAAAGUACUUUCGAAAUGAACA-5′
NM_198932
NM_011137
NM_198934
NM_198933
Pou2f1.13.25′-CAAGAAUGAAUAAUCCAUCAGAAac-3′
3′-GAGUUCUUACUUAUUAGGUAGUCUUUG-5′
NM_198933
NM_198934
NM_011137
NM_198932
Pou2f1.13.35′-GCAGUUUGCCAAGACUUUCAAACaa-3′
3′-CUCGUCAAACGGUUCUGAAAGUUUGUU-5′
NM_198932
NM_011137
NM_198934
NM_198933
Upper case letter represent RNA bases, while lower case letters correspond to DNA bases.

