Twenty-Five Years of Propagation in Suspension Cell Culture Results in Substantial Alterations of the Arabidopsis Thaliana Genome

 ,
,  , , , and
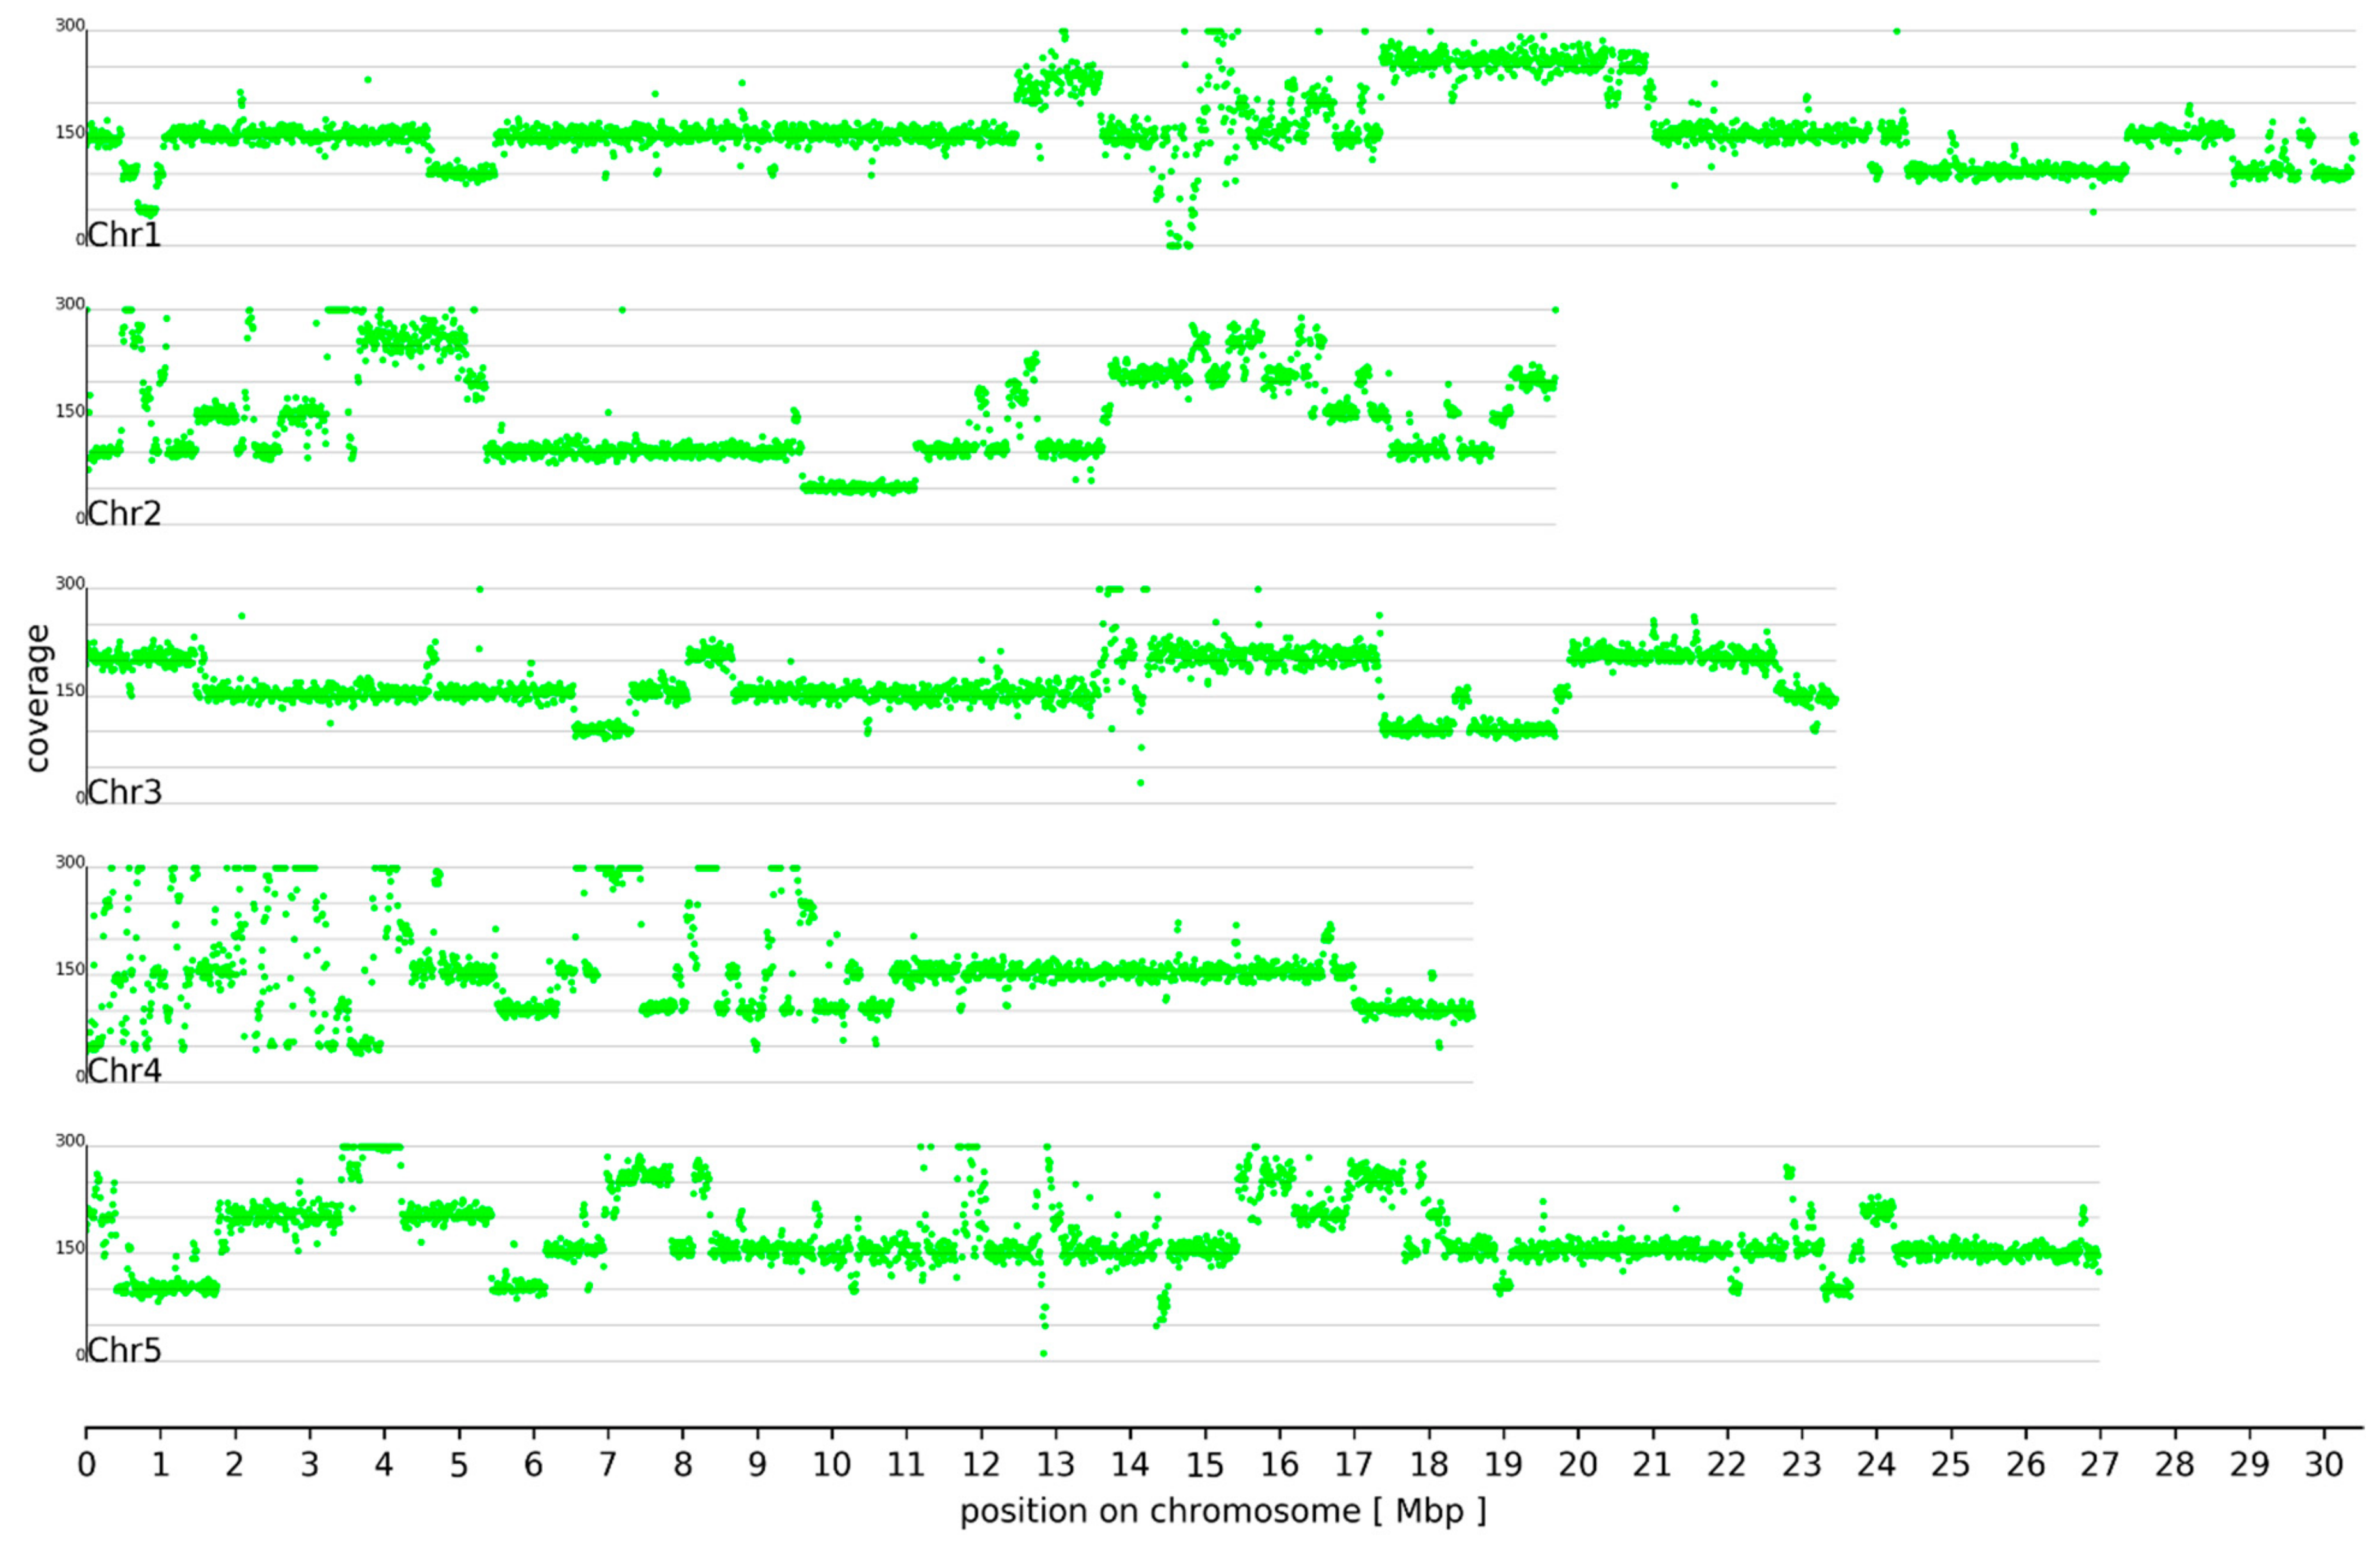
Abstract
1. Introduction
2. Methods
2.1. Plant Material
2.2. RNA Extraction and RNA-Seq
2.3. DNA Extraction
2.4. Oxford Nanopore Sequencing
2.5. Illumina DNA Sequencing
2.6. Coverage Analysis
2.7. Genome Assembly
2.8. Variant Calling and Annotation
3. Results and Discussion
3.1. Ploidy Differences Between At7 and Col-0
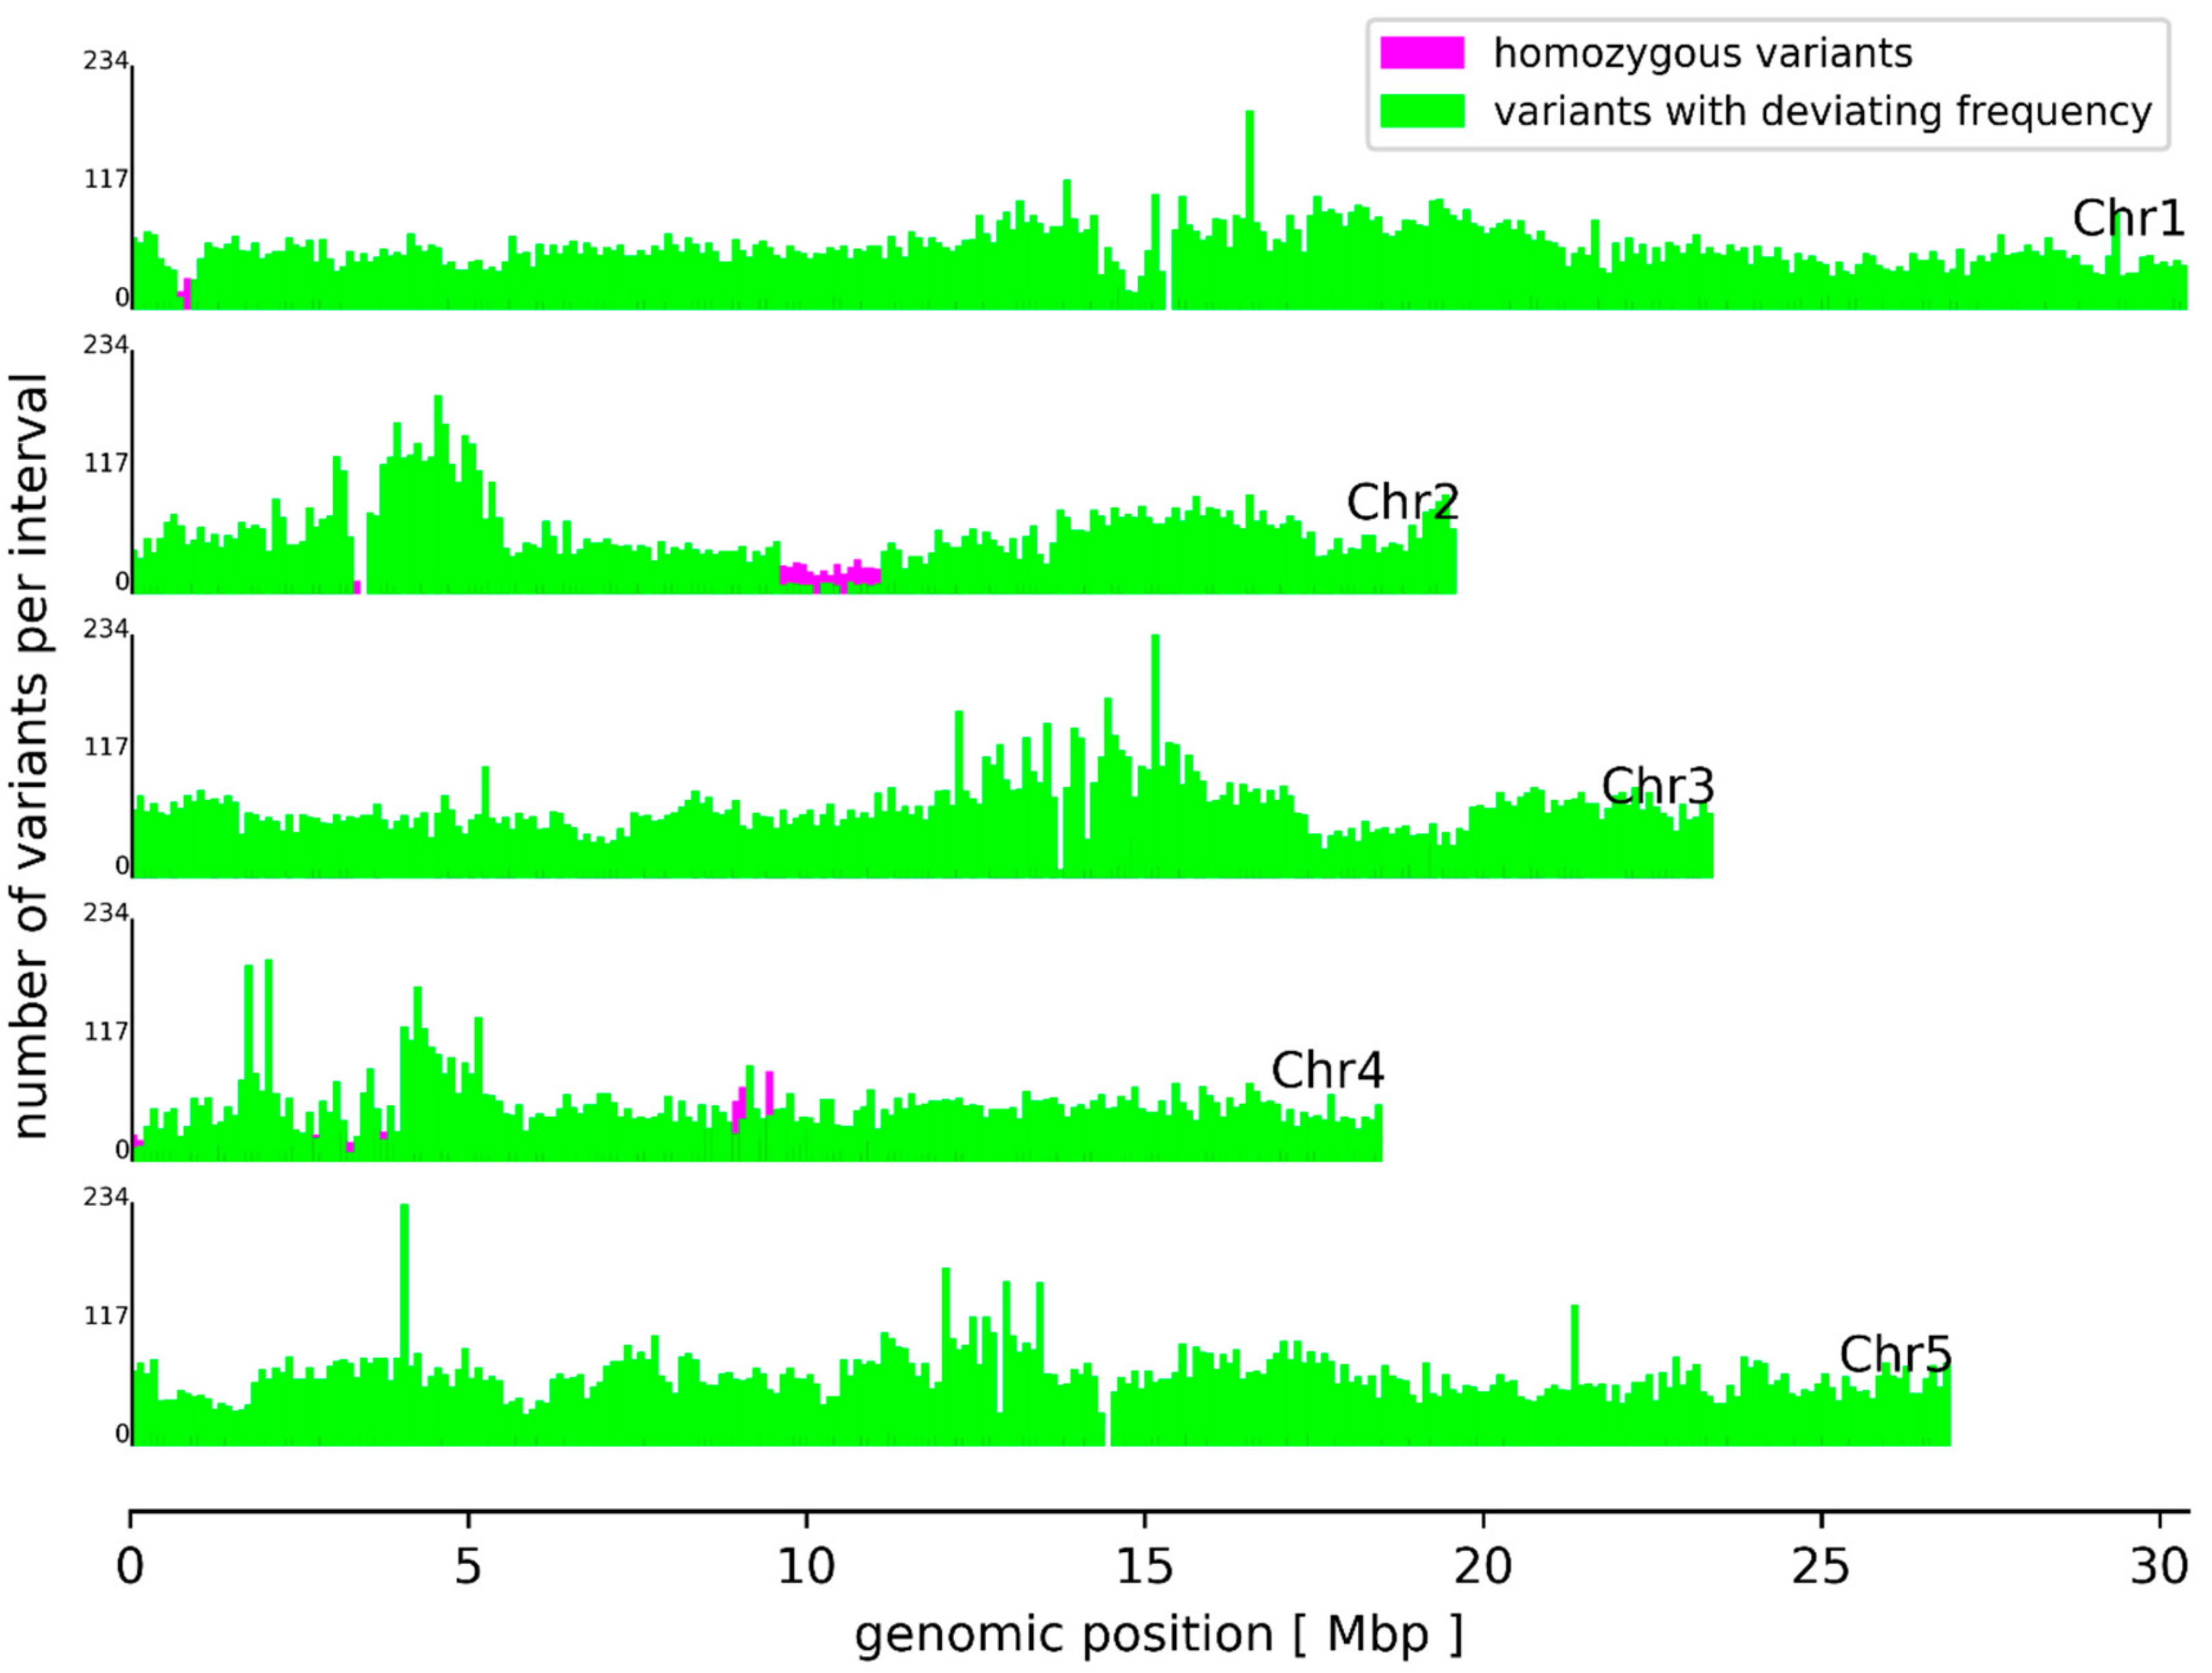
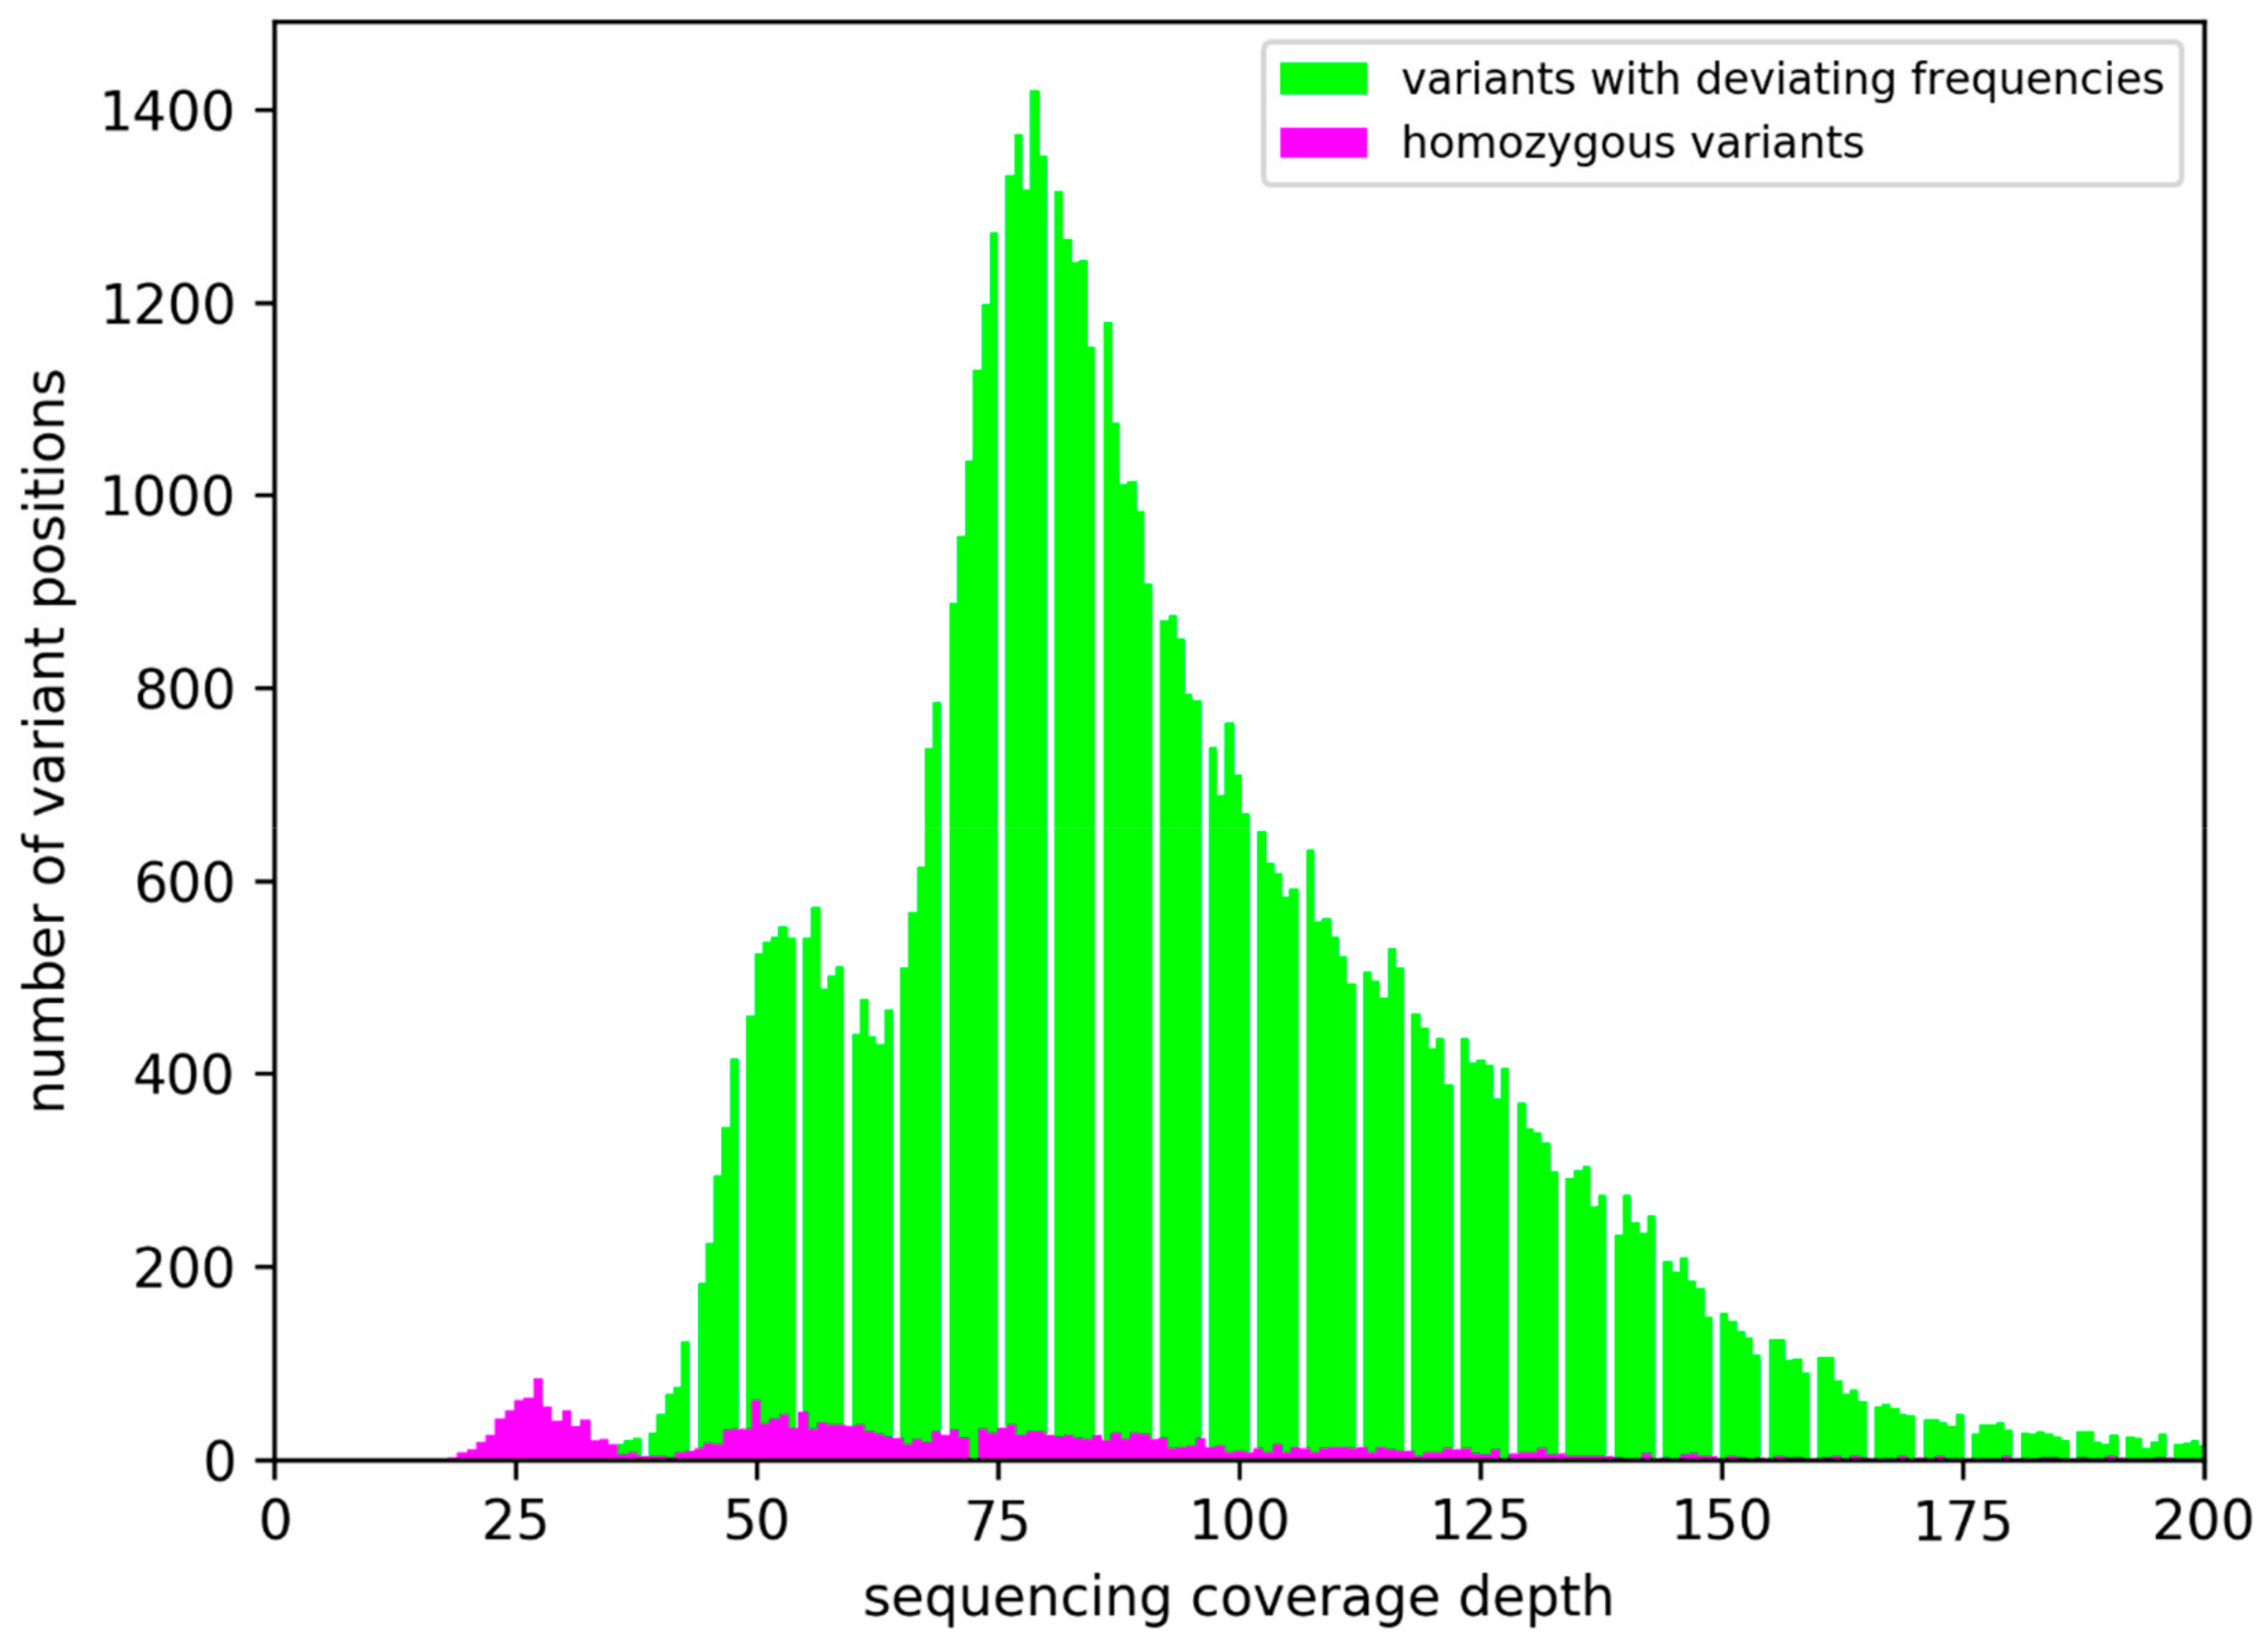
3.2. Sequence Variants and Copy Number Variations
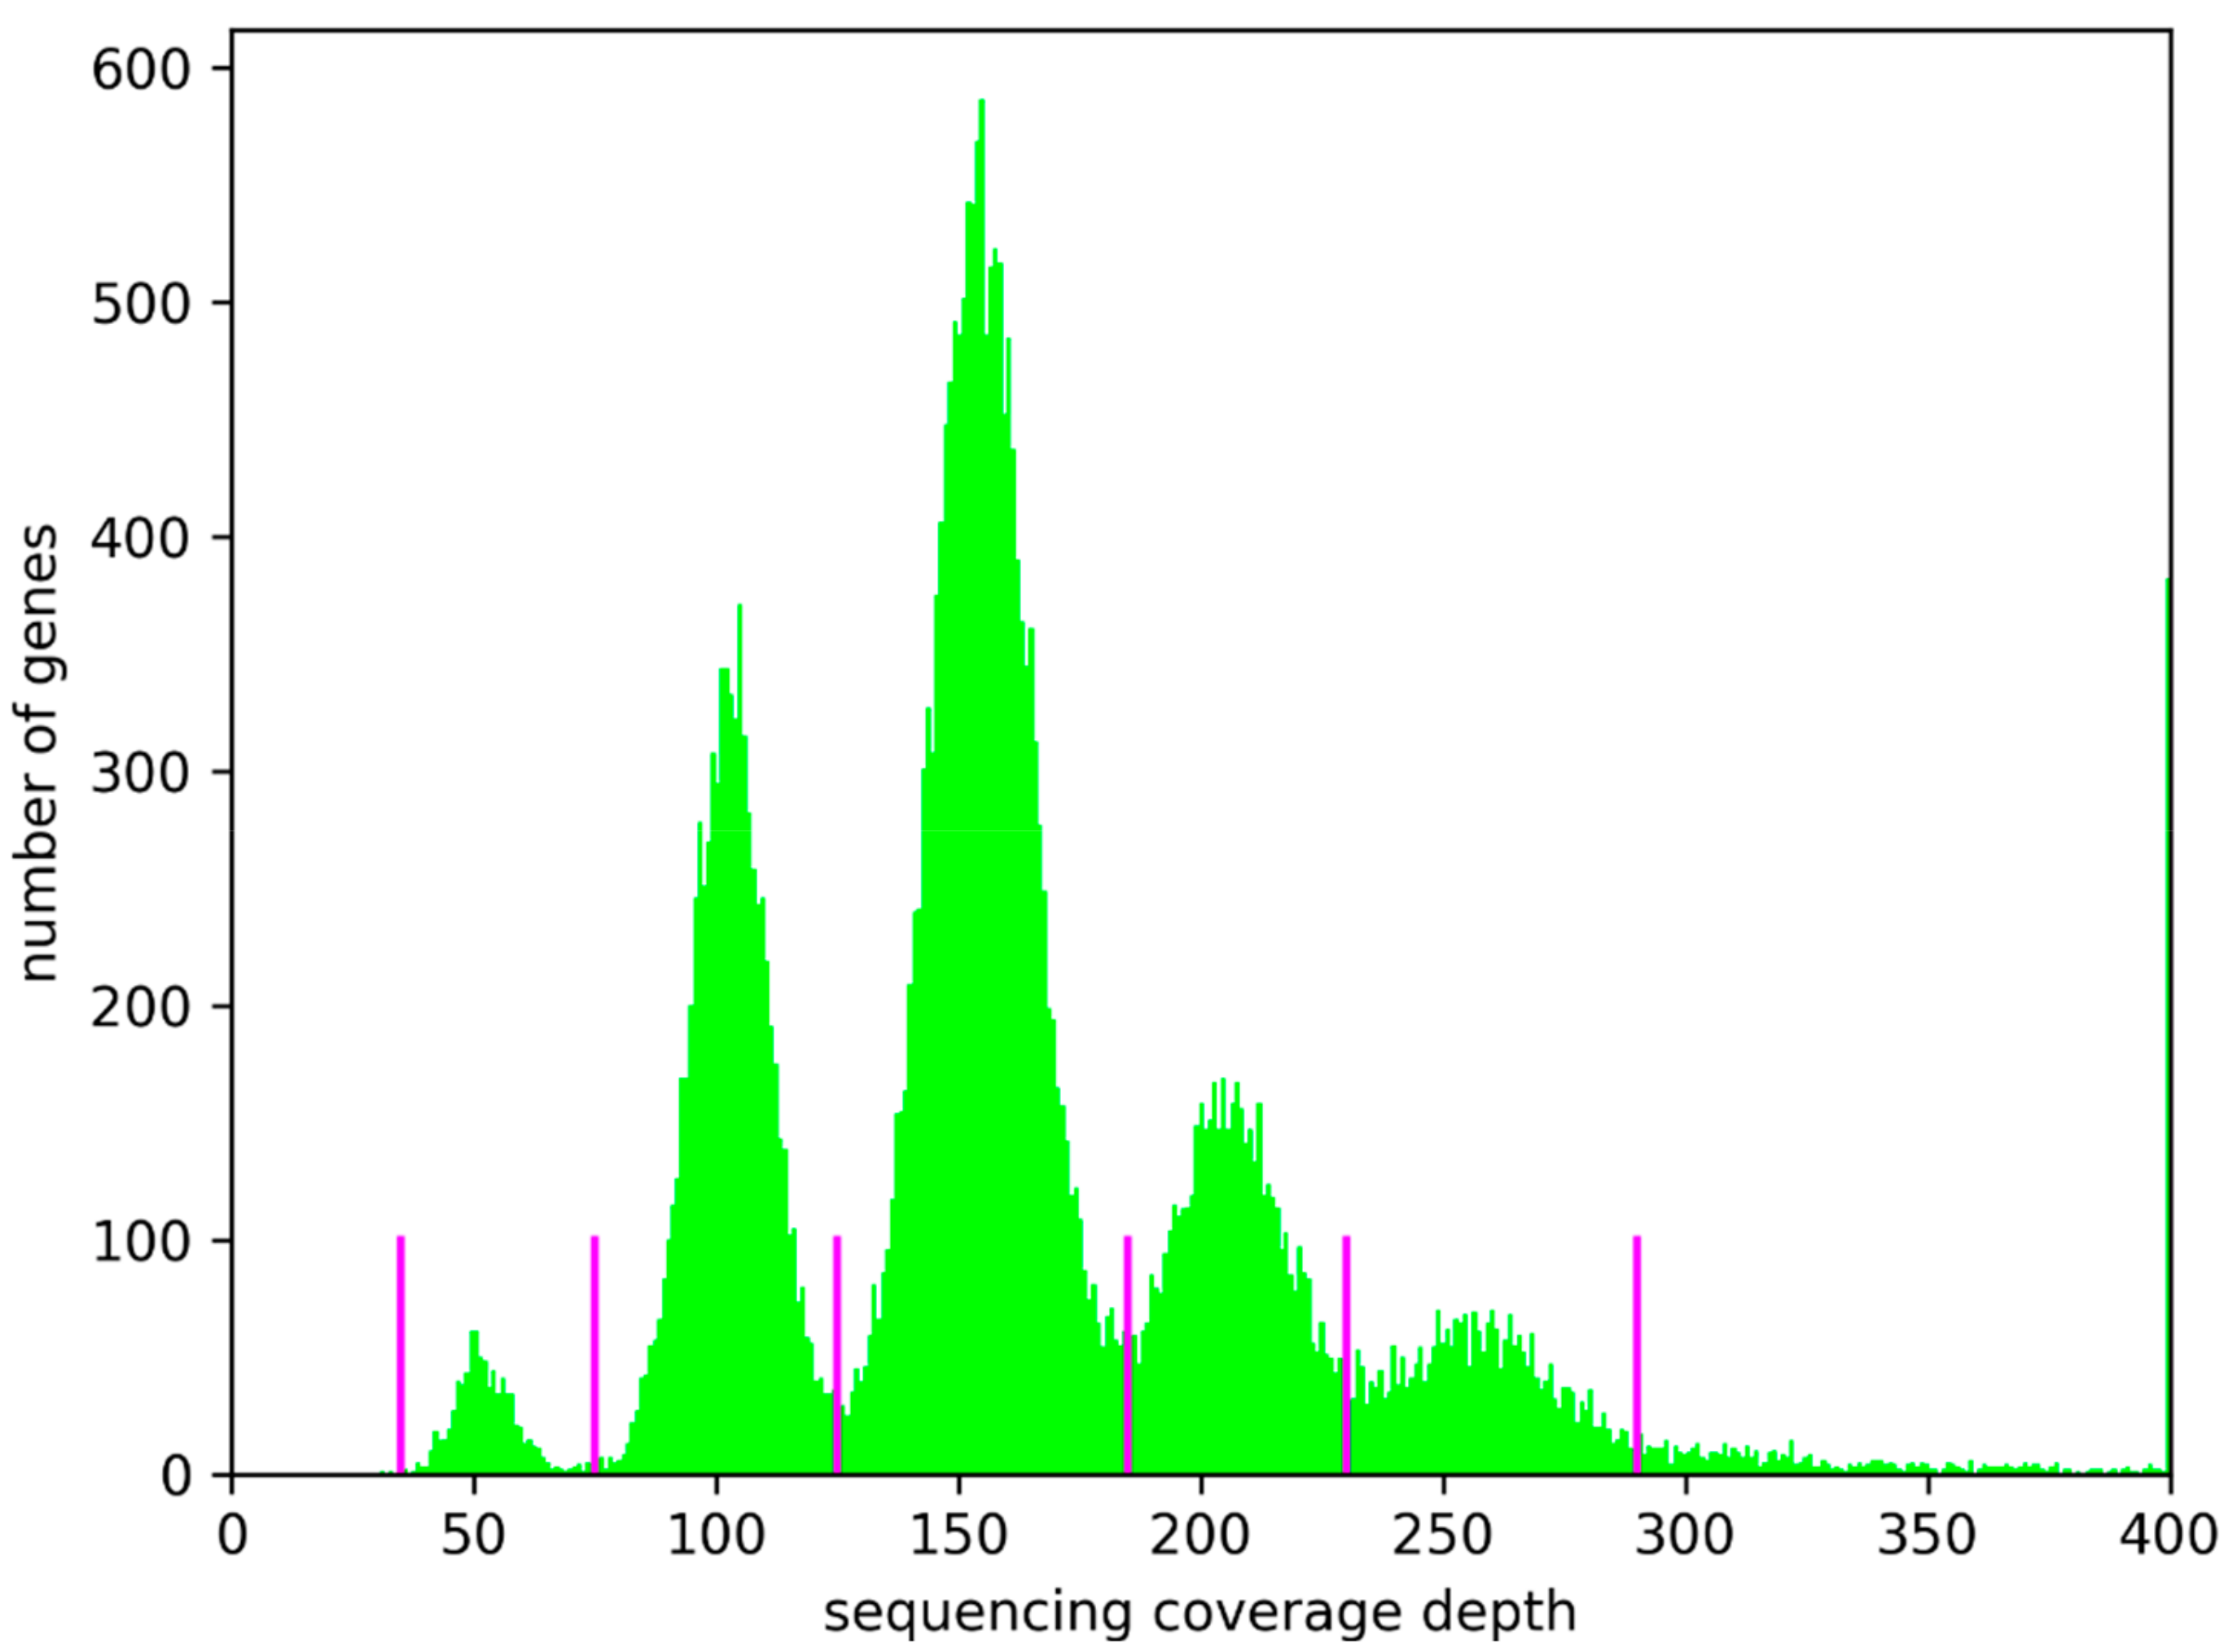
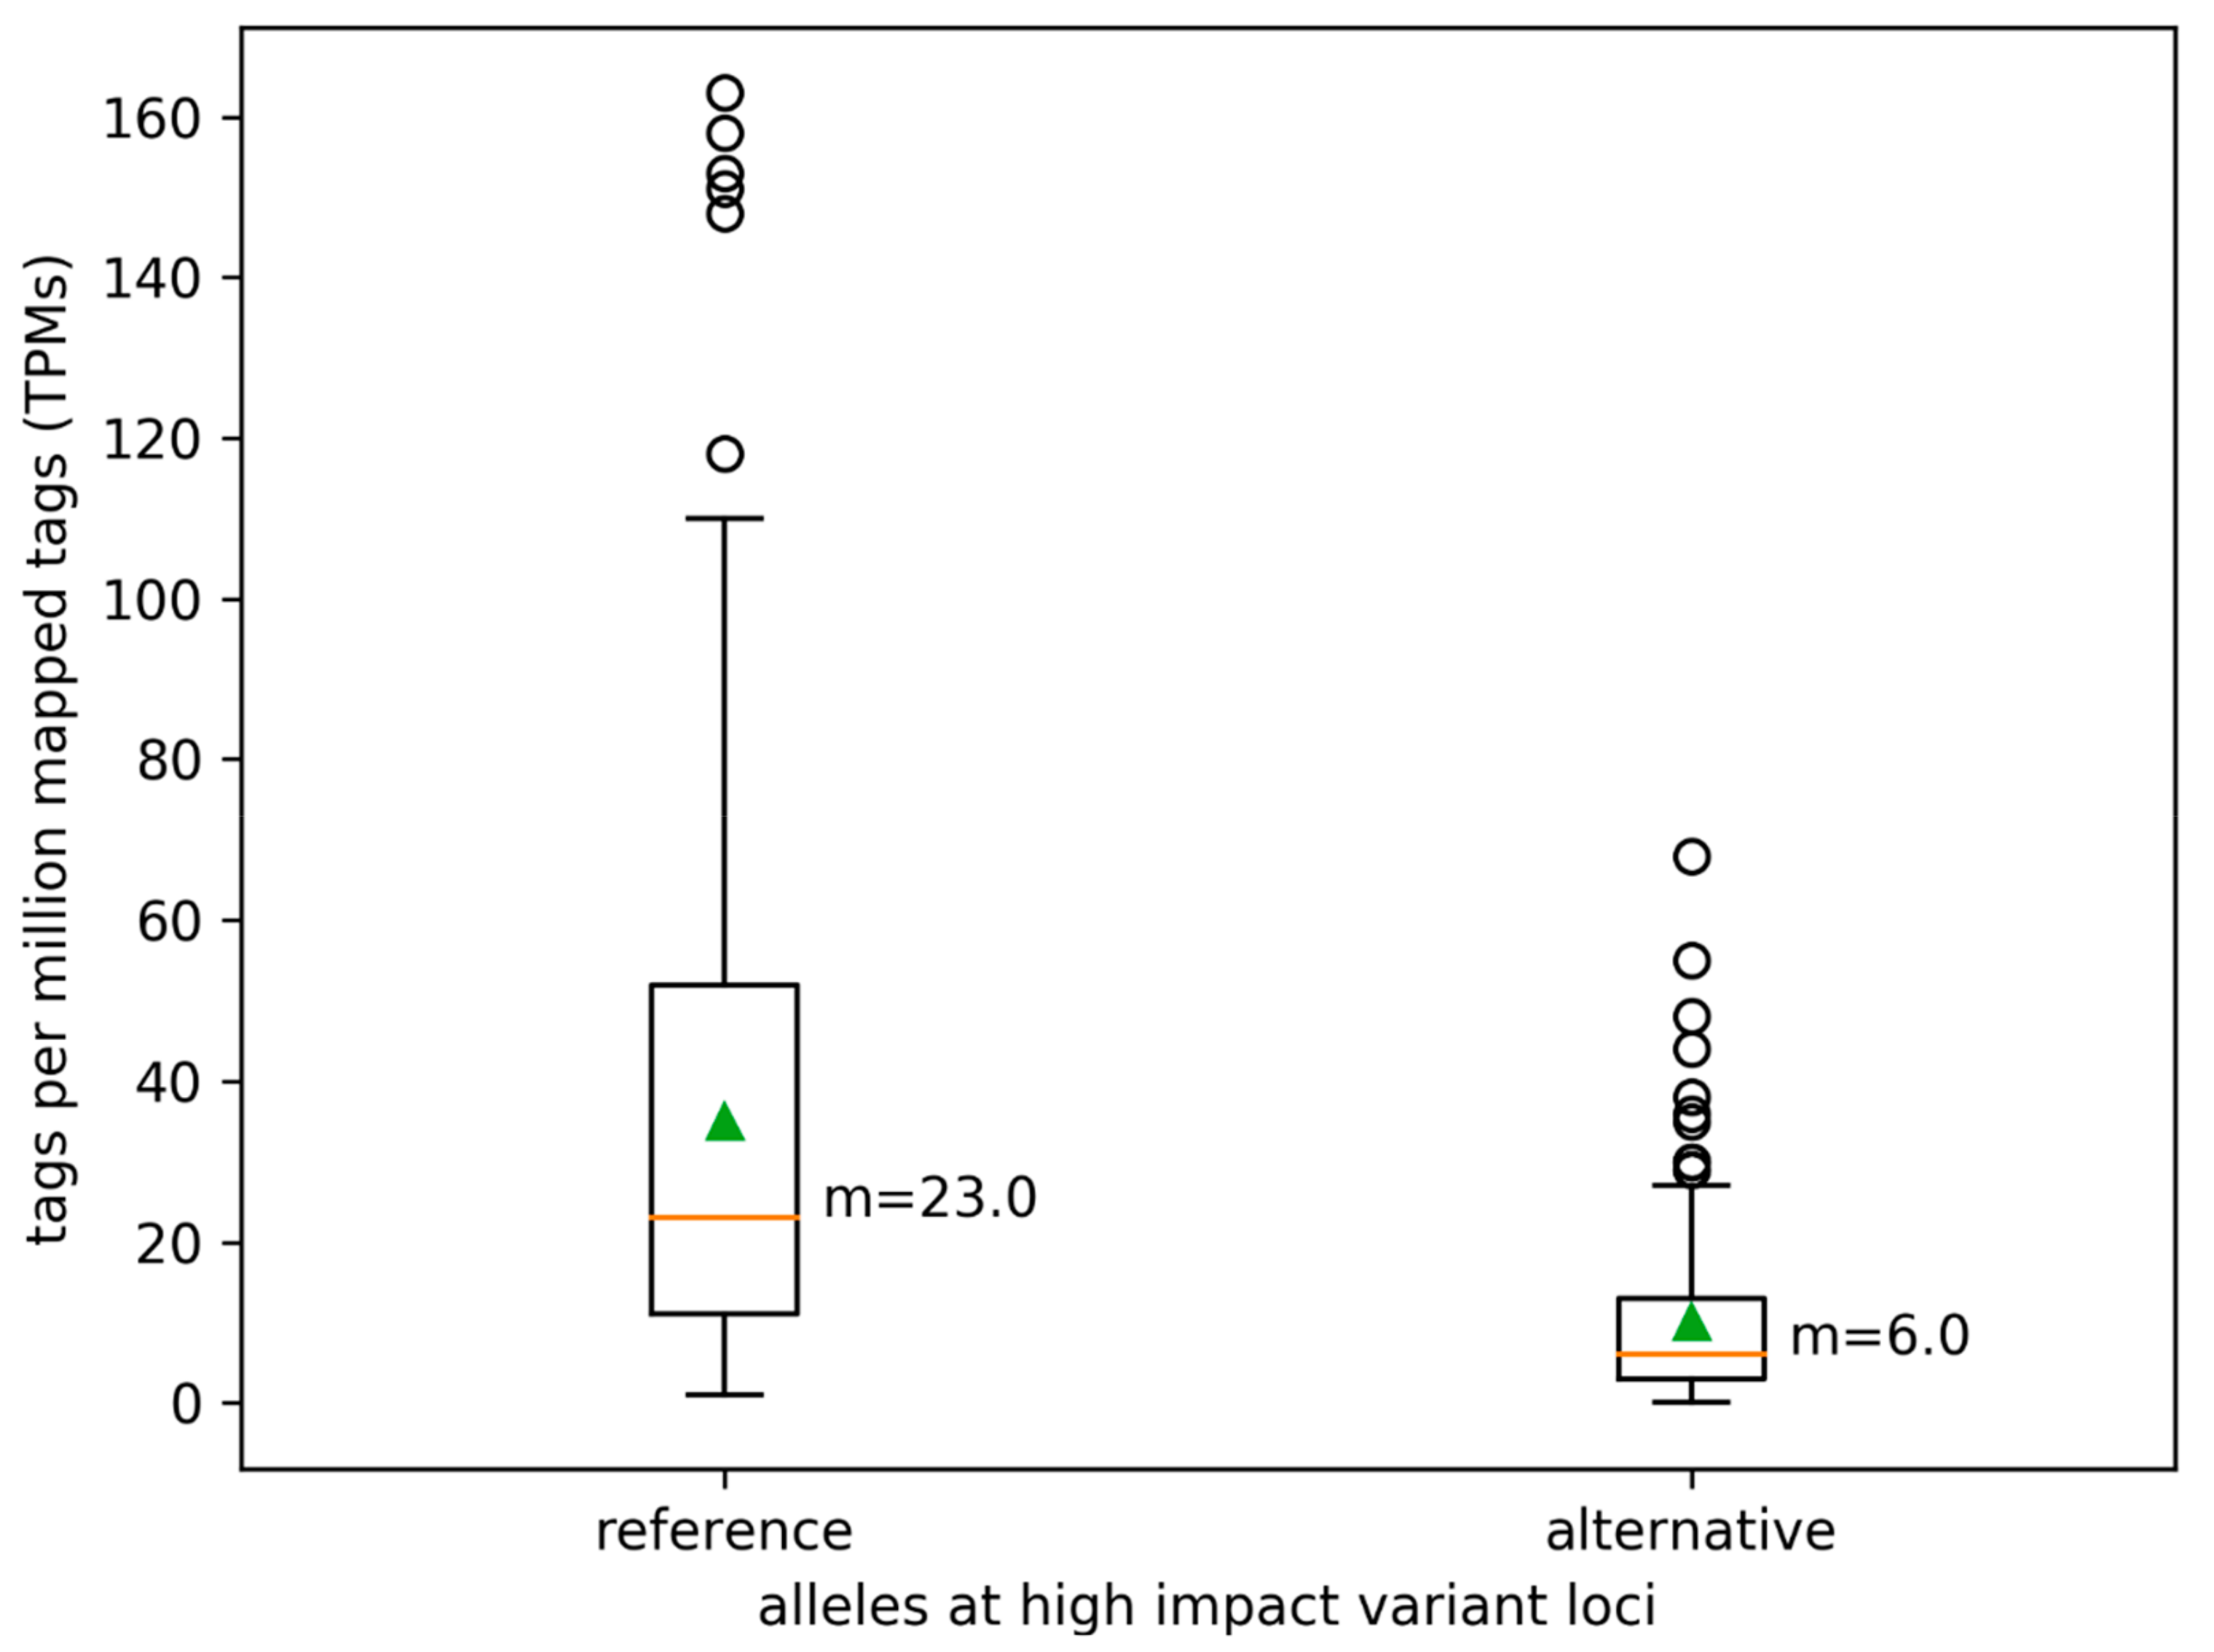
3.3. Variant Impact on Genes and Transcript Isoform Abundance
3.4. De Novo Genome Assembly
3.5. Future Directions
Supplementary Materials
Author Contributions
Funding
Acknowledgments
Conflicts of Interest
References
- The Arabidopsis Genome Initiative. Analysis of the genome sequence of the flowering plant Arabidopsis thaliana. Nature 2000, 408, 796–815. [Google Scholar] [CrossRef] [PubMed]
- Schneeberger, K.; Ossowski, S.; Ott, F.; Klein, J.D.; Wang, X.; Lanz, C.; Smith, L.M.; Cao, J.; Fitz, J.; Warthmann, N.; et al. Reference-guided assembly of four diverse Arabidopsis thaliana genomes. Proc. Natl. Acad. Sci. USA 2011, 108, 10249–10254. [Google Scholar] [CrossRef] [PubMed]
- Consortium, T.G. 1135 genomes reveal the global pattern of polymorphism in Arabidopsis thaliana. Cell 2016, 166, 481–491. [Google Scholar]
- Durvasula, A.; Fulgione, A.; Gutaker, R.M.; Alacakaptan, S.I.; Flood, P.J.; Neto, C.; Tsuchimatsu, T.; Burbano, H.A.; Picó, F.X.; Alonso-Blanco, C.; et al. African genomes illuminate the early history and transition to selfing in Arabidopsis thaliana. Proc. Natl. Acad. Sci. USA 2017, 114, 5213–5218. [Google Scholar] [CrossRef] [PubMed]
- Ossowski, S.; Schneeberger, K.; Clark, R.; Lanz, C.; Warthmann, N.; Weigel, D. Sequencing of natural strains of Arabidopsis thaliana with short reads. Genome Res. 2008, 18, 2024–2033. [Google Scholar] [CrossRef]
- Cao, J.; Schneeberger, K.; Ossowski, S.; Günther, T.; Bender, S.; Fitz, J.; Koenig, D.; Lanz, C.; Stegle, O.; Lippert, C.; et al. Whole-genome sequencing of multiple Arabidopsis thaliana populations. Nat. Genet. 2011, 43, 956–963. [Google Scholar] [CrossRef] [PubMed]
- Long, Q.; Rabanal, F.A.; Meng, D.; Huber, C.D.; Farlow, A.; Platzer, A.; Zhang, Q.; Vilhjálmsson, B.J.; Korte, A.; Nizhynska, V.; et al. Massive genomic variation and strong selection in Arabidopsis thaliana lines from Sweden. Nat. Genet. 2013, 45, 884–890. [Google Scholar] [CrossRef] [PubMed]
- Pucker, B.; Holtgräwe, D.; Rosleff Sörensen, T.; Stracke, R.; Viehöver, P.; Weisshaar, B. A De novo genome sequence assembly of the Arabidopsis thaliana accession Niederzenz-1 displays presence/absence variation and strong synteny. PLoS ONE 2016, 11, e0164321. [Google Scholar] [CrossRef] [PubMed]
- Zapata, L.; Ding, J.; Willing, E.M.; Hartwig, B.; Bezdan, D.; Jiao, W.B.; Patel, V.; Velikkakam James, G.; Koornneef, M.; Ossowski, S.; et al. Chromosome-level assembly of Arabidopsis thaliana Ler reveals the extent of translocation and inversion polymorphisms. Proc. Natl. Acad. Sci. USA 2016, 113, 4052–4060. [Google Scholar] [CrossRef]
- Michael, T.P.; Jupe, F.; Bemm, F.; Motley, S.T.; Sandoval, J.P.; Lanz, C.; Loudet, O.; Weigel, D.; Ecker, J.R. High contiguity Arabidopsis thaliana genome assembly with a single nanopore flow cell. Nat. Commun. 2018, 9, 541. [Google Scholar] [CrossRef]
- Pucker, B.; Holtgräwe, D.; Stadermann, K.B.; Frey, K.; Huettel, B.; Reinhardt, R.; Weisshaar, B. A chromosome-level sequence assembly reveals the structure of the Arabidopsis thaliana Nd-1 genome and its gene set. PLoS ONE 2019, 14, e0216233. [Google Scholar] [CrossRef] [PubMed]
- Debladis, E.; Llauro, C.; Carpentier, M.C.; Mirouze, M.; Panaud, O. Detection of active transposable elements in Arabidopsis thaliana using Oxford Nanopore Sequencing technology. BMC Genom. 2017, 18, 537. [Google Scholar] [CrossRef] [PubMed]
- Ossowski, S.; Schneeberger, K.; Lucas-Lledó, J.I.; Warthmann, N.; Clark, R.M.; Shaw, R.G.; Weigel, D.; Lynch, M. The rate and molecular spectrum of spontaneous mutations in Arabidopsis thaliana. Science 2010, 327, 92–94. [Google Scholar] [CrossRef] [PubMed]
- Exposito-Alonso, M.; Becker, C.; Schuenemann, V.J.; Reiter, E.; Setzer, C.; Slovak, R.; Brachi, B.; Hagmann, J.; Grimm, D.G.; Chen, J.; et al. The rate and potential relevance of new mutations in a colonizing plant lineage. PLoS Genet. 2018, 14, e1007155. [Google Scholar] [CrossRef] [PubMed]
- Dangl, J.L.; Hauffe, K.-D.; Lipphardt, S.; Hahlbrock, K.; Scheel, D. Parsley protoplasts retain differential responsiveness to UV light and fungal elicitor. EMBO J. 1987, 6, 2551–2556. [Google Scholar] [CrossRef] [PubMed]
- Hartmann, U.; Valentine, W.J.; Christie, J.M.; Hays, J.; Jenkins, G.I.; Weisshaar, B. Identification of UV/blue light-response elements in the Arabidopsis thaliana chalcone synthase promoter using a homologous protoplast transient expression system. Plant Mol. Biol. 1998, 36, 741–754. [Google Scholar] [CrossRef] [PubMed]
- Baudry, A.; Heim, M.A.; Dubreucq, B.; Caboche, M.; Weisshaar, B.; Lepiniec, L. TT2, TT8, and TTG1 synergistically specify the expression of BANYULS and proanthocyanidin biosynthesis in Arabidopsis thaliana. Plant J. 2004, 39, 366–380. [Google Scholar] [CrossRef] [PubMed]
- Trezzini, G.F.; Horrichs, A.; Somssich, I.E. Isolation of putative defense-related genes from Arabidopsis thaliana and expression in fungal elicitor-treated cells. Plant Mol. Biol. 1993, 21, 385–389. [Google Scholar] [CrossRef]
- Stracke, R.; Thiedig, K.; Kuhlmann, M.; Weisshaar, B. Analyzing synthetic promoters using Arabidopsis protoplasts. In Methods in Molecular Biology: Plant Synthetic Promoters, 2016 ed.; Hehl, R., Ed.; Springer: New York, NY, USA, 2016; Volume 1482, pp. 67–81. [Google Scholar]
- Rosso, M.G.; Li, Y.; Strizhov, N.; Reiss, B.; Dekker, K.; Weisshaar, B. An Arabidopsis thaliana T-DNA mutagenised population (GABI-Kat) for flanking sequence tag based reverse genetics. Plant Mol. Biol. 2003, 53, 247–259. [Google Scholar] [CrossRef]
- Koren, S.; Walenz, B.P.; Berlin, K.; Miller, J.R.; Bergman, N.H.; Phillippy, A.M. Canu: Scalable and accurate long-read assembly via adaptive k-mer weighting and repeat separation. Genome Res. 2017, 27, 722–736. [Google Scholar] [CrossRef]
- Li, H. Minimap and miniasm: Fast mapping and de novo assembly for noisy long sequences. Bioinformatics 2016, 32, 2103–2110. [Google Scholar] [CrossRef] [PubMed]
- Kolmogorov, M.; Yuan, J.; Lin, Y.R.; Pevzner, P.A. Assembly of long error-prone reads using repeat graphs. Bature Biotechnol. 2019, 37, 540–546. [Google Scholar] [CrossRef] [PubMed]
- Loman, N.J.; Quick, J.; Simpson, J.T. A complete bacterial genome assembled de novo using only nanopore sequencing data. Nat. Methods 2015, 12, 733–735. [Google Scholar] [CrossRef] [PubMed]
- Li, H. Aligning Sequence reads, clone sequences and assembly contigs with BWA-MEM. arXiv 2013, arXiv:1303.3997. [Google Scholar]
- Walker, B.J.; Abeel, T.; Shea, T.; Priest, M.; Abouelliel, A.; Sakthikumar, S.; Cuomo, C.A.; Zeng, Q.; Wortman, J.; Young, S.K.; et al. Pilon: An integrated tool for comprehensive microbial variant detection and genome assembly improvement. PLoS ONE 2014, 9, e112963. [Google Scholar] [CrossRef]
- McKenna, A.; Hanna, M.; Banks, E.; Sivachenko, A.; Cibulskis, K.; Kernytsky, A.; Garimella, K.; Altshuler, D.; Gabriel, S.; Daly, M.; et al. The Genome Analysis Toolkit: A MapReduce framework for analyzing next-generation DNA sequencing data. Genome Res. 2010, 20, 1297–1303. [Google Scholar] [CrossRef]
- Van der Auwera, G.A.; Carneiro, M.O.; Hartl, C.; Poplin, R.; Del Angel, G.; Levy-Moonshine, A.; Jordan, T.; Shakir, K.; Roazen, D.; Thibault, J.; et al. From FastQ data to high confidence variant calls: The Genome Analysis Toolkit best practices pipeline. Curr. Protoc. Bioinform. 2013, 11, 1110. [Google Scholar]
- Baasner, J.S.; Howard, D.; Pucker, B. Influence of neighboring small sequence variants on functional impact prediction. bioRxiv 2019. [Google Scholar] [CrossRef]
- Cingolani, P.; Platts, A.; Wang le, L.; Coon, M.; Nguyen, T.; Wang, L.; Land, S.J.; Lu, X.; Ruden, D.M. A program for annotating and predicting the effects of single nucleotide polymorphisms, SnpEff: SNPs in the genome of Drosophila melanogaster strain w1118; iso-2; iso-3. Fly (Austin) 2012, 6, 80–92. [Google Scholar] [CrossRef]
- Heller, D.; Vingron, M. SVIM: Structural Variant Identification using Mapped Long Reads. Bioinformatics 2019. epub ahead of print. [Google Scholar] [CrossRef]
- Dobin, A.; Davis, C.A.; Schlesinger, F.; Drenkow, J.; Zaleski, C.; Jha, S.; Batut, P.; Chaisson, M.; Gingeras, T.R. STAR: Ultrafast universal RNA-seq aligner. Bioinformatics 2013, 29, 15–21. [Google Scholar] [CrossRef] [PubMed]
- Haak, M.; Vinke, S.; Keller, W.; Droste, J.; Rückert, C.; Kalinowski, J.; Pucker, B. High quality de novo transcriptome assembly of Croton tiglium. Front. Mol. Biosci. 2018, 5, 62. [Google Scholar] [CrossRef] [PubMed]
- Li, H.; Handsaker, B.; Wysoker, A.; Fennell, T.; Ruan, J.; Homer, N.; Marth, G.; Abecasis, G.; Durbin, R. The sequence alignment/map format and SAMtools. Bioinformatics 2009, 25, 2078–2079. [Google Scholar] [CrossRef] [PubMed]
- Quinlan, A.R.; Hall, I.M. BEDTools: A flexible suite of utilities for comparing genomic features. Bioinformatics 2010, 26, 841–842. [Google Scholar] [CrossRef] [PubMed]
- Lee, H.; McManus, C.J.; Cho, D.Y.; Eaton, M.; Renda, F.; Somma, M.P.; Cherbas, L.; May, G.; Powell, S.; Zhang, D.; et al. DNA copy number evolution in Drosophila cell lines. Genome Biol. 2014, 15, R70. [Google Scholar] [CrossRef] [PubMed]
- Kaas, C.S.; Kristensen, C.; Betenbaugh, M.J.; Andersen, M.R. Sequencing the CHO DXB11 genome reveals regional variations in genomic stability and haploidy. BMC Genom. 2015, 16, 160. [Google Scholar] [CrossRef] [PubMed]
- DAmato, F. Nuclear changes in cultured plant cells. Caryologia 1991, 44, 217–224. [Google Scholar] [CrossRef]
- Tan, E.H.; Henry, I.M.; Ravi, M.; Bradnam, K.R.; Mandakova, T.; Marimuthu, M.P.; Korf, I.; Lysak, M.A.; Comai, L.; Chan, S.W. Catastrophic chromosomal restructuring during genome elimination in plants. Elife 2015, 4. [Google Scholar] [CrossRef]
- Lynch, M.; Marinov, G.K. The bioenergetic costs of a gene. Proc. Natl. Acad. Sci. USA 2015, 112, 15690–15695. [Google Scholar] [CrossRef]
- Hu, T.T.; Pattyn, P.; Bakker, E.G.; Cao, J.; Cheng, J.F.; Clark, R.M.; Fahlgren, N.; Fawcett, J.A.; Grimwood, J.; Gundlach, H.; et al. The Arabidopsis lyrata genome sequence and the basis of rapid genome size change. Nat. Genet. 2011, 43, 476–481. [Google Scholar] [CrossRef]
- Ohlrogge, J.B.; Kuhn, D.N.; Stumpf, P.K. Subcellular localization of acyl carrier protein in leaf protoplasts of Spinacia oleracea. Proc. Natl. Acad. Sci. USA 1979, 76, 1194–1198. [Google Scholar] [CrossRef] [PubMed]
- Rawsthorne, S. Carbon flux and fatty acid synthesis in plants. Prog. Lipid Res. 2002, 41, 182–196. [Google Scholar] [CrossRef]
- Lichtenthaler, H.K.; Schwender, J.; Disch, A.; Rohmer, M. Biosynthesis of isoprenoids in higher plant chloroplasts proceeds via a mevalonate-independent pathway. FEBS Lett. 1997, 400, 271–274. [Google Scholar] [CrossRef]
- Cole, L.W. The evolution of per-cell organelle number. Front. Cell Dev. Biol. 2016, 4, 85. [Google Scholar] [CrossRef] [PubMed]
- Kleinboelting, N.; Huep, G.; Appelhagen, I.; Viehoever, P.; Li, Y.; Weisshaar, B. The structural features of thousands of T-DNA insertion sites are consistent with a double-strand break repair-based insertion mechanism. Mol. Plant 2015, 8, 1651–1664. [Google Scholar] [CrossRef]
- Muller, H.J. Some genetic aspects of sex. Am. Nat. 1932, 66, 118–138. [Google Scholar] [CrossRef]
- Schranz, M.E.; Kantama, L.; de Jong, H.; Mitchell-Olds, T. Asexual reproduction in a close relative of Arabidopsis: A genetic investigation of apomixis in Boechera (Brassicaceae). New Phytol. 2006, 171, 425–438. [Google Scholar] [CrossRef]
- Lovell, J.T.; Williamson, R.J.; Wright, S.I.; McKay, J.K.; Sharbel, T.F. Mutation accumulation in an asexual relative of Arabidopsis. PLoS Genet. 2017, 13, e1006550. [Google Scholar] [CrossRef]
- Bomblies, K.; Yant, L.; Laitinen, R.A.; Kim, S.T.; Hollister, J.D.; Warthmann, N.; Fitz, J.; Weigel, D. Local-scale patterns of genetic variability, outcrossing, and spatial structure in natural stands of Arabidopsis thaliana. PLoS Genet. 2010, 6, e1000890. [Google Scholar] [CrossRef]
- Kawakatsu, T.; Huang, S.S.; Jupe, F.; Sasaki, E.; Schmitz, R.J.; Urich, M.A.; Castanon, R.; Nery, J.R.; Barragan, C.; He, Y.; et al. Epigenomic diversity in a global collection of Arabidopsis thaliana accessions. Cell 2016, 166, 492–505. [Google Scholar] [CrossRef]
- Molina, M.; Garcia, M.D. Analysis of genetic variability and regenerated in long-term callus cultures plants of maize. Cytologia 1998, 63, 183–190. [Google Scholar] [CrossRef][Green Version]
- Hug, N.; Longman, D.; Cáceres, J.F. Mechanism and regulation of the nonsense-mediated decay pathway. Nucleic Acids Res. 2016, 44, 1483–1495. [Google Scholar] [CrossRef] [PubMed]
- Pham, G.M.; Newton, L.; Wiegert-Rininger, K.; Vaillancourt, B.; Douches, D.S.; Buell, C.R. Extensive genome heterogeneity leads to preferential allele expression and copy number-dependent expression in cultivated potato. Plant J. 2017, 92, 624–637. [Google Scholar] [CrossRef] [PubMed]
- Zucchi, M.I.; Arizono, H.; Morais, V.A.; Pelegrinelli Fungaro, M.H.; Carneiro Vieira, M.L. Genetic instability of sugarcane plants derived from meristem cultures. Genet. Mol. Biol. 2002, 25, 91–96. [Google Scholar] [CrossRef]
- Fossi, M.; Amundson, K.; Kuppu, S.; Britt, A.; Comai, L. Regeneration of Solanum tuberosum plants from protoplasts induces widespread genome instability. Plant Physiol. 2019, 180, 78–86. [Google Scholar] [CrossRef]
- Giorgetti, L.; Ruffini Castiglione, M.; Turrini, A.; Ronchi, V.N.; Geri, C. Cytogenetic and histological approach for early detection of “mantled” somaclonal variants of oil palm regenerated by somatic embryogenesis: First results on the characterization of regeneration system. Caryologia 2011, 64, 223–234. [Google Scholar]
- Landey, R.B.; Cenci, A.; Guyot, R.; Bertrand, B.; Georget, F.; Dechamp, E.; Herrera, J.-C.; Aribi, J.; Lashermes, P.; Etienne, H. Assessment of genetic and epigenetic changes during cell culture ageing and relations with somaclonal variation in Coffea arabica. Plant Cell Tiss Organ. Cult. 2015, 122, 517–531. [Google Scholar] [CrossRef]
- Miguel, C.; Marum, L. An epigenetic view of plant cells cultured in vitro: Somaclonal variation and beyond. J. Exp. Bot. 2011, 62, 3713–3725. [Google Scholar] [CrossRef]
- Neelakandan, A.K.; Wang, K. Recent progress in the understanding of tissue culture-induced genome level changes in plants and potential applications. Plant Cell Rep. 2012, 31, 597–620. [Google Scholar] [CrossRef]
- Bartels, A.; Han, Q.; Nair, P.; Stacey, L.; Gaynier, H.; Mosley, M.; Huang, Q.Q.; Pearson, J.K.; Hsieh, T.F.; An, Y.C.; et al. Dynamic DNA methylation in plant growth and development. Int. J. Mol. Sci. 2018, 19, 2144. [Google Scholar] [CrossRef]
- Thiebaut, F.; Hemerly, A.S.; Ferreira, P.C.G. A role for epigenetic regulation in the adaptation and stress responses of non-model plants. Front. Plant Sci. 2019, 10, 246. [Google Scholar] [CrossRef] [PubMed]
- Springer, N.M.; Lisch, D.; Li, Q. Creating order from chaos: epigenome dynamics in plants with complex genomes. Plant Cell 2016, 28, 314–325. [Google Scholar] [CrossRef] [PubMed]
- Stelpflug, S.C.; Eichten, S.R.; Hermanson, P.J.; Springer, N.M.; Kaeppler, S.M. Consistent and heritable alterations of DNA methylation are induced by tissue culture in maize. Genetics 2014, 198, 209–218. [Google Scholar] [CrossRef] [PubMed]
- Han, Z.; Crisp, P.A.; Stelpflug, S.; Kaeppler, S.M.; Li, Q.; Springer, N.M. Heritable epigenomic changes to the maize methylome resulting from tissue culture. Genetics 2018, 209, 983–995. [Google Scholar] [CrossRef] [PubMed]
- Sanchez-Munoz, R.; Moyano, E.; Khojasteh, A.; Bonfill, M.; Cusido, R.M.; Palazon, J. Genomic methylation in plant cell cultures: A barrier to the development of commercial long-term biofactories. Eng. Life Sci 2019, 1, 8. [Google Scholar] [CrossRef]
- Stroud, H.; Ding, B.; Simon, S.A.; Feng, S.; Bellizzi, M.; Pellegrini, M.; Wang, G.L.; Meyers, B.C.; Jacobsen, S.E. Plants regenerated from tissue culture contain stable epigenome changes in rice. eLife 2013, 2, e00354. [Google Scholar] [CrossRef] [PubMed]


© 2019 by the authors. Licensee MDPI, Basel, Switzerland. This article is an open access article distributed under the terms and conditions of the Creative Commons Attribution (CC BY) license (http://creativecommons.org/licenses/by/4.0/).
Share and Cite
Pucker, B.; Rückert, C.; Stracke, R.; Viehöver, P.; Kalinowski, J.; Weisshaar, B. Twenty-Five Years of Propagation in Suspension Cell Culture Results in Substantial Alterations of the Arabidopsis Thaliana Genome. Genes 2019, 10, 671. https://doi.org/10.3390/genes10090671
Pucker B, Rückert C, Stracke R, Viehöver P, Kalinowski J, Weisshaar B. Twenty-Five Years of Propagation in Suspension Cell Culture Results in Substantial Alterations of the Arabidopsis Thaliana Genome. Genes. 2019; 10(9):671. https://doi.org/10.3390/genes10090671
Chicago/Turabian StylePucker, Boas, Christian Rückert, Ralf Stracke, Prisca Viehöver, Jörn Kalinowski, and Bernd Weisshaar. 2019. "Twenty-Five Years of Propagation in Suspension Cell Culture Results in Substantial Alterations of the Arabidopsis Thaliana Genome" Genes 10, no. 9: 671. https://doi.org/10.3390/genes10090671
APA StylePucker, B., Rückert, C., Stracke, R., Viehöver, P., Kalinowski, J., & Weisshaar, B. (2019). Twenty-Five Years of Propagation in Suspension Cell Culture Results in Substantial Alterations of the Arabidopsis Thaliana Genome. Genes, 10(9), 671. https://doi.org/10.3390/genes10090671