Abstract
Skin is the body’s largest organ, and the main function of skin is to protect underlying organs from possible external damage. Melanocytes play an important role in skin pigmentation. The Bama pig has a “two-end-black” phenotype with different coat colors across skin regions, e.g., white skin (without melanocytes) and black skin (with melanocytes), which could be a model to investigate skin-related disorders, specifically loss of melanocytes. Here, we generated expression profiles of mRNAs and long noncoding RNAs in Bama pig skins with different coat colors. In total, 14,900 mRNAs and 7549 lncRNAs were expressed. Overall, 2338 mRNAs/113 lncRNAs with FDR-adjusted p-value ≤ 0.05 were considered to be differentially expressed (DE) mRNAs/lncRNAs, with 1305 down-regulated mRNAs and 1033 up-regulated mRNAs in white skin with|log2(fold change)| > 1. The genes down-regulated in white skin were associated with pigmentation, melanocyte–keratinocyte interaction, and keratin, while up-regulated ones were mainly associated with cellular energy metabolisms. Furthermore, those DE lncRNAs were predicted to be implicated in pigmentation, keratin synthesis and cellular energy metabolism. In general, this study provides insight into the transcriptional difference involved in melanocyte-loss-induced keratinocyte changes and promotes the Bama pig as a biomedical model in skin research.
1. Introduction
Skin is the largest organ for mammals, exhibiting a complex heterogeneous and multilayered structure and containing various components and more than 10 types of cells [1]. This organ is the main barrier to the external environment and protects underlying organs from trauma and radiation damage.
Much research has been performed to investigate or demonstrate the structural components and physiological mechanisms of skin in humans and mice. For example, pigmentation, which depends on the production of eumelanin and pheomelanin in melanocytes, provides protection for the skin of humans and other animals, as well as directly affecting appearance [2]. Researchers have also demonstrated that the interaction of plasma membranes between melanocytes and keratinocytes is critically important during melanosome translation [3,4].
The Bama pig is an indigenous breed in China, with a “two-end-black” coat color phenotype (black head and hip, white belt across the body). The white skin of the Bama pig lacks melanocytes [5]. With this particular character and the similarities of structure, biochemistry, immunology, molecular biology and clinical behavior in skin, the Bama pig has been used for research on wound healing and hypertrophic scarring [6], and also could be an appropriate model to study the loss of melanocytes and diseases associated with melanocyte deficiency, such as Waardenburg syndrome (deafness and skin pigmentation deficiency) and vitiligo (skin pigmentation deficiency) [7,8,9]. But still, the physiological mechanism of melanocytes, keratinocytes and other types of cells in the black and white skin of the Bama pig is not well-understood due to few studies conducted on Bama pigs.
LncRNAs are commonly defined as non-coding RNA with a length more than 200 bp, which regulate some interesting gene expression [10,11]. To expound the biological mechanisms and interaction between melanocytes and other types of cells, we investigated the mRNA and lncRNA expression profiles of the black and white skin in six Bama pigs. In the present study, we identified 2338 differentially expressed mRNAs (DE mRNAs) and 113 differentially expressed lncRNAs (DE lncRNAs). The DE mRNAs were mainly associated with coat color, keratin, the TCA cycle and oxidative phosphorylation. As a result of the functional enrichment analysis of lncRNA, we found four DE lncRNAs which might have potential roles in pigmentation, keratin synthesis and cellular energy metabolism. The melanocyte–keratinocyte interaction would lessen as a result of melanocyte absence in white skin, and a melanocyte deficiency could lead to possible distinct physiological properties, such as the development of hypertrophic scars. Thus, our study provides insight into the transcriptional difference involved in melanocyte-loss-induced keratinocyte changes and promotes the Bama pig as a biomedical model in skin research.
2. Materials and Methods
2.1. Pig Skin Sampling
Six two-year-old female Bama pigs of a similar-weight and raised under the same feeding and rearing conditions were chosen for the experiments. The pigs were humanely killed, after being stunned by an electric shock to ameliorate their suffering. Then, white skin from the back and black skin from the buttocks with a depth of 8 mm [12] was collected (Figure 1). Each collected sample was put into a 1.5 mL tube with 1 mL of RNAlater (Life Technologies, Beijing, China). Eight tissue samples from three Bama pigs (heart, brain, liver, spleen, mesentery, longissimus dorsi, kidney, lung) were also collected. Finally, the tubes and tissues were immersed in liquid nitrogen and stored at −80 °C. All experimental and sample collection procedures were approved by the Institutional Animal Care and Use Committee (IACUC) of the College of Animal Science and Technology of Sichuan Agricultural University, Sichuan, China, under permit No. DKY-S20163629.
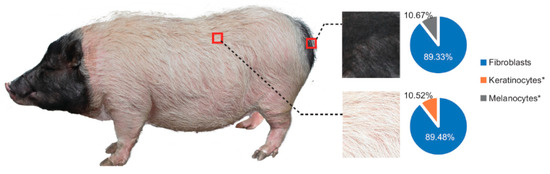
Figure 1.
White and black skin were separately sampled from the pigs’ back and buttocks, and the pie plot shows the comparisons of fibroblast, keratinocyte and melanocyte in two different skins after evaluation by CIBERSORT [13]. Except for fibroblast, keratinocyte and melanocyte varied significantly between the two groups using the Student’s t-test (two-tailed). (*: p < 0.05).
2.2. Total RNA Extraction, Sequencing, and Read Mapping
A total of 3 μg of RNA (per skin sample) was extracted using Trizol reagent (Life Technologies, Beijing, China), in accordance with the manufacturer’s instructions, as was RNA of eight tissues from 3 Bama pigs (heart, brain, liver, spleen, mesentery, longissimus dorsi, kidney, lung). The integrity of RNA was checked by gel electrophoresis on 1.0% agarose gel with GoldView staining using an Agilent 2100 bioanalyzer. A NanoDrop spectrophotometer (Thermo Scientific) was used to measure the RNA concentrations. The RNAs with a ratio of absorbance at 260/280 nm of over 1.8 were selected for further study.
Six samples from three different pigs (named B1, B2, B3, W1, W2, and W3) were selected for sequencing. Approximately 1 µg of total RNA (per sample) and oligo (dT) magnetic heads were used for enriching poly (A) RNAs. The resulting fragments were used as a template for reverse transcription. Random hexamer primers, buffer, dNTPs, DNA polymerase I, and RNase H were used for generating RNA-Seq complementary DNA (cDNA) libraries; next, RNA-seq was conducted following the manufacturer’s standard procedures. High-quality strand-specific libraries were sequenced on the HiSeq X platform (Illumina, San Diego, CA, USA) and the bases were called using the software CASAVA v.1.8.2 (Illumina); then, 150-bp paired-end reads were obtained.
High-quality data were controlled by removing poly-N and low-quality reads from the raw data. As a consequence, a total of 44 GB of clean data was acquired. The Q30 scores and GC content of the clean data were calculated. Clean data were mapped to the pig genome (Sus scrofa 11.1 of release 90 from Ensembl) using TopHat (version 2.1.0) [14]. (Table S1)
The RNA-Seq data have been deposited in the NCBI (National Center for Biotechnology Information) Gene Expression Omnibus (GEO) and the accession number is GSE125517.
2.3. LncRNA Identification
Mapped reads were assembled by StringTie and then merged with Cuffmerge (part of Cufflinks version 2.2.1) [15]. Then, coding transcripts were filtered by the following steps: (1) remove transcripts of coding gene while comparing to annotated genome by Cuffcompare (part of Cufflinks); (2) comparing with the Pfam-27 database and trimming out transcripts with a p-value < 10−4 by Hmmscan [16]; (3) comparison with uniref and the nr database and trimming out transcripts with a p-value < 10−10 by BLASTX (https://blast.ncbi.nlm.nih.gov/); and (4) prediction and calculation of the coding potential of the remaining transcripts by CPC [17]. Transcripts without coding potential were retained [18].
2.4. Expression Analysis of mRNA and lncRNA
The mRNA and lncRNA expression level of fragments per kilobase per million mapped reads (FPKM) of each sample was calculated by StringTie (version 1.3.3) [19]; mRNAs with FPKM > 0.5 in at least one sample in at least one group were considered to be expressed and lncRNAs with FPKM > 0.1 in at least one sample in at least one group were considered to be expressed. Then Cuffdiff (part of Cufflinks, version 2.2.1) [14] was applied to detect differentially expressed mRNAs and lncRNAs, and those mRNAs or lncRNAs with adjusted-p values < 0.05 and |log2(FC)| > 1 were considered to be differentially expressed.
2.5. Clustering and Principal Component Analysis
FPKM values of the six samples (B1, B2, B3, W1, W2, and W3) were used for principal component analysis (PCA) analysis, as well as clustering analysis.
2.6. Profiling Melanocyte Proportion with CIBERSORT
The RNA-seq data of melanocytes, keratinocytes and fibroblasts were downloaded from reference [20]. The CIBERSORT [13] was used to estimate the proportion of melanocytes, keratinocytes and fibroblasts within skin.
2.7. Construction of lncRNA-mRNA Interaction Network
The R package WGCNA was used to detect interactions between lncRNA and mRNA [21]. The Cytoscape (version 3.2.1) [22] was used to construct the lncRNA-mRNA interaction network.
2.8. Functional Enrichment Analysis
Gene ontology (GO) functional enrichment analysis and KEGG pathway functional enrichment analysis were performed with DE genes at the DAVID web server (http://david.abcc.ncifcrf.gov/). To predict the functions of the DE lncRNAs, the differentially expressed genes that were within 100 kb of the lncRNAs or showed a high correlation with the lncRNA were collected and performed functional enrichment analysis as well. The KEGG pathways or GO terms with Benjamini-corrected p-value < 0.05 were significant.
Pearson’s correlation coefficients between the expression of DE lncRNAs and the DE mRNAs were calculated with Hmisc (an R package from https://cran.r-project.org/), with the aim of identifying correlations between expression of functional lncRNAs and DE mRNAs [23]. All the analysis strategy is shown in Figure S1.
2.9. Validation of Genes and lncRNAs by Real-Time PCR
Twenty-one genes (3 lncRNA included) (Table S2) were selected for the validation and another eight tissues of three Bama pigs were used to investigate the regulations between the lncRNA TCONS_00019024 and that of CYGB (n = 3). To investigate the correlation between expression of TCONS_00019024 and CYGB, RNAs from the skin of six Bama pigs were used for the experiment (n = 6). The genomic DNA in RNA samples was removed by gDNA Eraser (TaKaRa, Shanghai, China) at 42 °C for 5 min. Five micrograms of RNA was reverse-transcribed into cDNA using RT Reagent Kit (TaKaRa, Shanghai, China). The primers for the genes and lncRNAs were designed using Primer 5.0 and tested by NCBI Primer-Blast. The volume of the reaction mixture was 10 µL, with 1 µL of cDNA, 0.5 µL of primers, 5 µL of SYBR (TaKaRa, Shanghai, China), and 3 µL of RNA-free water. The following RT-PCR reaction was performed for all genes and lncRNAs: 95 °C for 3 min; followed by 40 cycles of 95 °C for 10 s and amplification at the optimal temperature for each sample for 30 s; 95 °C for 30 s; and then a melting curve analysis (65 °C to 95 °C). The expression of β-actin was used to correct the gene expression data. The 2−ΔΔCT method was used to analyze the RT-PCR data and calculate relative expression. If a gene was up-regulated in black skin, its expression relative to that in white skin was calculated. If a gene was up-regulated in white skin, its expression relative to that in black skin was also calculated. The t-test was used to test the significance of differences in gene expression.
3. Results
3.1. Expression Profiles of mRNAs and lncRNAs
Approximately 49.03 million raw reads were generated for each sample, and after quality control, 48.81 million clean reads per each were obtained for further analysis. A total of 93–97% of the clean reads were mapped to the pig genome reference (Table S1). Finally, 14,900 mRNAs and 7549 lncRNA (including 82 annotated and 7467 novel lncRNA) were substantially expressed in our samples respectively (Tables S3 and S4). Then we compared the characteristics of lncRNA and mRNA in exon number, transcript length, expression level and coding potential. LncRNAs contain more transcripts with fewer exon numbers (median value = 2), shorter transcript lengths (median value = 588 nt), lower expression levels (mean FPKM value = 1.76) and lower coding potentials compared to mRNA (median of exon number = 8; median of transcript length = 2622 nt; mean FPKM value = 30.72) which were consistent with previous research (Figure S2A–D) [24,25,26]. Great variations were found between white and black skin as the results shown by principal component analysis (PCA) (Figure 2A,B). The hierarchical cluster of expressed (Figure S3A,B) or differentially expressed (Figure S4A,B) mRNAs and lncRNA, and Pearson matrix correlation (Figure S3C,D) based on expressed mRNA and lncRNA could clearly differentiate white and black skins. Further, as shown in Figure 1, the fibroblast is the major cell type in the skin, and there is a lack of melanocytes in the white skin, which is consistent with previous observations [5]. The above results suggested that our experiment was reliable.
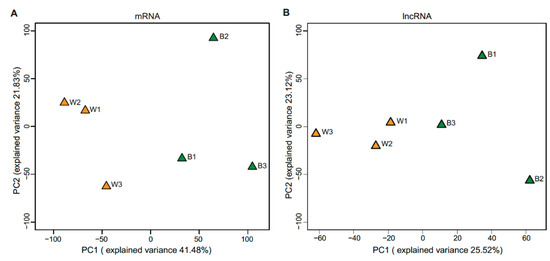
Figure 2.
Principal component analysis of mRNA (A) and lncRNA (B).
3.2. Functional Enrichment Analysis of DE mRNA
A total of 2338 mRNAs were identified to be differentially expressed between two groups (Table S5). Among these DE mRNAs, 1305 were down-regulated and 1033 up-regulated in white skin (Figure 3A), including 239 genes down-regulated less than 0.25-fold and 295 genes up-regulated more than 4-fold (marked in Table S5).
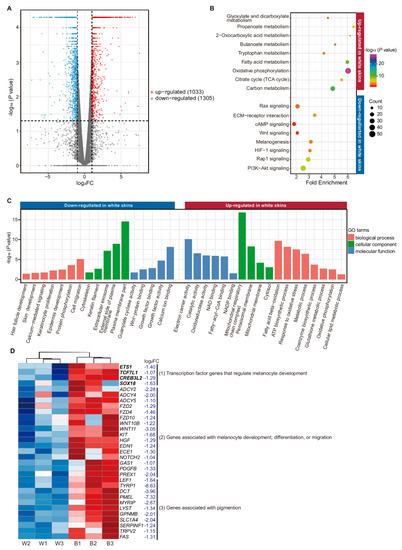
Figure 3.
Enrichment analysis of differentially expressed (DE) mRNAs. (A) Volcano plot for 2338 DE genes, of which 1305 were down-regulated in white skins, while 1033 were up-regulated. (B) Functional enrichment analysis of the KEGG pathway (genes down-regulated in white skin were marked blue and up-regulated marked red; Benjamini corrected p-value < 0.05). (C) Gene ontology (GO) enrichment analysis (genes down-regulated in white skin marked blue and up-regulated marked red p-value < 0.05). (D) Identification of genes associated with melanogenesis. The genes in bold are transcript factor genes (cluster (1)).
The down-regulated genes in white skin mainly related to coat color terms or pathways, such as melanogenesis (p = 4.77 × 10⁻⁴), WNT signaling pathway (p = 9.86 × 10⁻³), PI3K-Akt signaling pathway (p = 7.49 × 10⁻⁹), cAMP signaling pathway (p = 9.53 × 10⁻³), and ECM-receptor interaction (p = 2.51 × 10⁻⁵) (Figure 3B, Table S6) [27,28,29,30,31,32] In addition, the well-known melanocyte-specific genes TYR, TRPM1, TYRP1, PMEL and MLANA were hardly expressed in white skin [33] (Table 1).

Table 1.
Expression of the melanocyte-specific genes.
We also noticed 31 coat color genes down-regulated in white skin (p < 0.05; log2FC < −1), which were proved to be less expressed in white skin [36,37,38,39,40,41,42,43] (Figure 3D). Those 31 coat color genes could be divided into three classes: (1) transcription factor genes that regulate melanocyte development, such as ETS1, TCF7L1, and SOX18; (2) genes that regulate melanocyte development, differentiation, or migration, such as KIT, HGF, EDN1 and WNT11 [44,45]; and (3) genes associated with pigmentation, such as DCT, TYRP1, PMEL and MYRIP [46]. Melanocytes produce melanin and secrete melanosomes, playing an irreplaceable role in pigmentation. Proteins encoded by genes in class (1) and (2) are required for normal development and the migration of melanocytes. Disruption of these genes would contribute to a lack of melanocytes in hair, skin, and the inner ear, and result in pigmentation deficiency [44,47]. However, for genes in class (3), the distribution of melanocytes was not affected by the decrease of these genes. For example, SOX transcript factor family is required for melanocyte development, and mutation of the SOX gene family could result in Waardenburg syndrome [48]. KIT (c-kit) (log2FC = −1.68; p = 2.5 × 10⁻⁴) plays a crucial role in melanocyte development, melanocyte differentiation, and melanocyte migration [49]. Mutation of the KIT gene may cause melanocyte defects in European domestic pigs [47], while mutation of TYRP1 or PMEL caused defects in eumelanin synthesis instead of melanocyte loss [46,50]. Therefore, the genes in class (1) or (2) may play important roles in shaping the “two-end-black” phenotype. We also found these genes that may be implicated in pigmentation were down-regulated in white skin, such as the keratin (KRT) gene [51,52,53].
Except for pigmentation, we found that numerous genes down-regulated in white skin were significantly enriched in subcategories closely associated with the melanocyte–keratinocyte interaction, such as plasma membrane (384 genes) (p = 2.99 × 10⁻¹⁵), external side of the plasma membrane (41 genes) (p = 1.19 × 10⁻⁹), calcium ion binding (89 genes) (p = 7.60 × 10⁻¹³), and extracellular exosome (251 genes) (p = 7.33 × 10⁻⁸) (Table S6), as well as some terms closely related to skin’s structure like keratin filament (p = 2.07 × 10⁻³), hair follicle development (p = 3.64 × 10⁻²), and skin development (p = 2.21 × 10⁻²) (Table S6) (Figure 3C).
Up-regulated genes in white skin were mainly enriched in pathways linked with cellular energy metabolism, such as oxidative phosphorylation (p = 6.78 × 10⁻²⁸), carbon metabolism (p = 6.51 × 10⁻¹³), TCA cycle (p = 1.33 × 10⁻⁵), and propanoate metabolism (p = 7.37 × 10⁻⁷) (Figure 3B, Table S6). These observations suggest active cellular energy metabolism occurs in white skin compared with that in black skin. Besides, up-regulated genes were also significantly enriched in terms of including catalytic activity (p = 2.87 × 10⁻⁷), oxidoreductase activity (p = 1.04 × 10⁻⁶), NADP binding (p = 3.04 × 10⁻³), fatty acid metabolic process (p = 5.11× 10⁻⁵), and mitochondrial membrane (p = 8.70 × 10⁻⁴) (for details, see Table S6) (Figure 3C).
3.3. Functional Enrichment Analysis of DE lncRNAs
A total of 113 lncRNA were identified to be differentially expressed, among which 34 were down-regulated and 79 were up-regulated in white skin (Table S7, Figure 4A). Furthermore, 88 DE mRNAs were oriented nearby those DE lncRNAs with 100 kb. These DE mRNAs were found to be enriched in the PI3K-Alt signaling pathway (p = 4.0 × 10⁻²) which was involved in pigmentation (Figure 4B, Table S8) [29].
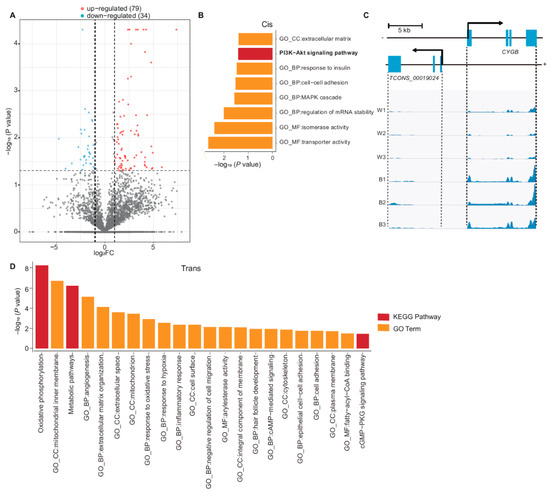
Figure 4.
Functional enrichment analysis of DE lncRNAs. (A) DE lncRNAs between two groups (79 DE lncRNAs were up-regulated in white skin while 34 DE lncRNAs were down-regulated). (B) Functional enrichment analysis with 88 DE genes adjacent to DE lncRNAs (p-value < 0.05). (C) Genomic location and reads abundance of TCONS_00019024 and its target gene CYGB. (Pearson correlation coefficient: 0.932, p = 0.01). (D) Functional enrichment analysis of trans target genes related to DE lncRNA.
In addition, we found four DE lncRNAs (TCONS_00077733, TCONS_00042201, TCONS_00060772 and TCONS_00019024) might play roles in keratin synthesis, response to insulin, β-oxidation of fat and melanocyte survival. For example, there were four keratin genes (KRT80, KRT7, KRT81, and KRT86) oriented nearby TCONS_00077733 within 100 kb, particularly KRT80 which is convergent and 17,754 bp downstream of TCONS_00077733 (r = 0.97, p = 7.60 × 10⁻⁴), which assumed that TCONS_00077733 might be related to keratin synthesis. Moreover, TCONS_00042201 is located 336 bp upstream of IRS1 (r = 0.85, p = 3.27 × 10⁻²). IRS1 encodes insulin receptor substrate 1, which is associated with response to insulin [54]. Mutation of IRS1 may thus contribute to insulin resistance [54]. In addition, TCONS_00060772 is a lncRNA that is located overlapping HSD17B4 and their expression is correlated (r = 0.99, p = 6.01 × 10⁻⁶). HSD17B4 is involved in the β-oxidation of fat [55]. TCONS_00019024 is a divergent lncRNA [24] of CYGB (cytoglobin), located 3888 bp upstream of CYGB. This lncRNA/mRNA pair was found to be up-regulated in black skin, showing a Pearson’s correlation coefficient of 0.932 (p = 1 × 10⁻²) (Figure 4C). CYGB is a ROS scavenger in melanocytes and plays a role in maintaining melanocyte survival [56]. These results suggest some DE lncRNA may have a potential role in pigmentation, keratin synthesis and cellular energy metabolism.
Further, 474 DE mRNAs showed high correlation (|r| > 0.95, p < 0.05) in expression level with 113 DE lncRNAs. These 474 DE mRNAs were significantly enriched in oxidative phosphorylation (p = 4.68 × 10⁻⁸), mitochondrial inner membrane (p = 6.46 × 10⁻⁸) and plasma membrane (p = 2.20 × 10⁻²) (Figure 4D, Table S9). In addition, the lncRNA-mRNA interaction network indicated lncRNA TCONS_00077733 may interact with KRT genes by trans (Figure S5). These results implied that DE lncRNA might be associated with cellular energy metabolism and melanocyte–keratinocyte interaction.
3.4. Quantitative Real-Time PCR Validation
A total of 21 genes were selected for the validation. The melanocyte-specific genes (TRPM1, TYRP1, PMEL, MLANA and DCT) were significantly highly expressed in black skin and 21 genes above were indeed differentially expressed (Figure 5A–C).
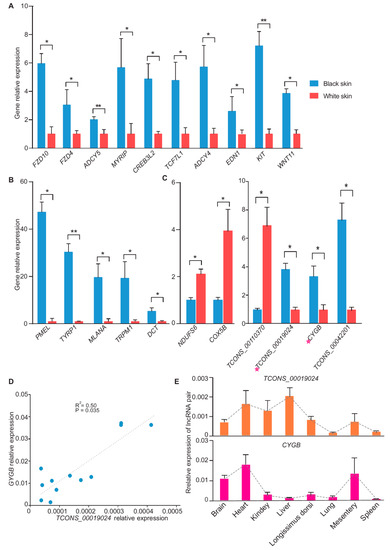
Figure 5.
RT-PCR validation of the differentially expressed mRNAs and lncRNAs. (A) RT-PCR validation results of 10 coat color genes (n = 3). (B) RT-PCR validation results of melanocyte-specific expression gene (n = 3). (C) RT-PCR validation results of mRNA and lncRNA that were differentially expressed in the skin (n = 3). The lncRNA TCONS_00019024 and its target gene CYGB were marked utilizing a pink star. (D) Correlation curve of TCONS_00019024/CYGB. RT-PCR data from skins were used to create a correlation curve (n = 6). Linear correlation coefficient of TCONS_00019024/CYGB was 0.71 (R2 = 0.50, p = 0.035). (E) Relative expression of TCONS_00019024 and CYGB in 8 tissues (n = 3). * p-value < 0.05. ** p-value < 0.01.
RT-PCR indicated that the correlation coefficient between TCONS_00019024 and CYGB was 0.71 in the skin (R2 = 0.50, p =3.5 × 10⁻²) (Figure 5D). We also investigated the relative expression of the TCONS_00019024/CYGB pair in eight other tissues. The results showed that TCONS_00019024 and CYGB presented different expression patterns in the tissues, implying that the correlation of TCONS_00019024 with CYGB may only occur in skin (Figure 5E). In conclusion, the qRT-PCR experiment validated the discovery of RNA-Seq and supported the reliability of RNA-Seq.
4. Discussion and Conclusions
Skin is both important and the largest organ of the body, and provides protection for underlying organs. Melanocyte inhabits the skin and its major function is the pigmentation of skin and hair. Loss of melanocyte can cause pigmentation deficiency. Mechanisms of melanocyte deficiency are still not fully understood and transcriptome profiles studies related to the lack of melanocytes are insufficient. Even the mechanism associated with the cross-talk between melanocytes and other types of cells in the skin is still not well-understood in the pig. Therefore, we performed transcriptomic analysis of Bama pig skin to reveal the mechanism potentially associated with the loss of melanocytes or interaction networks related to melanocytes in the pig.
Even with a great similarity between white and black skins, the Pearson correlation coefficient was 0.92 (Figure S3C–D) which was higher than that between skin and other vascular tissues [57]. Furthermore, various differences such as skin thickness, PH [58,59], appearance, cellular energy metabolism, and melanocyte–keratinocyte interaction were found. Only based on these differences could we interpret the discrepancies in the synthesis of melanin, pigmentation, and coat color gene expression profiles.
Melanocytes and keratinocytes are important for their interaction in the skin, and the absence of melanocytes could result in the disappearance of this interaction and may impact on the function of keratinocytes. For example, melanosome transfer, based on calcium and plasma membrane, is an important process of keratinocyte–melanocyte interaction. [3,4]. Interestingly, many down-regulated genes in white skin, such as ITSN1, BTK, FYN and CCR1, were associated with calcium release of the plasma membrane (Figure 3C, Table S5). These results could provide evidence for the disappearance of the melanocyte–keratinocyte interaction in white skin. Moreover, regarding keratinocytes, proliferation could be stimulated by melanocytes in the procedure of accelerating wound closure as well as fibroblasts [60,61,62]. In comparison with white skin, the black skin had more melanocytes. The black skin may be more prone to hypertrophic scars than the white skin. Previous wound healing experiments also demonstrated that the skin of the Duroc pig (with melanocytes) is more prone to hypertrophic scars than the skin of the Hampshire pig (with melanocyte deficiency) [63,64,65]. Therefore, the black skin of the Bama pig may be more suitable for hypertrophic scar research.
In this study, we identified two DE lncRNAs (TCONS_00077733, and TCONS_00060772) which might be involved in keratin synthesis and cellular energy metabolism. The black skin was different from the white skin in the expression of keratin genes and genes related to cellular energy metabolism. lncRNA was shown to play critical roles in the skin, such as melanin synthesis in goats [66], psoriasis in humans [26] and expression of keratin and promotion of melanogenesis in mice [67]. In addition, lncRNA H19 regulates Dsg1 expression and the consequent keratinocyte differentiation through acting as an endogenous “sponge” of miR-130b-3p in humans [68]. Thus, we deduced that TCONS_00077733 and TCONS_00060772 might be one of causes responsible for the difference between black and white skin, but more evidence is needed to support this assumption. Taken together, the results of this study provide evidence of the interactions involved in pigmentation. This research provides insight into the complex mechanisms associated with the “two-end-black” phenotype.
In conclusion, we had the opportunity to work on the same individual to systematically reveal transcriptome differences. Our results suggested that the loss of melanocytes could contribute to the expression of melanogenesis genes, and lack of melanocytes might be one of the causes of the white skin differing from the black skin in keratinocyte function and the development of hypertrophic scars. In addition, the present research implies that lncRNAs play roles in skin. Our research could promote the application of the Bama pig in research on melanocyte deficiency.
Supplementary Materials
The following are available online at https://www.mdpi.com/2073-4425/11/1/47/s1, Figure S1: Strategy of data analysis. Figure S2: Characteristic comparison of mRNAs and lncRNAs in exon numbers (A), CDS (coding sequence) length (B), expression levels (C) and coding potential (D) (calculated by CPC2). Figure S3: Hierarchical cluster analysis of expressed mRNA (A) and lncRNA (B). Pairwise Pearson correlations of expressed mRNA (C) and lncRNA (D). Figure S4: Hierarchical cluster analysis of differentially expressed mRNA (A) and lncRNA (B). Figure S5: The view of lncRNA-mRNA associated network. Table S1: Summary of data information. Table S2: Primer sequences of selected genes. Table S3: Expressed mRNAs. Table S4: Expressed lncRNAs. Table S5: Differentially expressed mRNAs. Table S6: Functional enrichment analysis of DEGs up- or down-regulated in white skin. Table S7: Differentially expressed lncRNAs. Table S8: Functional enrichment analysis of cis target genes. Table S9: Functional enrichment analysis of trans target genes.
Author Contributions
Conceptualization, L.J., M.L. and Q.T.; Data curation, S.H.; Formal analysis, L.J., L.Z. and S.H.; Funding acquisition, M.L.; Investigation, K.L., R.L., X.Z., Y.W., Z.H. and X.L.; Methodology, Q.T.; Project administration, M.L. and Q.T.; Validation, P.L.; Visualization, L.J. and L.Z.; Writing—original draft, L.Z. and S.H.; Writing—review & editing, L.J. All authors have read and agreed to the published version of the manuscript.
Founding
This work was supported by grants from the National Key R&D Program of China (2018YFD0500403 and 2018YFD0501204), the National Natural Science Foundation of China (31601919, 31872335 and 31772576), the Sichuan Province & Chinese Academy of Science of Science & Technology Cooperation Project (2017JZ0025), the Key Project of Sichuan Education Department (17ZA0306), and the Young Talent Lifting Project of Sichuan Association for Science and Technology (2018RCTJ).
Conflicts of Interest
The authors declare no conflict of interest.
References
- Kanitakis, J. Anatomy, histology and immunohistochemistry of normal human skin. Eur. J. Dermatol. 2002, 12, 390–399. [Google Scholar] [PubMed]
- Cichorek, M.; Wachulska, M.; Stasiewicz, A.; Tyminska, A. Skin melanocytes: Biology and development. Adv. Dermatol. Allergol. 2013, 30, 30–41. [Google Scholar] [CrossRef] [PubMed]
- Joshi, P.G.; Nair, N.; Begum, G.; Joshi, N.B.; Sinkar, V.P.; Vora, S. Melanocyte-keratinocyte interaction induces calcium signalling and melanin transfer to keratinocytes. Pigment Cell Res. 2007, 20, 380–384. [Google Scholar] [CrossRef] [PubMed]
- Bush, W.D.; Simon, J.D. Quantification of Ca2+ binding to melanin supports the hypothesis that melanosomes serve a functional role in regulating calcium homeostasis. Pigment Cell Res. 2007, 20, 134–139. [Google Scholar] [CrossRef]
- Liu, Y.; Chen, J.Y.; Shang, H.T.; Liu, C.E.; Wang, Y.; Niu, R.; Wu, J.; Wei, H. Light microscopic, electron microscopic, and immunohistochemical comparison of bama minipig (sus scrofa domestica) and human skin. Comp. Med. 2010, 60, 142–148. [Google Scholar]
- Liu, B.; Liu, Y.; Wang, L.; Hou, C.; An, M. Rna-seq-based analysis of the hypertrophic scarring with and without pressure therapy in a bama minipig model. Sci. Rep. 2018, 8, 11831. [Google Scholar] [CrossRef]
- Lin, J.Y.; Fisher, D.E. Melanocyte biology and skin pigmentation. Nature 2007, 445, 843–850. [Google Scholar] [CrossRef]
- Tachibana, M.; Kobayashi, Y.; Matsushima, Y. Mouse models for four types of waardenburg syndrome. Pigment Cell Res. 2003, 16, 448–454. [Google Scholar] [CrossRef]
- Lerner, A.B.; Shiohara, T.; Boissy, R.E.; Jacobson, K.A.; Lamoreux, M.L.; Moellmann, G.E. A mouse model for vitiligo. J. Investig. Dermatol. 1986, 87, 299–304. [Google Scholar] [CrossRef]
- Orom, U.A.; Derrien, T.; Beringer, M.; Gumireddy, K.; Gardini, A.; Bussotti, G.; Lai, F.; Zytnicki, M.; Notredame, C.; Huang, Q.; et al. Long noncoding rnas with enhancer-like function in human cells. Cell 2010, 143, 46–58. [Google Scholar] [CrossRef]
- St Laurent, G.; Wahlestedt, C.; Kapranov, P. The landscape of long noncoding rna classification. Trends Genet. 2015, 31, 239–251. [Google Scholar] [CrossRef] [PubMed]
- Fan, R.; Xie, J.; Bai, J.; Wang, H.; Tian, X.; Bai, R.; Jia, X.; Yang, L.; Song, Y.; Herrid, M.; et al. Skin transcriptome profiles associated with coat color in sheep. BMC Genom. 2013, 14, 389. [Google Scholar] [CrossRef] [PubMed]
- Chen, B.; Khodadoust, M.S.; Liu, C.L.; Newman, A.M.; Alizadeh, A.A. Profiling tumor infiltrating immune cells with cibersort. Methods Mol. Biol. 2018, 1711, 243–259. [Google Scholar] [PubMed]
- Ghosh, S.; Chan, C.K. Analysis of rna-seq data using tophat and cufflinks. Methods Mol. Biol. 2016, 1374, 339–361. [Google Scholar] [PubMed]
- Finn, R.D.; Bateman, A.; Clements, J.; Coggill, P.; Eberhardt, R.Y.; Eddy, S.R.; Heger, A.; Hetherington, K.; Holm, L.; Mistry, J.; et al. Pfam: The protein families database. Nucleic Acids Res. 2014, 42, D222–D230. [Google Scholar] [CrossRef]
- Finn, R.D.; Clements, J.; Arndt, W.; Miller, B.L.; Wheeler, T.J.; Schreiber, F.; Bateman, A.; Eddy, S.R. Hmmer web server: 2015 update. Nucleic Acids Res. 2015, 43, W30–W38. [Google Scholar] [CrossRef]
- Kong, L.; Zhang, Y.; Ye, Z.Q.; Liu, X.Q.; Zhao, S.Q.; Wei, L.; Gao, G. Cpc: Assess the protein-coding potential of transcripts using sequence features and support vector machine. Nucleic Acids Res. 2007, 35, W345–W349. [Google Scholar] [CrossRef]
- Wucher, V.; Legeai, F.; Hedan, B.; Rizk, G.; Lagoutte, L.; Leeb, T.; Jagannathan, V.; Cadieu, E.; David, A.; Lohi, H.; et al. Feelnc: A tool for long non-coding rna annotation and its application to the dog transcriptome. Nucleic Acids Res. 2017, 45, e57. [Google Scholar] [CrossRef]
- Pertea, M.; Pertea, G.M.; Antonescu, C.M.; Chang, T.C.; Mendell, J.T.; Salzberg, S.L. Stringtie enables improved reconstruction of a transcriptome from rna-seq reads. Nat. Biotechnol. 2015, 33, 290–295. [Google Scholar] [CrossRef]
- Reemann, P.; Reimann, E.; Ilmjärv, S.; Porosaar, O.; Silm, H.; Jaks, V.; Vasar, E.; Kingo, K.; Kõks, S. Melanocytes in the skin--comparative whole transcriptome analysis of main skin cell types. PLoS ONE 2014, 9, e115717. [Google Scholar] [CrossRef]
- Langfelder, P.; Horvath, S. Wgcna: An r package for weighted correlation network analysis. BMC Bioinform. 2008, 9, 559. [Google Scholar] [CrossRef] [PubMed]
- Shannon, P.; Markiel, A.; Ozier, O.; Baliga, N.S.; Wang, J.T.; Ramage, D.; Amin, N.; Schwikowski, B.; Ideker, T. Cytoscape: A software environment for integrated models of biomolecular interaction networks. Genome Res. 2003, 13, 2498–2504. [Google Scholar] [CrossRef] [PubMed]
- Jin, L.; Hu, S.; Tu, T.; Huang, Z.; Tang, Q.; Ma, J.; Wang, X.; Li, X.; Zhou, X.; Shuai, S.; et al. Global long noncoding rna and mrna expression changes between prenatal and neonatal lung tissue in pigs. Genes 2018, 9, 443. [Google Scholar] [CrossRef] [PubMed]
- Luo, S.; Lu, J.Y.; Liu, L.; Yin, Y.; Chen, C.; Han, X.; Wu, B.; Xu, R.; Liu, W.; Yan, P.; et al. Divergent lncrnas regulate gene expression and lineage differentiation in pluripotent cells. Cell Stem Cell 2016, 18, 637–652. [Google Scholar] [CrossRef] [PubMed]
- Li, B.; Tsoi, L.C.; Swindell, W.R.; Gudjonsson, J.E.; Tejasvi, T.; Johnston, A.; Ding, J.; Stuart, P.E.; Xing, X.; Kochkodan, J.J.; et al. Transcriptome analysis of psoriasis in a large case-control sample: Rna-seq provides insights into disease mechanisms. J. Investig. Dermatol. 2014, 134, 1828–1838. [Google Scholar] [CrossRef] [PubMed]
- Tsoi, L.C.; Iyer, M.K.; Stuart, P.E.; Swindell, W.R.; Gudjonsson, J.E.; Tejasvi, T.; Sarkar, M.K.; Li, B.; Ding, J.; Voorhees, J.J.; et al. Analysis of long non-coding rnas highlights tissue-specific expression patterns and epigenetic profiles in normal and psoriatic skin. Genome Biol. 2015, 16, 24. [Google Scholar] [CrossRef] [PubMed]
- Jin, E.J.; Erickson, C.A.; Takada, S.; Burrus, L.W. Wnt and bmp signaling govern lineage segregation of melanocytes in the avian embryo. Dev. Biol. 2001, 233, 22–37. [Google Scholar] [CrossRef]
- Rabbani, P.; Takeo, M.; Chou, W.; Myung, P.; Bosenberg, M.; Chin, L.; Taketo, M.M.; Ito, M. Coordinated activation of wnt in epithelial and melanocyte stem cells initiates pigmented hair regeneration. Cell 2011, 145, 941–955. [Google Scholar] [CrossRef]
- Larribere, L.; Khaled, M.; Tartare-Deckert, S.; Busca, R.; Luciano, F.; Bille, K.; Valony, G.; Eychene, A.; Auberger, P.; Ortonne, J.P.; et al. Pi3k mediates protection against trail-induced apoptosis in primary human melanocytes. Cell Death Differ. 2004, 11, 1084–1091. [Google Scholar] [CrossRef]
- Rodriguez, C.I.; Setaluri, V. Cyclic amp (camp) signaling in melanocytes and melanoma. Arch. Biochem. Biophys. 2014, 563, 22–27. [Google Scholar] [CrossRef]
- D’Orazio, J.; Fisher, D.E. Central role for camp signaling in pigmentation and uv resistance. Cell Cycle 2011, 10, 8–9. [Google Scholar] [CrossRef] [PubMed]
- Bhat, B.; Singh, A.; Iqbal, Z.; Kaushik, J.K.; Rao, A.R.; Ahmad, S.M.; Bhat, H.; Ayaz, A.; Sheikh, F.D.; Kalra, S.; et al. Comparative transcriptome analysis reveals the genetic basis of coat color variation in pashmina goat. Sci. Rep. 2019, 9, 6361. [Google Scholar] [CrossRef] [PubMed]
- Sheinboim, D.; Maza, I.; Dror, I.; Parikh, S.; Krupalnik, V.; Bell, R.E.; Zviran, A.; Suita, Y.; Hakim, O.; Mandel-Gutfreund, Y.; et al. Oct4 impedes cell fate redirection by the melanocyte lineage master regulator mitf in mouse escs. Nat. Commun. 2017, 8, 1022. [Google Scholar] [CrossRef] [PubMed]
- Devi, S.; Kedlaya, R.; Maddodi, N.; Bhat, K.M.; Weber, C.S.; Valdivia, H.; Setaluri, V. Calcium homeostasis in human melanocytes: Role of transient receptor potential melastatin 1 (trpm1) and its regulation by ultraviolet light. Am. J. Physiol.-Cell Physiol. 2009, 297, C679–C687. [Google Scholar] [CrossRef] [PubMed]
- Toshihiko, H.; Hidenori, W.; Jacqueline, M.; Yuji, Y.; Vieira, W.D.; Hearing, V.J. Mart-1 is required for the function of the melanosomal matrix protein pmel17/gp100 and the maturation of melanosomes. J. Biol. Chem. 2005, 280, 14006–14016. [Google Scholar]
- Hellstrom, A.R.; Watt, B.; Fard, S.S.; Tenza, D.; Mannstrom, P.; Narfstrom, K.; Ekesten, B.; Ito, S.; Wakamatsu, K.; Larsson, J.; et al. Inactivation of pmel alters melanosome shape but has only a subtle effect on visible pigmentation. PLoS Genet. 2011, 7, e1002285. [Google Scholar] [CrossRef] [PubMed]
- Seberg, H.E.; Van Otterloo, E.; Loftus, S.K.; Liu, H.; Bonde, G.; Sompallae, R.; Gildea, D.E.; Santana, J.F.; Manak, J.R.; Pavan, W.J.; et al. Tfap2 paralogs regulate melanocyte differentiation in parallel with mitf. PLoS Genet. 2017, 13, e1006636. [Google Scholar] [CrossRef]
- Saldana-Caboverde, A.; Perera, E.M.; Watkins-Chow, D.E.; Hansen, N.F.; Vemulapalli, M.; Mullikin, J.C.; Program, N.C.S.; Pavan, W.J.; Kos, L. The transcription factors ets1 and sox10 interact during murine melanocyte development. Dev. Biol. 2015, 407, 300–312. [Google Scholar] [CrossRef]
- Kawakami, A.; Fisher, D.E. The master role of microphthalmia-associated transcription factor in melanocyte and melanoma biology. Lab. Investig. A J. Tech. Methods Pathol. 2017, 97, 649–656. [Google Scholar] [CrossRef]
- Schouwey, K.; Delmas, V.; Larue, L.; Zimber-Strobl, U.; Strobl, L.J.; Radtke, F.; Beermann, F. Notch1 and notch2 receptors influence progressive hair graying in a dose-dependent manner. Dev. Dyn. 2007, 236, 282–289. [Google Scholar] [CrossRef]
- Lindsay, C.R.; Lawn, S.; Campbell, A.D.; Faller, W.J.; Rambow, F.; Mort, R.L.; Timpson, P.; Li, A.; Cammareri, P.; Ridgway, R.A.; et al. P-rex1 is required for efficient melanoblast migration and melanoma metastasis. Nat. Commun. 2011, 2, 555. [Google Scholar] [CrossRef] [PubMed]
- Park, P.J.; Lee, T.R.; Cho, E.G. Substance p stimulates endothelin 1 secretion via endothelin-converting enzyme 1 and promotes melanogenesis in human melanocytes. J. Investig. Dermatol. 2015, 135, 551–559. [Google Scholar] [CrossRef] [PubMed]
- Kuroda, T.S.; Mitsunori, F. Functional analysis of slac2-c/myrip as a linker protein between melanosomes and myosin viia. J. Biol. Chem. 2005, 280, 28015–28022. [Google Scholar] [CrossRef] [PubMed]
- Pillaiyar, T.; Manickam, M.; Jung, S.H. Recent development of signaling pathways inhibitors of melanogenesis. Cell. Signal. 2017, 40, 99–115. [Google Scholar] [CrossRef] [PubMed]
- Takeo, M.; Lee, W.; Rabbani, P.; Sun, Q.; Hu, H.; Lim, C.H.; Manga, P.; Ito, M. Ednrb governs regenerative response of melanocyte stem cells by crosstalk with wnt signaling. Cell Rep. 2016, 15, 1291–1302. [Google Scholar] [CrossRef] [PubMed]
- Ren, J.; Mao, H.; Zhang, Z.; Xiao, S.; Ding, N.; Huang, L. A 6-bp deletion in the tyrp1 gene causes the brown colouration phenotype in chinese indigenous pigs. Heredity 2011, 106, 862–868. [Google Scholar] [CrossRef]
- Pielberg, G.; Olsson, C.; Syvanen, A.C.; Andersson, L. Unexpectedly high allelic diversity at the kit locus causing dominant white color in the domestic pig. Genetics 2002, 160, 305–311. [Google Scholar]
- Southard-Smith, E.M.; Kos, L.; Pavan, W.J. Sox10 mutation disrupts neural crest development in dom hirschsprung mouse model. Nat. Genet. 1998, 18, 60–64. [Google Scholar] [CrossRef]
- Liao, C.P.; Booker, R.C.; Morrison, S.J.; Le, L.Q. Identification of hair shaft progenitors that create a niche for hair pigmentation. Genes Dev. 2017, 31, 744–756. [Google Scholar] [CrossRef]
- Andersson, L.S.; Wilbe, M.; Viluma, A.; Cothran, G.; Ekesten, B.; Ewart, S.; Lindgren, G. Equine multiple congenital ocular anomalies and silver coat colour result from the pleiotropic effects of mutant pmel. PLoS ONE 2013, 8, e75639. [Google Scholar] [CrossRef]
- Irvine, A.D.; McKenna, K.E.; Jenkinson, H.; Hughes, A.E. A mutation in the v1 domain of keratin 5 causes epidermolysis bullosa simplex with mottled pigmentation. J. Investig. Dermatol. 1997, 108, 809–810. [Google Scholar] [CrossRef] [PubMed][Green Version]
- Geller, L.; Kristal, L.; Morel, K.D. Epidermolysis bullosa simplex with mottled pigmentation due to a rare keratin 5 mutation: Cutaneous findings in infancy. Pediatr. Dermatol. 2013, 30, 631–632. [Google Scholar] [CrossRef] [PubMed]
- Lo Cicero, A.; Delevoye, C.; Gilles-Marsens, F.; Loew, D.; Dingli, F.; Guere, C.; Andre, N.; Vie, K.; van Niel, G.; Raposo, G. Exosomes released by keratinocytes modulate melanocyte pigmentation. Nat. Commun. 2015, 6, 7506. [Google Scholar] [CrossRef] [PubMed]
- Ryu, J.; Galan, A.K.; Xin, X.; Dong, F.; Abdul-Ghani, M.A.; Zhou, L.; Wang, C.; Li, C.; Holmes, B.M.; Sloane, L.B.; et al. Appl1 potentiates insulin sensitivity by facilitating the binding of irs1/2 to the insulin receptor. Cell Rep. 2014, 7, 1227–1238. [Google Scholar] [CrossRef]
- De Launoit, Y.; Adamski, J. Unique multifunctional hsd17b4 gene product: 17beta-hydroxysteroid dehydrogenase 4 and d-3-hydroxyacyl-coenzyme a dehydrogenase/hydratase involved in zellweger syndrome. J. Mol. Endocrinol. 1999, 22, 227–240. [Google Scholar] [CrossRef]
- Fujita, Y.; Koinuma, S.; De Velasco, M.A.; Bolz, J.; Togashi, Y.; Terashima, M.; Hayashi, H.; Matsuo, T.; Nishio, K. Melanoma transition is frequently accompanied by a loss of cytoglobin expression in melanocytes: A novel expression site of cytoglobin. PLoS ONE 2014, 9, e94772. [Google Scholar] [CrossRef]
- Fagerberg, L.; Hallström, B.M.; Oksvold, P.; Kampf, C.; Djureinovic, D.; Odeberg, J.; Habuka, M.; Tahmasebpoor, S.; Danielsson, A.; Edlund, K. Analysis of the human tissue-specific expression by genome-wide integration of transcriptomics and antibody-based proteomics. Mol. Cell. Proteom. 2014, 13, 397–406. [Google Scholar] [CrossRef]
- Lee, Y.; Hwang, K. Skin thickness of korean adults. Surg. Radiol. Anat. 2002, 24, 183–189. [Google Scholar]
- Wilhelm, K.P.; Cua, A.B.; Maibach, H.I. Skin aging. Effect on transepidermal water loss, stratum corneum hydration, skin surface ph, and casual sebum content. Arch. Dermatol. 1991, 127, 1806–1809. [Google Scholar] [CrossRef]
- Ghahary, A.; Ghaffari, A. Role of keratinocyte-fibroblast cross-talk in development of hypertrophic scar. Wound Repair Regen. 2007, 15 (Suppl. 1), S46–S53. [Google Scholar] [CrossRef]
- Rennekampff, H.O.; Busche, M.N.; Knobloch, K.; Tenenhaus, M. Is uv radiation beneficial in postburn wound healing? Med. Hypotheses 2010, 75, 436–438. [Google Scholar] [CrossRef] [PubMed]
- Gao, F.L.; Jin, R.; Zhang, L.; Zhang, Y.G. The contribution of melanocytes to pathological scar formation during wound healing. Int. J. Clin. Exp. Med. 2013, 6, 609–613. [Google Scholar] [PubMed]
- Gallant-Behm, C.L.; Tsao, H.; Reno, C.; Olson, M.E.; Hart, D.A. Skin wound healing in the first generation (f1) offspring of yorkshire and red duroc pigs: Evidence for genetic inheritance of wound phenotype. Burn. J. Int. Soc. Burn Inj. 2006, 32, 180–193. [Google Scholar] [CrossRef] [PubMed]
- Johansson Moller, M.; Chaudhary, R.; Hellmen, E.; Hoyheim, B.; Chowdhary, B.; Andersson, L. Pigs with the dominant white coat color phenotype carry a duplication of the kit gene encoding the mast/stem cell growth factor receptor. Mamm. Genome 1996, 7, 822–830. [Google Scholar] [CrossRef]
- Gallant-Behm, C.L.; Hart, D.A. Genetic analysis of skin wound healing and scarring in a porcine model. Wound Repair Regen. 2006, 14, 46–54. [Google Scholar] [CrossRef]
- Ren, H.; Wang, G.; Chen, L.; Jiang, J.; Liu, L.; Li, N.; Zhao, J.; Sun, X.; Zhou, P. Genome-wide analysis of long non-coding rnas at early stage of skin pigmentation in goats (capra hircus). BMC Genom. 2016, 17, 67. [Google Scholar] [CrossRef]
- Ji, K.; Fan, R.; Zhang, J.; Yang, S.; Dong, C. Long non-coding rna expression profile in cdk5-knockdown mouse skin. Gene 2018, 672, 195–201. [Google Scholar] [CrossRef]
- Li, C.X.; Li, H.G.; Huang, L.T.; Kong, Y.W.; Chen, F.Y.; Liang, J.Y.; Yu, H.; Yao, Z.R. H19 lncrna regulates keratinocyte differentiation by targeting mir-130b-3p. Cell Death Dis. 2017, 8, e3174. [Google Scholar] [CrossRef]


© 2019 by the authors. Licensee MDPI, Basel, Switzerland. This article is an open access article distributed under the terms and conditions of the Creative Commons Attribution (CC BY) license (http://creativecommons.org/licenses/by/4.0/).