Figure 1.
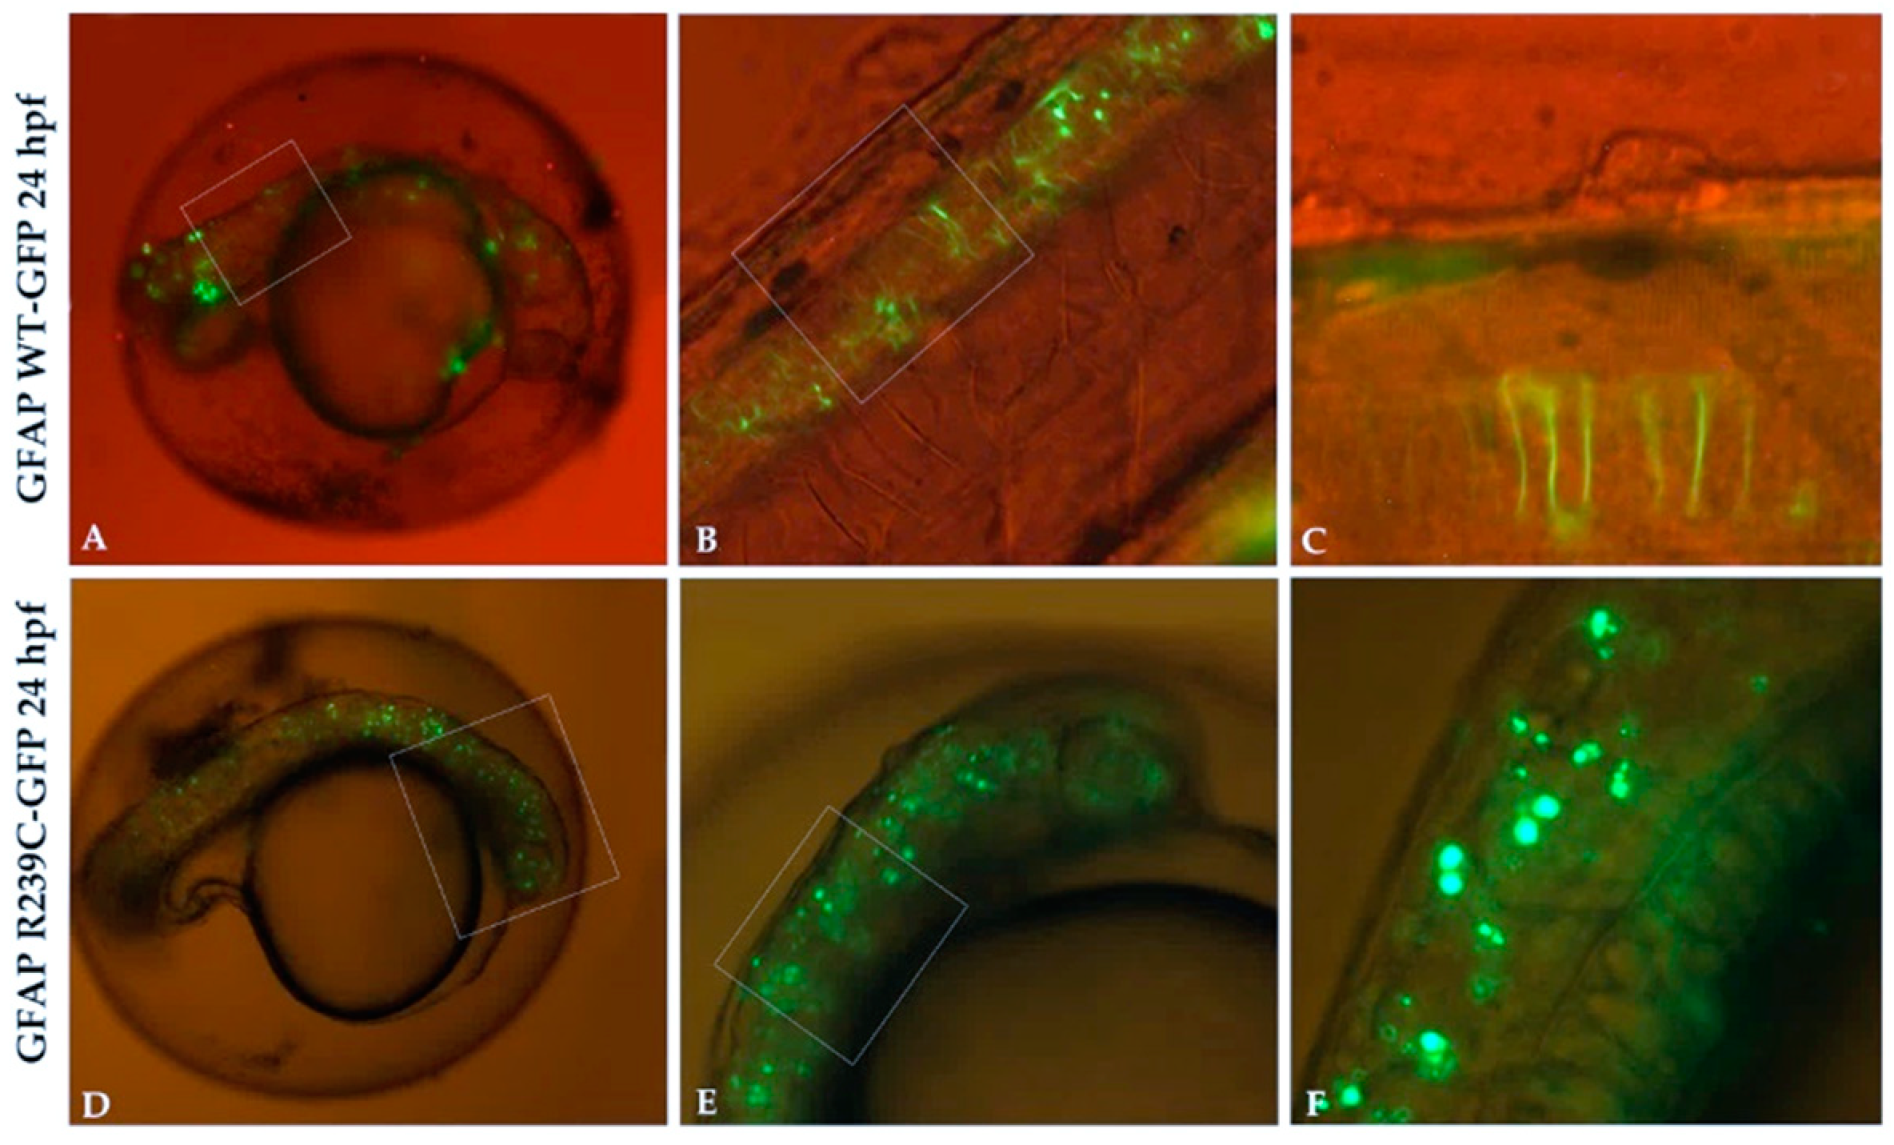
GFP expression in transgenic glial fibrillary acid protein (GFAP) wildtype (WT) and GFAP R239C embryos. (A,B) The expression of GFAP WT-GFP protein is visible along the neural tube, with very few GFAP aggregates observed. (C) High magnification of embryo in (B) shows GFAP WT protein as filamentous structures. (D–F) Several aggregates of p.R239C in the brain and along the neural tube are found. Magnification: 4× (A,D); 10× (B,E); 20× (C,F). High magnification are shown by rectangular shape.
Figure 1.
GFP expression in transgenic glial fibrillary acid protein (GFAP) wildtype (WT) and GFAP R239C embryos. (A,B) The expression of GFAP WT-GFP protein is visible along the neural tube, with very few GFAP aggregates observed. (C) High magnification of embryo in (B) shows GFAP WT protein as filamentous structures. (D–F) Several aggregates of p.R239C in the brain and along the neural tube are found. Magnification: 4× (A,D); 10× (B,E); 20× (C,F). High magnification are shown by rectangular shape.
Figure 2.
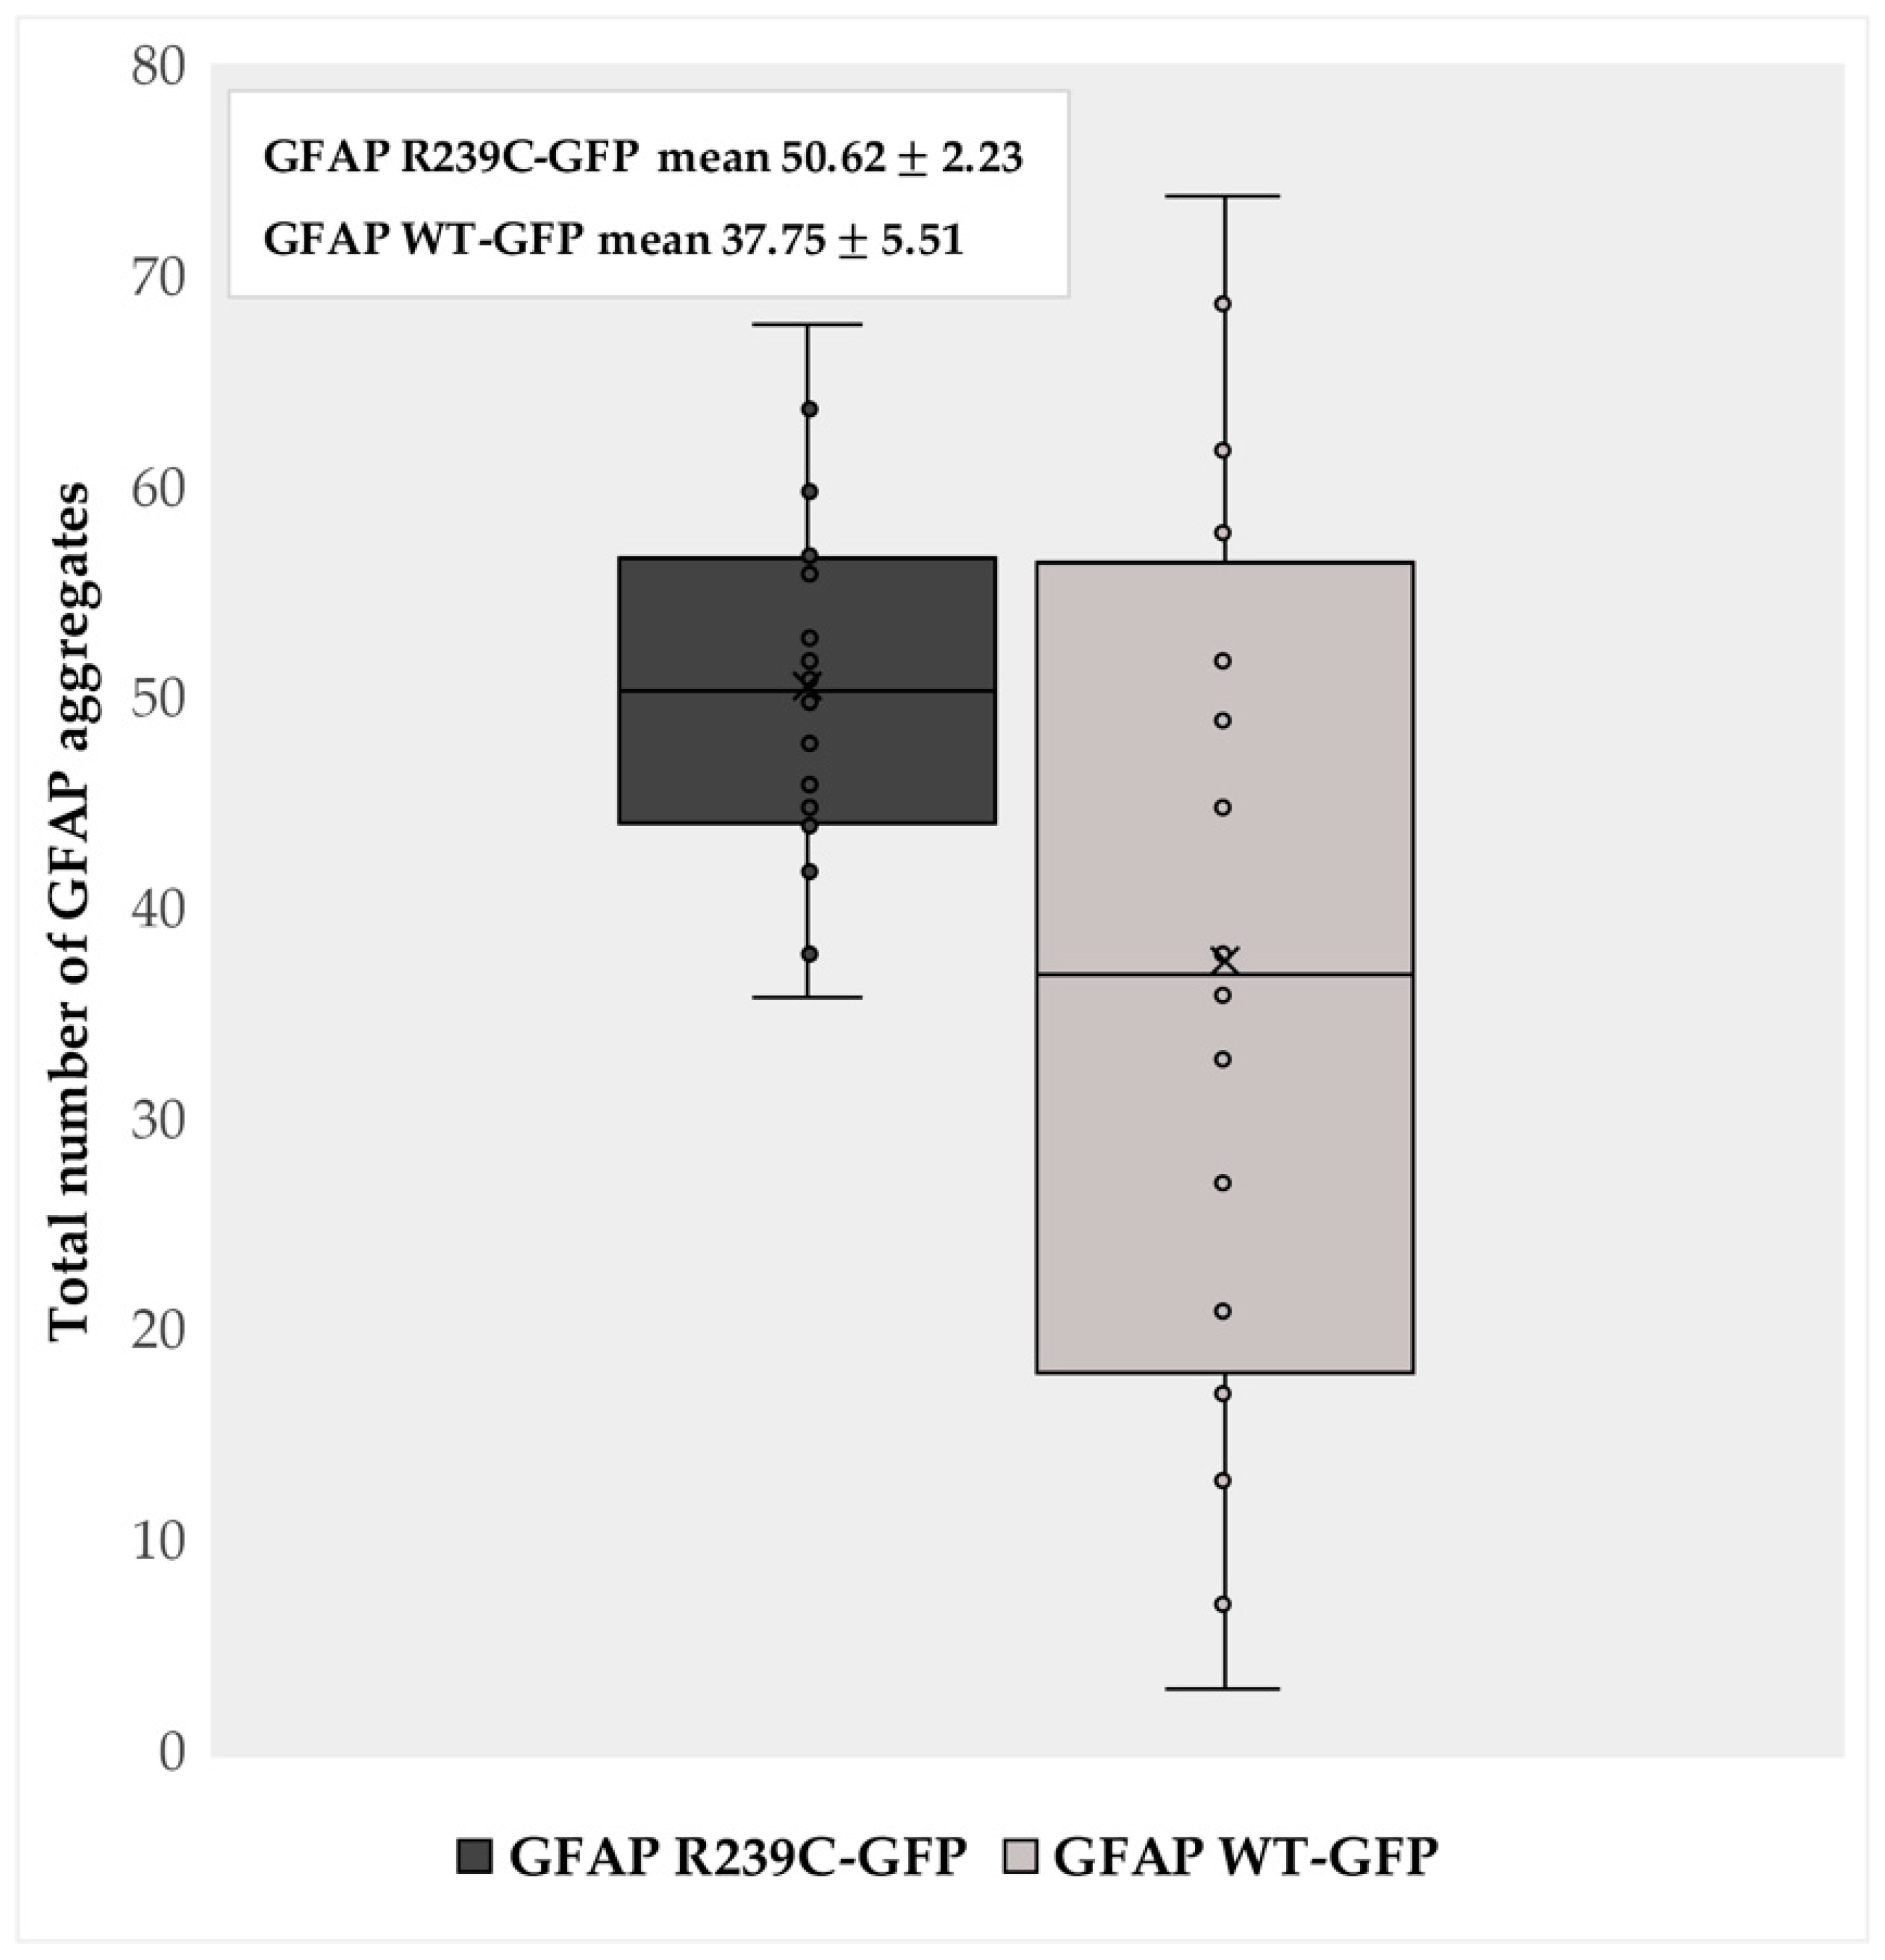
Aggregate quantification. The box plot represents the number of aggregates detected in 16 GFAP R239C-GFP embryos and in 16 GFAP WT-GFP embryos at 24 h post fertilization (hpf). The “x” indicates the average values of 50.62 and 37.75 aggregates in p.R239C and wildtype embryos, with a standard error of the mean (SEM) of ±2.23 and ±5.51, respectively. The count of the aggregates was made using ImageJ software 1.52q.
Figure 2.
Aggregate quantification. The box plot represents the number of aggregates detected in 16 GFAP R239C-GFP embryos and in 16 GFAP WT-GFP embryos at 24 h post fertilization (hpf). The “x” indicates the average values of 50.62 and 37.75 aggregates in p.R239C and wildtype embryos, with a standard error of the mean (SEM) of ±2.23 and ±5.51, respectively. The count of the aggregates was made using ImageJ software 1.52q.
Figure 3.
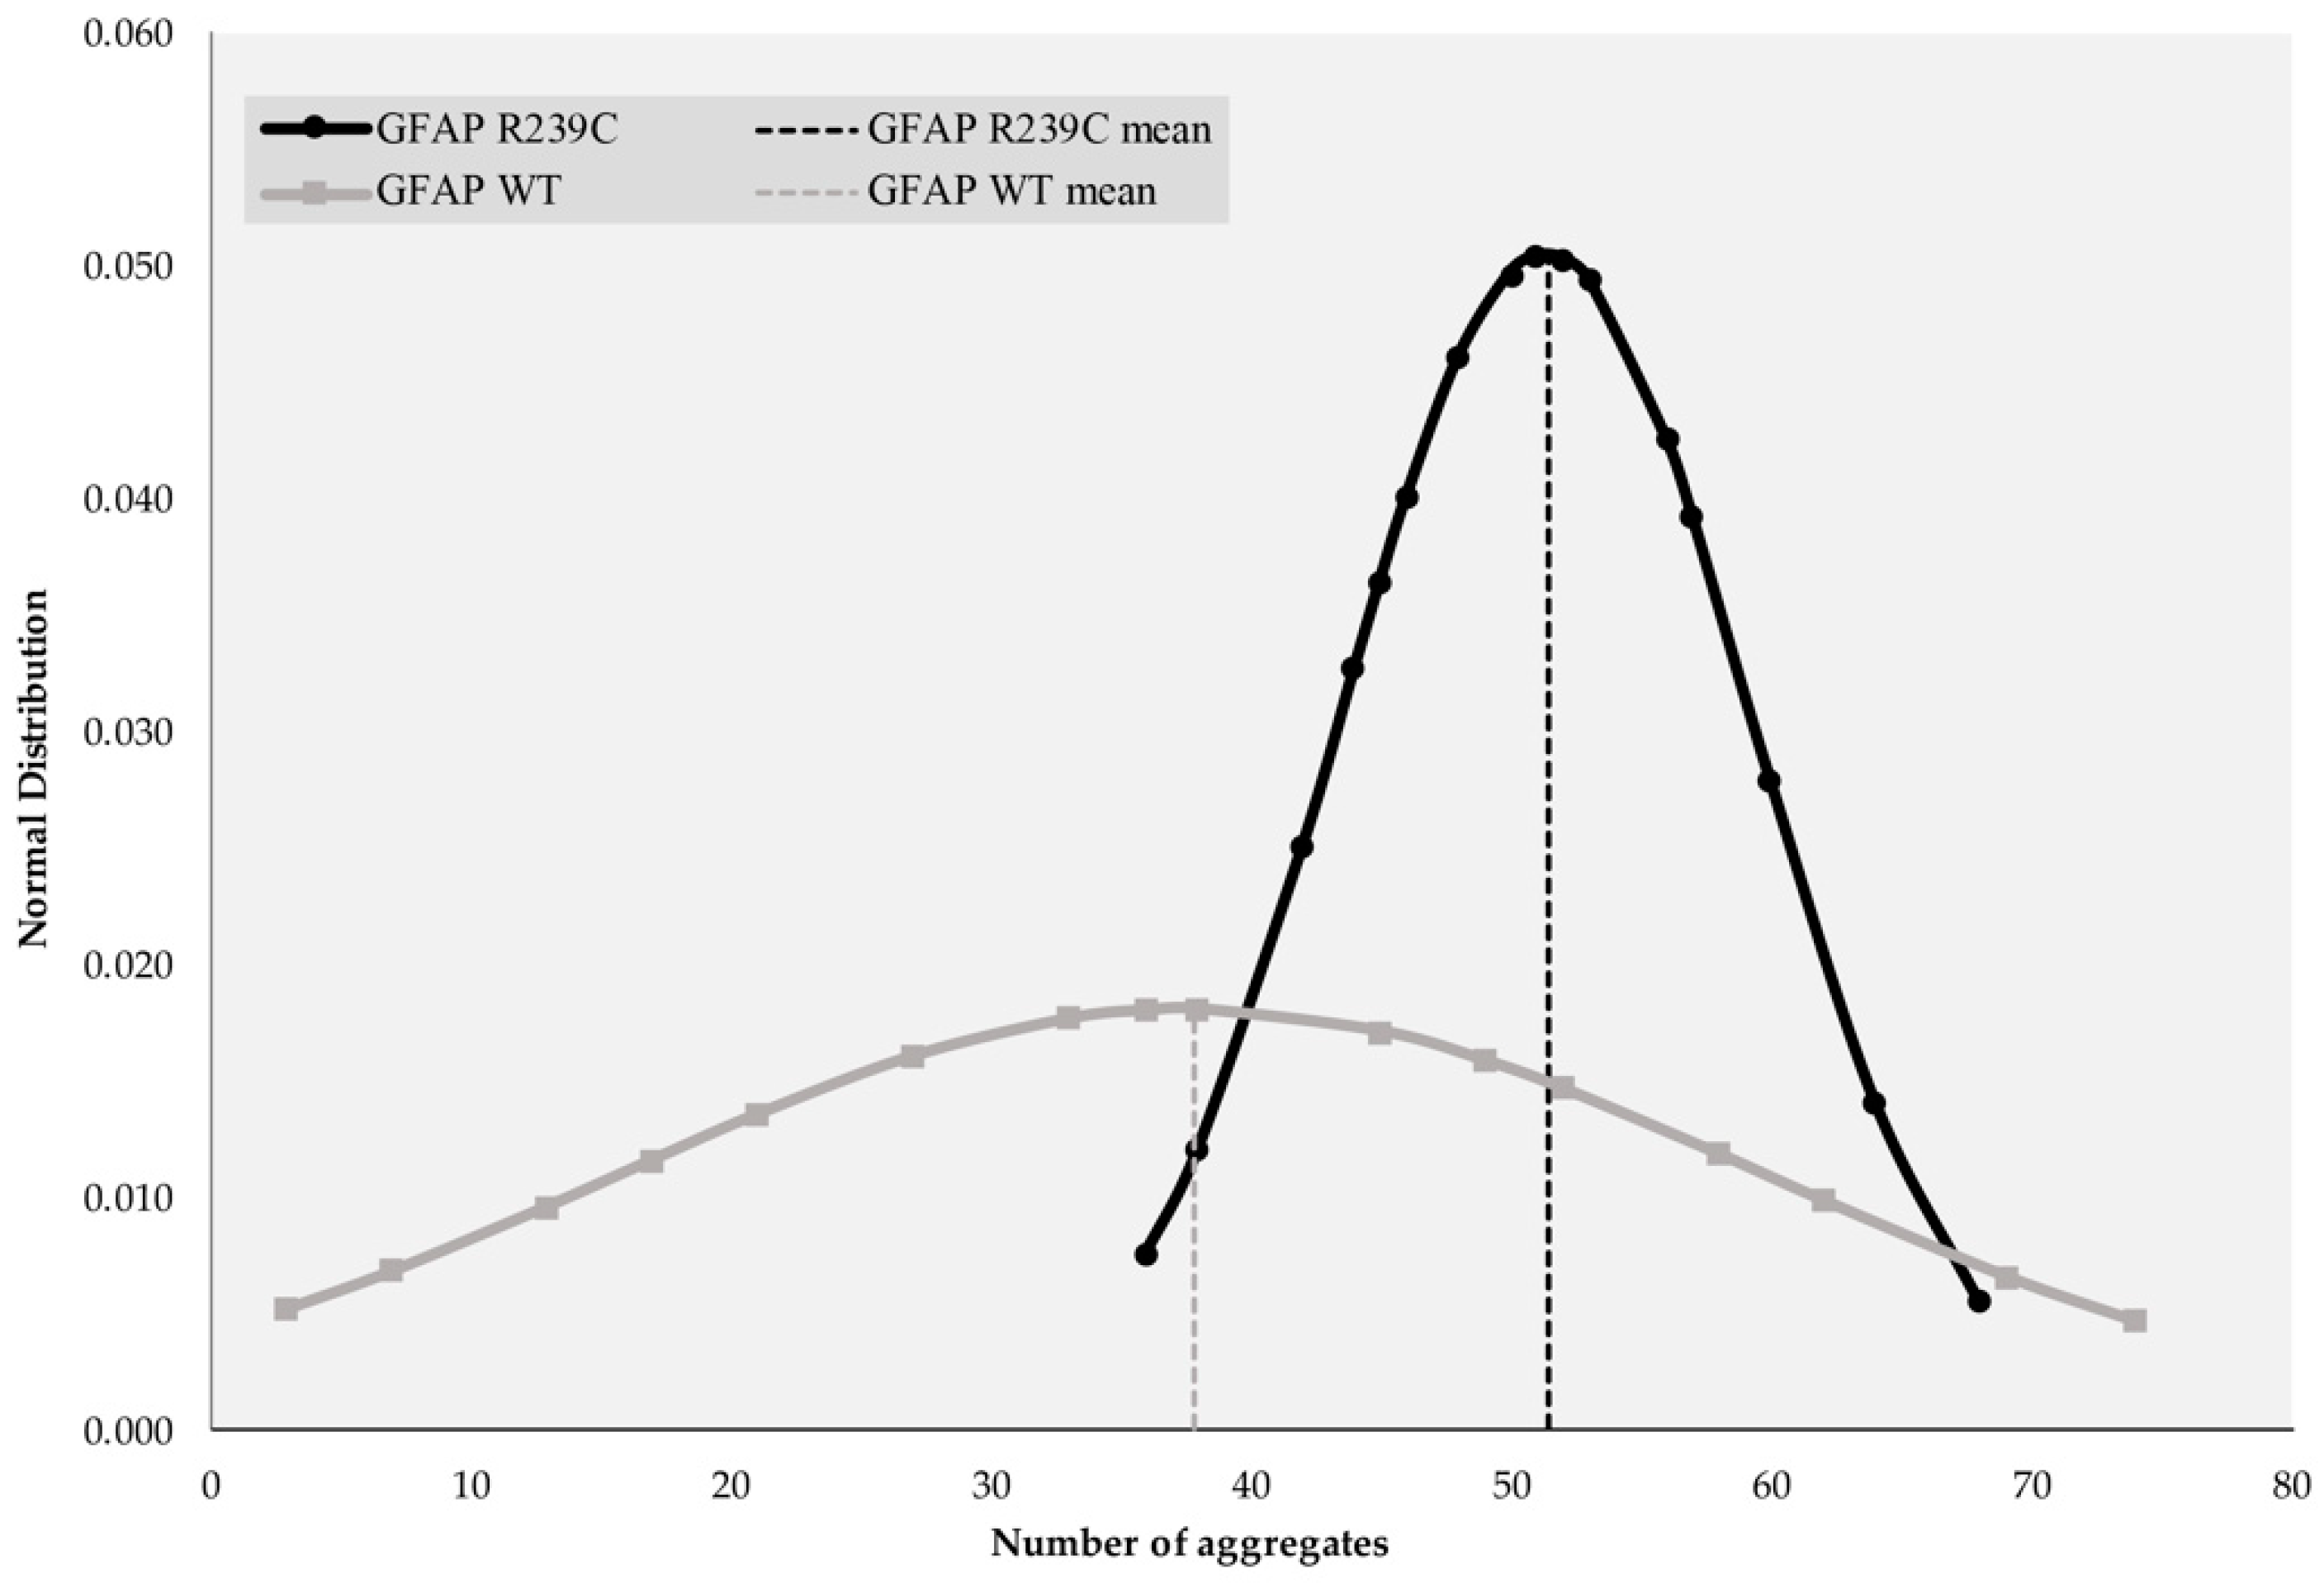
Gaussian distribution of GFAP R239C-GFP and GFAP WT-GFP aggregates. The number of aggregates and normal distribution are reported on the abscissa and ordinate axes, respectively. A p-value of 0.038 was found and standard deviations of ±8.65 and ±22.04 were obtained for GFAP R239C-GFP and GFAP WT-GFP, respectively. Regarding quantification, a mean of 50.62 aggregates was found for GFAP R239C-GFP embryos, while a mean value of 37.75 aggregates was established for GFAP WT-GFP ones. For GFAP R239C-GFP and GFAP WT-GFP embryos, medians of 50.5 and 37 were found.
Figure 3.
Gaussian distribution of GFAP R239C-GFP and GFAP WT-GFP aggregates. The number of aggregates and normal distribution are reported on the abscissa and ordinate axes, respectively. A p-value of 0.038 was found and standard deviations of ±8.65 and ±22.04 were obtained for GFAP R239C-GFP and GFAP WT-GFP, respectively. Regarding quantification, a mean of 50.62 aggregates was found for GFAP R239C-GFP embryos, while a mean value of 37.75 aggregates was established for GFAP WT-GFP ones. For GFAP R239C-GFP and GFAP WT-GFP embryos, medians of 50.5 and 37 were found.
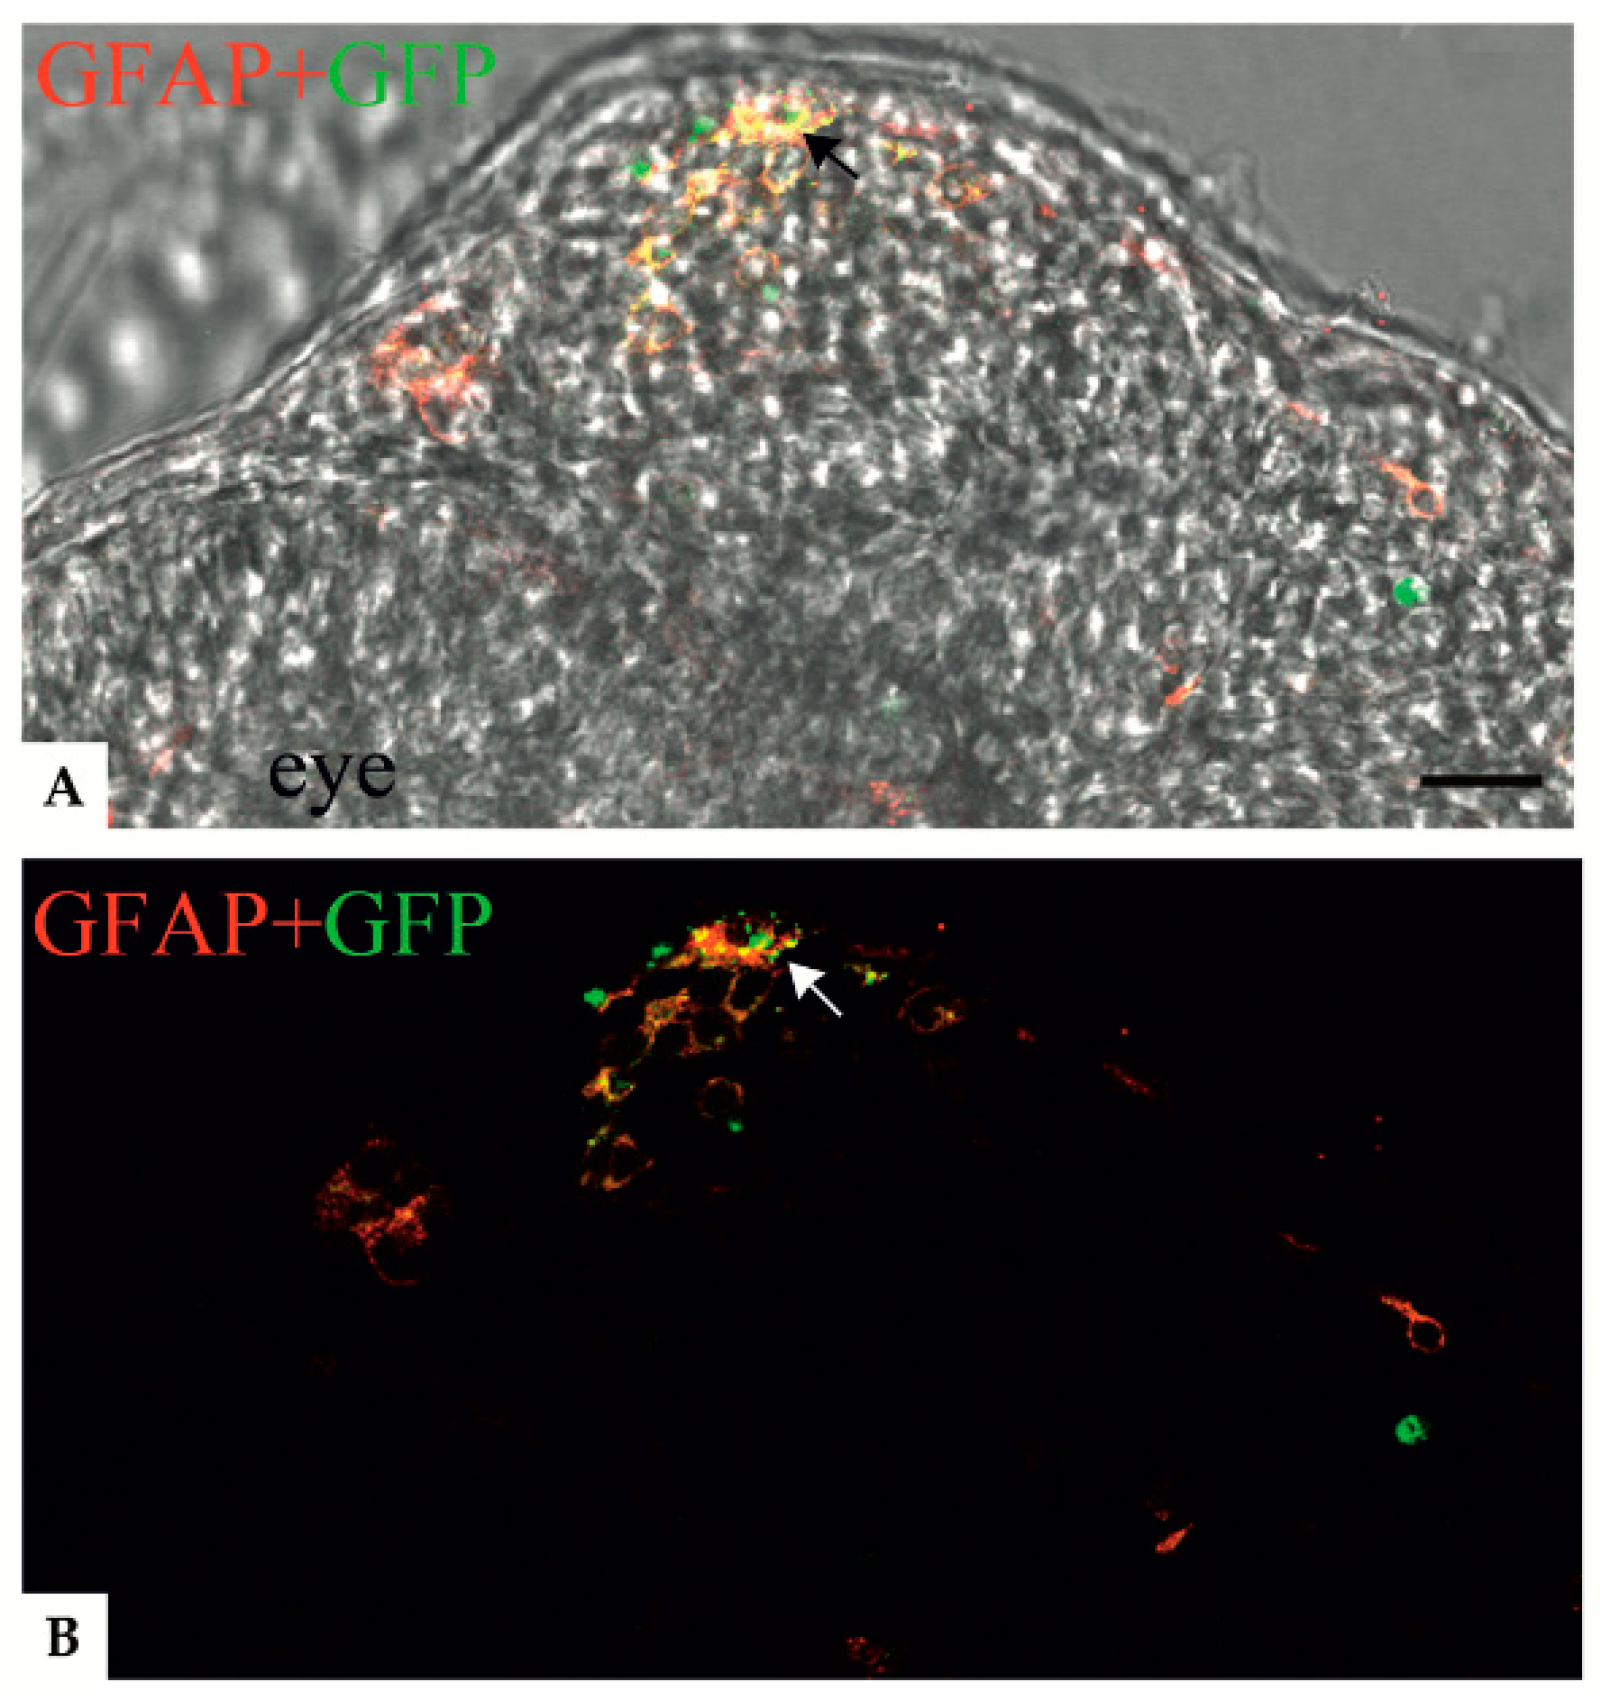
Figure 4.
Confocal images showing colocalization between anti-GFAP signal and the GFAP R239C-GFP aggregates in zebrafish transverse sections of 24 hpf embryos. (A,B) Confocal images showing p.R239C aggregates (green) labeled by anti-GFAP antibody (red). A clear colocalization (yellow) (black and white arrows respectively in A and B) is visible in most of the cells containing green aggregates. (A) Confocal image imposed on a brightfield image of the same region. Scale bar: (A,B) 30 μm.
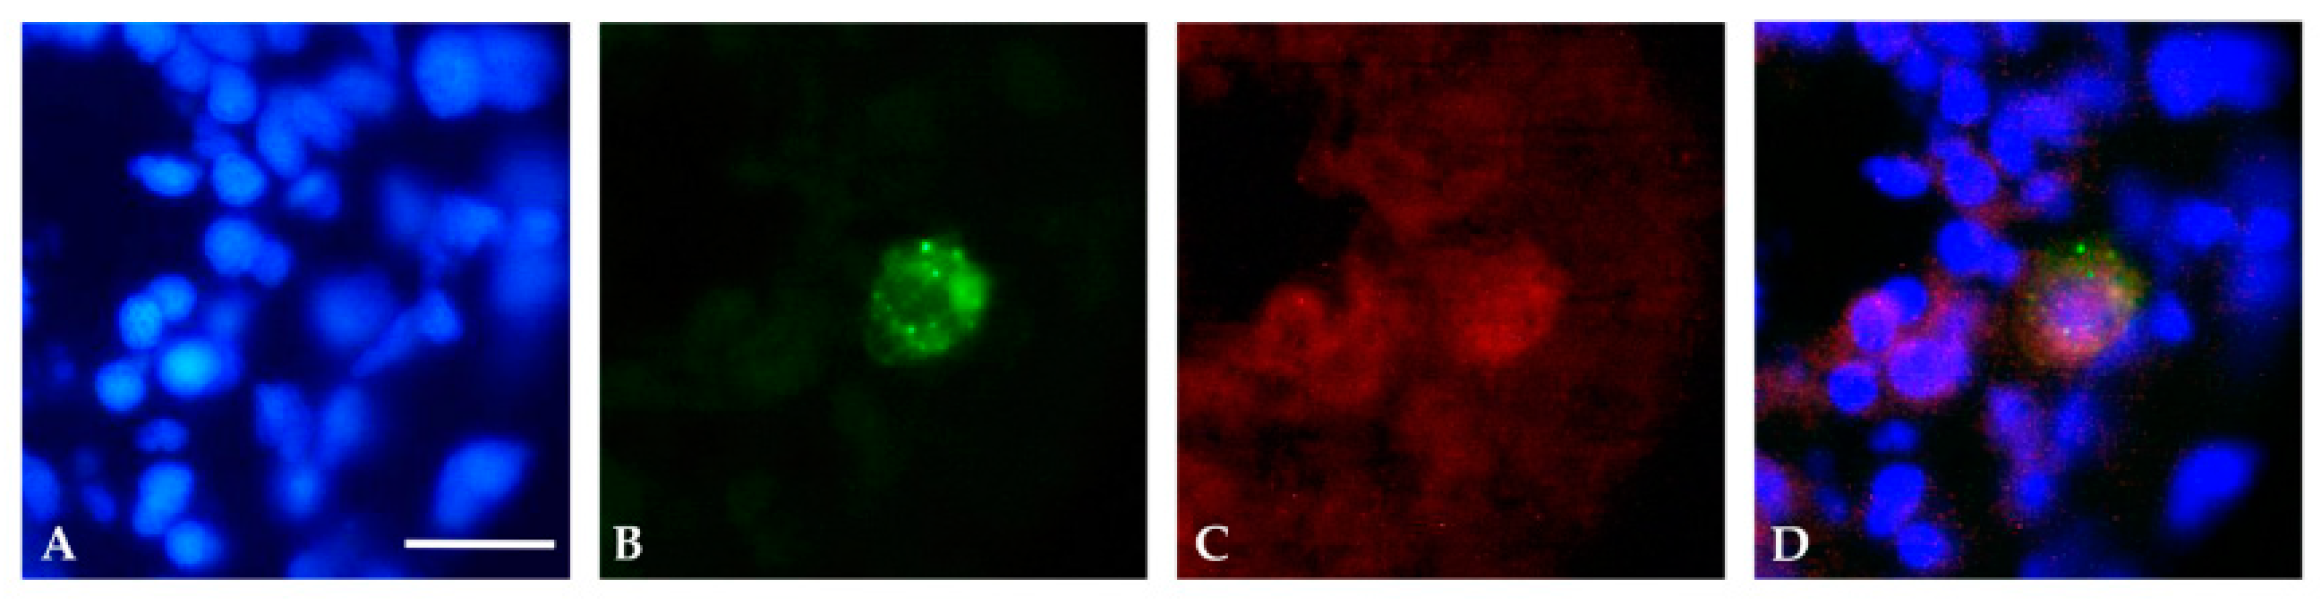
Figure 5.
Immunofluorescence analysis of transverse sections of a 24 hpf embryo. (A) Nuclei were detected with Hoechst (blue). (B) p.R239C expression (GFP-green), (C) identified by anti-human GFAP antibody (red). (D) Representation of the overlap of the three images. Scale bar (A–D): 20 μm.
Figure 5.
Immunofluorescence analysis of transverse sections of a 24 hpf embryo. (A) Nuclei were detected with Hoechst (blue). (B) p.R239C expression (GFP-green), (C) identified by anti-human GFAP antibody (red). (D) Representation of the overlap of the three images. Scale bar (A–D): 20 μm.
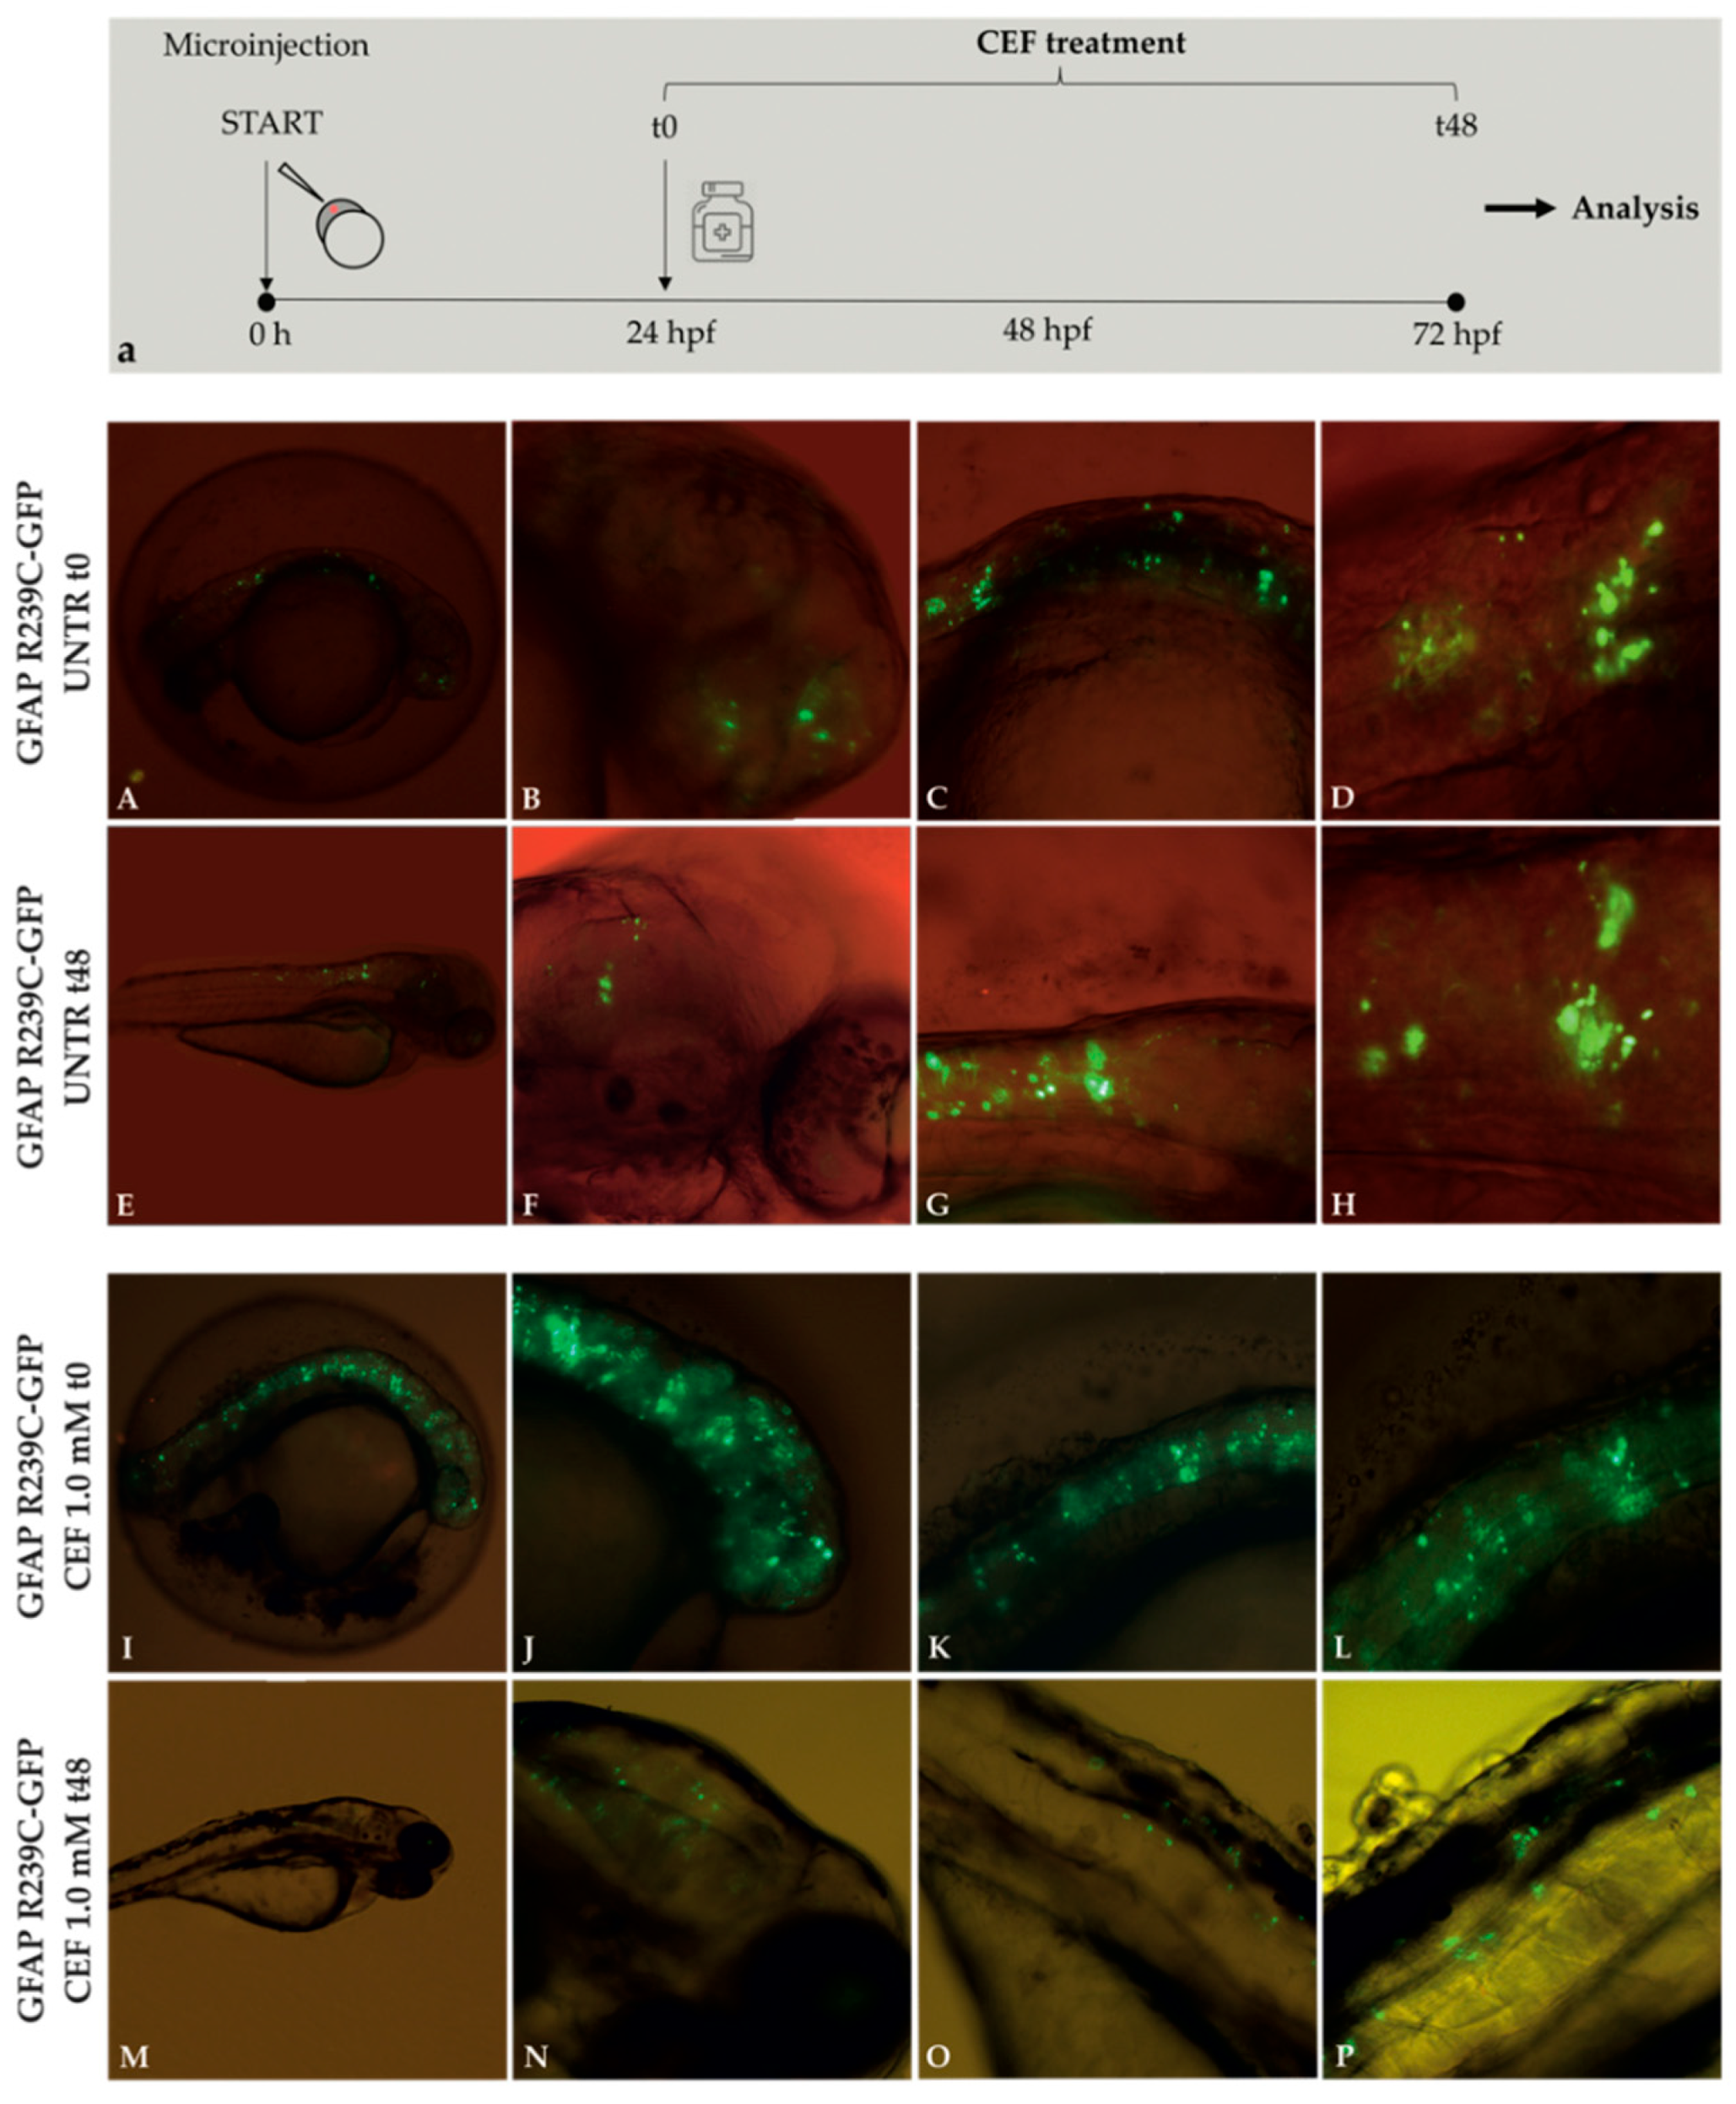
Figure 6.
Experimental plan showing the timeline of ceftriaxone (CEF) treatments and the effects of 48 h CEF 1.0 mM treatment on embryos expressing GFAP R239C-GFP. (a). The antibiotic ceftriaxone was added 24 h after eggs microinjection. This moment was defined as “time zero” (t0). Fluorescence microscope analysis. Aggregates in untreated (UNTR) embryos are shown in figure (A–D) at 24 hpf (t0) and from (E–H) at 72 hpf (t48), corresponding to the start and end points of CEF treatment. Figure (I–L) show aggregates at 24 hpf (t0), while figure (M–P) show aggregates at 72 hpf (t48), after 48 h of treatment with CEF 1.0 mM. Magnification: 4× (A,E,I,M); 10× (B,C,F,G,J, K,N,O); 20× (D,H,L,P).
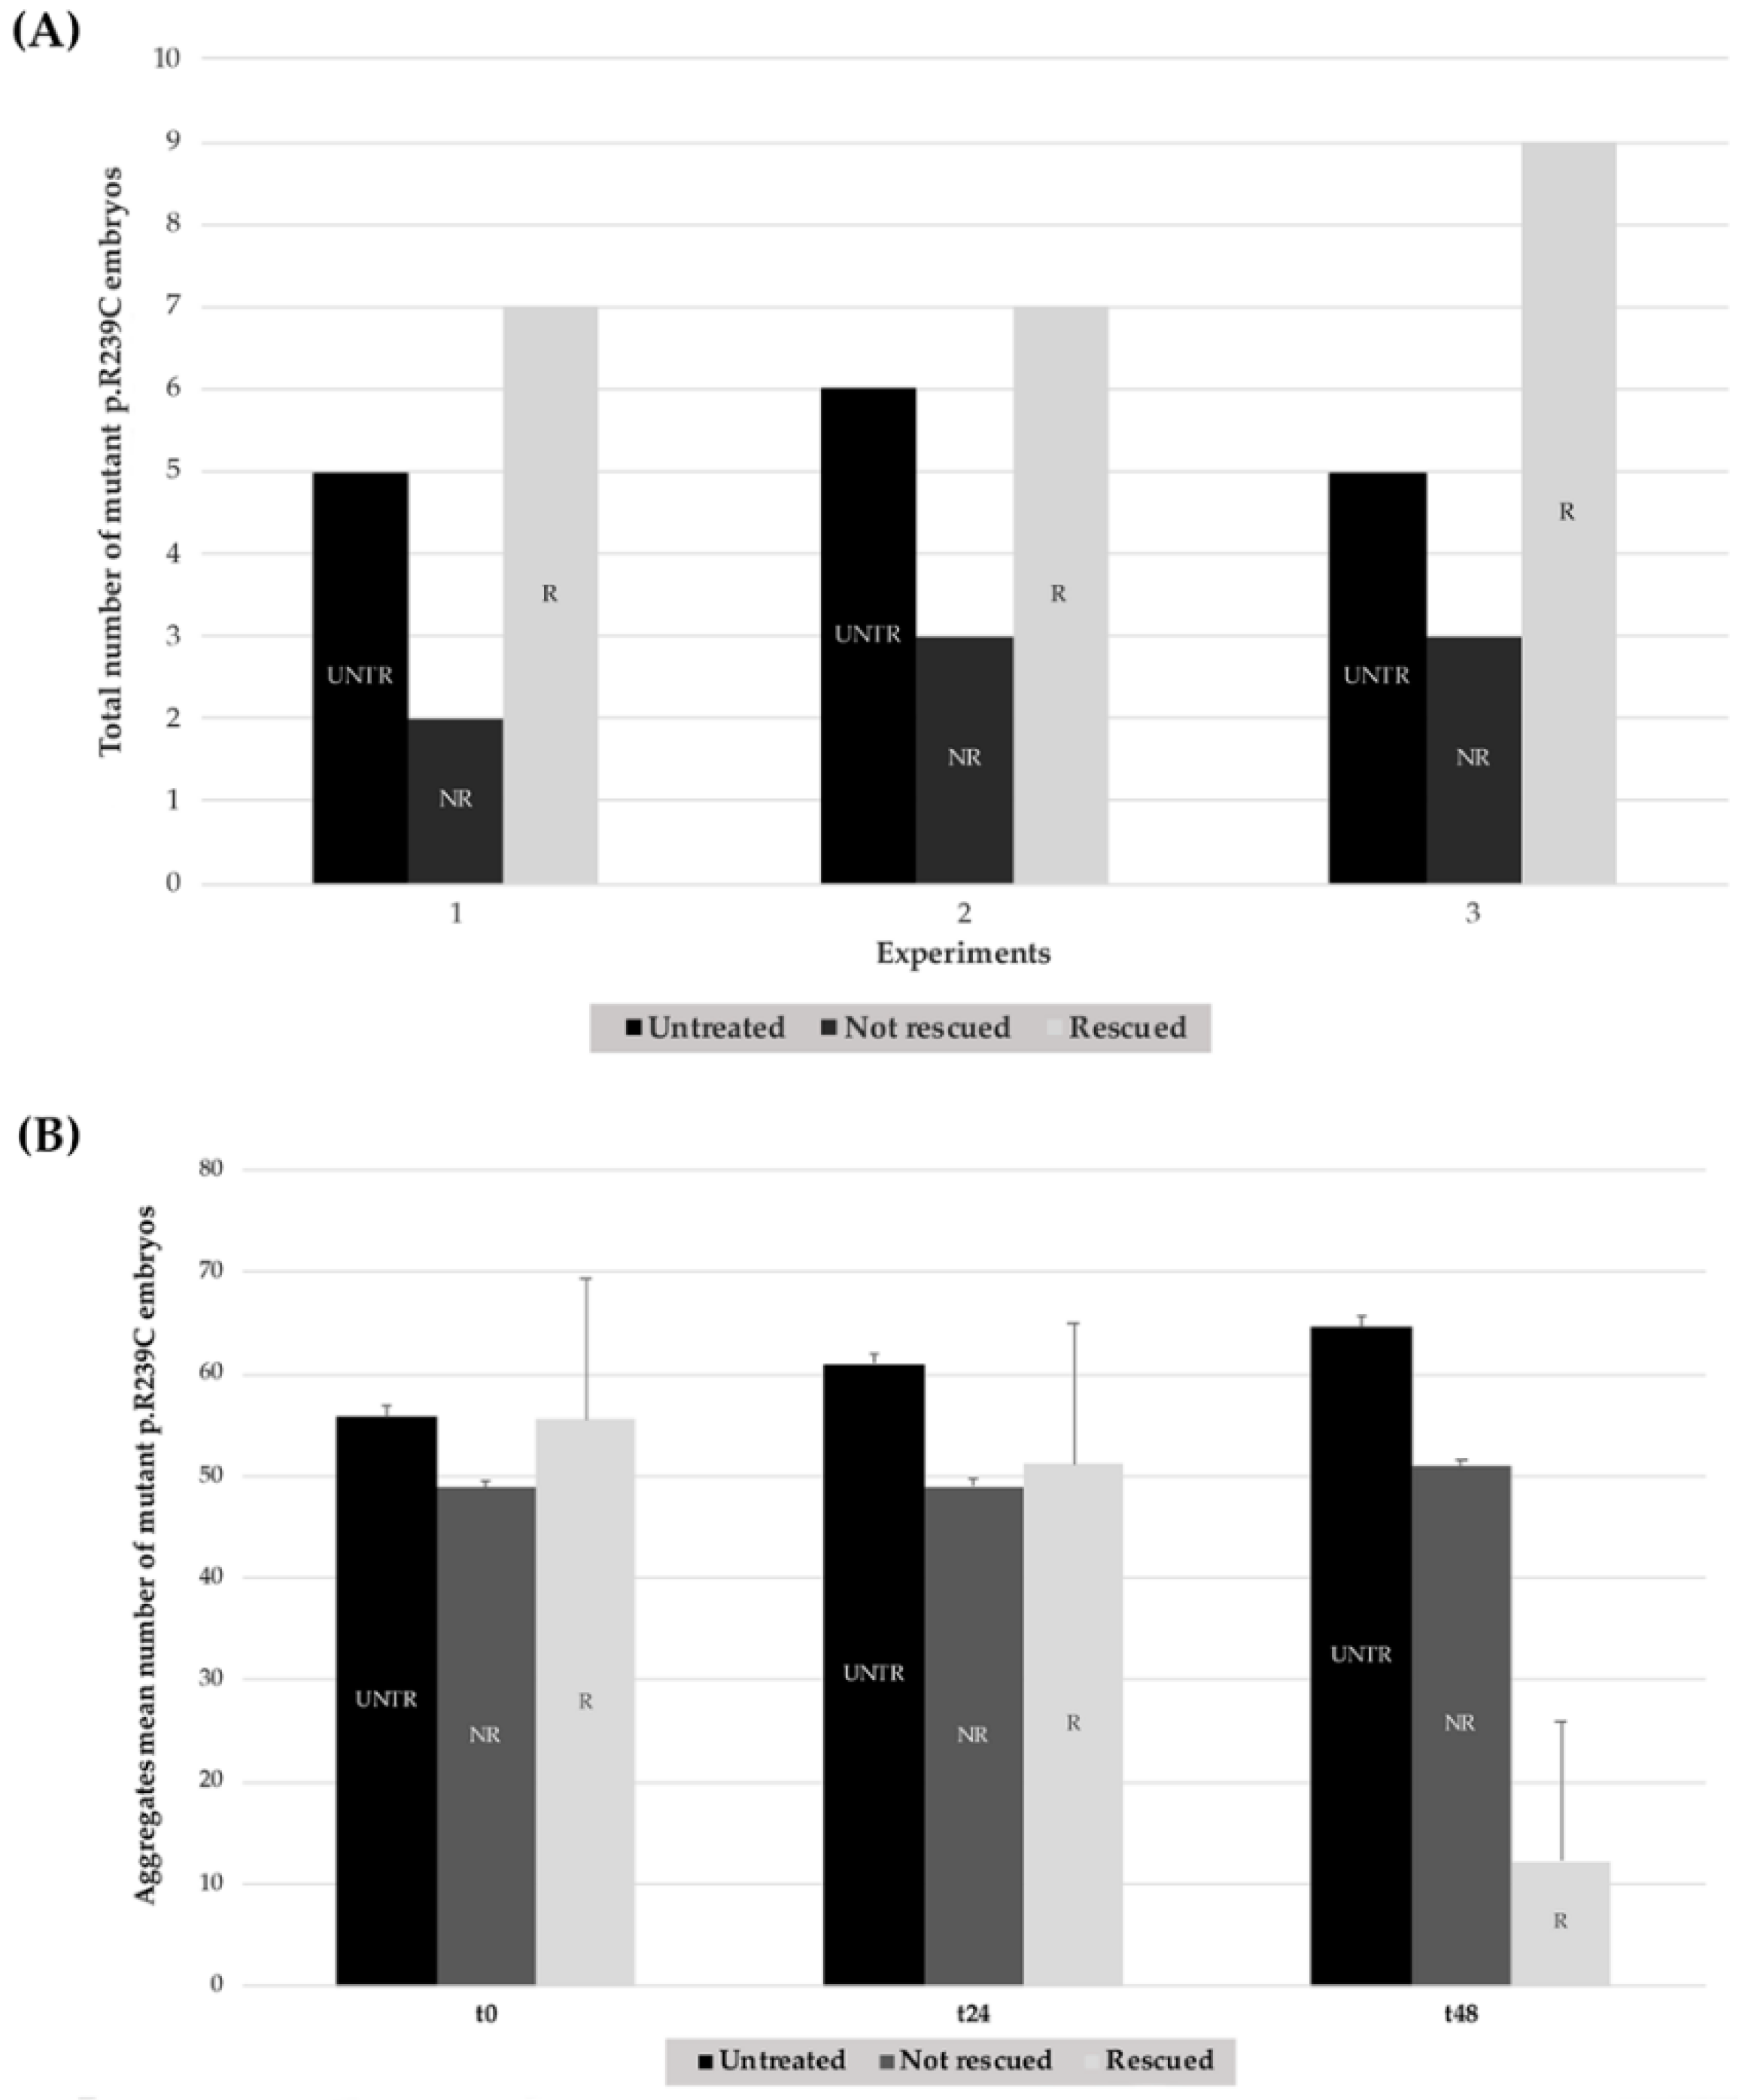
Figure 7.
Effects of treatments with CEF 1.0 mM on mutant GFAP R239C-GFP-injected embryos in three explicative experiments. (A) In each histogram, the black column represents the number of untreated embryos (UNTR) compared to the not rescued in the dark-gray column (NR), not showing effects in terms of aggregate reduction, and the rescued (R) ones, in the light-gray column, which responded to pharmacological treatment with consequent aggregate reduction. For “R” embryos, a paired t-test two-tailed p-value of 0.0075 was determined. (B) The mean number of aggregates is reported for untreated, not rescued, and rescued embryos at t0, t24, and after 48 h (t48). For “R” embryos, a paired t-test two-tailed p-value of 0.0019 was achieved. (UNTR: untreated R: rescued, NR: not rescued).
Figure 8.
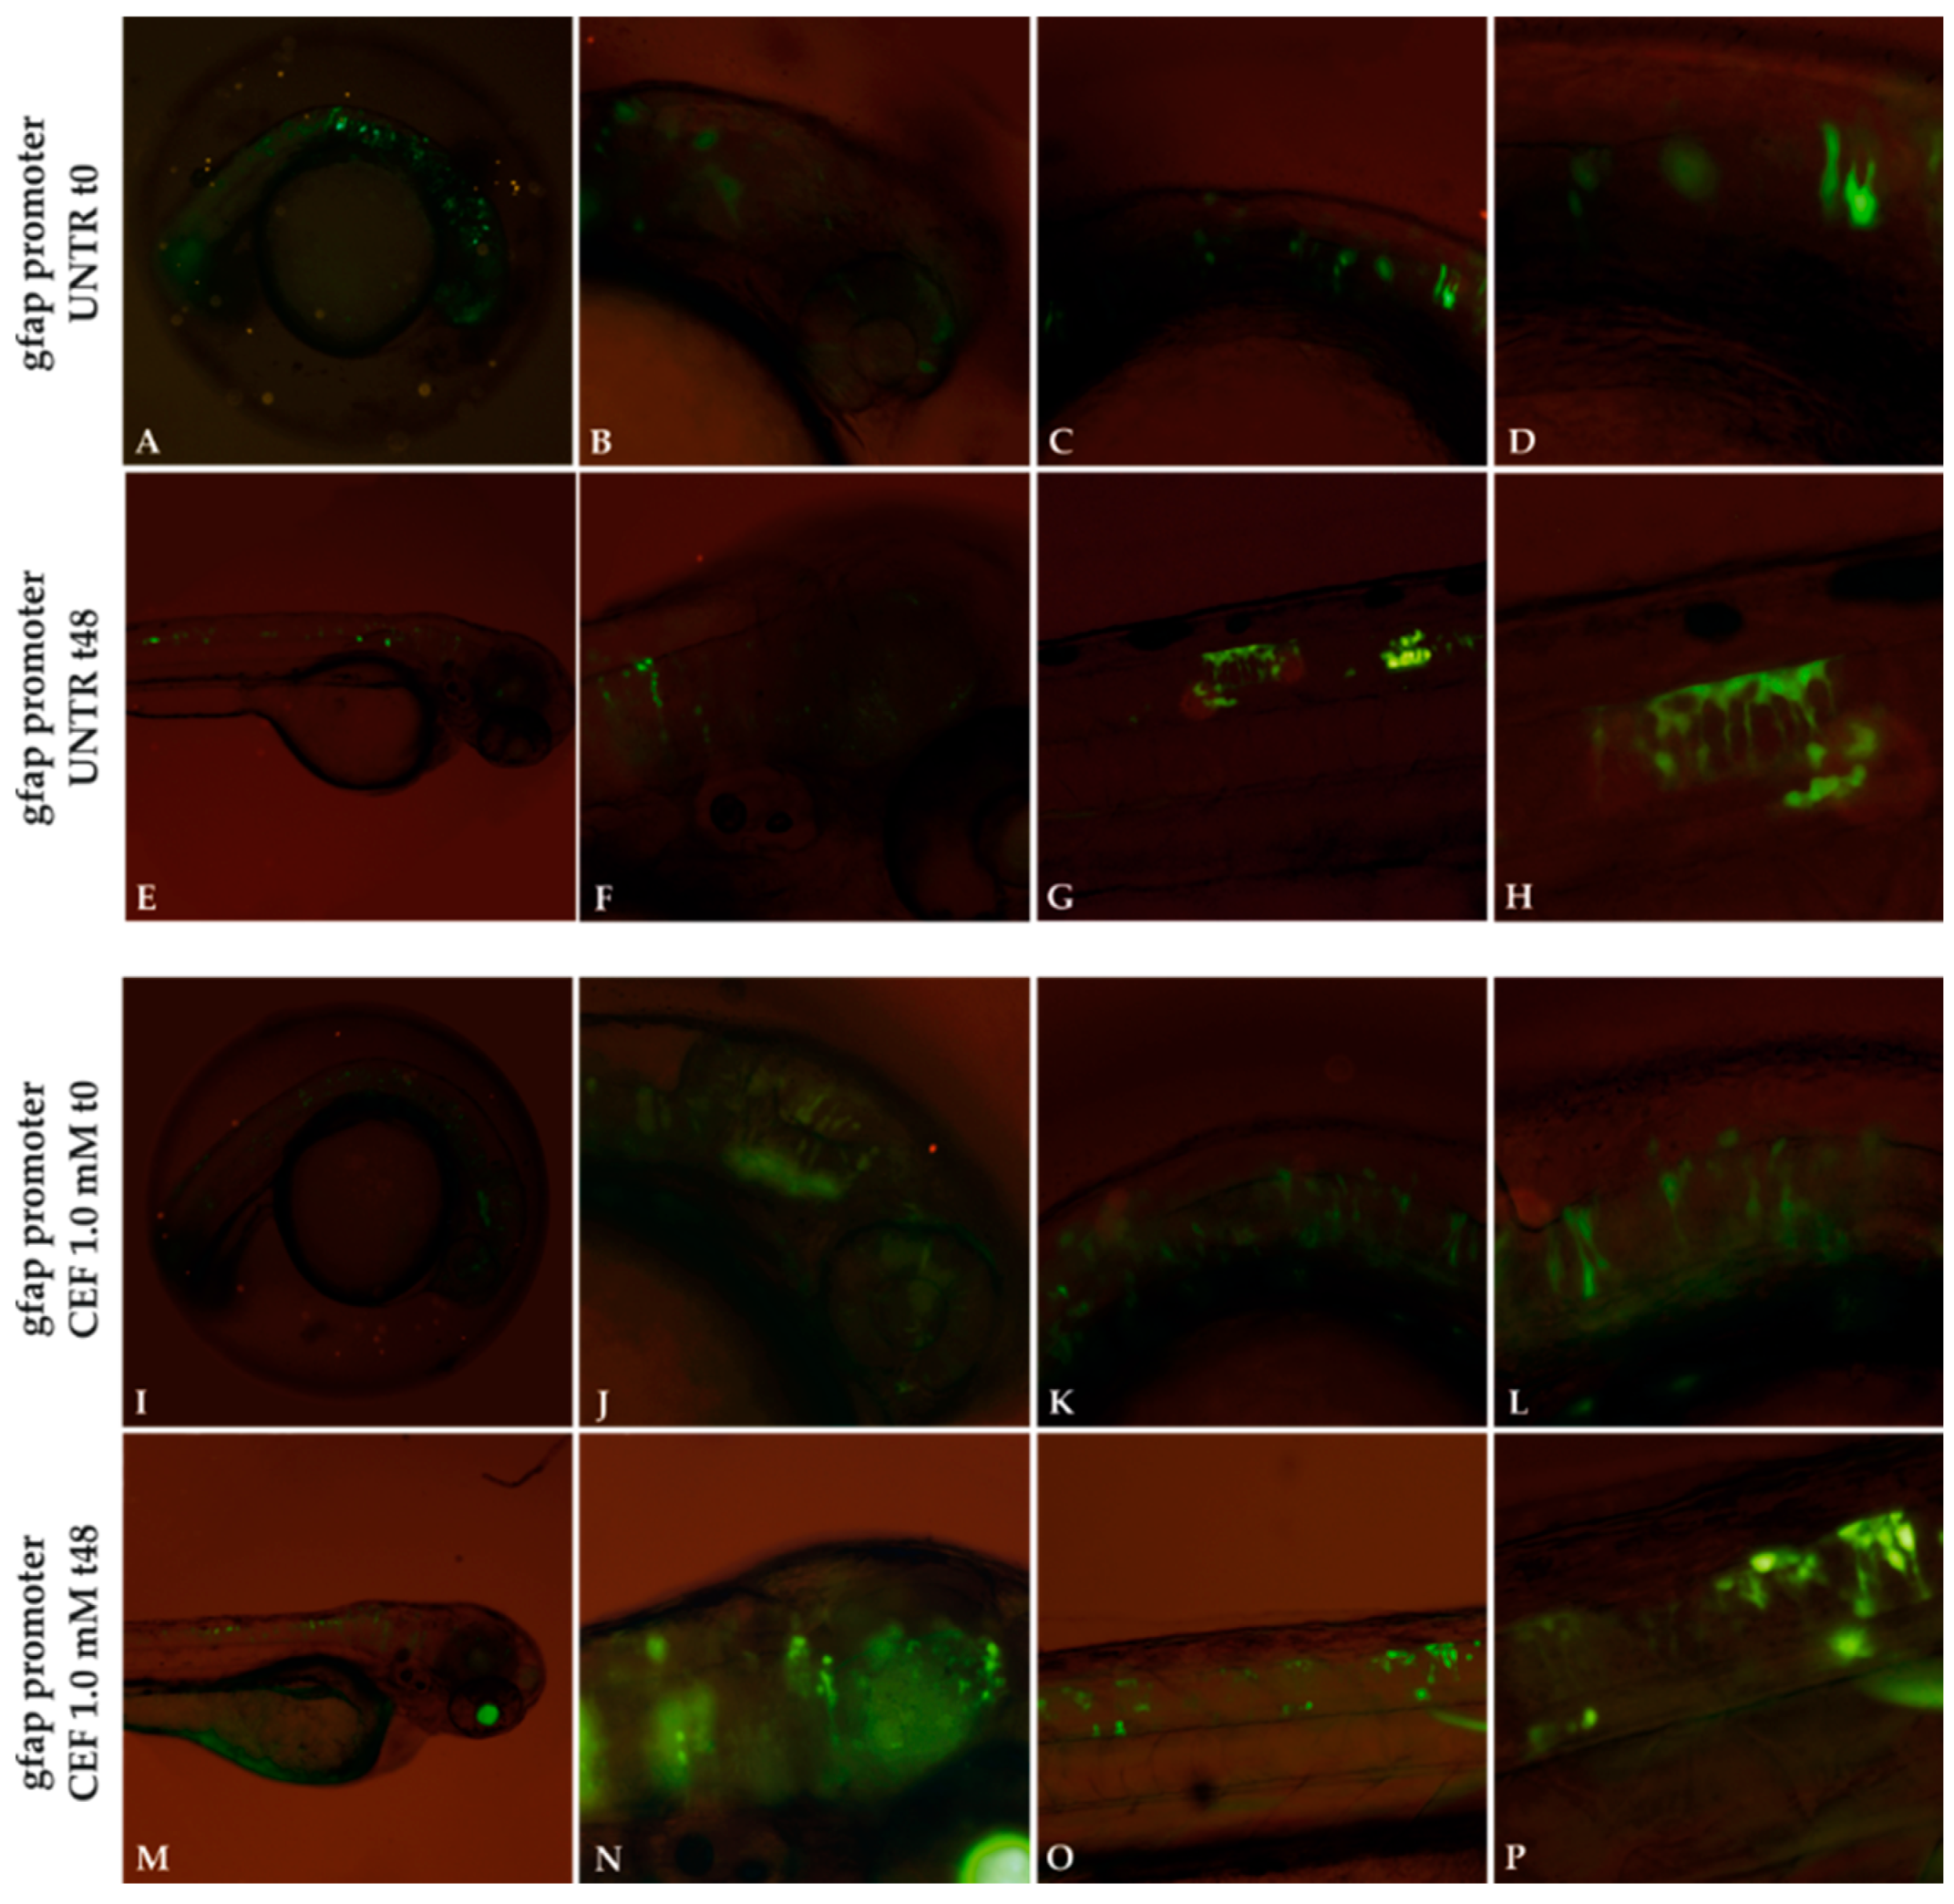
Effect of 1.0 mM CEF treatment on gfap promoter. Untreated (UNTR) embryos expressing gfap promoter as filamentous structures (A–H) at 24 and 72 hpf, respectively. CEF effects on embryos at t0 (24 hpf) (I–L) and after 48h of treatments (M–P). Magnification: 4× (A,E,I,M); 10× (B,C,F,G,J,K,N,O); 20× (D,H,L,P).
Figure 8.
Effect of 1.0 mM CEF treatment on gfap promoter. Untreated (UNTR) embryos expressing gfap promoter as filamentous structures (A–H) at 24 and 72 hpf, respectively. CEF effects on embryos at t0 (24 hpf) (I–L) and after 48h of treatments (M–P). Magnification: 4× (A,E,I,M); 10× (B,C,F,G,J,K,N,O); 20× (D,H,L,P).
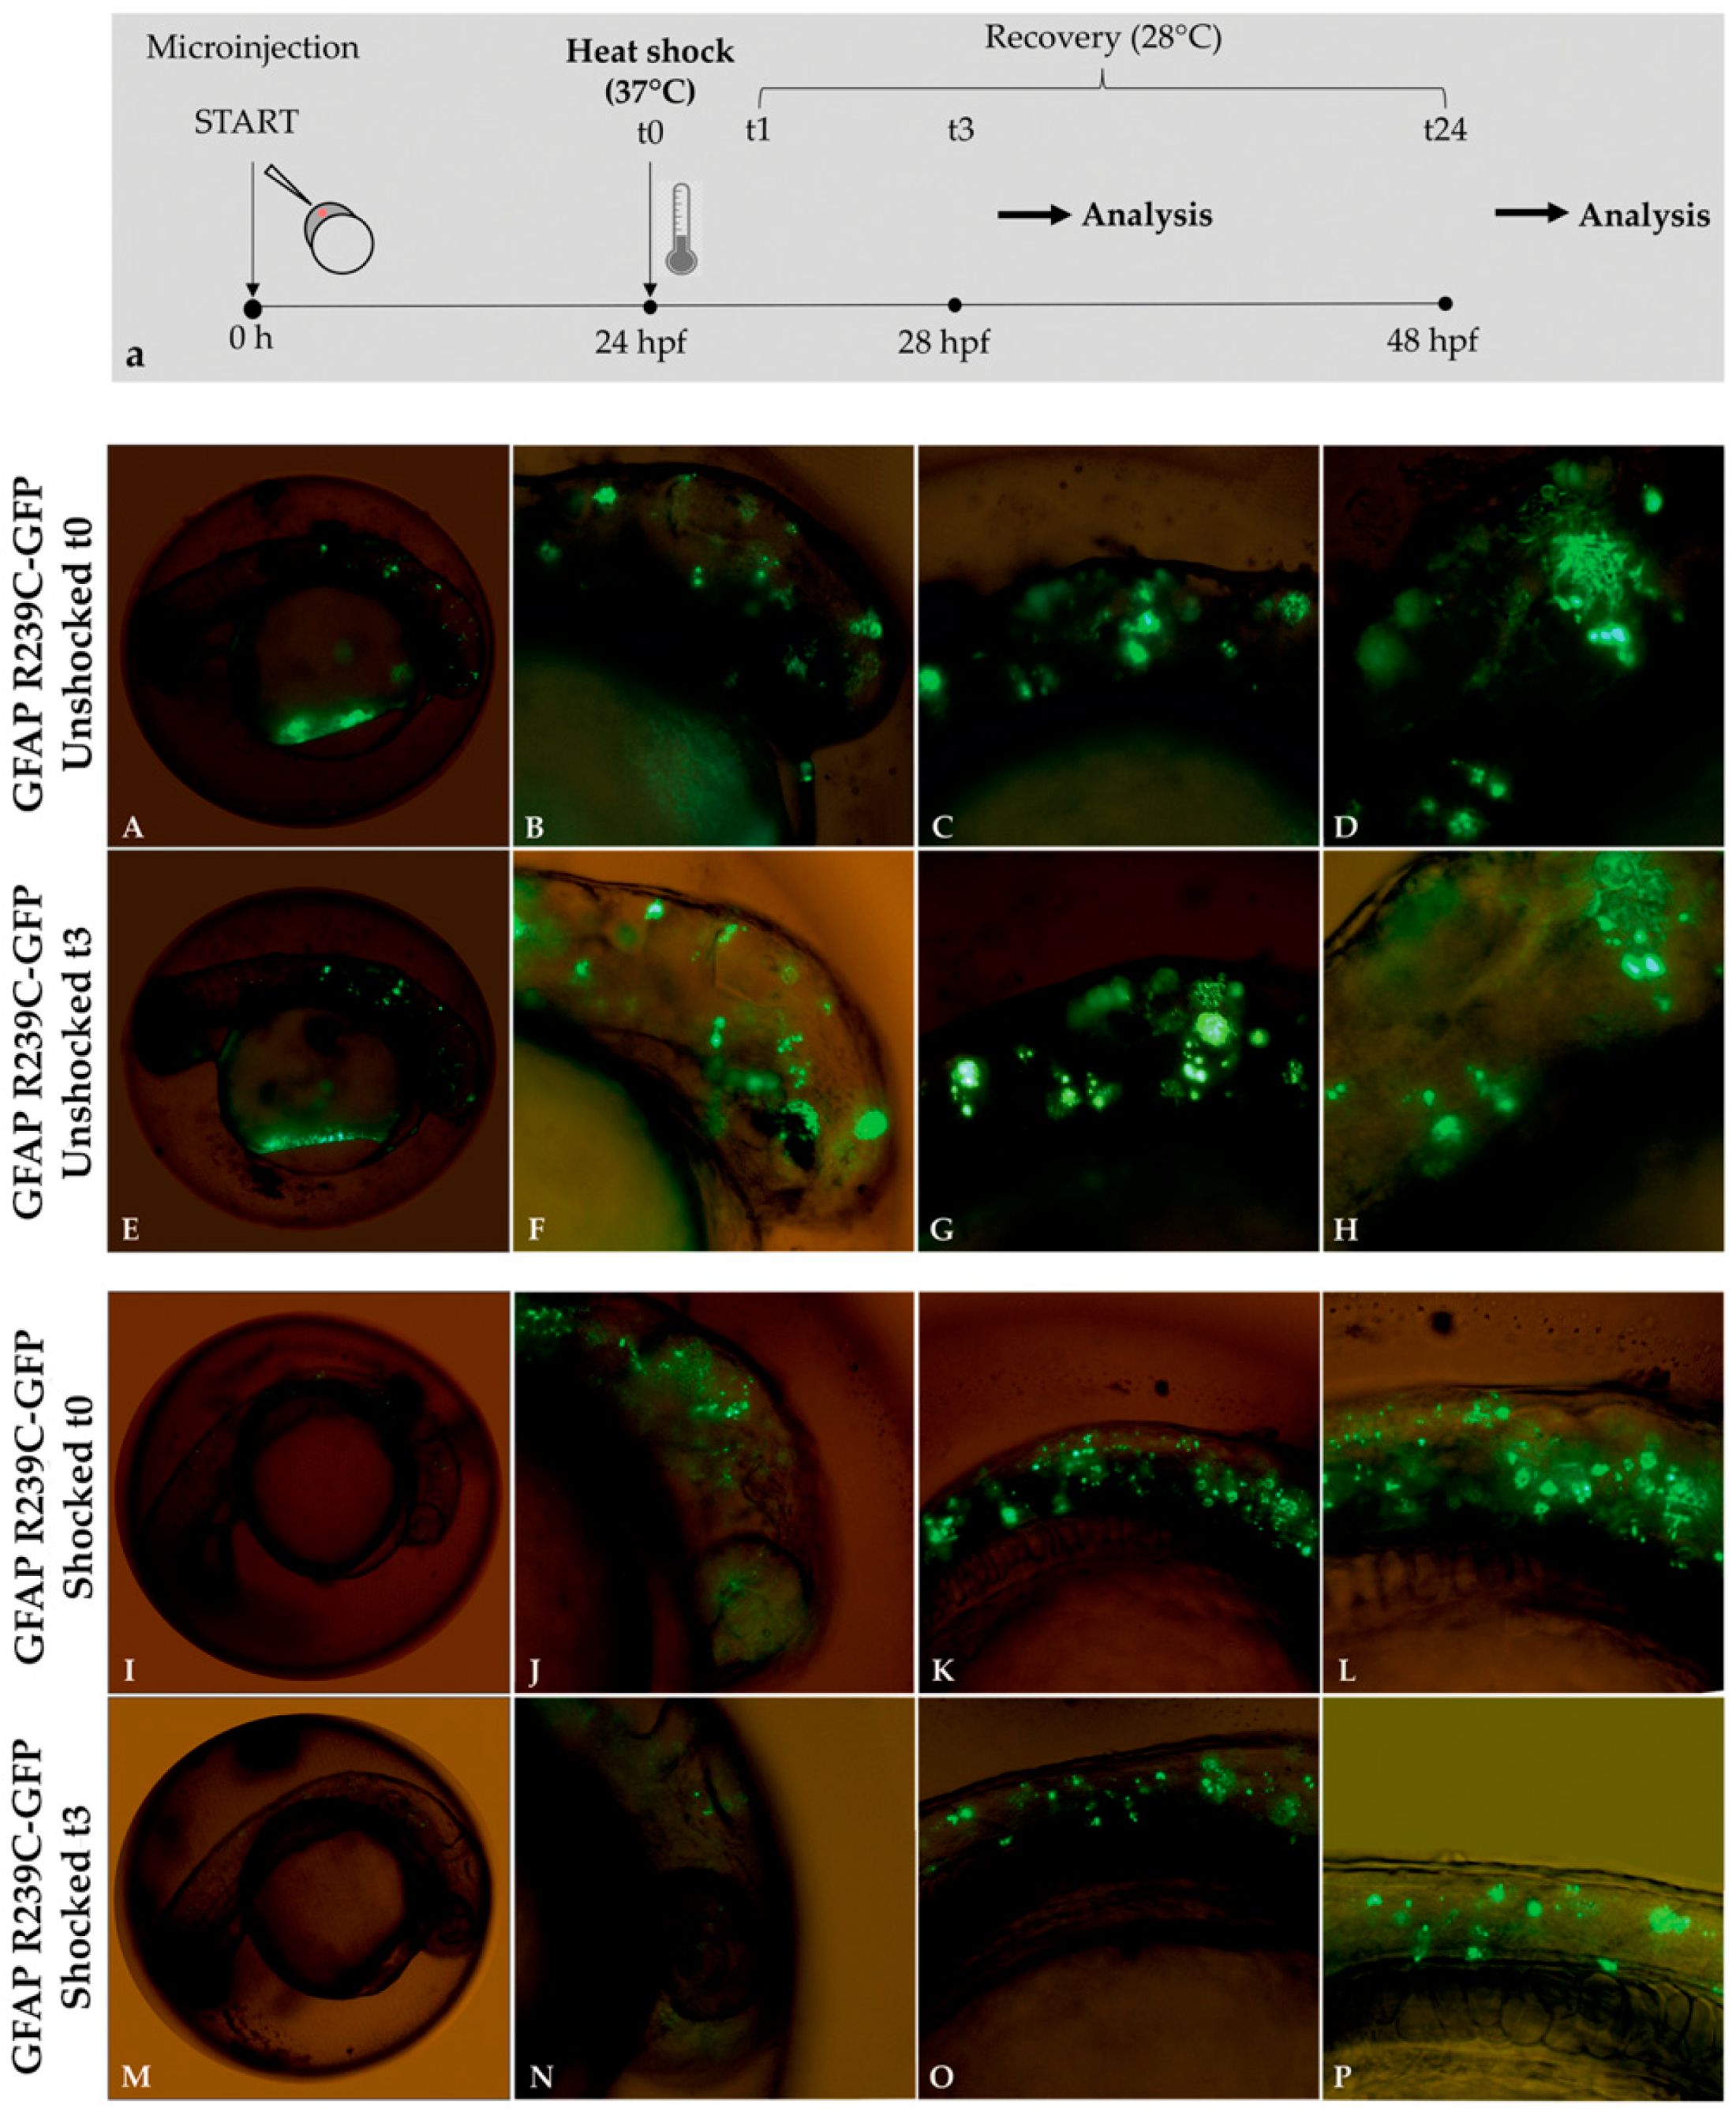
Figure 9.
Experimental plan showing the timeline of heat-shock treatments and effects of thermal shock on p.R239C aggregates. (a) At 24 hpf, embryos were incubated for 1 h at 37 °C and then recovered at 28 °C. Fluorescence microscope analysis was performed after 3 (t3) and 24 h (t24) from the end of the 1 h heat shock (t1). In Figure (A–H), mutant embryos not shocked (unshocked) are presented at 24 hpf, showing diffuse aggregate formation before and after 3 h. Figure (I–L) show GFAP p.R239C aggregates in embryos at 24 hpf, while, in figure (M–P), the thermal shock effect is shown after 3 h on GFAP p.R239C aggregates. Magnification: 4× (A,E,J,M); 10× (B,C,F,G,J,K,N,O); 20× (D,H,L,P).
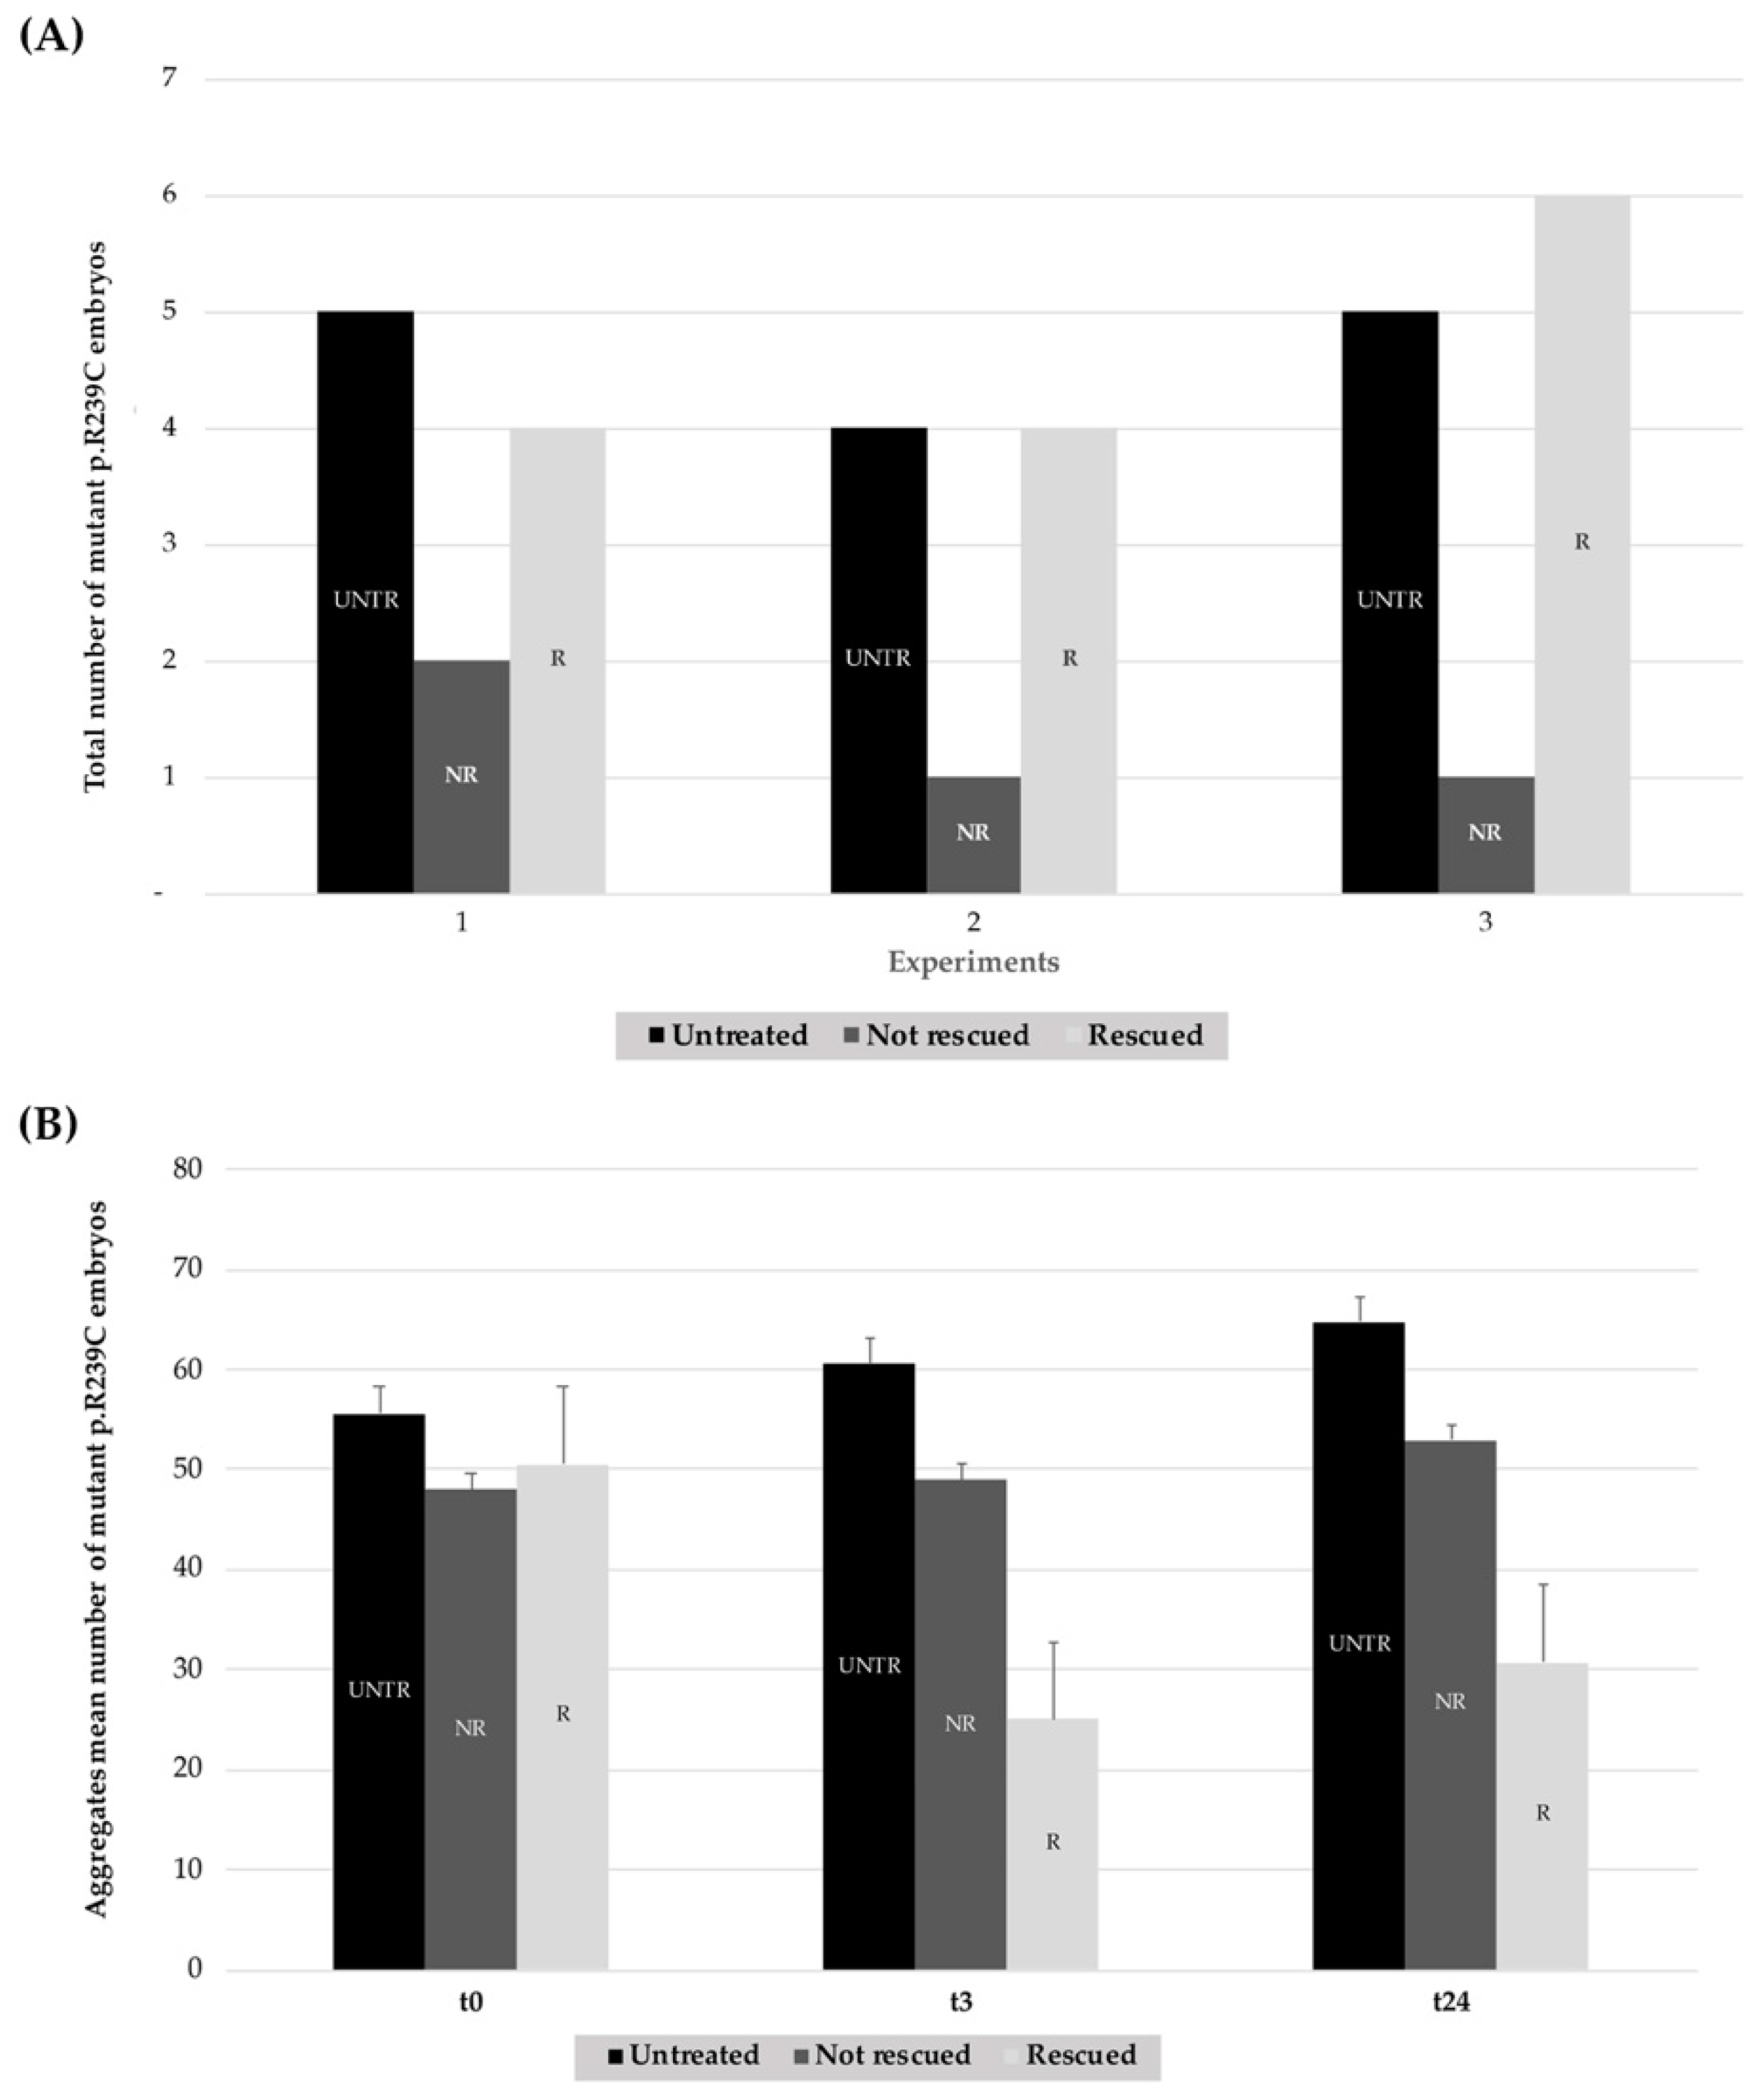
Figure 10.
Summary histograms showing the effect of heat-shock treatments on GFAP R239C-GFP-injected embryos from three replicates. (A) For each experiment (n° 1–3), the lighter column of each series (R) represents the number of embryos showing a reduction in p.R239C aggregates, compared to the untreated embryos (UNTR) and the not rescued (NR) ones, the latter in which the thermal shock did not result in aggregate reduction. For “R” embryos, a paired t-test two-tailed p-value of 0.0022 was determined. (B) The respective count of aggregates is reported in the darker column for untreated embryos (UNTR), compared to the not rescued (NR) and the rescued (R) ones at t0 and after 3 (t3) and 24 h (t24). For “R” embryos, a paired t-test two-tailed p-value of 0.0048 was found. (UNTR: untreated, R: rescued, NR: not rescued).
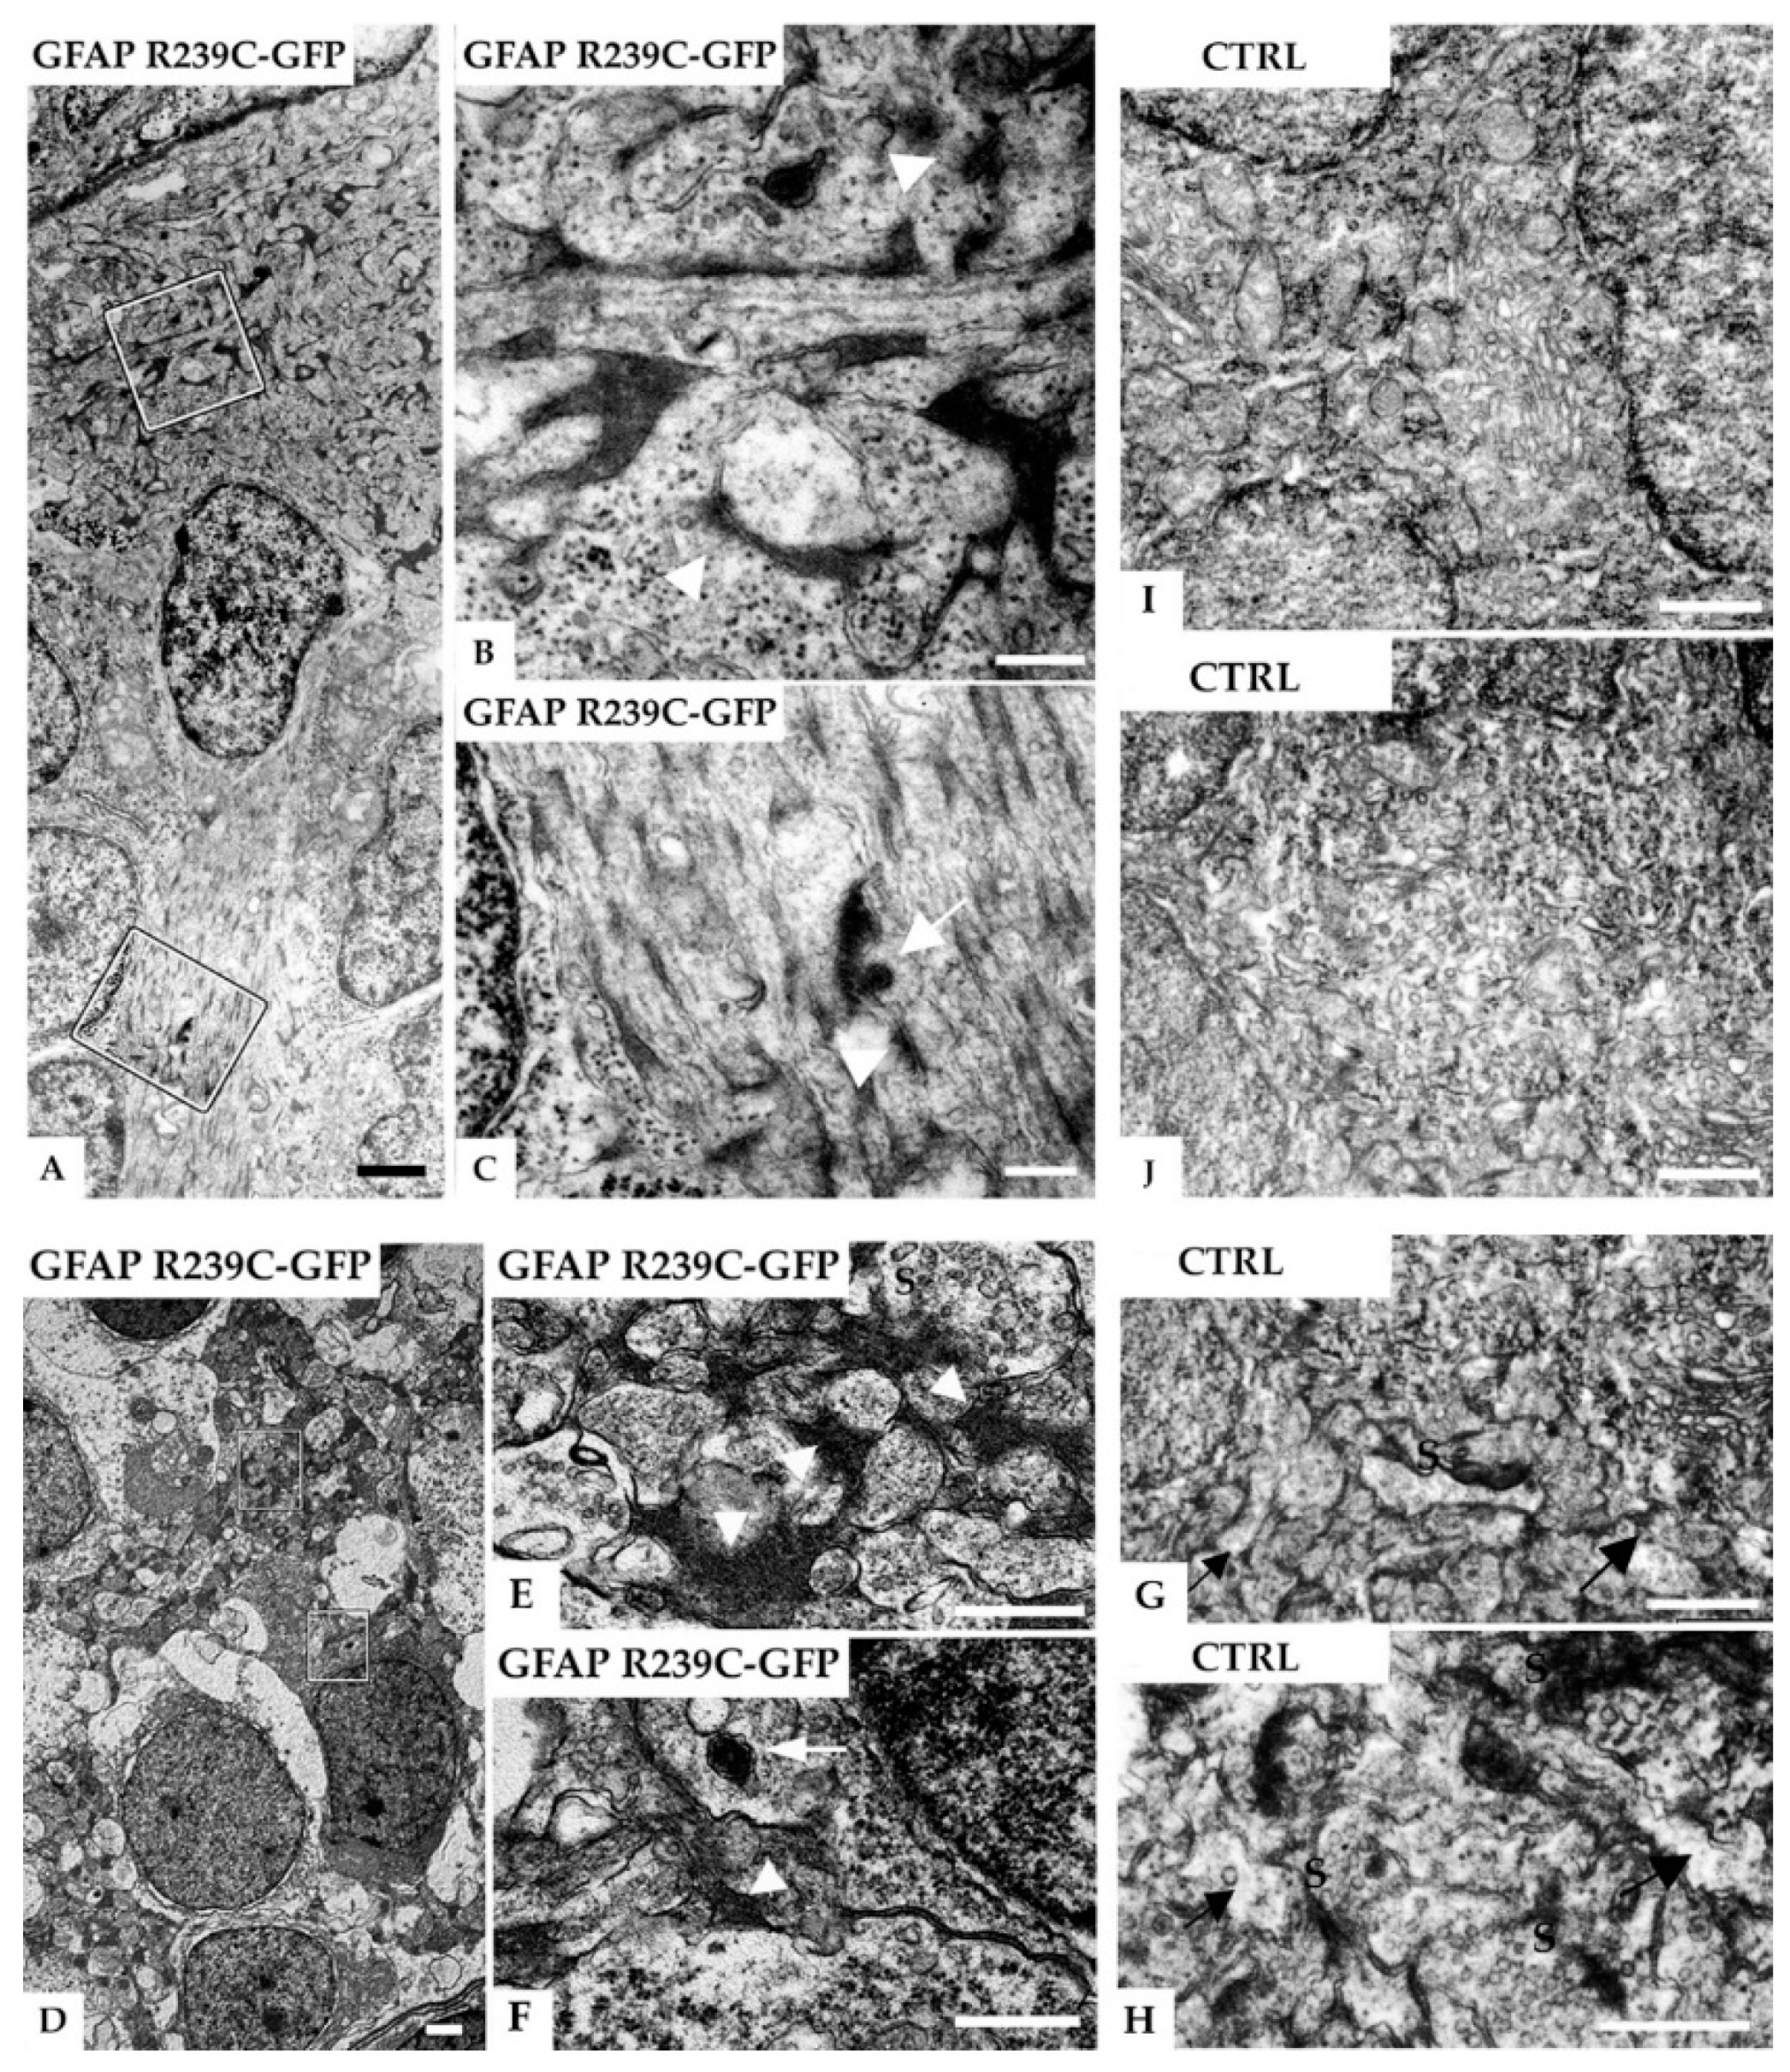
Figure 11.
Electron micrographs of radial glial cells in the subventricular and neuropil region in the telencephalon of a 5 dpf zebrafish injected with GFAP-R239C-GFP plasmid. (A) A glial cell contacts the ventricular brain surface covered by the tela choroidea (top) and shows many electron-dense profiles. In (B,C), higher magnifications of the marked areas in (A) reveal that the dark profiles are associated with filaments (arrowheads) and sometimes surrounded by a membrane (arrows), the latter consistent with lysosomal packaging. In another example of the neuropil region shown in (D), at higher magnifications of the marked areas depicted in (E,F), glial processes containing electron-dense fibrillar material can be seen (arrowheads). The arrow points at a membrane-bound vesicle containing clustered electron-dense material, featuring a lysosome. In (G–J), electron microscopic analyses on control wildtype embryos of similar regions are shown, i.e., subventricular glial processes in (G,H) and neuropil region in the telencephalon in (I,J). No such electron-dense material in glial processes, identified by their irregular shape in the synaptic regions (arrows), was detected in the control tissue. Note that the dark bands are postsynaptic densities (S: presynaptic terminals). Scale bars: (A,D) 1 µm; (B,C) 250 nm; (E–J) 500 nm.
![Genes 11 01490 g011]()
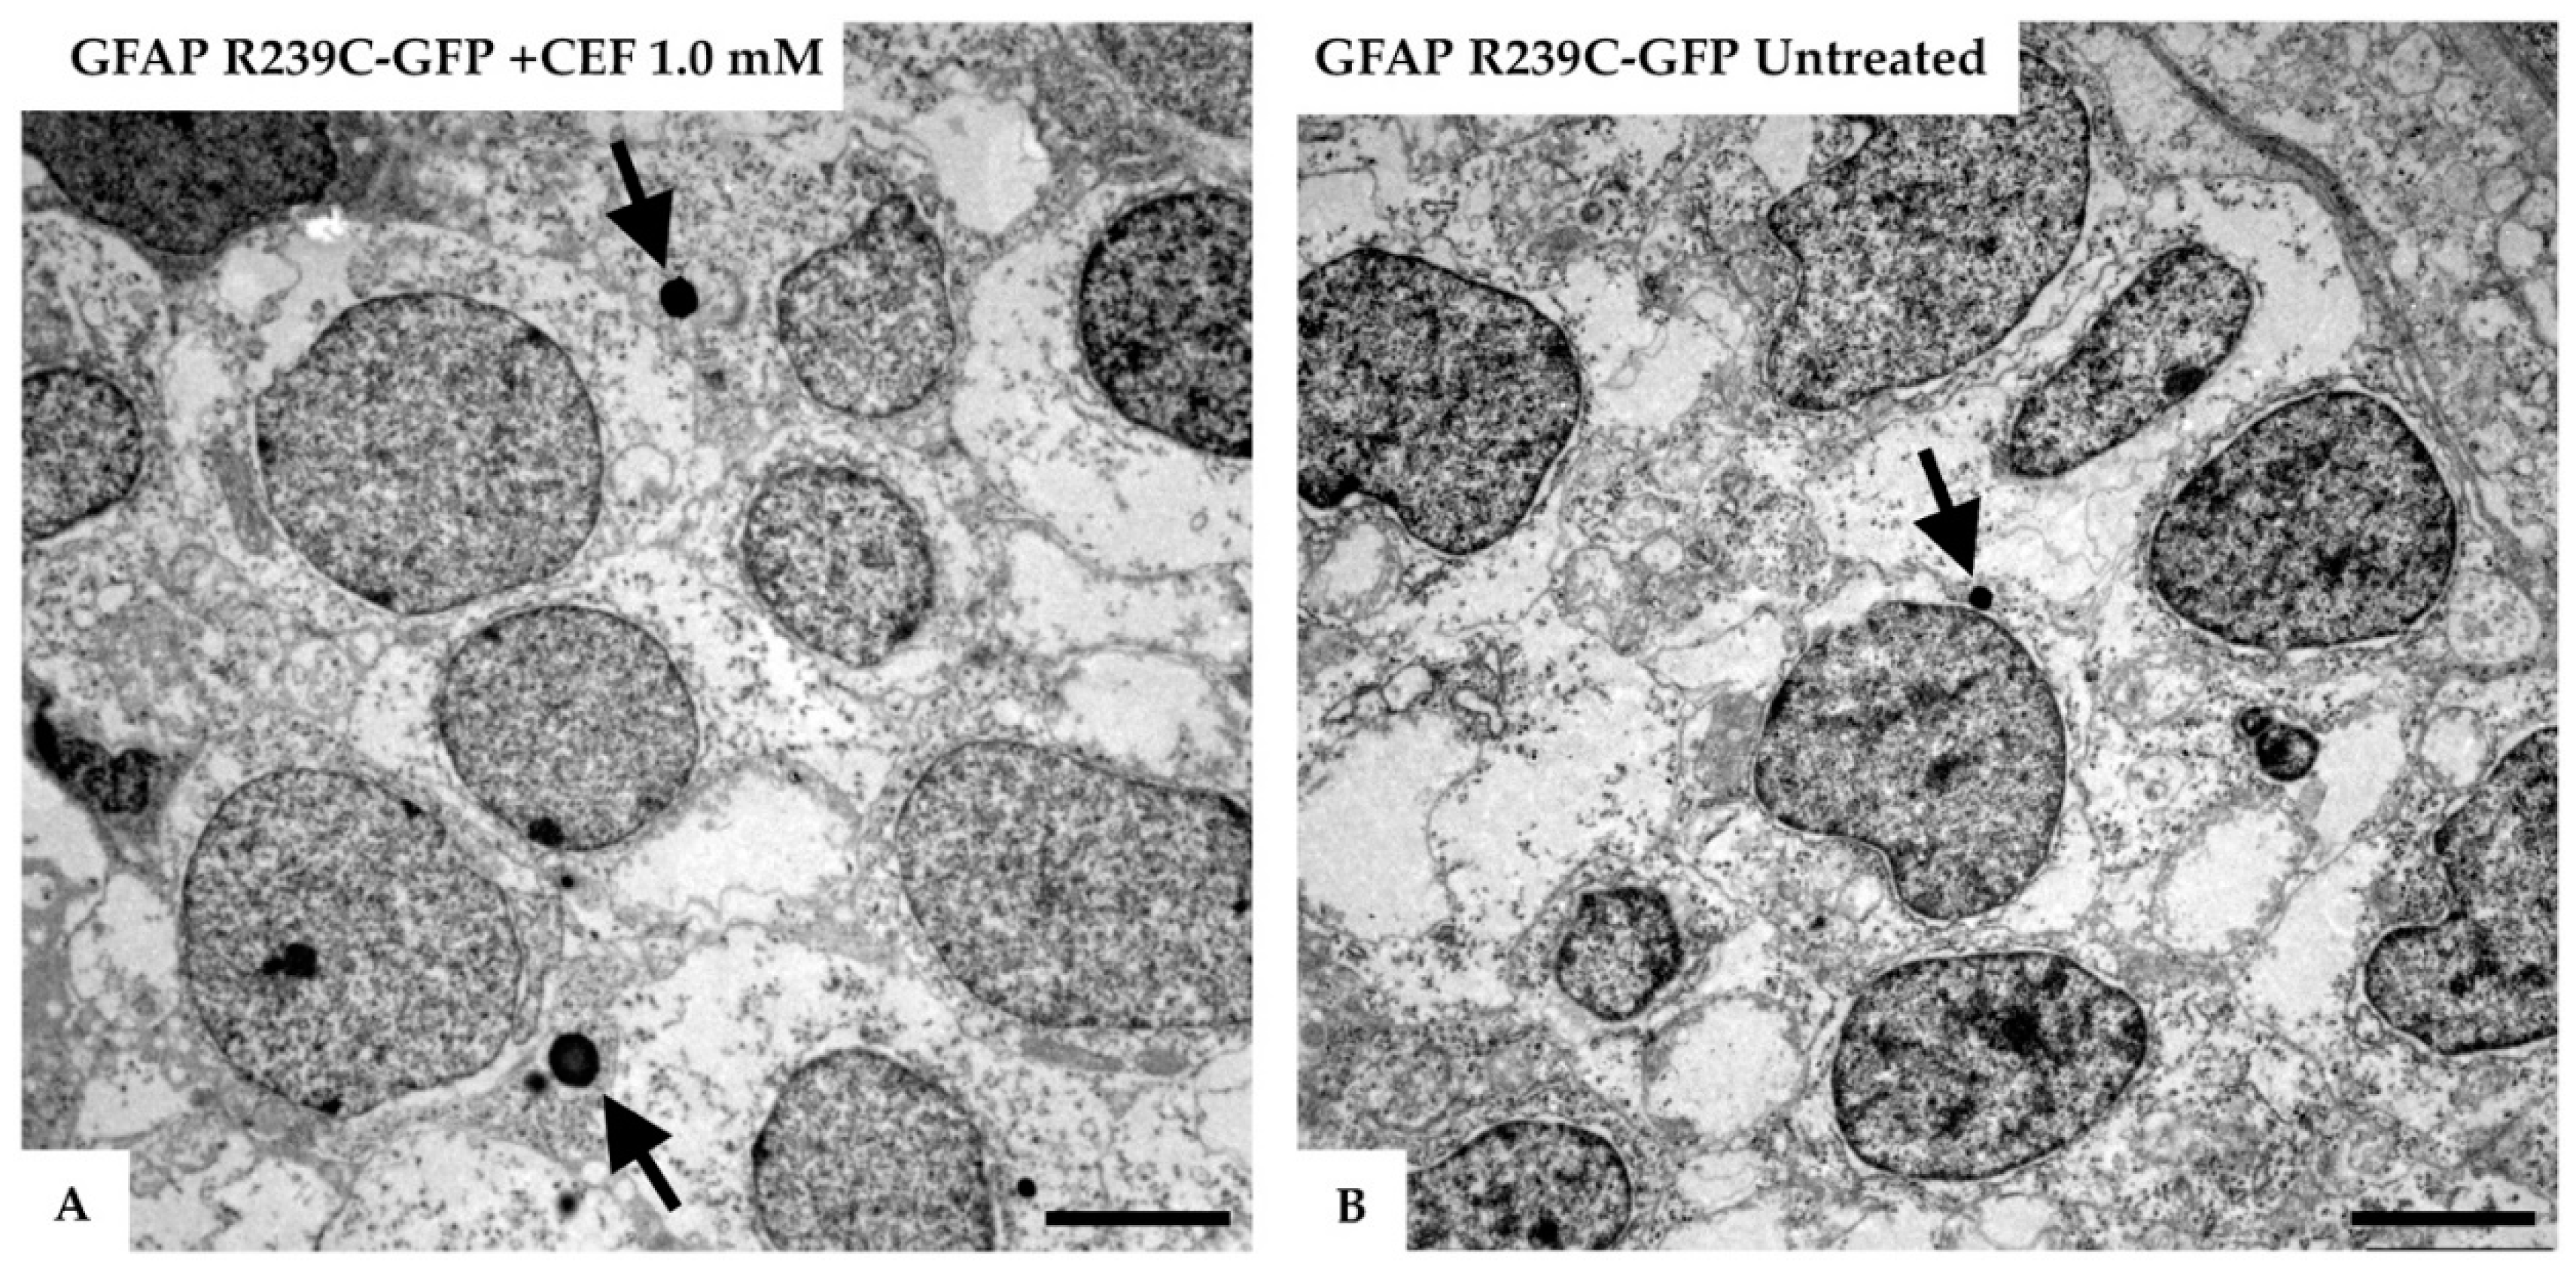
Figure 12.
Electron micrographs of the telencephalon of 3 dpf zebrafish embryos expressing GFAP R239C-GFP.(A) The formation of lysosomes (arrows) was confirmed in the electron micrographs of the telencephalic region from a 3 dpf old zebrafish, injected with GFAP R239C-GFP plasmid and treated with 1.0 mM ceftriaxone for 48 h. (B) In contrast, in mutant untreated embryos, fewer and smaller lysosomes were seen at this embryonic stage. Images were captured with Zeiss EM10 or a LEO 912AB transmission electron microscope. Scale bar: 2.5 µm.
Table 1.
The table shows data obtained in three treatments with ceftriaxone 1.0 mM, comparing the total number of treated embryos (“treated”) with the rescued ones (“rescued”) versus the untreated (“untreated”). The rescued are expressed as a percentage (“% rescue”). Percentages of mean value and standard deviation are shown at the bottom of the table.
| Number of Mutant p.R239C Embryos Treated with CEF 1.0 mM |
|---|
| Experiment | Untreated | Treated | Rescued | % Rescued |
|---|
| n°1 | 5 | 9 | 7 | 77.70% |
| n°2 | 6 | 10 | 7 | 70.00% |
| n°3 | 5 | 12 | 9 | 75.00% |
| Total | 16 | 31 | 23 | 74.20% ± 3.91% |
Table 2.
Details of the aggregates number count are reported for untreated mutant p.R239C embryos.. Means and standard deviations are described at the bottom the table.
Table 2.
Details of the aggregates number count are reported for untreated mutant p.R239C embryos.. Means and standard deviations are described at the bottom the table.
| Aggregates Mean Number of Untreated Mutant p.R239C Embryos |
|---|
| Experiment | t0 | t24 | t48 |
|---|
| n°1 | 55.60 | 59.60 | 64.00 |
| n°2 | 58.00 | 63.67 | 67.67 |
| n°3 | 53.60 | 59.40 | 61.60 |
| Mean ± SD | 55.88 ± 11.43 | 61.06 ± 15.36 | 64.63 ± 19.94 |
Table 3.
Details of the aggregates number count are reported for treated mutant p.R239C embryos. Means and standard deviations are described at the bottom the table.
Table 3.
Details of the aggregates number count are reported for treated mutant p.R239C embryos. Means and standard deviations are described at the bottom the table.
| Aggregates Mean Number of Treated Mutant p.R239C Embryos |
|---|
| Experiment | t0 | t24 | t48 |
|---|
| n°1 | 55.44 | 51.33 | 19.33 |
| n°2 | 58.45 | 52.09 | 25.91 |
| n°3 | 52.80 | 48.40 | 21.80 |
| Mean ± SD | 55.57 ± 11.17 | 50.61 ± 10.73 | 22.35 ± 19.27 |
Table 4.
For each experiment, among the total number of shocked embryos (“shocked”), embryos presenting a decreased number of aggregates (“rescued”) and the ones not showing any beneficial effects (“not rescued”) are shown in table. The rescued are represented in terms of percentage (“% rescue”) with respect to the total number of shocked embryos. Percentages of mean value and standard deviation are shown at the bottom of the table.
| Number of Shocked Mutant p.R239C Embryos |
|---|
| Experiment | Untreated | Shocked | Rescued | % Rescued |
|---|
| n°1 | 5 | 6 | 4 | 66.6% |
| n°2 | 4 | 5 | 4 | 80.0% |
| n°3 | 5 | 7 | 6 | 85.7% |
| Total | 14 | 18 | 14 | 77.40% ± 9.81% |
Table 5.
Aggregate count number details in unshocked mutant p.R239C embryos, with the mean and the respective SD reported at t0, t3, and t24.
Table 5.
Aggregate count number details in unshocked mutant p.R239C embryos, with the mean and the respective SD reported at t0, t3, and t24.
| Aggregates Mean Number of Unshocked Mutant p.R239C Embryos |
|---|
| Experiment | t0 | t3 | t24 |
|---|
| n°1 | 53.20 | 54.80 | 58.80 |
| n°2 | 57.00 | 63.25 | 67.00 |
| n°3 | 56.80 | 64.20 | 68.80 |
| Mean ± SD | 55.57 ± 8.36 | 60.57 ± 11.24 | 64.71 ± 15.19 |
Table 6.
Aggregate count number details in shocked mutant p.R239C embryos, with the mean and the respective SD reported at t0, t3, and t24.
Table 6.
Aggregate count number details in shocked mutant p.R239C embryos, with the mean and the respective SD reported at t0, t3, and t24.
| Aggregates Mean Number of Shocked Mutant p.R239C Embryos |
|---|
| Experiment | t0 | t3 | t24 |
|---|
| n°1 | 47.67 | 35.50 | 39.67 |
| n°2 | 50.80 | 30.00 | 35.20 |
| n°3 | 51.43 | 26.43 | 32.71 |
| Mean ± SD | 49.97 ± 9.95 | 30.64 ± 11.65 | 35.86 ± 11.27 |

 ,
, 


