Article

Phylogenetic Relationship of Plant MLO Genes and Transcriptional Response of MLO Genes to Ralstonia solanacearum in Tomato

1
Fujian Provincial Key Laboratory of Crop Breeding by Design, College of Agriculture, Fujian Agriculture and Forestry University, Fuzhou 350002, China
2
Wenzhou Vocational College of Science and Technology, Wenzhou 325006, China
3
Institute of Vegetables, Zhejiang Academy of Agricultural Sciences, Hangzhou 310021, China
*
Author to whom correspondence should be addressed.
Genes 2020, 11(5), 487; https://doi.org/10.3390/genes11050487
Submission received: 25 March 2020 / Revised: 23 April 2020 / Accepted: 28 April 2020 / Published: 29 April 2020
(This article belongs to the Special Issue Tomato Genetics)

Abstract

:
As a broad-spectrum disease resistance factor, MLO is involved in a variety of biotic and abiotic stress responses in plants. To figure out the structural features, phylogenetic relationships, and expression patterns of MLO genes, we investigated the genome and transcriptome sequencing data of 28 plant species using bioinformatics tools. A total of 197 MLO genes were identified. They possessed 5–7 transmembrane domains, but only partially contained a calmodulin-binding domain. A total of 359 polymorphic sites and 142 haplotypes were found in 143 sequences, indicating the rich nucleotide diversity of MLO genes. The MLO genes were unevenly distributed on chromosomes or scaffolds and were mainly located at the ends, forming clusters (24.1% genes), tandem duplicates (5.7%), and segment duplicates (36.2%). The MLO genes could be classified into three groups by phylogenetic analysis. The angiosperm genes were mainly in subgroup IA, Selaginella moellendorffii genes were in subgroup IA and IIIB, Physcomitrella patens genes were in subgroup IB and IIIA, and almost all algae genes were in group II. About half of the MLO genes had homologs within and across species. The Ka/Ks values were all less than 1, varying 0.01–0.78, suggesting that purifying selection had occurred in MLO gene evolution. In tomato, RNA-seq data indicated that SlMLO genes were highly expressed in roots, followed by flowers, buds, and leaves, and also regulated by different biotic stresses. qRT–PCR analysis revealed that SlMLO genes could respond to tomato bacterial wilt, with SlMLO1, SlMLO2, SlMLO4, and SlMLO6 probably involved in the susceptibility response, whereas SlMLO14 and SlMLO16 being the opposite. These results lay a foundation for the isolation and application of related genes in plant disease resistance breeding.

1. Introduction

Various biotic and abiotic stresses are important factors that restrict plant growth and development. Meanwhile, plants have evolved effective defense mechanisms, in which resistance genes (R genes) play an important role in recognizing and resisting the invasion of pathogens. MLO (mildew resistance locus O) is the first powdery mildew resistance gene discovered in barley (Hordeum vulgare L.). Its recessive mutation leads to broad-spectrum, high-efficiency, and lasting resistance to different strains of powdery mildew. In addition to powdery mildew, MLO also participates in a variety of biotic and abiotic stress responses [1,2,3,4,5,6], revealing its great potential and broad prospects in plant resistance research.
Studies show that the MLO gene is located on the long arm of chromosome 4 in barley, with seven transmembrane helical domains (TMs) and one carboxyl terminal long tail [7]. Its N and C terminals are located extracellularly and intracellularly, respectively, and there is a calmodulin-binding domain (CaMBD) 10–15 amino acids residues away from TM7 [8]. In addition to barley, MLO homologs have also been identified in rice (Oryza sativa L.) [9], Arabidopsis thaliana [10], tomato (Solanum lycopersicum L.) [11], grape (Vitis vinifera L.) [12], cucumber (Cucumis sativus L.) [13], apple (Malus domestica Mill.) [14], pea (Pisum sativum L.) [15], cotton (Gossypium hirsutum L.) [16], poplar (Populus trichocarpa Torr. & Gray) [17], lentil (Lens culinaris Medic.) [18], pumpkin (Cucurbita maxima Duch.) [19], pepper (Capsicum annuum L.), and other monocots and dicots [20]. They are different from most of the R genes cloned previously.
MLO genes represent a new mechanism of broad-spectrum resistance caused by a host gene mutation. Although many plant MLO genes have been identified, few studies have been reported about the phylogenetic evolution of MLO genes and the MLO gene expression in response to Ralstonia solanacearum. In this study, we investigate MLO genes in different plant species, analyze their phylogenetic relationship, and analyze the interaction between MLO genes and R. solanacearum in tomato, aiming to provide basic data for further study of MLO gene function and underlying mechanisms and facilitate molecular breeding of disease resistance related to MLO genes.

2. Materials and Methods

2.1. Plant Species

Twenty-eight plant species with available genome sequence data, including nine angiosperm species (five dicots, three monocots, and one basalmost angiosperm), one gymnosperm species, one fern species, one bryophyte species, and 16 algae species, were investigated in this study (Table 1).

2.2. Identification of Plant MLO Genes

Two methods were used to retrieve the database: (1) The sequence in the conserved domain (PF03094) of MLO genes was downloaded from the Pfam database (pfam.xfam.org), and Blastp search (E-value ≤ 1e−1) was performed on Phytozome v12.1 (phytozome.jgi.doe.gov), NCBI (www.ncbi.nlm.nih.gov), and 1KP (https://db.cngb.org/onekp) databases. (2) The database was searched with the keyword “MLO”. The candidate genes were identified by Pfam based on the hidden Markov model (HMM).
Physicochemical parameters were calculated by the ProtParam program (web.expasy.org/protparam). TM, signal peptide, CaMBD, and subcellular localization were predicted using the TMHMM Server (www.cbs.dtu.dk/services/TMHMM), SignalP 4.1 Server (www.cbs.dtu.dk/services/SignalP), calmodulin-binding protein database (calcium.uhnres.utoronto.ca/ctdb/pub_pages/search/index.htm), and WoLF PSORT (www.genscript.com/wolf-psort.html), respectively.

2.3. Variation Analysis of Plant MLO Gene Sequences

The polymorphic information of gene sequences (variable site number, percentage of polymorphic sites, singleton variable sites, parsimony informative sites, and the total number of mutations) and haplotype diversity (haplotype, haplotype diversity, nucleotide diversity, and the average number of nucleotide differences) in different plants were analyzed by DnaSP 5.0 software.

2.4. Chromosome Localization of Plant MLO Genes

The chromosome map was made by the MapDraw v2.1 software based on MLO gene information. Subsequently, gene clusters and tandem duplication were analyzed. The criteria for determining gene clusters were (1) the distance between two adjacent MLO genes was less than 200 kb; and (2) the number of other genes between two adjacent MLO genes was no more than eight [21,22]. The criteria for tandem duplication were (1) the distance between adjacent MLO genes was less than 100 kb, and (2) the similarity between MLO genes was higher than 70% [23]. The gene synteny was examined by searching the Plant Genome Duplication Database (chibba.agtec.uga.edu/duplication/index/home), and the Circos diagram was drawn with TBtools [24].

2.5. Systematic Cluster Analysis of Plant MLO Genes

After extracting the amino acid sequences of MLO conserved domains and conducting multi-sequence alignment by the ClustalX 1.83 software, the phylogenetic tree was constructed using the maximum likelihood (ML) method implemented by MEGA 7.0 software with the JTT (Jones–Taylor–Thornton) model, a bootstrap value of 1000, and pairwise deletion. Each branch was displayed after removing the nodes with a bootstrap value of lower than 50%.The non-synonymous (Ka) and synonymous (Ks) base substitution rates and Ka/Ks values were calculated by PAL2NAL (www.bork.embl.de/pal2nal/index.cgi?example=Yes#RunP2N).

2.6. Promoter and miRNA Analysis of MLO Genes in Tomato

The 2000-bp upstream sequences of 17 MLO genes in tomato were downloaded from Solanaceae Genomics Network (solgenomics.net), and the cis-acting regulatory elements in these promoters were analyzed by the PlantCARE database (bioinformatics.psb.ugent.be/webtools/plantcare/html). miRNA targets were predicted based on mRNA sequences of SlMLO genes, using the miRBase 22.1 (www.mirbase.org) and psRNATarget (plantgrn.noble.org/psRNATarget) tools.

2.7. Digital Expression Analysis of MLO Genes in Tomato

Tomato RNA sequencing data were downloaded from the tomato functional genomics database (ted.bti.cornell.edu/cgi-bin/TFGD/digital/home.cgi). The gene expression heat-map was drawn, and the profile was analyzed by the MeV 4.9.0 software after removing low-quality data (RPKM < 1) and log2 standardization.

2.8. Expression Analysis of MLO Genes in Response to R. solanacearum in Tomato

The seeds of resistant and susceptible tomato lines, AH13112111 and G149351121, were sterilized, rinsed in sterile water, and sown in pots filled with a mixed matrix of peat, vermiculite, and perlite (2:1:1). When the fourth leaf appeared, the seedlings were subjected to R. solanacearum infection by root-soaking inoculation with a concentration of 108 cfu/mL. Meanwhile, control seedlings were mock-inoculated with distilled water. They were then moved to a culture chamber with a 14 h/10 h diurnal cycle, 28/25 °C day/night temperature, and 80% humidity. After 48 hours, leaves were sampled, frozen in liquid nitrogen quickly, and kept at −80 °C for RNA isolation.
Total RNA was extracted from tomato leaves using a Trizol reagent (Sangon Biotech) according to the manufacturer’s instruction, and checked by RNA gel. The single-stranded cDNA was synthesized using a Maxima Reverse Transcriptase kit and used for quantitative real-time PCR (qRT-PCR). Three biological replicates were set, each with three technical replicates.
qRT-PCR was carried out in 96-well optical reaction plates using StepOne Plus Real Time PCR System (ABI, Foster, CA, USA). The SlRPL2 (Solyc10g006580.2.1) gene was used as an internal control. The reaction mixture contained 2 μL cDNA, 0.4 μL PCR primer, 10 μL SYBR, and 7.2 μL ddH2O. The PCR ran for 45 cycles at 95 °C for 5 s and 60 °C for 30 s for anneal and extension. Gene-specific primers were designed by Primer Premier 5.0 (Table 2).

3. Results

3.1. Basic Characteristics of MLO Genes

A total of 197 MLO genes were identified from the 28 plant species (Table S1). The number of MLO genes in each species varied from one (Picea sitchensis and six algae species) to 26 (P. trichocarpa), with an average of seven. Among them, 30 MLO genes were in 16 algae species, 11 in Physcomitrella patens, 13 in Selaginella moellendorffii, 1 in P. sitchensis, 11 in Amborella trichopoda, 40 in three monocots, and 91 in five dicots.
The number of amino acids in MLO proteins ranged from 400 to 600. Some MLO genes had an N-terminal signal peptide and CaMBD. Most MLO genes were located in the cell membrane and contained 5–7 TMs.

3.2. Sequence Variation of MLO Genes

To evaluate the sequence variation of MLO genes, we examined 143 MLO genes from 14 representative species, which possessed integrated genome annotation information. In total, 359 (98.09%) variable sites were found in the CDS sequences of the 143 MLO genes, among which 19 (5.19%) were singleton variable sites, and 340 (92.90%) were parsimony informative sites. Meanwhile, 142 haplotypes were found in these MLO genes. The haplotype diversity, nucleotide diversity, and the average number of nucleotide differences among these MLO genes were 0.999 ± 0.0008, 0.42414, and 155.236, respectively.
Sequence variation of MLO genes also existed within species (Table 3; P. sitchensis was not listed because of incomplete data). The gene polymorphism site percentage ranged from 53.42 (Volvox carteri) to 85.22 (P. trichocarpa). The singleton variable sites and parsimony-informative sites ranged from 73 (A. thaliana) to 2591 (Chlamydomonas reinhardtii), and from 0 (two algae species) to 863 (V. vinifera), with an average of 442 and 615, respectively. The MLO gene polymorphism site percentage in dicots was higher than that in monocots, but the singleton variable sites were reverse. The algae species had lower polymorphism site percentage and contained only singleton variable sites. The number of mutations ranged from 1103 (S. moellendorffii) to 2591 (C. reinhardtii), with an average of 1771. The haplotype diversity in each species was about 1. The nucleotide diversity ranged from 0.41553 (S. moellendorffii) to 0.58474 (C. reinhardtii), with an average of 0.46123. The average number of nucleotide differences ranged from 364.000 (S. moellendorffii) to 2591.000 (C. reinhardtii), with an average of 737.821. The nucleotide diversity and the average number of nucleotide differences were larger in algae and had obvious differences from other species.
The results of the gene balance evolution test showed that the differences among species were not statistically significant (p > 0.10), and the D values were all negative, suggesting that plant MLO genes underwent mainly purifying selection (Table 4). The minimum recombination value of MLO gene loci in algae was 0, indicating that no recombination occurred in this region. However, the recombination values of other plant species were high, ranging from 88 (S. moellendorffii) to 156 (A. trichopoda), indicating that the recombination had a great influence on the nucleotide diversity of MLO genes.
The numbers of synonymous and non-synonymous substitution sites of MLO genes among 14 species were 87.51 and 278.49, respectively. Comparatively, the numbers of synonymous and non-synonymous substitution sites within species were much larger, varying from 203.06 (S. moellendorffii) to 1230.42 (C. reinhardtii) and from 672.94 (S. moellendorffii) to 3200.58 (C. reinhardtii), respectively (Table 4). The numbers of substitution sites in algae were more than those in other plant species. Fisher’s Exact Test indicated that the Ka/Ks values in different species were all less than 1 (Table 4). This was in line with the purifying selection and consistent with the nucleotide balance test.

3.3. Distribution of MLO Genes in Genomes

Among the 197 MLO genes identified, excluding the 23 from algae that had no chromosomal location information, the remaining 174 MLO genes in 18 species showed a scattered distribution pattern across specific chromosomes or scaffolds and were mainly located at the ends (Figure S1). At most, there were five genes located on chromosomes 1 and 2 in A. thaliana and on scaffold00044 in A. trichopoda, respectively. A total of 19 gene clusters, containing 42 (24.1%) genes, were found in these species except for Brachypodium distachyon, rice, S. moellendorffii, and algae. There were six and five gene clusters in P. trichocarpa and grape, respectively, and five genes at most in one cluster on scaffold00044 in A. trichopoda. Conclusively, about 50% of MLO genes existed in clusters in the three plant species mentioned above. Furthermore, five pairs of tandem duplication genes were found in three species, with three pairs in P. trichocarpa, and one pair each in grape and A. trichopoda, which all appeared in gene clusters. Sixty-one pairs of segment duplicates involving 63 (36.2%) genes were found in nine species, indicating synteny relationships (Figure 1). Among them, 37 pairs were between species, with 11 between different monocots (six between rice and maize), 10 between different dicots, 8 between monocots and dicots, and 8 between A. trichopoda and dicots. In addition, 24 pairs were within species, with five in B. distachyon, four each in rice, maize, and P. trichocarpa, three in grape, and two each in tomato and A. thaliana. In short, there were more than 10 pairs of duplication genes in P. trichocarpa, grape, and three monocots, and the latter was up to 50–83.3%.

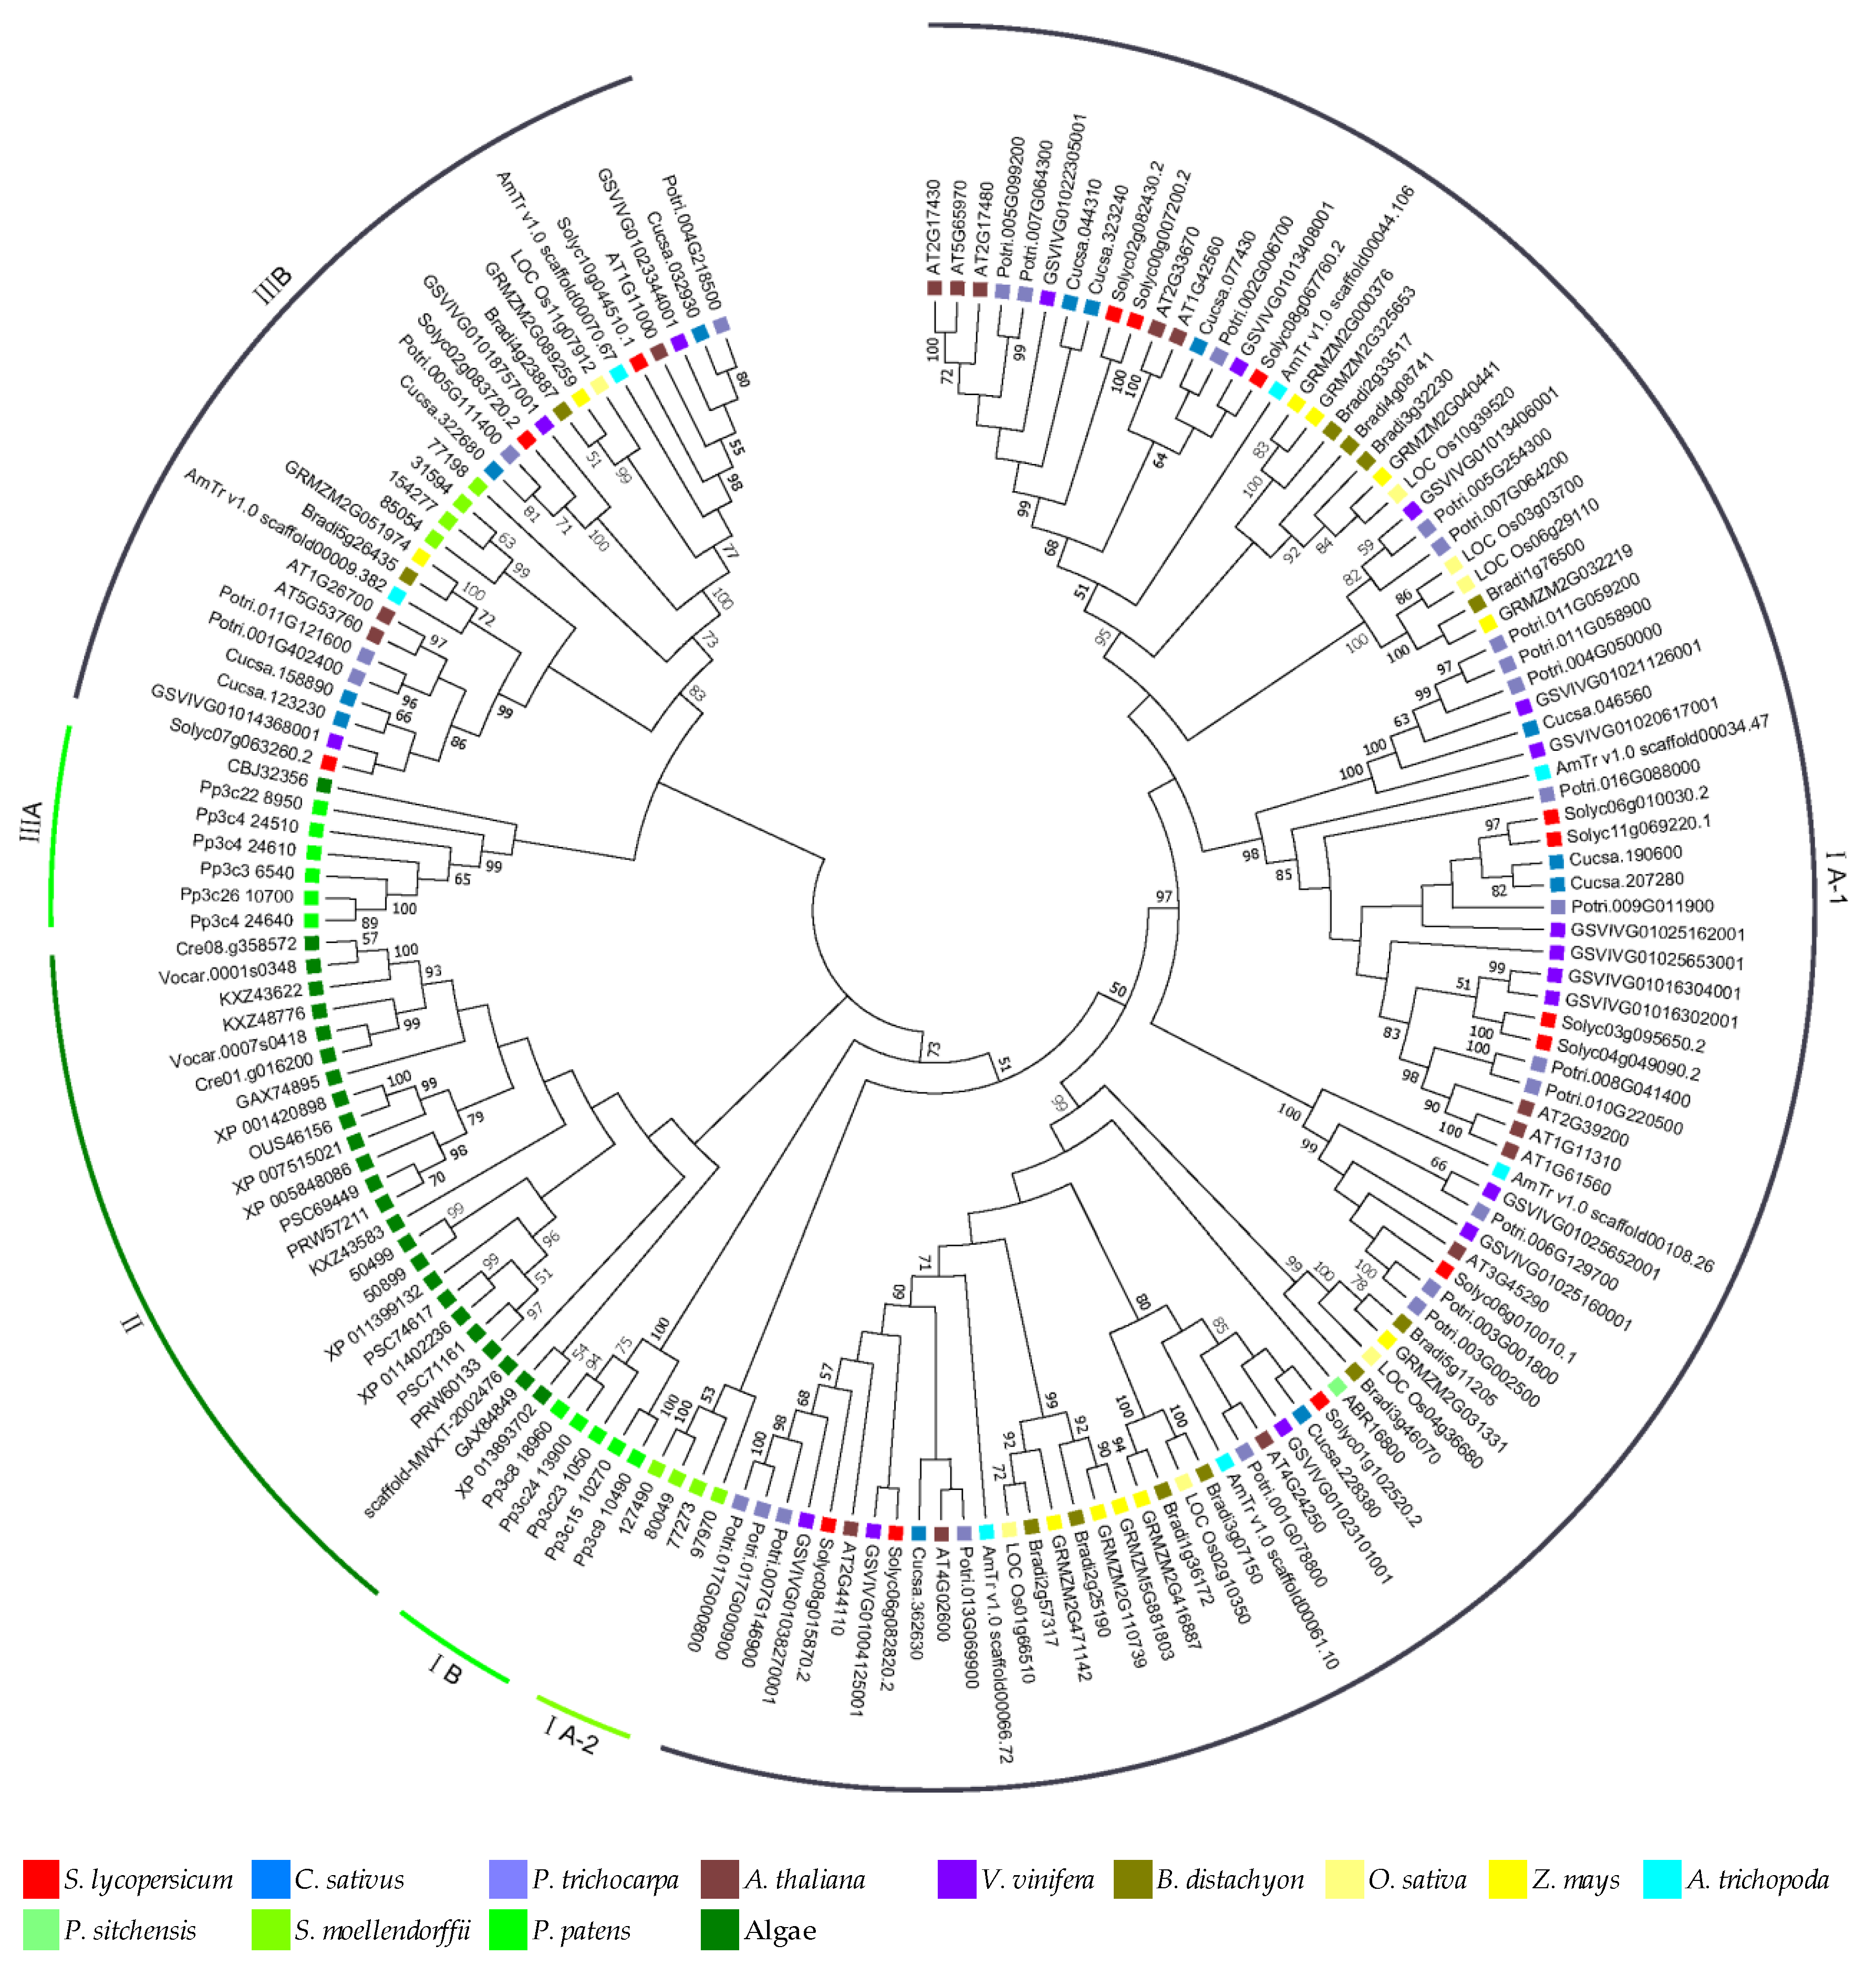
3.4. Phylogenetic Relationships of MLO Genes

In order to analyze the phylogenetic relationship of plant MLO genes, 164 MLO genes with an intact domain (excessively short sequences were excluded) from 28 species were used to construct a phylogenetic tree (Figure 2). These genes could be divided into three groups. Group I contained 105 (64.0%) genes, which could be further divided into three subgroups (I A-1, I A-2, and I B). Sixty-five (79.3%) dicot genes, 25 (83.3%) monocot genes, 5 (71.4%) A. trichopoda genes, and 1 P. sitchensis gene were in I A-1, 4 (50%) S. moellendorffii genes were in I A-2, and 5 (45.5%) P. patens genes were in I B, respectively. Group II contained 24 genes, all from algae. Group III contained 35 genes, which could be further divided into two subgroups (III A and III B). Six (54.5%) P. patens genes and 1 algae gene were in III A, and 17 (20.7%) dicot genes, 5 (16.7%) monocot genes, 2 (28.6%) A. trichopoda genes, and 4 (50%) S. moellendorffii genes were in III B, respectively.
In addition, 25 pairs of orthologous genes were identified, of which 10, 8, 7, 6, 3, and 1 pairs were from P. trichocarpa, grape, B. distachyon, maize, algae, and A. thaliana, respectively, and four pairs each were from cucumber, rice, and A. trichopoda. Also, 28 paralogous genes were identified, of which eight and four pairs were in P. trichocarpa and A. thaliana, three pairs each were in tomato, maize and P. patens, two pairs each were in cucumber and S. moellendorffii, and one pair each was in grape, rice, and B. distachyon, respectively (Table S2). The results showed that 52.4% of the MLO genes had homologs, with GSVIVG01014368001 having four, Potri.001G402400, Potri.011G121600, Potri.011G058900 and scaffold00009.382 each having three, and Potri.005G254300, Potri.017G000800, AT5G53760, Cucsa.046560, Bradi2g57317, GRMZM2G089259, GRMZM2G110739, GRMZM5G881803, and LOC_Os01g66510 each having two, respectively. Among 53 pairs of homologous genes, 13 pairs were of segment duplicates, which were presumed to have a synteny relationship, and 4 pairs were of tandem duplicates. The Ka/Ks values of these homologous genes were all less than 1, ranging 0.01–0.78, suggesting that they underwent purifying selection.

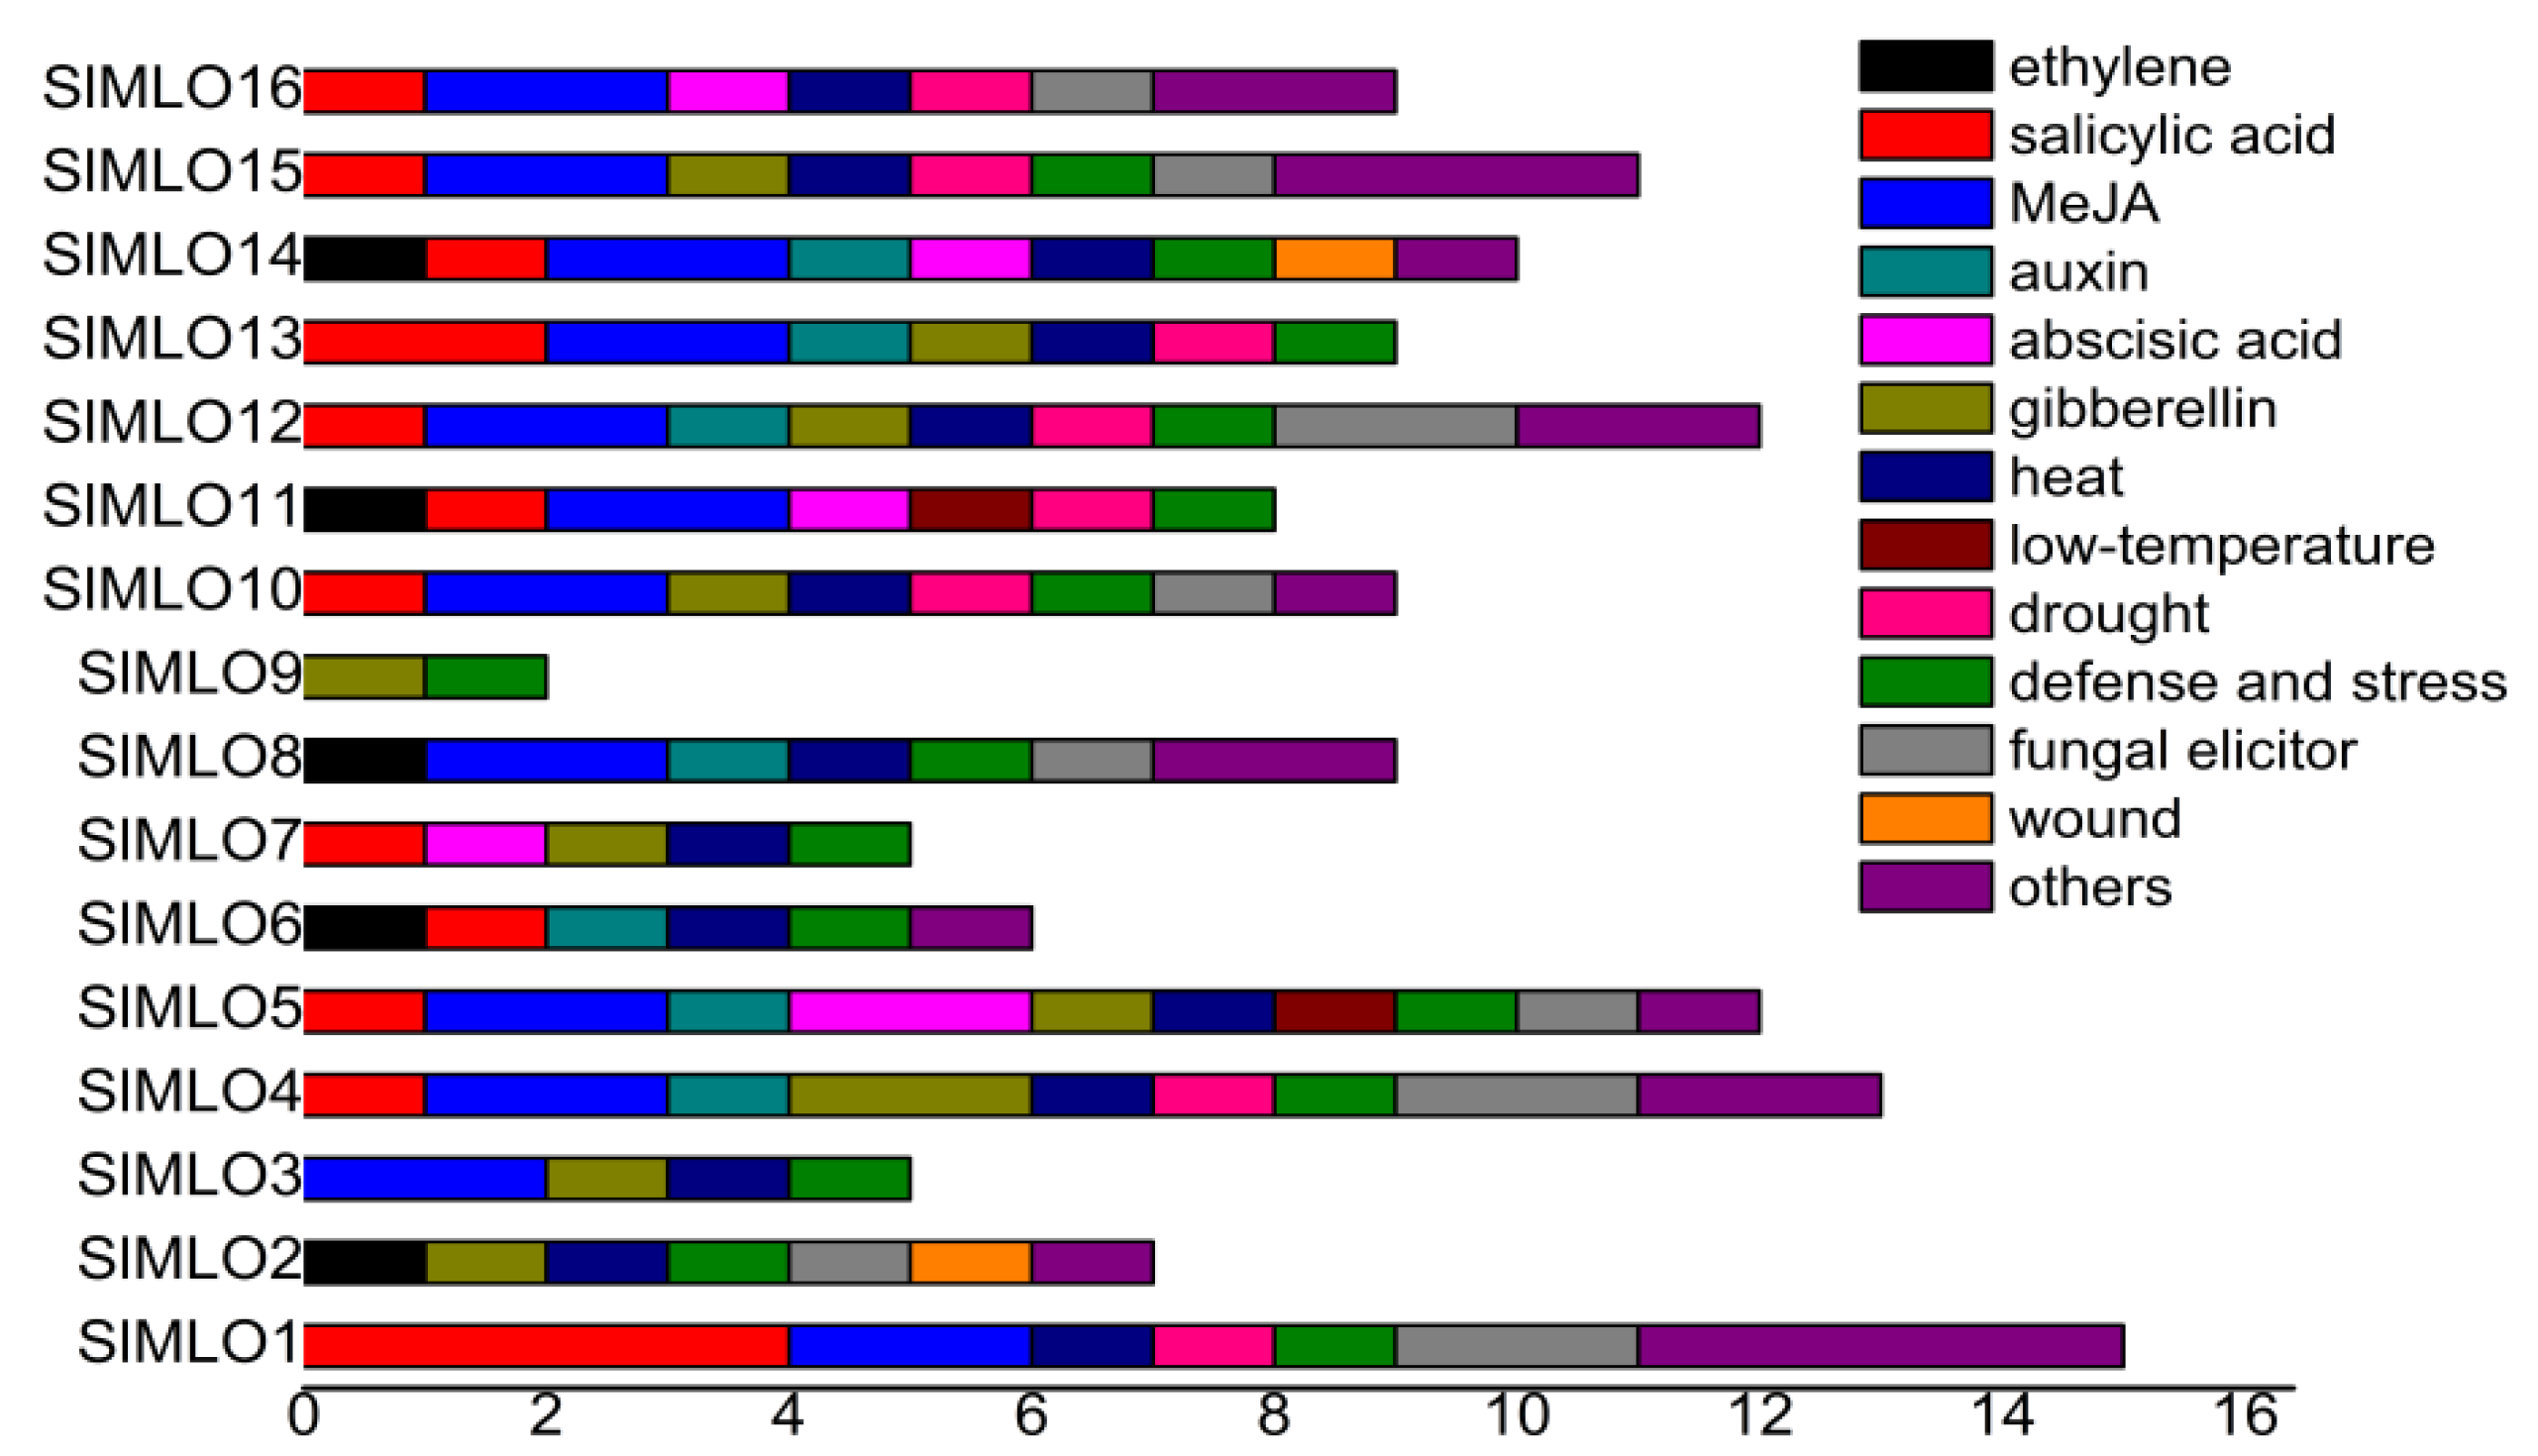
3.5. Promoter Elements of SlMLO Genes

There were mainly three kinds of cis-acting regulatory elements related to hormone response, abiotic stress response, and resistance response in SlMLO gene promoters, including methyl jasmonate (MeJA), salicylic acid (SA), gibberellic acid (GA), indoleacetic acid (IAA), abscisic acid (ABA) and ethylene (ETH) response, heat and drought stress response, and elicitor recognition elements (Figure 3). SlMLO1, SlMLO4, SlMLO5, and SlMLO12 contained more cis-acting elements that could respond to biotic and abiotic stresses. In general, the SlMLO genes contained 5–9 cis-acting elements, but SlMLO9 only contained 2. Individual SlMLO genes contained regulatory elements such as cold and wounding responses and flavonoids biosynthesis.

3.6. miRNAs Targeting SlMLO Genes

Using the miRBase 22.1 and psRNATarget tools, 26 miRNAs were predicted to be able to target 12 SlMLO genes in tomato (Table 5). On average, one SlMLO was targeted by about two miRNAs, varying from one (SlMLO3, SlMLO15, and SlMLO16) to eight (SlMLO12). Most (18) of the miRNAs could only target one SlMLO gene, but there were seven (sly-miR156a, sly-miR156b, sly-miR156c, sly-miR172a, sly-miR172b, sly-miR9469-3p, and sly-miR6022) and one (sly-miR6027-5p) miRNAs that could target two and four SlMLO genes, respectively.

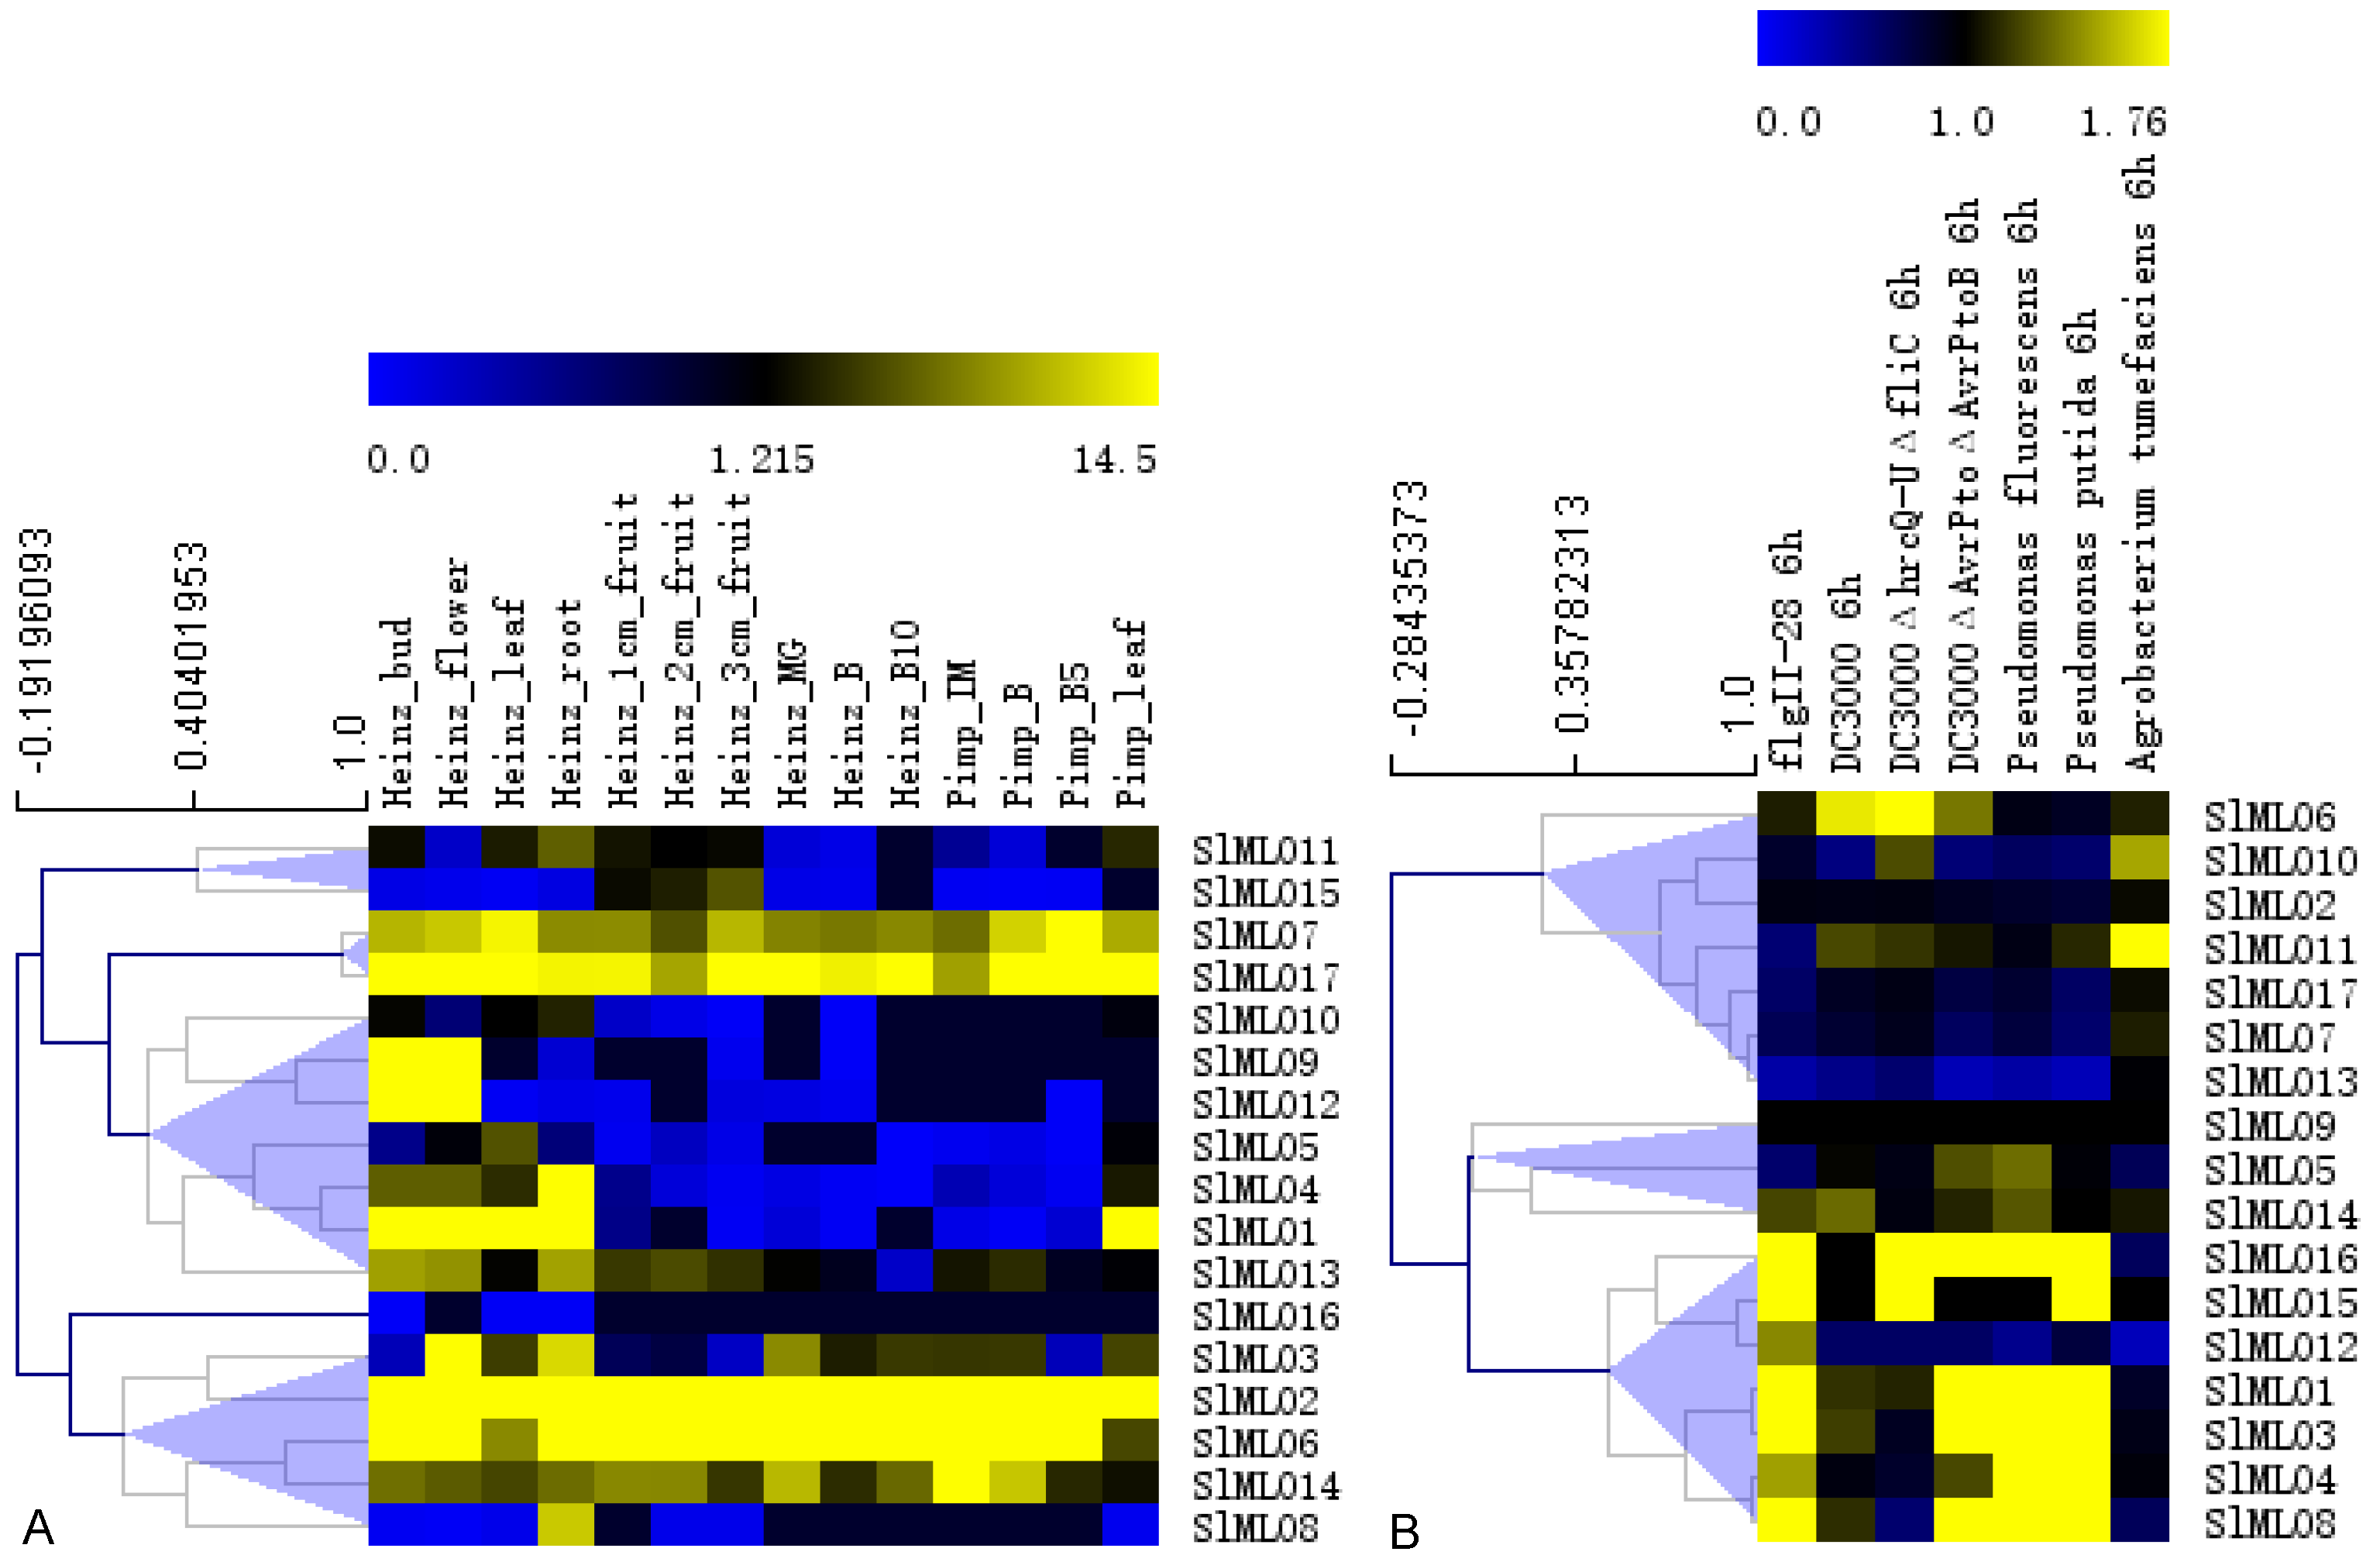
3.7. Digital Expression of SlMLO Genes

According to their expression patterns in different tissues, the 17 SlMLO genes could be divided into five groups (Figure 4A). SlMlLO2, SlMLO6, SlMLO7, SlMLO14, and SlMLO17 were highly expressed in different tissues. SlMLO1 was highly expressed in all tissues except fruits. SlMLO3 was mainly expressed in flowers and roots. SlMLO4 and SlMLO8 were mainly expressed in roots. SlMLO9 and SlMLO12 were mainly expressed in buds and flowers. Overall, SlMLO genes were mainly expressed in roots, followed by flowers, buds, and leaves.
In regard to their expression in response to pathogen infection, the 17 SlMLO genes could be divided into three groups (Figure 4B). SlMLO1, SlMLO3, SlMLO4, SlMLO8, and SlMLO16 were highly expressed under different biotic stresses except for Agrobacterium tumefaciens infection. In contrast, SlMLO10 and SlMLO11 had a higher expression level under A. tumefaciae infection.

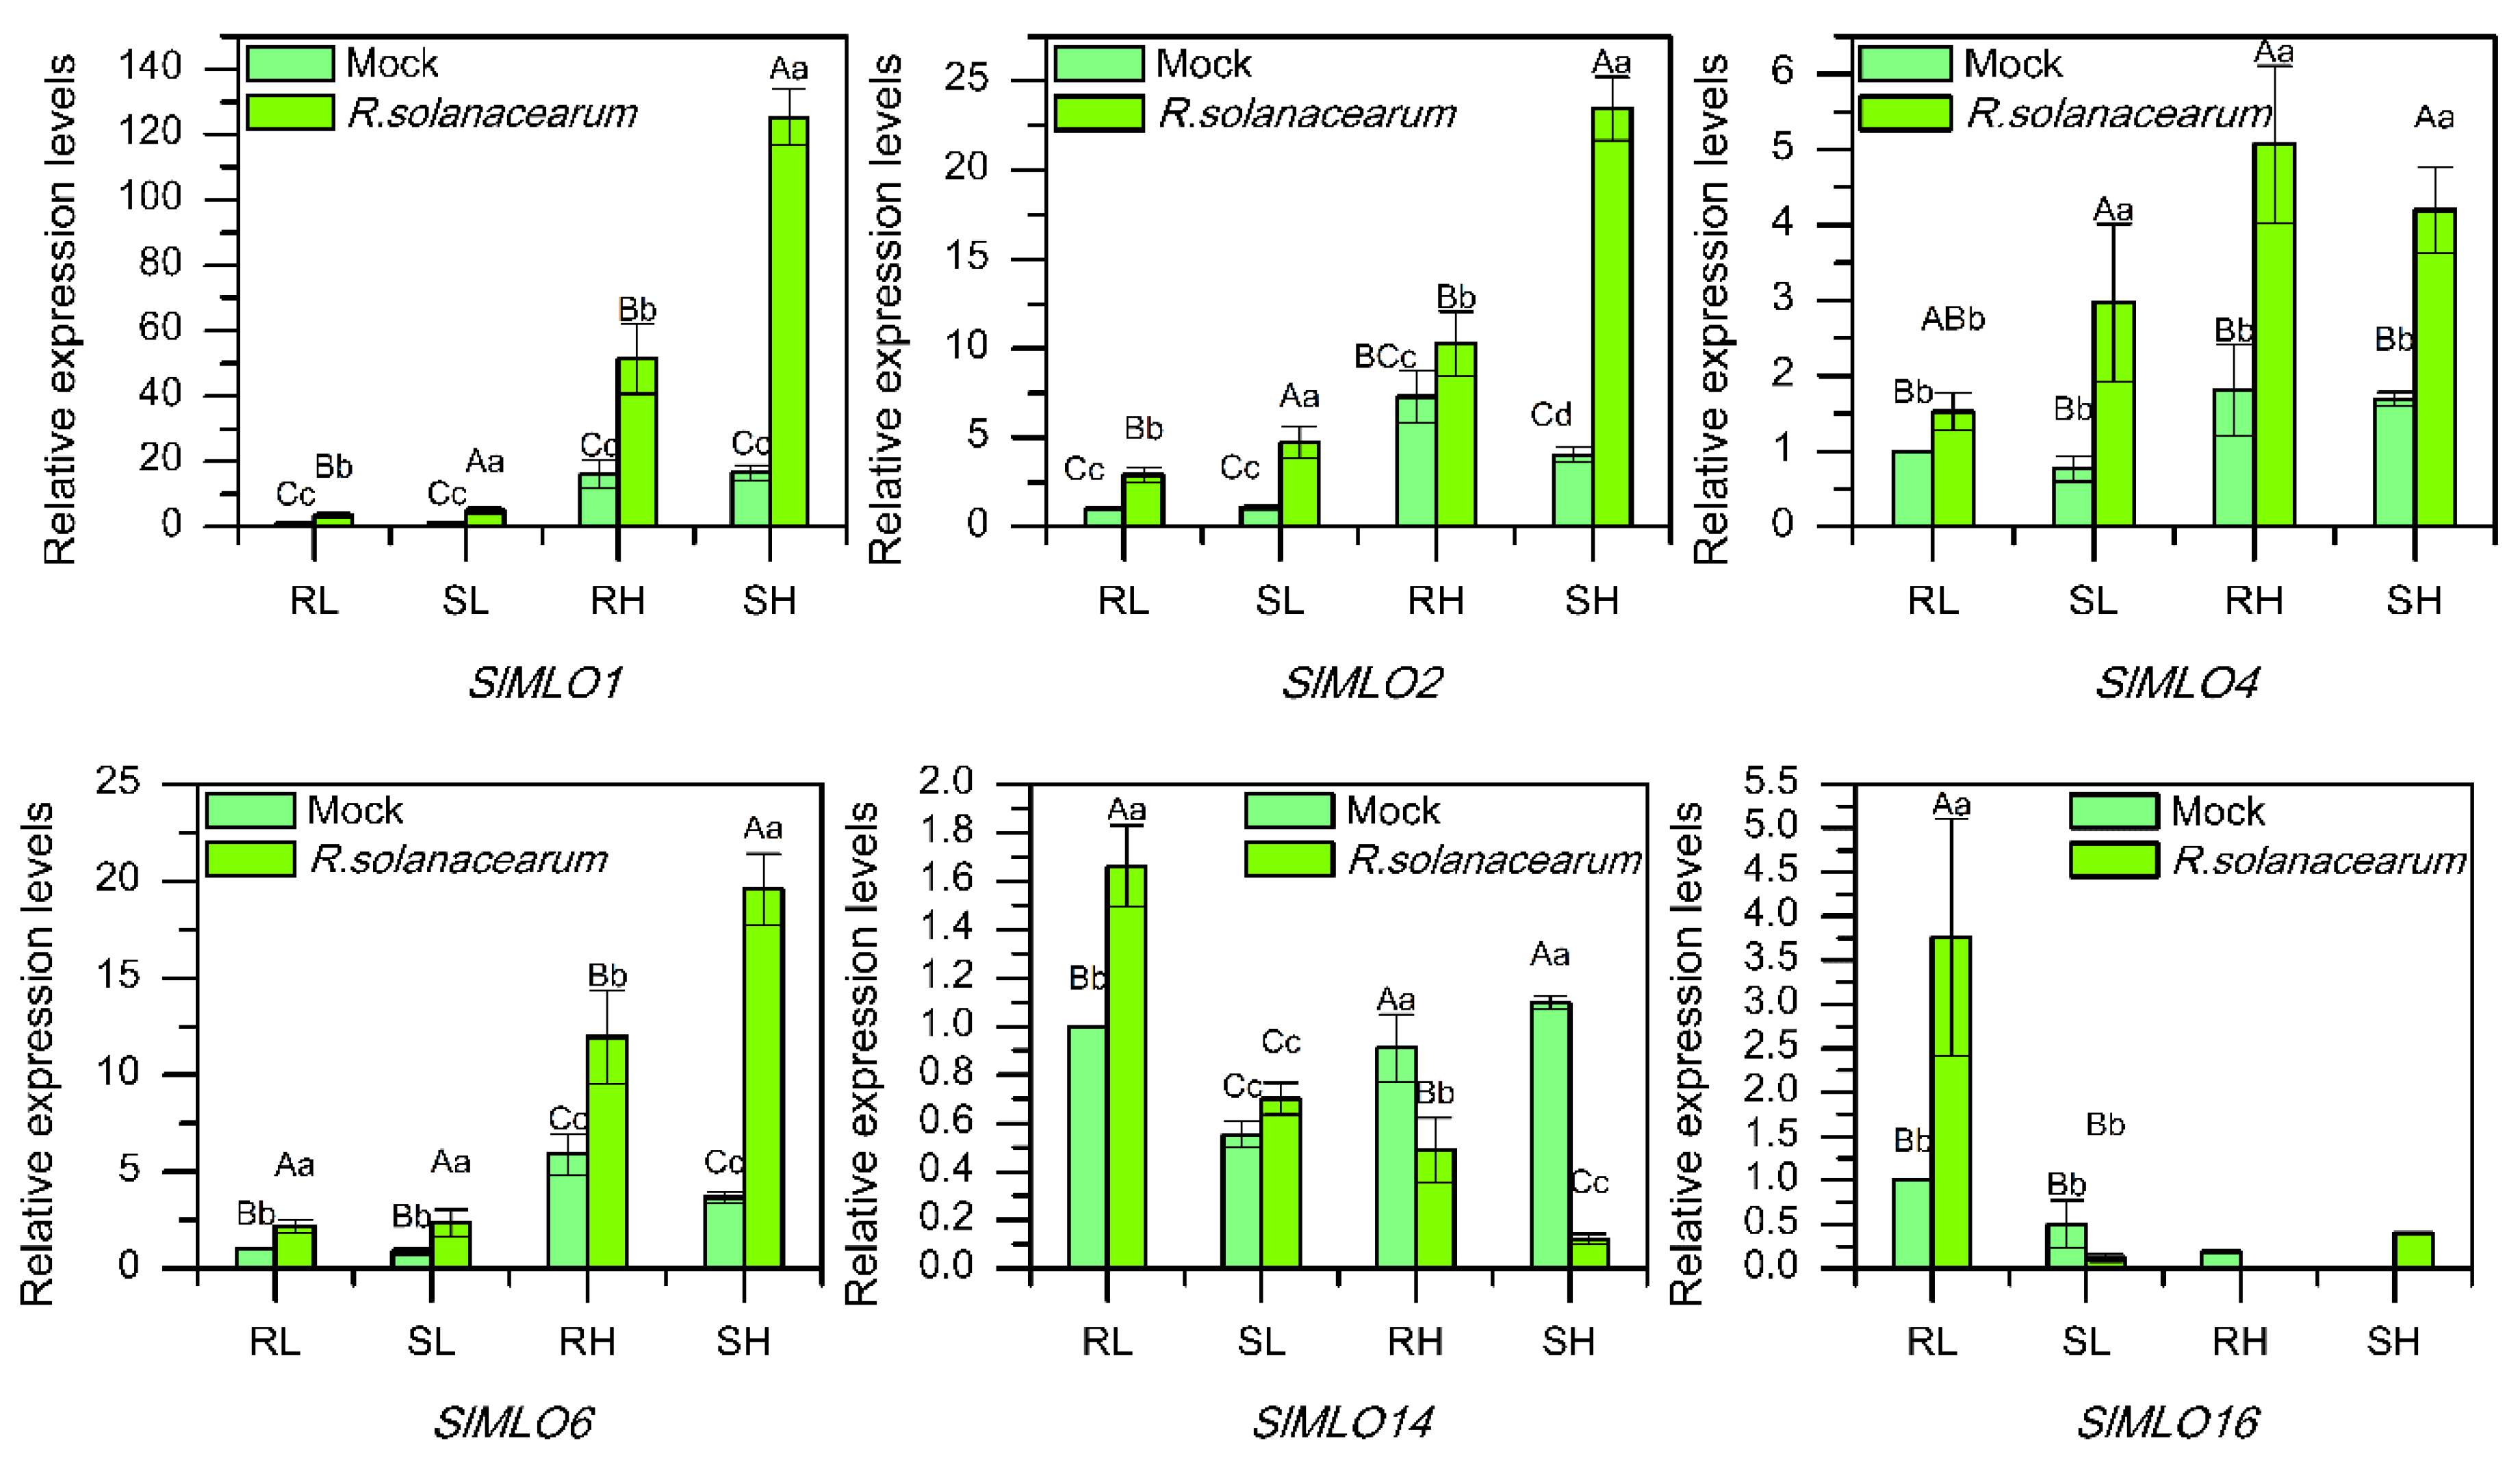
3.8. Transcriptional Response of SlMLO Genes to R. solanacearum

Six representative SlMLO genes were selected for qRT-RCR analysis in light of their promoter elements and digital expression patterns. They all showed a significant response to R. solanacearum infection with different expression patterns (Figure 5). The expression of SlMLO1, SlMLO2, SlMLO4, and SlMLO6 in leaf and whole seedling was all significantly upregulated after inoculation in both of the resistant and the susceptible tomato lines, but the response in the susceptible line was stronger than that in the resistant line in general. SlMLO14 expression was upregulated in leaf but downregulated in whole seedling after inoculation in both lines. However, the degrees of expression change in the two lines were different. The upregulation in leaf was statistically significant only in the resistant line, while the downregulation in whole seedling was much more significant in the susceptible line than in the resistant line. SlMLO16 displayed the opposite response to inoculation both between the two tissues (leaf vs. whole seedling) and between the two lines (resistant vs. susceptible). In leaf, its expression was upregulated in the resistant line but downregulated in the susceptible line; in whole seedling, the situation was just reversed. The above results implied that SlMLO1, SlMLO2, SlMLO4, and SlMLO6 might be involved in the susceptibility response, while SlMLO14 and SlMLO16 might be involved in the resistance response.

4. Discussion

As a kind of negative regulatory factor, the recessively inherited mutation of MLO genes can enable plants to acquire broad-spectrum resistance to powdery mildew. In addition, it also participates in other biotic and abiotic stress responses, indicating that the identification and analysis of MLO genes are of great significance for plant resistance research. In recent years, systematic analysis and comparison of MLO genes have become possible with the completion of genome sequencing of a variety of plants.

4.1. MLO Genes had Specific Sequence Characteristics in Different Species

It has been shown that MLO genes originated at the early stage of land plant evolution [25]. They probably evolved in unicellular photosynthetic eukaryotes, and consolidated in land plants [26]. In this study, 197 MLO genes were identified from 28 species, including green algae and charophyte (Table S1), which support the above conclusion [27]. There was no deterministic relation between the number of MLO genes and the genome size in a species. For example, P. sitchensis had a larger genome, but only possessed one MLO gene, whereas P. trichocarpa, V. vinifera, and A. thaliana had smaller genomes but contained more MLO genes. In light of the number and size of MLO genes, it was speculated that extensive gene expansion, loss, and indels occurred in the process of plant evolution. Higher plant MLO genes contain 5–8 TMs, most of which were 7. However, it was slightly fewer in algae, with a large variation. In addition, MLO genes only partially had a CaMBD to bind with CaM to facilitate protein activity [8]. Most MLO genes were located in the cell membrane, and the function may be dependent on membrane signal transduction. The analyses of gene sequence polymorphism information and haplotype diversity showed that MLO genes had a rich genetic diversity (Table 3 and Table 4).

4.2. Duplication Was Widespread in Plant MLO Genes

In this study, MLO genes were found to be unevenly distributed on specific chromosomes or scaffolds, and mainly located at the ends (Figure S1), similar to other family genes. It is found that genes located at the ends may be easier to mutate in evolution [28,29]. Gene duplication is an important mechanism for plant gene family evolution. Tandem duplication genes are anchored in the same chromosome in clusters, and segment duplication genes are usually dispersed on different chromosomes [30]. It was found that 24.1% of MLO genes exist in clusters, and there were 5.7% and 36.2% tandem duplicates and segment duplicates, respectively (Figure 1 and Figure S1). All tandem duplication genes exist in clusters, suggesting that gene clusters and duplications are ubiquitous, and tandem duplication is an important way to form a gene cluster. This was obvious in P. trichocarpa, grape, and A. trichopoda. Segment duplication is more likely to appear in monocots. However, not all highly similar genes can form tandem duplicates. There may have been a gene insertion event during evolution. In addition, nearly 50% of duplication genes are in the opposite order on the chromosomes, suggesting that inversion may have occurred in these regions during plant evolution.

4.3. Numerous Homologs Were Ascertained in the Phylogenetic Relationships

This study showed that the identified MLO genes could be divided into three groups (I, II and III; Figure 2). Genes from angiosperms were mainly in subgroup I A, genes from S. moellendorffii were in subgroup I A and III B, genes from P. patens were in subgroup I B and III A, and almost all algae genes were in group II. It was speculated that MLO genes might have originated from higher algae and experienced different evolutionary processes in different species. AT1G11310, AT1G61560, AT2G39200, Solyc04g049090.2, GRMZM2G032219, and LOC_Os06g29110 are known in function, so other genes in the same groups can be regarded as candidate resistance genes [31,32]. They provide important genetic resources for follow-up resistance breeding. Given that the six genes above were in different subgroups, it was speculated that the specific anti-powdery mildew function appeared after the differentiation of monocots and dicots. It showed the gene expansion in different species and chromosomes based on mixed branches with different genes. New gene features may arise due to changes to which the chromosome is subjected during evolution, such as recombination, replication, transposition, translocation, and deletion [33].
This study revealed that 52.4% of MLO genes had 1–4 homologs according to the sequence similarity, gene duplication, and phylogenetic relationship (Figure 1 and Figure 2, Table S2), suggesting that the doubling events had occurred in different degrees during evolution, but this proportion was less than that previously reported [34]. Only four pairs of homologous genes resulted from tandem duplication, which may be that a large number of duplication genes had function differentiation in evolution. There were 10 pairs of orthologous genes and 8 pairs of paralogous genes in P. trichocarpa. More than 50% genes had orthologous genes in B. distachyon. More than 50% genes had paralogous genes in P. trichocarpa, A. thaliana, S. moellendorffii, and P. patens, respectively. These results indicate that the expansion of most genes is specie-specific. This phenomenon is common in other plant gene families [28,29]. Increasingly resistant gene copies means enhanced gene function, but MLO homologous genes might have been lost in evolution.
While synonymous mutations do not change amino acid sequences, non-synonymous mutations are often deleterious. Therefore, the base substitution rate is lower under purifying selection. In this study, it was found that the Ka/Ks values of plant MLO homologous genes were all less than 1 (ranging 0.01–0.78; Table S2), indicating that the MLO genes underwent purifying selection in evolution. This was consistent with the nucleotide balance test. Deshmukh et al [31] also achieved the same conclusion. As mutant genes are usually at a disadvantage in selection and thus eliminated in the population, the evolution power may be from genetic drift [35].

4.4. MLO Genes Could Respond to Various Biotic Stresses in Tomato

It was found in this study that SlMLO1, SlMLO2, SlMLO6, SlMLO7, and SlMLO14 were highly expressed in different tissues in tomato (Figure 4A). Some genes had the tissue expression specificity. For example, SlMLO3 is mainly expressed in flowers and roots, SlMLO4 and SlMLO8 are mainly expressed in roots, and SlMLO9 and SlMLO12 are mainly expressed in buds and flowers. SlMLO1, SlMLO3, SlMLO4, SlMLO8, and SlMLO16 could strongly respond to diverse biotic stresses (Figure 4B). Also, miRNA could potentially target one or more SlMLO genes (Table 5).
It was first found in barley that MLO genes have powdery mildew resistance and the recessively inherited mutation has high efficiency and lasting resistance to almost all physiological races of powdery mildew [7]. Besides, MLO genes can also participate in the responses to other diseases caused by Hyaloperonospora arabidopsidis, Xanthomonas campestris, Magnaporthe oryzae, Pseudomonas syringae, Fusarium oxysporum, and Colletotrichum higginsianum, as well as to abiotic stresses such as drought, salt, high and low temperatures [1,2,3,4,5,6], revealing the great potential and broad prospect in plant disease resistance research. In this study, for the first time, MLO genes were found to be able to respond to tomato bacterial wilt with diverse and complex expressions (Figure 5). It was speculated that SlMLO1, SlMLO2, SlMLO4, and SlMLO6 may be involved in the susceptibility response, but SlMLO14 and SlMLO16 were the opposite. However, the direct function still needs molecular verification, and the related regulatory mechanism also needs further analysis.
Although gene expression can induce plant resistance, high expression of a large number of R genes is often lethal to plant cells. In view of this, coordinating R gene expression by small RNA (miRNA and siRNA) regulation is an important protective mechanism to reduce plant burden [36]. The cis-acting regulatory elements in promoters are not completely consistent with the actual gene expression level. On the one hand, the gene expression is related to diverse factors, on the other hand, many cis-acting elements may have not been identified [37,38].

5. Conclusions

MLO genes from 28 plant species were comprehensively analyzed based on the whole genome data and the bioinformatics method. A total of 197 MLO genes were identified, which were unevenly distributed on specific chromosomes or scaffolds, forming 19 gene clusters and 66 pairs of duplicates. These MLO genes could be classified into three groups by phylogenetic analysis. There were 25 pairs of orthologous genes and 28 pairs of paralogous genes. In tomato, some MLO genes were highly expressed in different tissues and under biotic stresses. For tomato bacterial wilt, SlMLO1, SlMLO2, SlMLO4, and SlMLO6 appeared to be involved in the susceptibility response, SlMLO14 and SlMLO16 being the opposite. In short, plant MLO genes tend to exist in clusters, having evolved into a large number of homologous genes, and some genes can reversely respond to different stresses.

Supplementary Materials

The following are available online at https://www.mdpi.com/2073-4425/11/5/487/s1. Figure S1: Chromosomal localization, gene clusters, and gene duplication of MLO genes. Table S1: MLO genes in different plant species and their sequence characteristics. Table S2: 53 pairs of homologous genes and their base substitution rates.

Author Contributions

Conceptualization, H.W. and W.Z.; data curation and validation, J.S. and W.Z.; formal analysis, J.S.; investigation, J.S.; resources, Z.X.; methodology, H.W.; writing—original draft, J.S.; writing—revise and editing, W.W. and H.W.; funding acquisition, W.W. All authors have read and agreed to the published version of the manuscript.

Funding

This research was funded by the Sci-Tech Development Foundation of Fujian Agriculture and Forestry University (KF2015081, KF2015082), and the Science and Technology Major Project of Breeding of New Agricultural Varieties of Zhejiang (2016C02051-1-2).

Acknowledgments

We would like to thank Shuilin He, Jiahong Yu, and Lei Shen for technical assistance, and Zan’ge Jing, Biao Jiang, and Zong’an Huang for suggestions to improve and clarify the manuscript.

Conflicts of Interest

The authors declare that they have no conflict of interest.

References

  1. Kim, D.S.; Hwang, B.K. The pepper MLO gene, CaMLO2, is involved in the susceptibility cell-death response and bacterial and oomycete proliferation. Plant. J. 2012, 72, 843–855. [Google Scholar] [CrossRef] [PubMed]
  2. Kim, D.S.; Choi, H.W.; Hwang, B.K. Pepper mildew resistance locus O interacts with pepper calmodulin and suppresses Xanthomonas AvrBsT-triggered cell death and defense responses. Planta 2014, 240, 827–839. [Google Scholar] [CrossRef] [PubMed]
  3. Lim, C.W.; Lee, S.C. Functional roles of the pepper MLO protein gene, CaMLO2, in abscisic acid signaling and drought sensitivity. Plant. Mol. Biol. 2014, 85, 1–10. [Google Scholar] [CrossRef] [PubMed]
  4. Nguyen, V.N.T.; Vo, K.T.X.; Park, H.; Jeon, J.-S.; Jung, K.-H. A systematic view of the MLO family in rice suggests their novel roles in morphological development, diurnal responses, the light-signaling pathway, and various stress responses. Front. Plant. Sci. 2016, 7, 1413. [Google Scholar] [CrossRef] [PubMed] [Green Version]
  5. Acevedo-Garcia, J.; Gruner, K.; Reinstädler, A.; Kemen, A.; Kemen, E.; Cao, L.; Takken, F.L.W.; Reitz, M.U.; Schäfer, P.; O’Connell, R.J.; et al. The powdery mildew-resistant Arabidopsis mlo2 mlo6 mlo12 triple mutant displays altered infection phenotypes with diverse types of phytopathogens. Sci. Rep. 2017, 7, 9319. [Google Scholar] [CrossRef]
  6. Howlader, J.; Park, J.-I.; Kim, H.-T.; Ahmed, N.U.; Robin, A.H.K.; Sumi, K.R.; Natarajan, S.; Nou, I.-S. Differential expression under Podosphaera xanthii and abiotic stresses reveals candidate MLO family genes in Cucumis melo L. Trop. Plant. Biol. 2017. [Google Scholar] [CrossRef]
  7. Jørgensen, J.H. Discovery, characterization and exploitation of Mlo powdery mildew resistance in barley. Euphytica 1992, 63, 141–152. [Google Scholar] [CrossRef]
  8. Kim, M.C.; Lee, S.H.; Kim, J.K.; Chun, H.J.; Choi, M.S.; Chung, W.S.; Moon, B.C.; Kang, C.H.; Park, C.Y.; Yoo, J.H.; et al. Mlo, a modulator of plant defense and cell death, is a novel calmodulin-binding protein. J. Biol. Chem. 2002, 277, 19304–19314. [Google Scholar] [CrossRef] [Green Version]
  9. Liu, Q.; Zhu, H. Molecular evolution of the MLO gene family in Oryza sativa and their functional divergence. Gene 2008, 409, 1–10. [Google Scholar] [CrossRef]
  10. Consonni, C.; Humphry, M.E.; Hartmann, H.A.; Livaja, M.; Durner, J.; Westphal, L.; Vogel, J.; Lipka, V.; Kemmerling, B.; Schulze–Lefert, P.; et al. Conserved requirement for a plant host cell protein in powdery mildew pathogenesis. Nat. Genet. 2006, 38, 716–720. [Google Scholar] [CrossRef]
  11. Zheng, Z.; Appiano, M.; Pavan, S.; Bracuto, V.; Ricciardi, L.; Visser, R.G.F.; Wolters, A.-M.A.; Bai, Y. Genome-wide study of the tomato SlMLO gene family and its functional characterization in response to the powdery mildew fungus Oidium neolycopersici. Front. Plant. Sci. 2016, 7, 380. [Google Scholar] [CrossRef] [PubMed] [Green Version]
  12. Feechan, A.; Jermakow, A.M.; Torregrosa, L.; Panstruga, R.; Dry, I.B. Identification of grapevine MLO gene candidates involved in susceptibility to powdery mildew. Funct. Plant. Biol. 2008, 35, 1255–1266. [Google Scholar] [CrossRef]
  13. Zhou, S.J.; Jing, Z.; Shi, J.L. Genome-wide identification, characterization, and expression analysis of the MLO gene family in Cucumis sativus. Genet. Mol. Res. 2013, 12, 6565–6578. [Google Scholar] [CrossRef] [PubMed]
  14. Pessina, S.; Pavan, S.; Catalano, D.; Gallotta, A.; Visser, R.G.F.; Bai, Y.; Malnoy, M.; Schouten, H.J. Characterization of the MLO gene family in Rosaceae and gene expression analysis in Malus domestica. BMC Genom. 2014, 15, 618. [Google Scholar] [CrossRef] [PubMed] [Green Version]
  15. Mohapatra, C.; Chand, R.; Singh, V.K.; Singh, A.K.; Kushwaha, C. Identification and characterisation of Mlo genes in pea (Pisum sativum L.) vis-à-vis validation of Mlo gene-specific markers. Turk. J. Biol. 2016, 40, 184–195. [Google Scholar] [CrossRef] [Green Version]
  16. Wang, X.; Ma, Q.; Dou, L.; Liu, Z.; Peng, R.; Yu, S. Genome-wide characterization and comparative analysis of the MLO gene family in cotton. Plant. Physiol. Biochem. 2016, 103, 106–119. [Google Scholar] [CrossRef]
  17. Filiz, E.; Vatansever, R. Genome-wide identification of mildew resistance locus O (MLO) genes in tree model poplar (Populus trichocarpa): Powdery mildew management in woody plants. Eur. J. Plant. Pathol. 2018, 152, 95–109. [Google Scholar] [CrossRef]
  18. Polanco, C.; SaÂenz de Miera, L.E.; Bett, K.; PeÂrez de la Vega, M. A genome-wide identification and comparative analysis of the lentil MLO genes. PLoS ONE 2018, 13, e0194945. [Google Scholar] [CrossRef]
  19. Win, K.T.; Zhang, C.Y.; Lee, S. Genome-wide identification and description of MLO family genes in pumpkin (Cucurbita maxima Duch.). Hortic. Environ. Biotechnol. 2018, 59, 397–410. [Google Scholar] [CrossRef]
  20. Appiano, M.; Catalano, D.; Martínez, M.S.; Lotti, C.; Zheng, Z.; Visser, R.G.F.; Ricciardi, L.; Bai, Y.; Pavan, S. Monocot and dicot MLO powdery mildew susceptibility factors are functionally conserved in spite of the evolution of class-specific molecular features. BMC Plant. Biol. 2015, 15, 257. [Google Scholar] [CrossRef] [Green Version]
  21. Meyers, B.C.; Kozik, A.; Griego, A.; Kuang, H.; Michelmore, R.W. Genome-wide analysis of NBS-LRR-encoding genes in Arabidopsis. Plant. Cell 2003, 15, 809–834. [Google Scholar] [CrossRef] [PubMed] [Green Version]
  22. Yang, S.; Zhang, X.; Yue, J.X.; Tian, D.; Chen, J.-Q. Recent duplications dominate NBS-encoding gene expansion in two woody species. Mol. Genet. Genomics 2008, 280, 187–198. [Google Scholar] [CrossRef] [PubMed]
  23. Huang, S.; Gao, Y.; Liu, J.; Peng, X.; Niu, X.; Fei, Z.; Cao, S.; Liu, Y. Genome-wide analysis of WRKY transcription factors in Solanum lycopersicum. Mol. Genet. Genom. 2012, 287, 495–513. [Google Scholar] [CrossRef] [PubMed]
  24. Chen, C.; Xia, R.; Chen, H.; He, Y. TBtools, a Toolkit for Biologists integrating various HTS-data handling tools with a user-friendly interface. BioRxiv 2018. [Google Scholar] [CrossRef]
  25. Devoto, A.; Hartmann, H.A.; Piffanelli, P.; Elliott, C.; Simmons, C.; Taramino, G.; Goh, C.-S.; Cohen, F.E.; Emerson, B.C.; Schulze-Lefert, P.; et al. Molecular phylogeny and evolution of the plant-specific seven-transmembrane MLO family. J. Mol. Evol. 2003, 56, 77–88. [Google Scholar] [CrossRef]
  26. Kusch, S.; Pesch, L.; Panstruga, R. Comprehensive phylogenetic analysis sheds light on the diversity and origin of the MLO family of integral membrane proteins. Genome Biol. Evol. 2016, 8, 878–895. [Google Scholar] [CrossRef] [Green Version]
  27. Wang, S.; Li, L.; Li, H.; Sahu, S.K.; Wang, H.; Xu, Y.; Xian, W.; Song, B.; Liang, H.; Cheng, S.; et al. Genomes of early-diverging streptophyte algae shed light on plant terrestrialization. Nat. Plants 2019. [Google Scholar] [CrossRef] [Green Version]
  28. Yang, X.; Wang, J. Genome-wide analysis of NBS-LRR genes in sorghum genome revealed several events contributing to NBS-LRR gene evolution in grass species. Evol. Bioinform. 2016, 12, 9–21. [Google Scholar] [CrossRef] [Green Version]
  29. Yu, J.; Cheng, Y.; Feng, K.; Ruan, M.; Ye, Q.; Wang, R.; Li, Z.; Zhou, G.; Yao, Z.; Yang, Y.; et al. Genome-wide identification and expression profiling of tomato hsp20 gene family in response to biotic and abiotic stresses. Front. Plant. Sci. 2016, 7, 1215. [Google Scholar] [CrossRef] [Green Version]
  30. Schauser, L.; Wieloch, W.; Stougaard, J. Evolution of NIN-like proteins in Arabidopsis, rice and Lotus japonicas. J. Mol. Evol. 2005, 60, 229–237. [Google Scholar] [CrossRef]
  31. Deshmukh, R.; Singh, V.K.; Singh, B.D. Comparative phylogenetic analysis of genome-wide Mlo gene family members from Glycine max and Arabidopsis thaliana. Mol. Genet. Genom. 2014, 289, 345–359. [Google Scholar] [CrossRef] [PubMed]
  32. Berg, J.A.; Appiano, M.; Bijsterbosch, G.; Visser, R.G.F.; Schouten, H.J.; Bai, Y. Functional characterization of cucumber (Cucumis sativus L.) Clade V MLO genes. BMC Plant. Biol. 2017, 17, 80. [Google Scholar] [CrossRef] [PubMed]
  33. Gao, H.; Zhang, Y.; Hu, S.; Guo, Y. Genome-wide survey and phylogenetic analysis of MADS-box gene family in Brassica napus. Chin. Bull. Bot. 2017, 52, 699–712. [Google Scholar] [CrossRef]
  34. Yan, P.; Zhou, S.; Li, X.; Zhao, S.; Zhou, H.; Zhou, Y.H.; Xu, S.L.; Ke, T. Genome-wide comparative analysis of MLO related genes in Brassica lineage. Chin. J. Oil Crop. Sci. 2017, 39, 729–736. [Google Scholar] [CrossRef]
  35. Edwards, A.W.F. The genetical theory of natural selection. Genetics 2000, 154, 1419–1426. [Google Scholar]
  36. Zhai, J.; Jeong, D.-H.; De Paoli, E.; Park, S.; Rosen, B.D.; Li, Y.; González, A.J.; Yan, Z.; Kitto, S.L.; Grusak, M.A.; et al. MicroRNAs as master regulators of the plant NB-LRR defense gene family via the production of phased, trans-acting siRNAs. Genes Dev. 2011, 25, 2540–2553. [Google Scholar] [CrossRef] [PubMed] [Green Version]
  37. Banerjee, N.; Zhang, M.Q. Functional genomics as applied to mapping transcription regulatory networks. Curr. Opin. Microbiol. 2002, 5, 313–317. [Google Scholar] [CrossRef]
  38. Andolfo, G.; Iovieno, P.; Ricciardi, L.; Lotti, C.; Filippone, E.; Pavan, S.; Ercolano, M.R. Evolutionary conservation of MLO gene promoter signatures. BMC Plant. Biol. 2019, 19, 150. [Google Scholar] [CrossRef] [Green Version]
Figure 1. The synteny relationship of MLO genes among nine plant species. Bd, B. distachyon; Os, O. sativa; Zm, Z. mays; Sl, S. lycopersicum; Cs, C. sativus; Vv, V. vinifera; Pt, P. trichocarpa, and At, A. trichopoda. The gene pairs were linked by the lines between chromosomes.
Genes 11 00487 g001
Figure 2. The phylogenetic tree of MLO genes in 28 plant species. The phylogenetic tree was constructed using the amino acid sequences of MLO conserved domains via maximum likelihood (ML) method. The selected 164 MLO genes were distributed on six clades.
Genes 11 00487 g002
Figure 3. Cis-acting regulatory elements in the promoters of different SlMLO genes.
Genes 11 00487 g003
Figure 4. The expression of 17 SlMLO genes in different tissues (A) and under pathogen infection (B). (A) Expression in tomato cultivar Heinz and Solanum pimpinellifolium. MG, mature green; IM, immature green; B, breaker; B5, breaker + 5; B10, breaker + 10. (B) Expression in tomato leaves treated with different bacteria and PAMPs.
Genes 11 00487 g004
Figure 5. The relative expression levels of six SlMLO genes in resistant and susceptible tomato lines inoculated with R. solanacearum. R, resistant line; S, susceptible lines; L, leaf; H, whole seedling. Error bar indicates standard deviation. The uppercase and lowercase letters above the error bars indicate statistically significant differences (Tukey’s test, p < 0.01 and p < 0.05). The replication data of SlMLO16 expression analysis in whole seedlings were missed.
Genes 11 00487 g005
Table 1. Plant species investigated in this study.
SpeciesGenome Size/Mb *Lineage
Solanum lycopersicum L.792.04Dicot
Cucumis sativus L.323.99
Populus trichocarpa Torr. & Gary434.29
Arabidopsis thaliana (L.) Heynh119.67
Vitis vinifera L.427.19
Brachypodium distachyon (L.) Beauv.218.35Monocot
Oryza sativa L.383.72
Zea mays L.2171.65
Amborella trichopoda Baill.706.50Basalmost angiosperm
Picea sitchensis Engelm18225.20Gymnosperm
Selaginella moellendorffii Hieron.212.32Fern
Physcomitrella patens (Hedw.) Mitt.472.08Bryophyte
Volvox carteri F.Stein137.68Algae
Chlamydomonas reinhardtii P.A. Dangeard120.41
Chlorella variabilis46.16
Chlorella sorokiniana58.61
Gonium pectorale O.F. Müller148.81
Monoraphidium neglectum69.71
Auxenochlorella protothecoides (Krüger) T. Kalina & M. Puncochárová22.92
Micractinium conductrix61.02
Chlamydomonas eustigma66.63
Micromonas sp. RCC29921.11
Micromonas pusilla CCMP154521.96
Ostreococcus tauri13.90
Ostreococcus lucimarinus13.20
Bathycoccus prasinos W. Eikrem & J. Throndsen15.07
Chara vulgaris L./
Ectocarpus siliculosus (Dillw.) Lyngb.195.81
* The data were retrieved from NCBI (www.ncbi.nlm.nih.gov). /, data not found.
Table 2. Primers used for qRT-PCR.
GeneForward Primer (5′–3′)Reverse Primer (5′–3′)
SlRPL2GTCATCCTTTCAGGTACAAGCACGTTACAAACAACAGCTCCTTC
SlMLO1GCAAACAGCAGACCAACCATTTCATTAGCCCACCCTTCA
SlMLO2CGCGTGCTTGAAGCTGATGACCAAAGGGAACAAATGCTA
SlMLO4CAAGGTCCTCTGTGGGTTCAGCACGGATTATCGGTGTAGTT
SlMLO6TGAATGTTAGCGGGTGGCAAGGCAAAATGAATGAGGTGA
SlMLO14GTGGGGATTTGTGGTGGGAAGTTCGTCTCGTGGTTTTAGC
SlMLO16TGGCTTCATTACGGCACATCTCCAACTTAGTCCCAATCACC
Table 3. Intra-species polymorphism and haplotype diversity of MLO genes.
SpeciesS% SSPPIPEtahHdPiK
Solanum lycopersicum86382.66947691818141.000 ± 0.0270.45364473.604
Cucumis sativus74780.06986491513121.000 ± 0.0340.44781417.803
Populus trichocarpa88285.22847981878241.000 ± 0.0120.42523440.112
Arabidopsis thaliana86381.49737901799151.000 ± 0.0240.44542471.705
Vitis vinifera94281.35798632013171.000 ± 0.0200.43146499.625
Brachypodium distachyon88579.731377481794121.000 ± 0.0340.43561483.530
Oryza sativa85977.18241618150271.000 ± 0.0760.45463506.000
Zea mays74578.591106351479111.000 ± 0.0390.43750414.745
Amborella trichopoda110677.61257849201871.000 ± 0.0760.47549677.571
Selaginella moellendorffii63172.03114517110381.000 ± 0.0630.41553364.000
Physcomitrella patens87078.801127581762111.000 ± 0.0390.45469501.982
Volvox carteri175053.4217500175021.000 ± 0.5000.534191750.000
Chlamydomonas reinhardtii259158.4725910259121.000 ± 0.5000.584742591.000
S, number of variable sites; SP, singleton variable sites; PIP, parsimony informative sites; Eta, total number of mutations; h, number of haplotypes; Hd, haplotype diversity; Pi, nucleotide diversity; K, average number of nucleotide differences.
Table 4. Neutral testing and base substitution of MLO genes in different species.
SpeciesDD *F *RmSSNSSKa/Ks
Solanum lycopersicum−0.778220.26621−0.02567102237.08806.920.2144
Cucumis sativus−0.785810.27567−0.0057990213.24719.760.1617
Populus trichocarpa−0.506590.583730.2768397237.70797.300.1830
Arabidopsis thaliana−0.657470.438780.15009118239.48819.520.1896
Vitis vinifera−0.697470.449970.13406122265.47892.530.1714
Brachypodium distachyon−0.880480.08421−0.19513115257.26852.740.2636
Oryza sativa−1.02985−0.14537−0.38216106256.12856.880.2535
Zea mays−0.868230.05308−0.20977100215.59732.410.2635
Amborella trichopoda−1.04622−0.06242−0.31490156321.551103.450.1958
Selaginella moellendorffii−0.793900.09768−0.1245988203.06672.940.1530
Physcomitrella patens−0.804730.12445−0.1309898259.36844.640.2215
Volvox carteri///0854.172421.830.4734
Chlamydomonas reinhardtii///01230.423200.580.9794
D, Tajima’s D; D *, Fu and Li’s D *; F *, Fu and Li’s F *; Rm, minimum number of recombination events. SS, synonymous sites; NSS, nonsynonymous sites. /, no data available based on DnaSP operation rule.
Table 5. Predicted miRNAs targeting SlMLO genes in tomato.
Gene NameGene IDmiRNA IDAccession no.Mature Sequence
SlMLO2Solyc08g015870sly-miR396a-5pMIMAT0035455UUCCACAGCUUUCUUGAACUG
sly-miR396bMIMAT0035481UUCCACAGCUUUCUUGAACUU
sly-miR6027-5pMIMAT0032133AUGGGUAGCACAAGGAUUAAUG
sly-miR167aMIMAT0007917UGAAGCUGCCAGCAUGAUCUA
sly-miR167b-5pMIMAT0035457UAAAGCUGCCAGCAUGAUCUGG
sly-miR1917MIMAT0007909AUUAAUAAAGAGUGCUAAAGU
SlMLO3Solyc06g010030sly-miR6027-5pMIMAT0032133AUGGGUAGCACAAGGAUUAAUG
SlMLO4Solyc00g007200sly-miR156aMIMAT0009138UUGACAGAAGAUAGAGAGCAC
sly-miR156bMIMAT0009139UUGACAGAAGAUAGAGAGCAC
sly-miR156cMIMAT0009140UUGACAGAAGAUAGAGAGCAC
sly-miR482cMIMAT0023603UCUUGCCAAUACCGCCCAUUCC
SlMLO5Solyc03g095650sly-miR6027-5pMIMAT0032133AUGGGUAGCACAAGGAUUAAUG
sly-miR9469-3pMIMAT0035436AUUCGGUCUUCUUAUGUGGAC
SlMLO7Solyc09g018830sly-miR172aMIMAT0009143AGAAUCUUGAUGAUGCUGCAU
sly-miR172bMIMAT0009144AGAAUCUUGAUGAUGCUGCAU
sly-miR1918MIMAT0007910UGUUGGUGAGAGUUCGAUUCUC
SlMLO8Solyc11g069220sly-miR6027-5pMIMAT0032133AUGGGUAGCACAAGGAUUAAUG
sly-miR9470-3pMIMAT0035440UUUGGCUCAUGGAUUUUAGC
sly-miR9478-3pMIMAT0035474UUCGAUGACAUAUUUGAGCCU
SlMLO10Solyc02g083720sly-miR6022MIMAT0023590UGGAAGGGAGAAUAUCCAGGA
sly-miR9474-5pMIMAT0035463UGUAGAAGUCAUGAAUAAAAUG
SlMLO12Solyc08g067760sly-miR482e-3pMIMAT0032124UCUUUCCUACUCCUCCCAUACC
sly-miR482d-5pMIMAT0035459GGAGUGGGUGGGAUGGAAAAA
sly-miR156aMIMAT0009138UUGACAGAAGAUAGAGAGCAC
sly-miR156bMIMAT0009139UUGACAGAAGAUAGAGAGCAC
sly-miR156cMIMAT0009140UUGACAGAAGAUAGAGAGCAC
sly-miR172aMIMAT0009143AGAAUCUUGAUGAUGCUGCAU
sly-miR172bMIMAT0009144AGAAUCUUGAUGAUGCUGCAU
sly-miR6024MIMAT0023594UUUUAGCAAGAGUUGUUUUACC
SlMLO13Solyc10g044510sly-miR6027-3pMIMAT0023611UGAAUCCUUCGGCUAUCCAUAA
sly-miR156e-5pMIMAT0035453UGAUAGAAGAGAGUGAGCAC
sly-miR9472-3pMIMAT0035450UUCACAAUCUCUGCUGAAAAA
SlMLO14Solyc07g063260sly-miR9469-3pMIMAT0035436AUUCGGUCUUCUUAUGUGGAC
sly-miR1916MIMAT0007908AUUUCACUUAGACACCUCAA
SlMLO15Solyc02g077570sly-miR6022MIMAT0023590UGGAAGGGAGAAUAUCCAGGA
SlMLO16Solyc06g010010sly-miR6025MIMAT0042023UACCAAUAAUUGAGAUAACAUC

