1. Introduction
Breast cancer is the most common cancer and the main cause of cancer deaths besides lung cancer in women [
1]. The number of breast cancer patients is increasing year by year, and the proportion of women under 40 who have breast cancer has already reached 6.6% [
2]. In 2018, there were more than 2 million new breast cancer cases worldwide [
3]. At the same time, as a highly heterogeneous disease, breast cancer is composed of different biological subtypes, with different clinical, pathological, and molecular characteristics, as well as prognostic and therapeutic significance [
4]. Therefore, the study of breast cancer subtypes is of great significance for precision medicine and prognosis prediction of breast cancer [
5]. By understanding the molecular subtypes of breast cancer, doctors can better decide which treatment is suitable for each patient, thus saving money for the whole medical system and avoiding the side effects of unnecessary treatment [
6].
The current research on breast cancer subtypes focuses mainly on the molecular typing. In 1999, molecular typing of cancer was first proposed by the National Cancer Institute (NCI) [
6]. In 2000, Perou et al. first proposed the molecular typing of breast cancer and concluded that breast cancer is divided into four subtypes, namely luminal subtype, basal-like subtype, human epidermal growth subtype and normal breast-like subtype [
7]. Sorlie et al. further subdivided luminal subtype into luminal A and luminal B [
8]. Waks et al. classified breast cancer into three major subtypes based on the presence or absence of molecular markers for estrogen receptor (ER) and progesterone receptor (PR) and human epidermal growth factor 2 (HER2), namely ER+/PR+/HER2- (luminal A), HER2+, and triple-negative breast cancer (TNBC), which have a negative indicator in all three standard molecular markers [
9]. HER2+ subtype can be further divided into two subtypes: ER+/PR+/HER2+ (luminal B) and ER-/PR-/HER2+. Tao et al. classified breast cancer into five subtypes according to immunohistochemistry (IHC) markers, including ER, PR, and HER2 [
6]. These subtypes are luminal A, luminal B, HER2(+), TNBC, and unclear subtype.
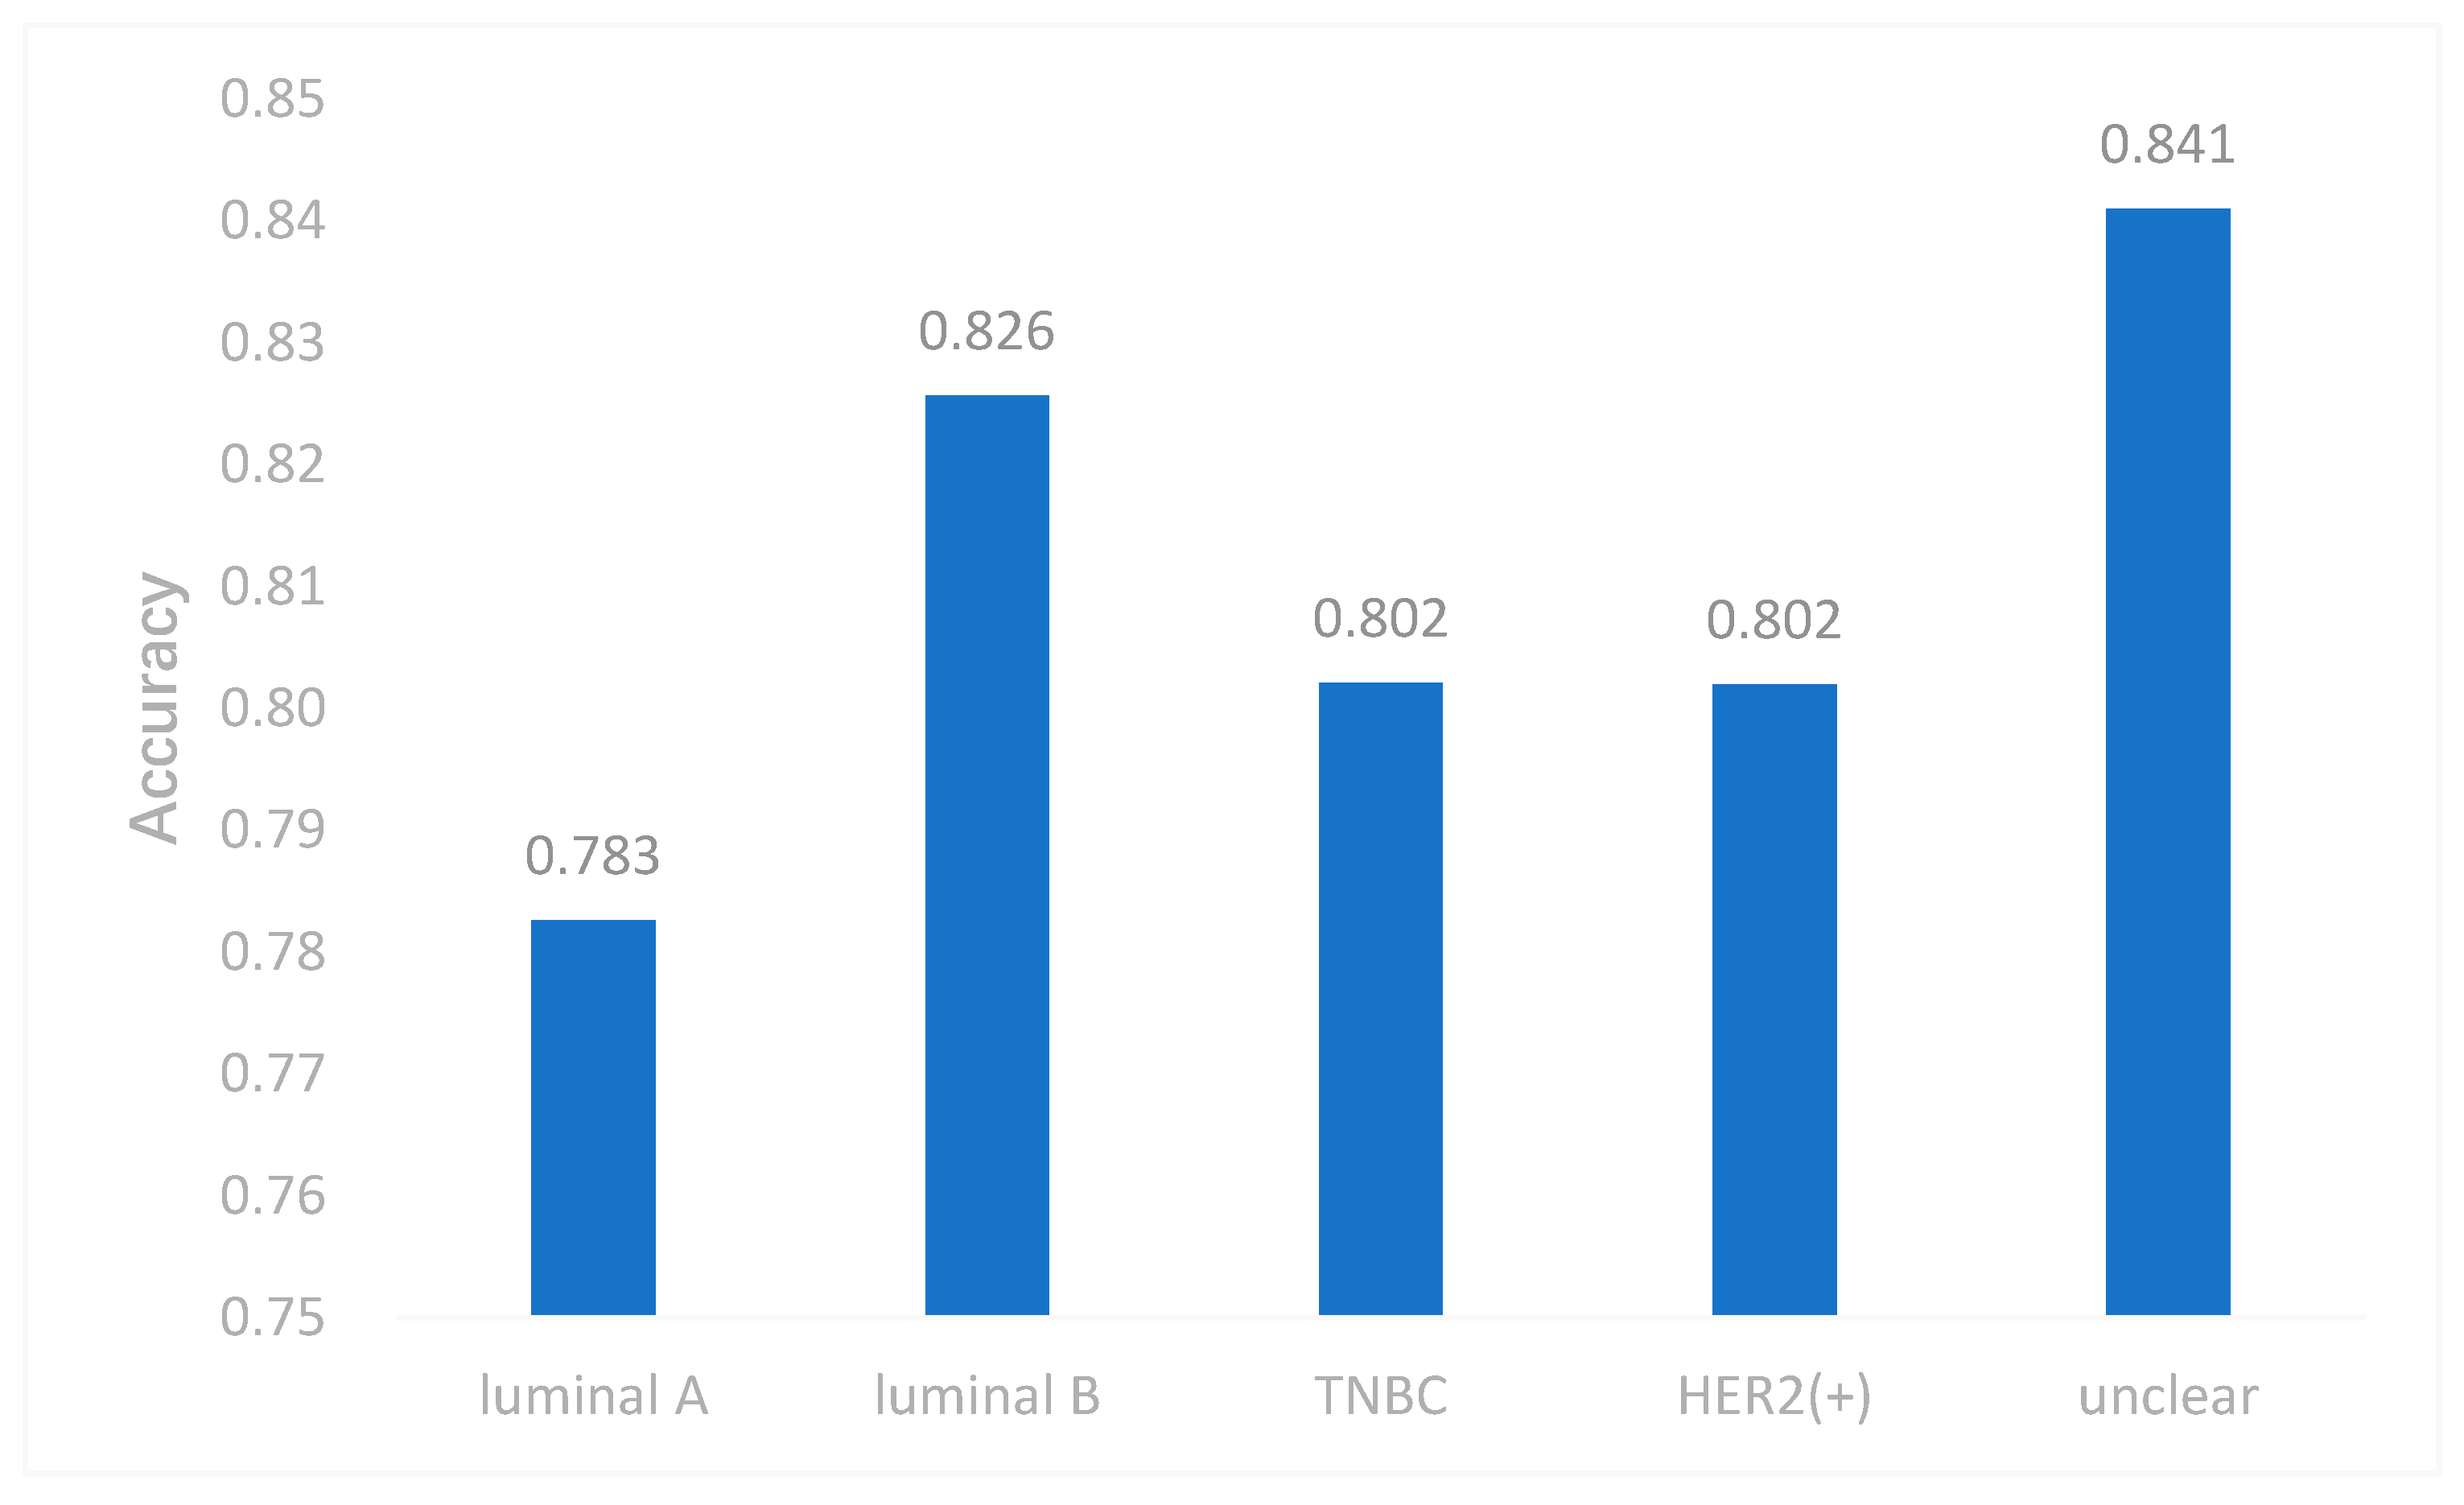
In this article, breast cancer was divided into five subtypes, namely luminal A, luminal B, HER2(+), TNBC, and unclear subtype, the same classification as in a published article [
10]. The detailed definition of each subtype is shown in
Table 1. Luminal A is the most common breast cancer subtype, accounting for as many as 60% of all breast cancers [
11]. This subtype has the highest prognosis among several breast cancer subtypes, and its 5-year local recurrence rate is much lower than other breast cancer subtypes [
12]. Most patients with luminal B are elderly patients. They are similar to luminal A in that they are also sensitive to endocrine therapy. Hormone expression in patients with luminal B is reported to be lower than that of luminal A, whereas the expression and histological grade of proliferation markers are higher than those of luminal A [
13]. HER2-positive breast cancer patients account for about 25%, and the prognosis is poor. Most patients with advanced HER2-positive breast cancer are most likely to metastasize to the axillary lymph nodes. In the treatment, endocrine therapy has almost no effect on it. The TNBC subtype has ER negative, PR negative, and HER2-negative [
6]. Compared with other breast cancer subtypes, TNBC has rapid deterioration and metastasis. Because its three receptors are negative, targeted therapy cannot be used during the treatment of this subtype, and its prognosis is poor. Unclear subtype refers to patient samples that lack information on each of the three IHC markers.
With the explosive growth of massive biological data, the transformation of traditional biological statistical methods to computer-aided methods makes machine learning become an important part of predicting cancer prognosis [
14]. If all the features in these samples are used to classify and regress, it will lead to overfitting. Feature selection or reduction, which attempts to find the subset of features that gives the model the best performance, is one of the solutions [
15]. Utilizing the feature selection method can remove the obviously irrelevant and redundant gene features and improve the performance of the model. Furthermore, fewer features usually mean better interpretability and higher training speed in deep neural networks.
At present, the commonly used feature selection methods are mainly divided into the following three types: filter, wrapper, and embedded [
16]. These categories are mainly based on the combination of search process of feature selection and construction process of classification models [
17]. The filter methods are independent of the classifier and only rely on the intrinsic attributes of the data to select relevant features [
18]. In the wrapper methods, the classification score of the features by the classifier is measured during the selection process, and the feature selection step depends on the classifier [
19]. In other words, the wrapper feature selection method is to select the most fruitful feature subset for the given classifier. In the embedded methods, the step of selecting the optimal feature subset is embedded in the construction of the classifier, and the selection process can be regarded as the combined space of feature subsets and hypotheses [
16]. They are completed in the same optimization process. It means that feature selection is automatically carried out during learner training. In general, when comparing complex wrappers and embedded methods to the filtering methods, the computational complexity of the former two methods is always higher, and the performance is not as good as the simple filtering method [
20].
With the continuous development and improvement of high-throughput technology, there are increasingly more types of omics data obtained through high-throughput technology. Based on these omics data, there have been many studies on the classification of breast cancer subtypes. Brian D. Lehmann et al. used gene expression data to perform cluster analysis to determine the subtypes of triple-negative breast cancer [
21]. Sorlie et al. achieved the classification of breast cancer subtypes by constructing a gene expression pattern based on hierarchical clustering [
22]. Each type of omics data itself usually provides a list of differences associated with the disease [
23]. However, the analysis of one type of omics data is limited to correlation, mainly reflecting the reaction process rather than the causal process. Multi-omics data are expected to improve the characterization of cross-molecular biological processes, and can provide more comprehensive insights into the biological systems being studied [
24]. The use of multi-omics data for cancer classification has been recently suggested [
25]. Multi-omics data have been used to solve different problems such as precision oncology [
26], driver gene identification [
27], regulatory genomics [
28], and drug response prediction [
29]. Artificial intelligence in cancer science includes not only classification but also diagnostics [
30] as well as prediction of clinical features or identification of interactions. Most importantly, it includes research integrating multi-omics data type [
31]. A further example, such as in [
32], could be likewise included, as well as the one in [
33]. However, there are currently few studies on the classification of breast cancer subtypes based on multi-omics data. Tao et al. used multiple kernel learning (MKL) based on multi-omics data to classify breast cancer subtypes [
6]. MKL is a method widely used in multi-omics data fusion, which can improve the classification performance of original (Support Vector Machine) SVM [
34]. For the classification of breast cancer subtypes, various kernels are generated and normalized using different omics data. Subsequently, after training the MKL model based on these kernels, other multi-omics data can be used to predict based on the trained model.
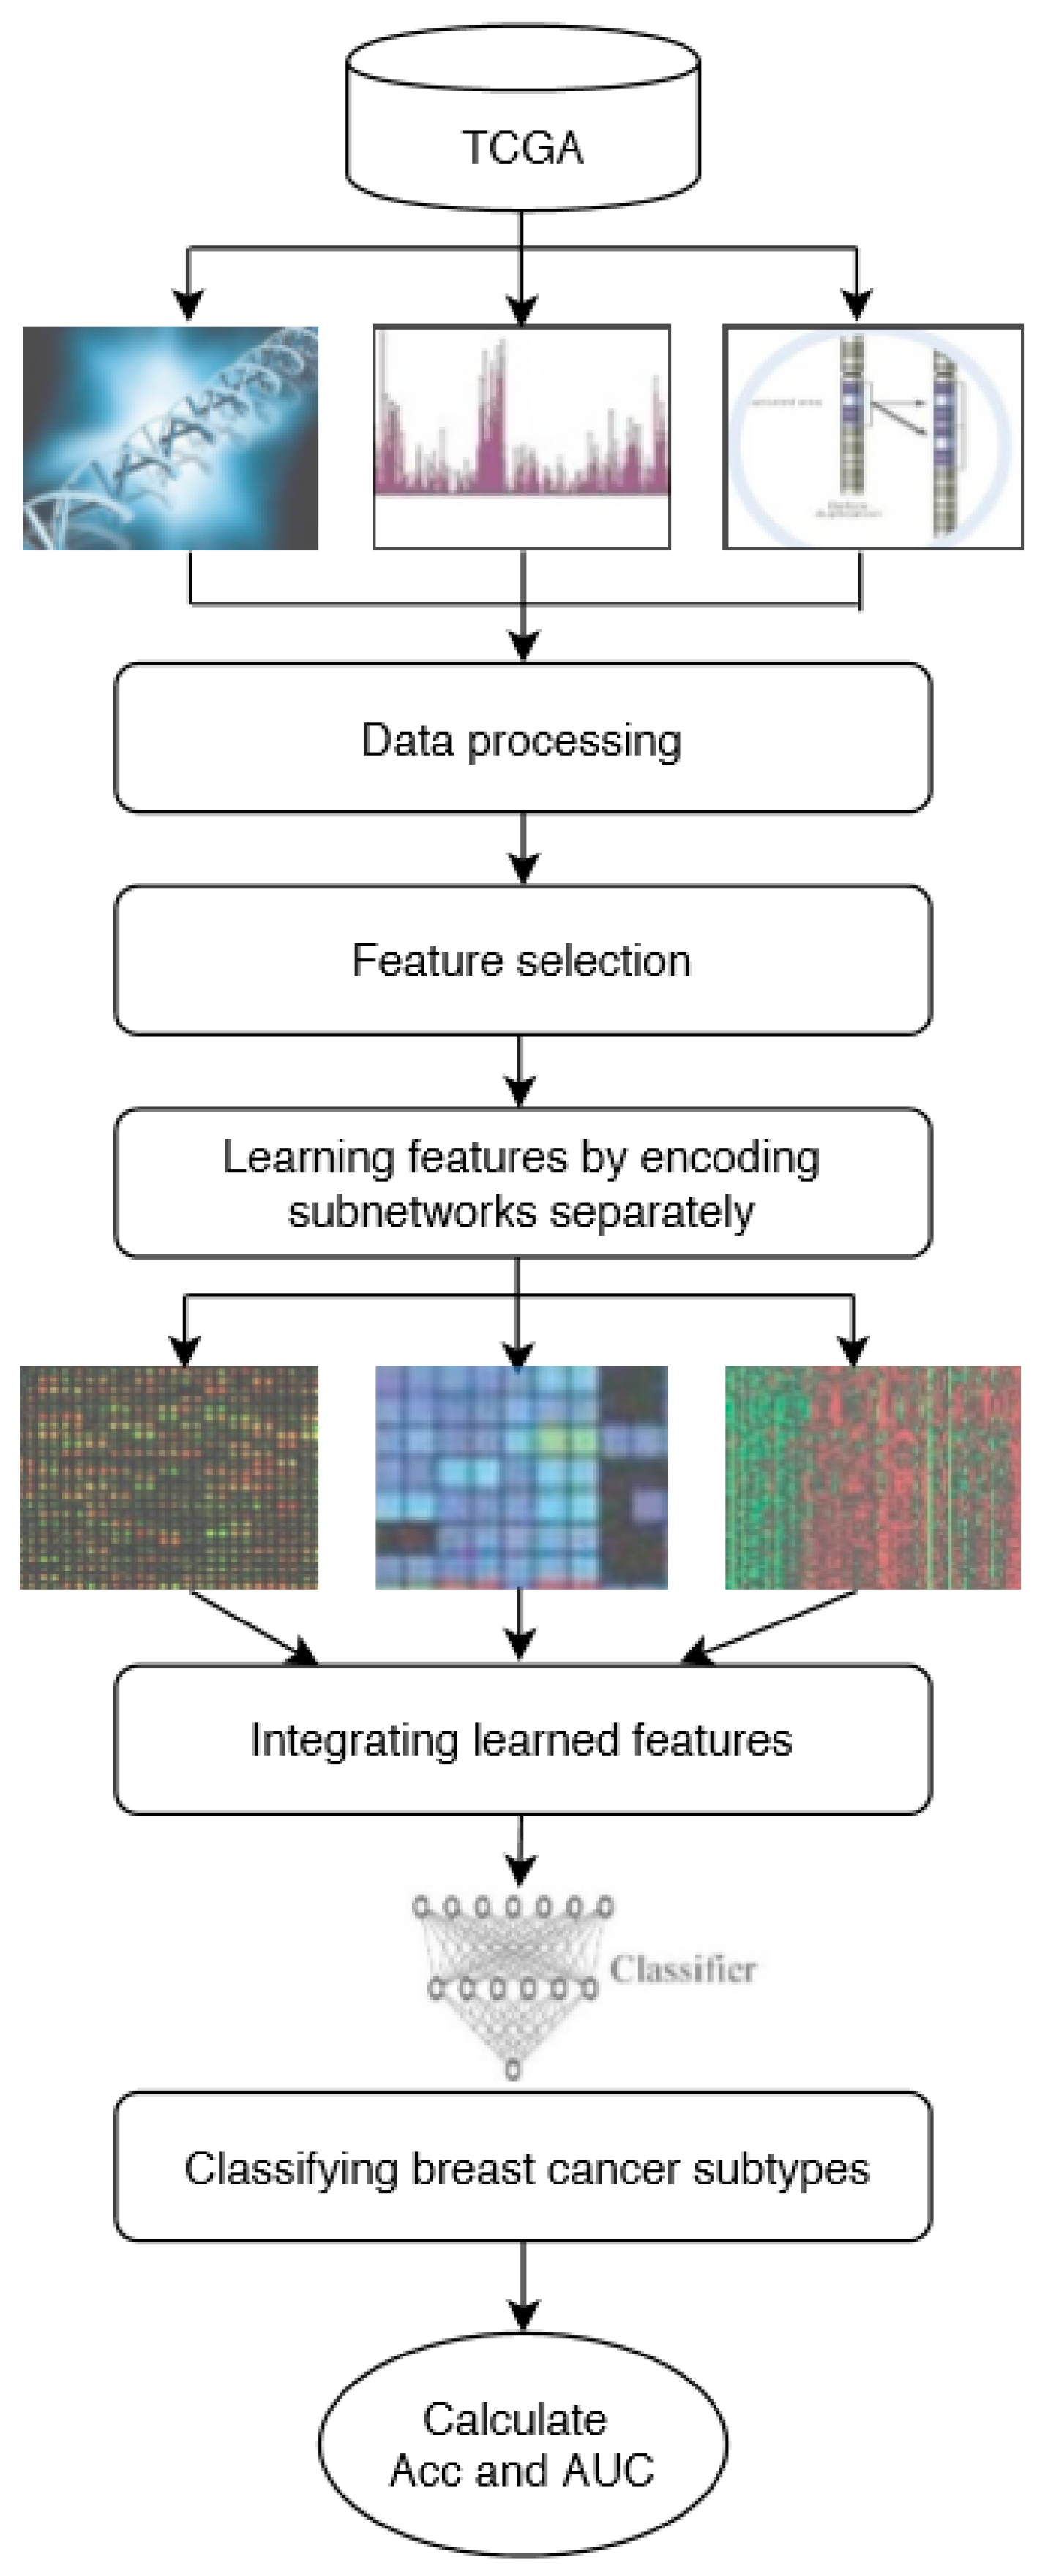
In this study, DeepMO, a model using deep neural networks based on multi-omics data, was employed to classify breast cancer subtypes. DeepMO contains a type-specific encoding subnetwork to learn the features of each omics type and combines features of each omics type, and a classification subnetwork is used to classify different breast cancer subtypes. In this study, the input of DeepMO contains mRNA data, DNA methylation data, and copy number variation (CNV) data, and the output of DeepMO is the predicted molecular subtypes of breast cancer. The workflow of DeepMO is illustrated in
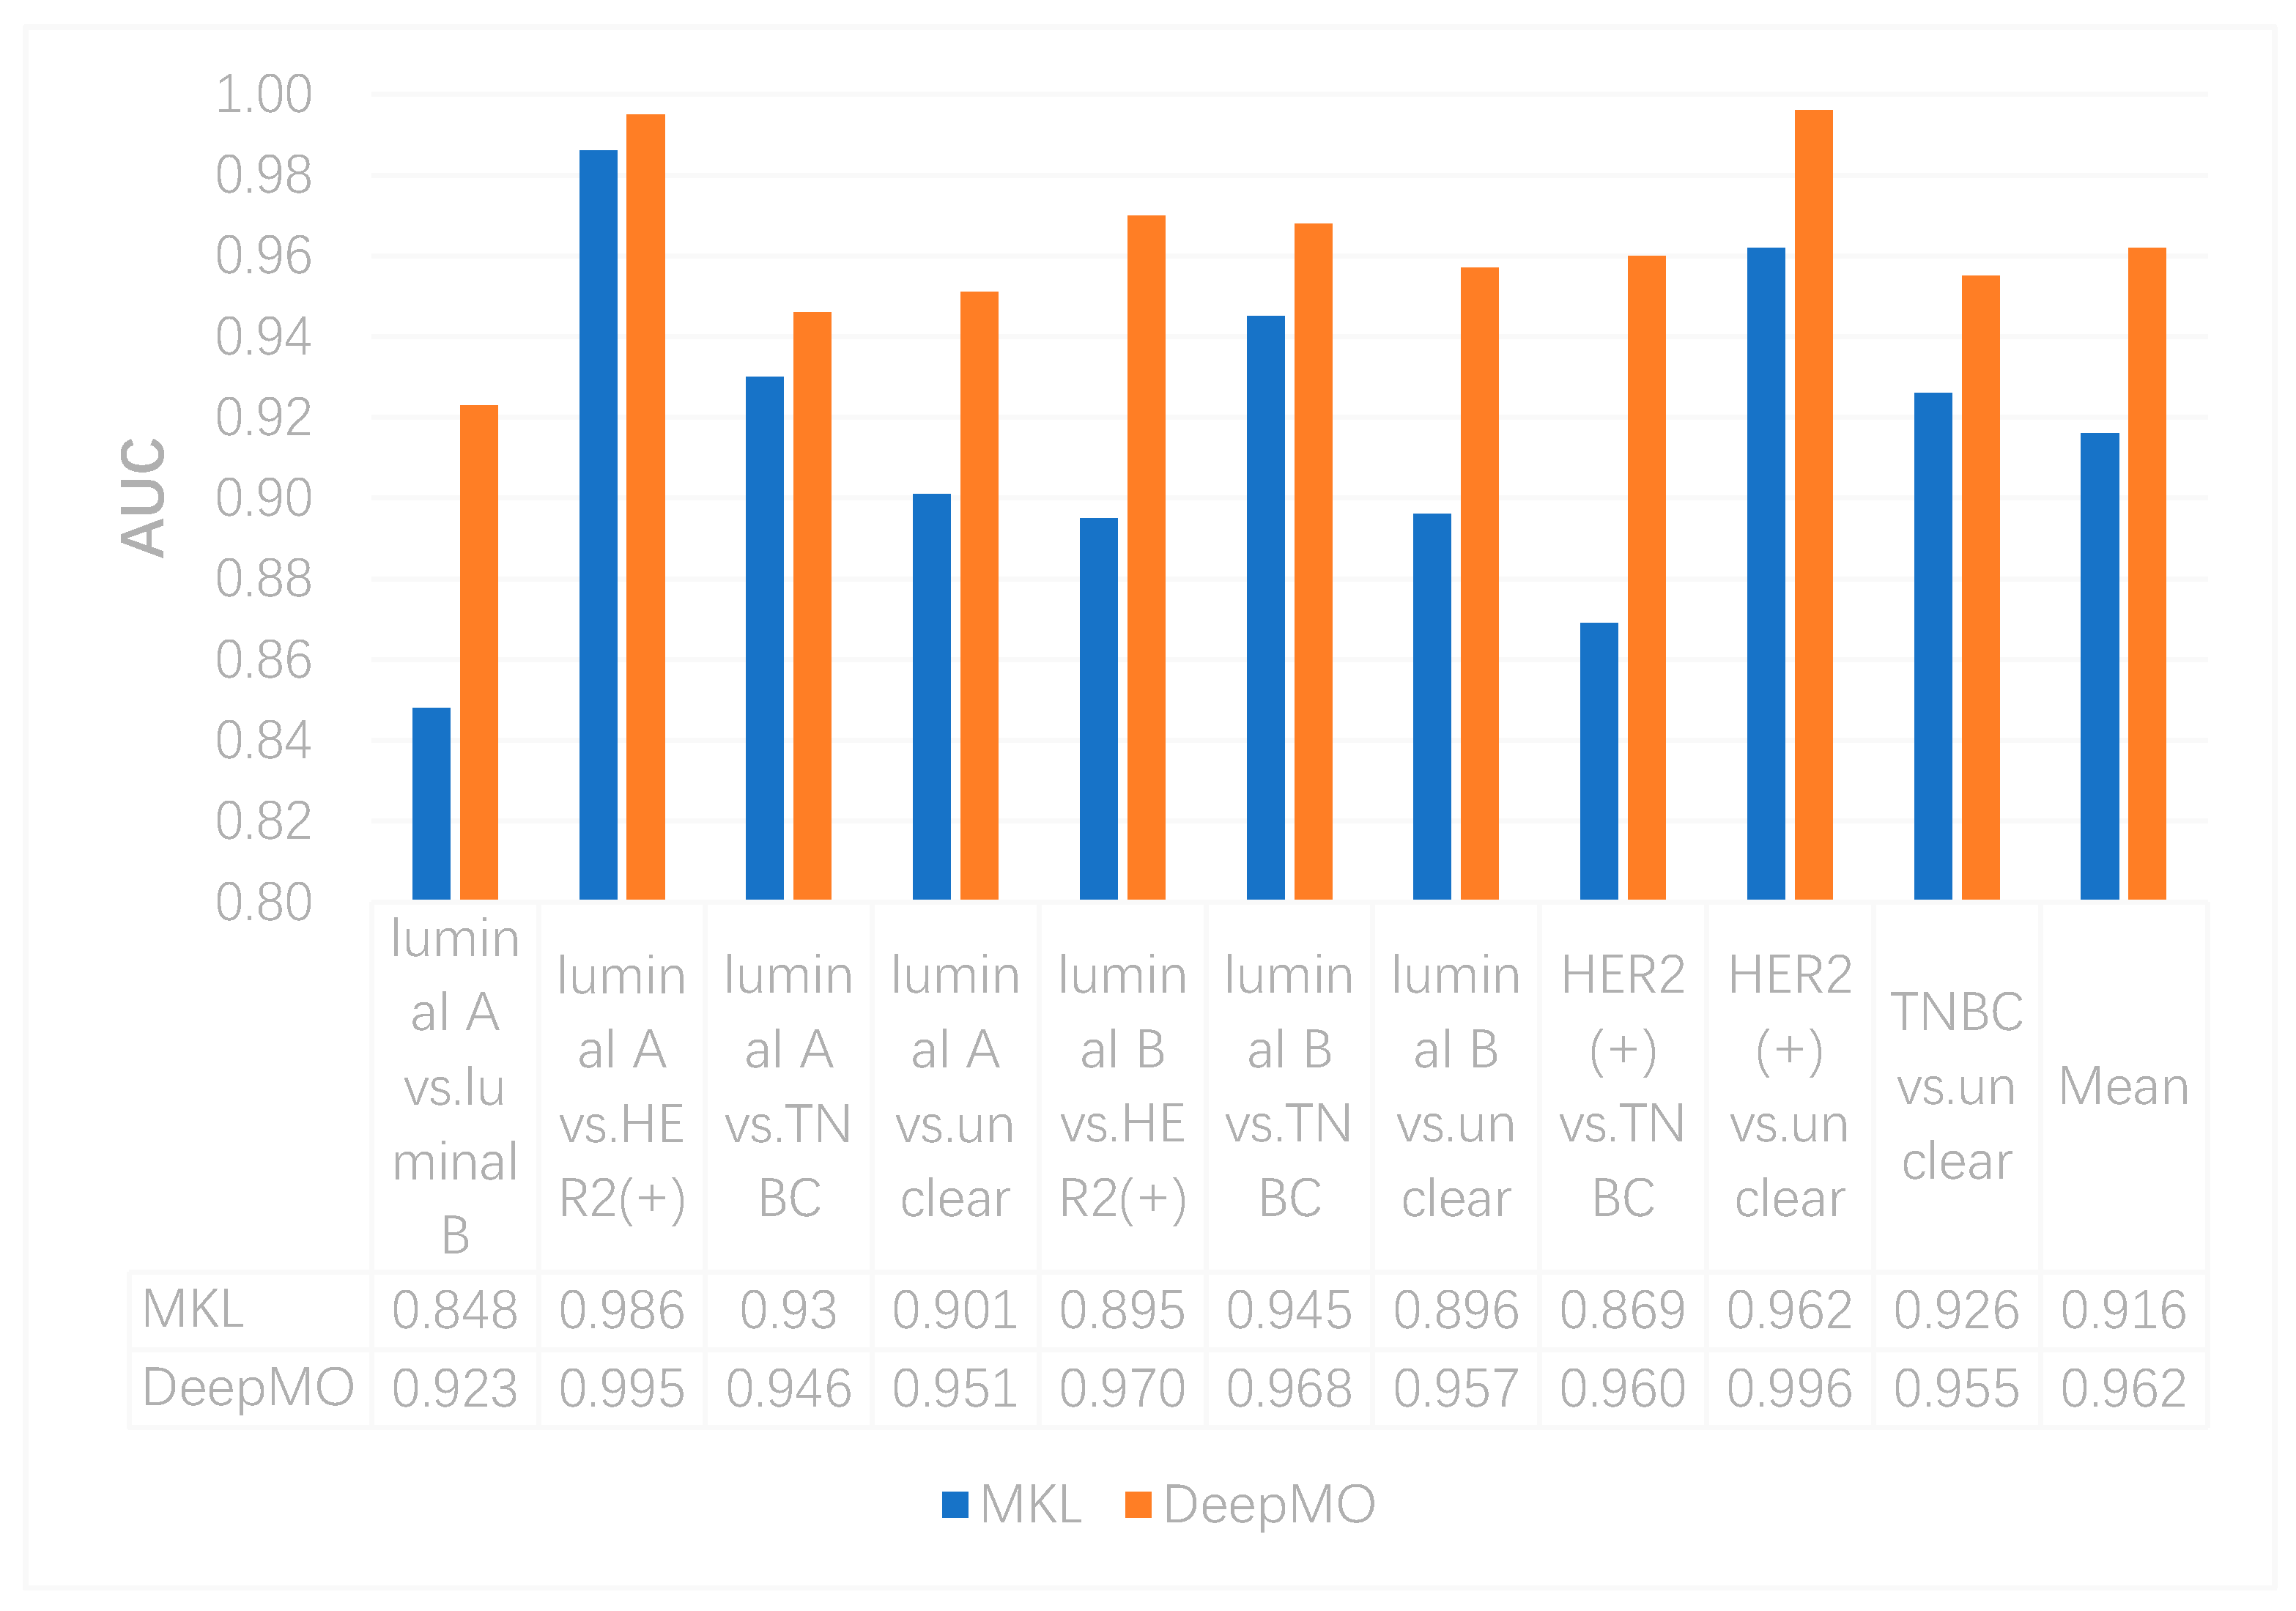
Figure 1. We compared the performances of binary classification based on multi-omics data and single omics data. Moreover, the performances of binary classification using DeepMO and MKL [
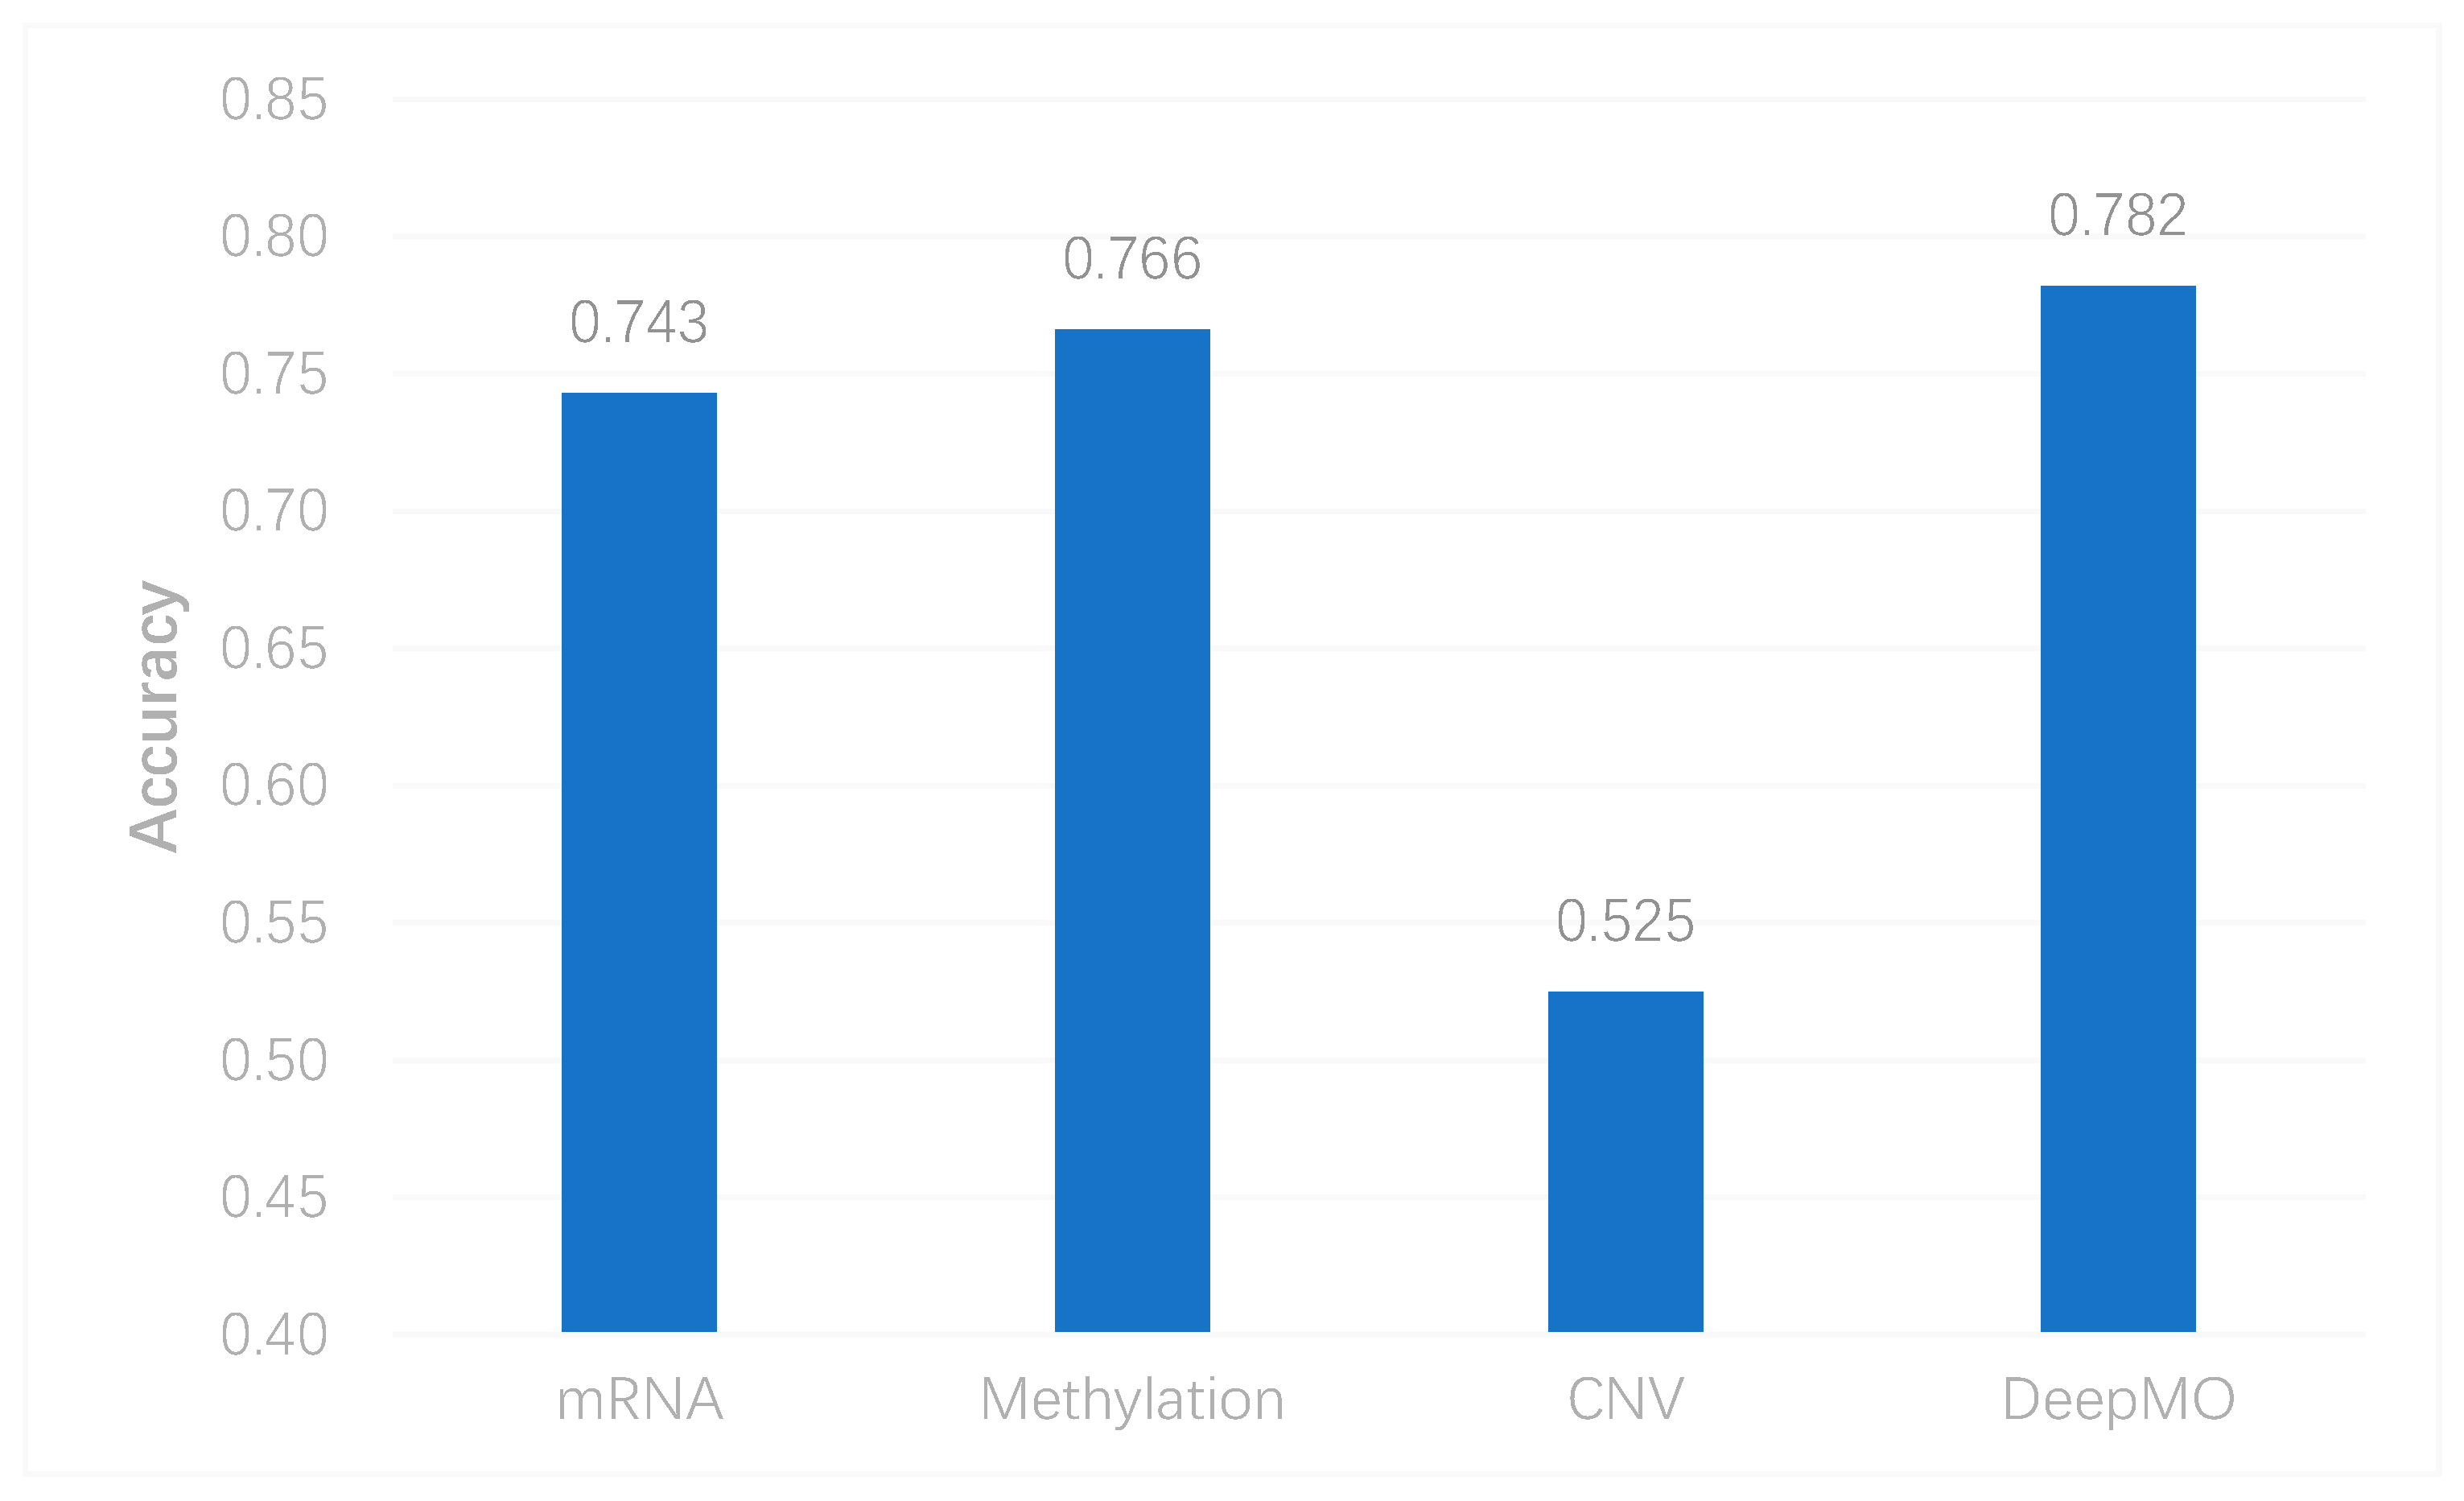
6] were also compared. Then, we compared the performances of multi-classification based on multi-omics data and single omics data. Additionally, the performance of DeepMO on multi-classification was compared with some state-of-the-art data integration methods. Furthermore, we analyzed the effect of feature selection, and validated its role in classification using deep neural networks based on multi-omics data. Finally, we also analyzed the enriched gene ontology (GO) terms and biological pathways of these significant genes discovered during the feature selection process.
4. Discussion
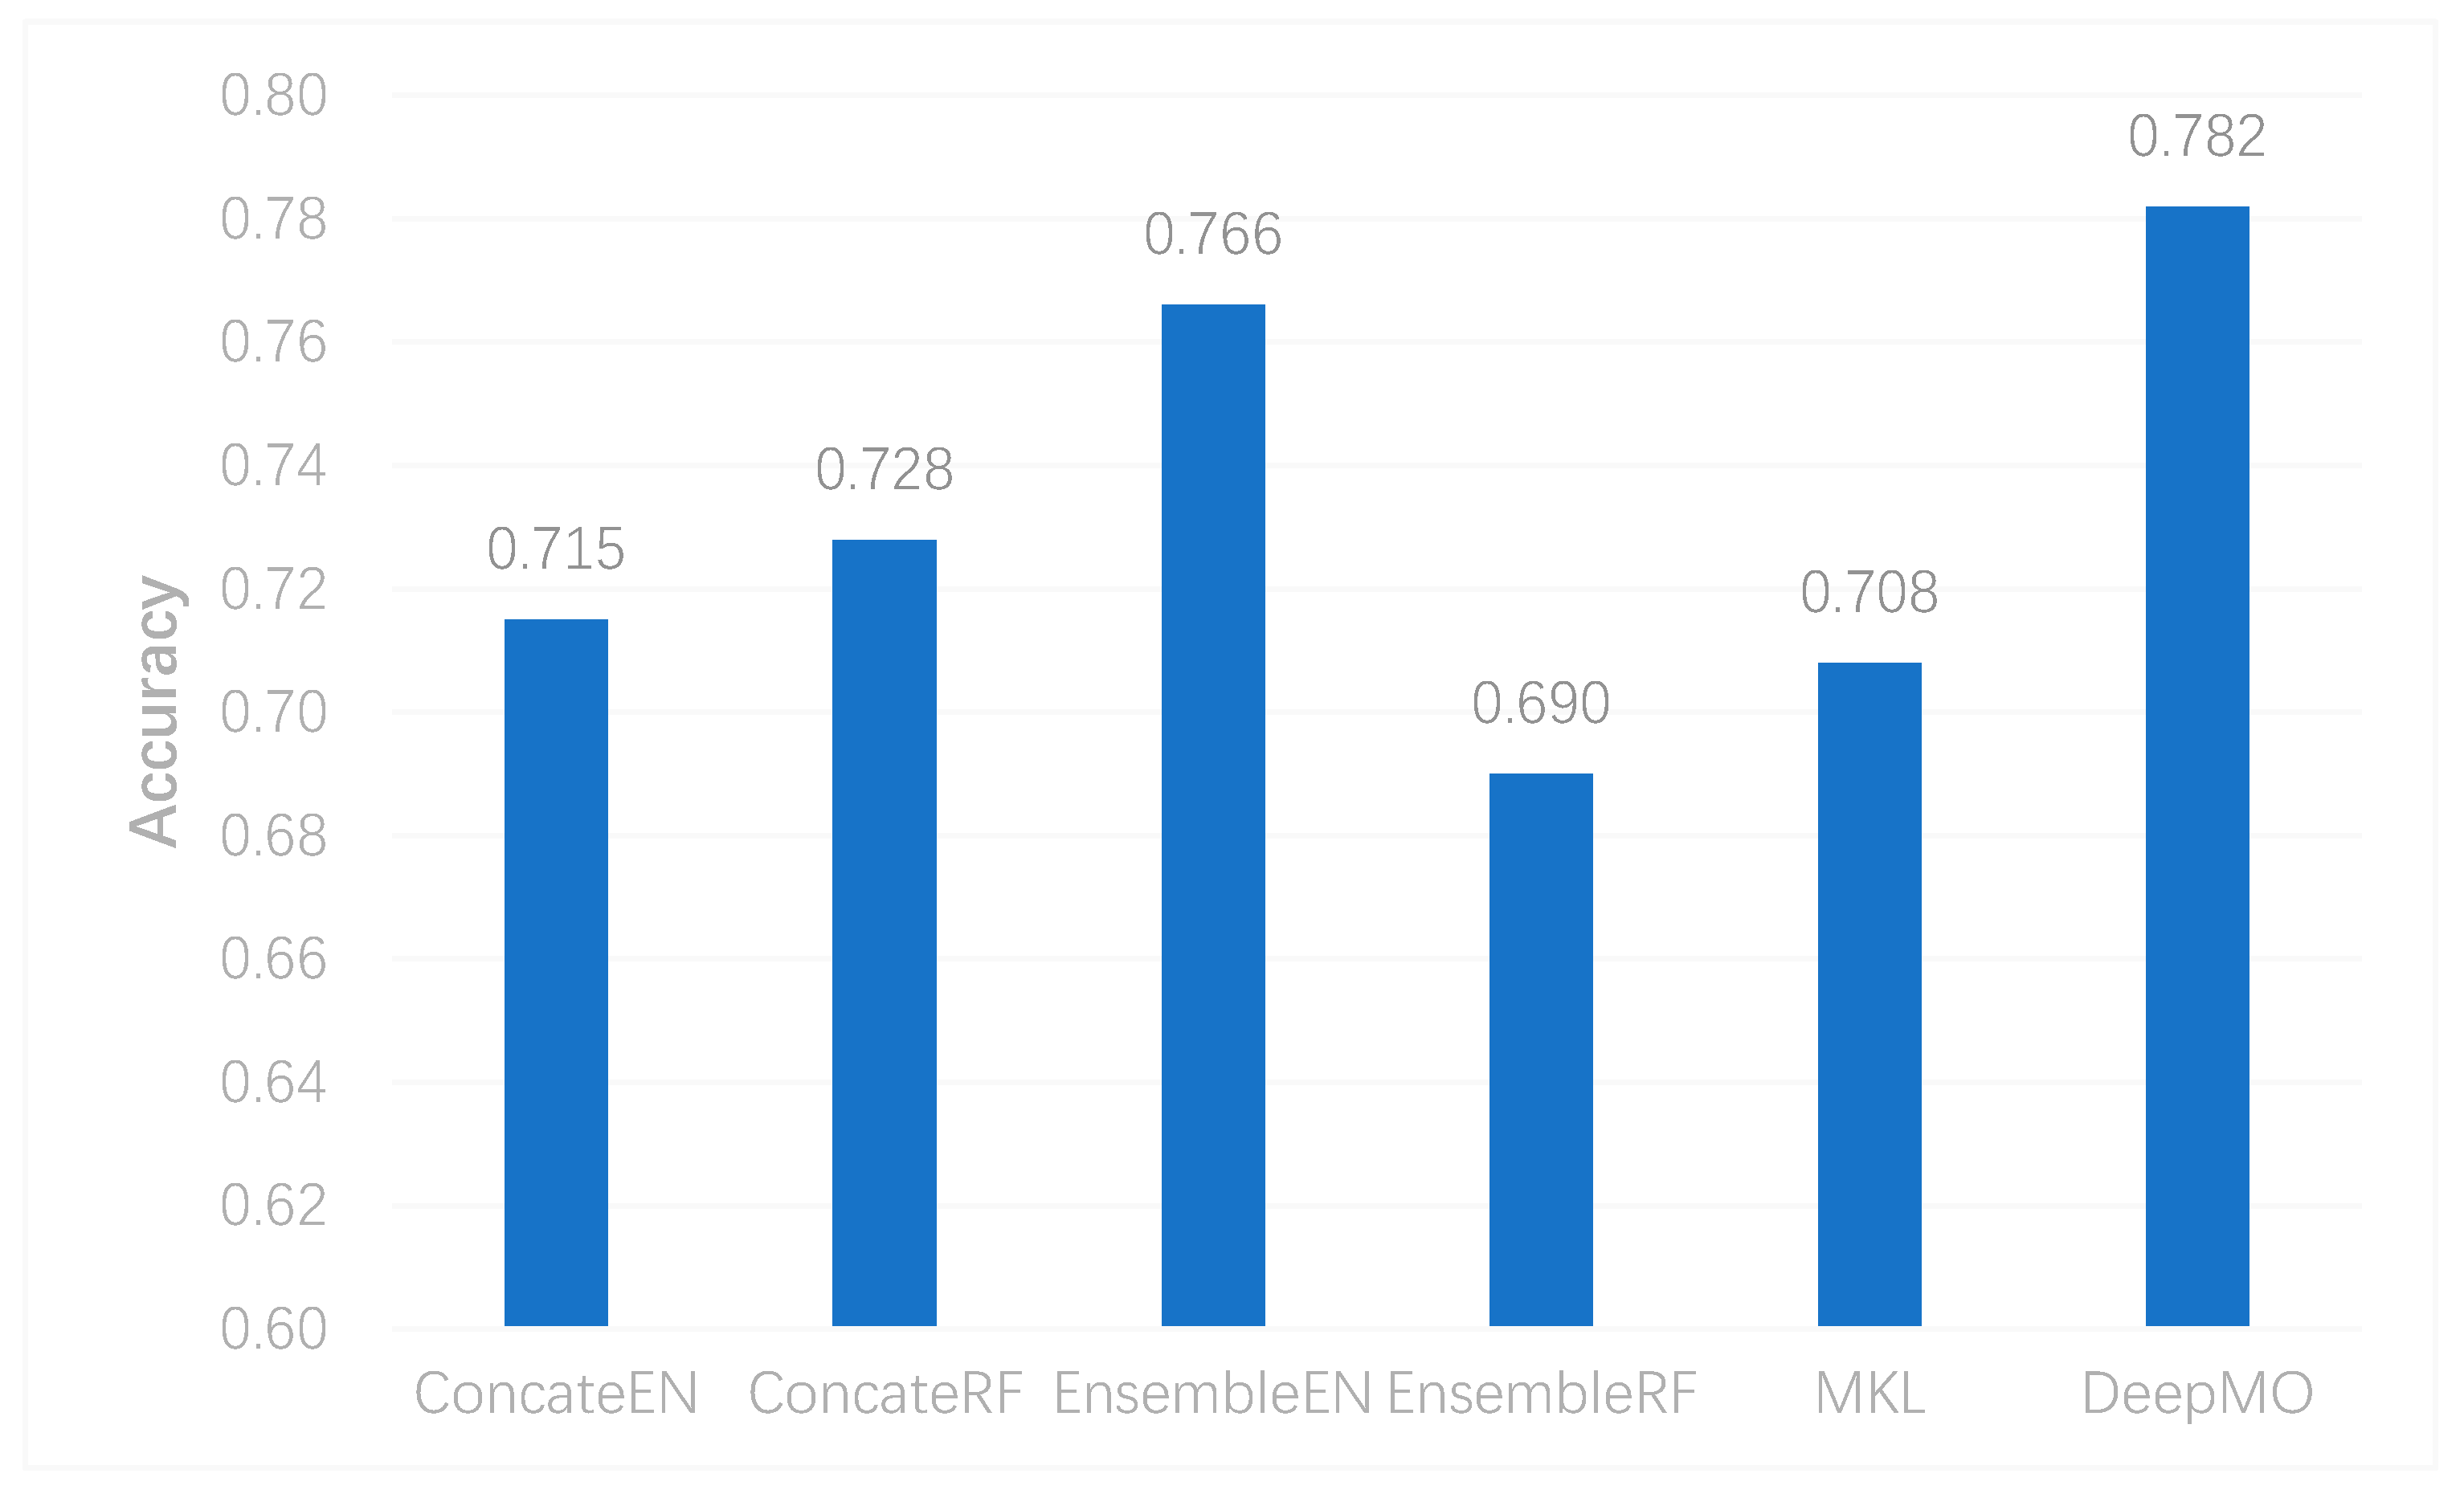
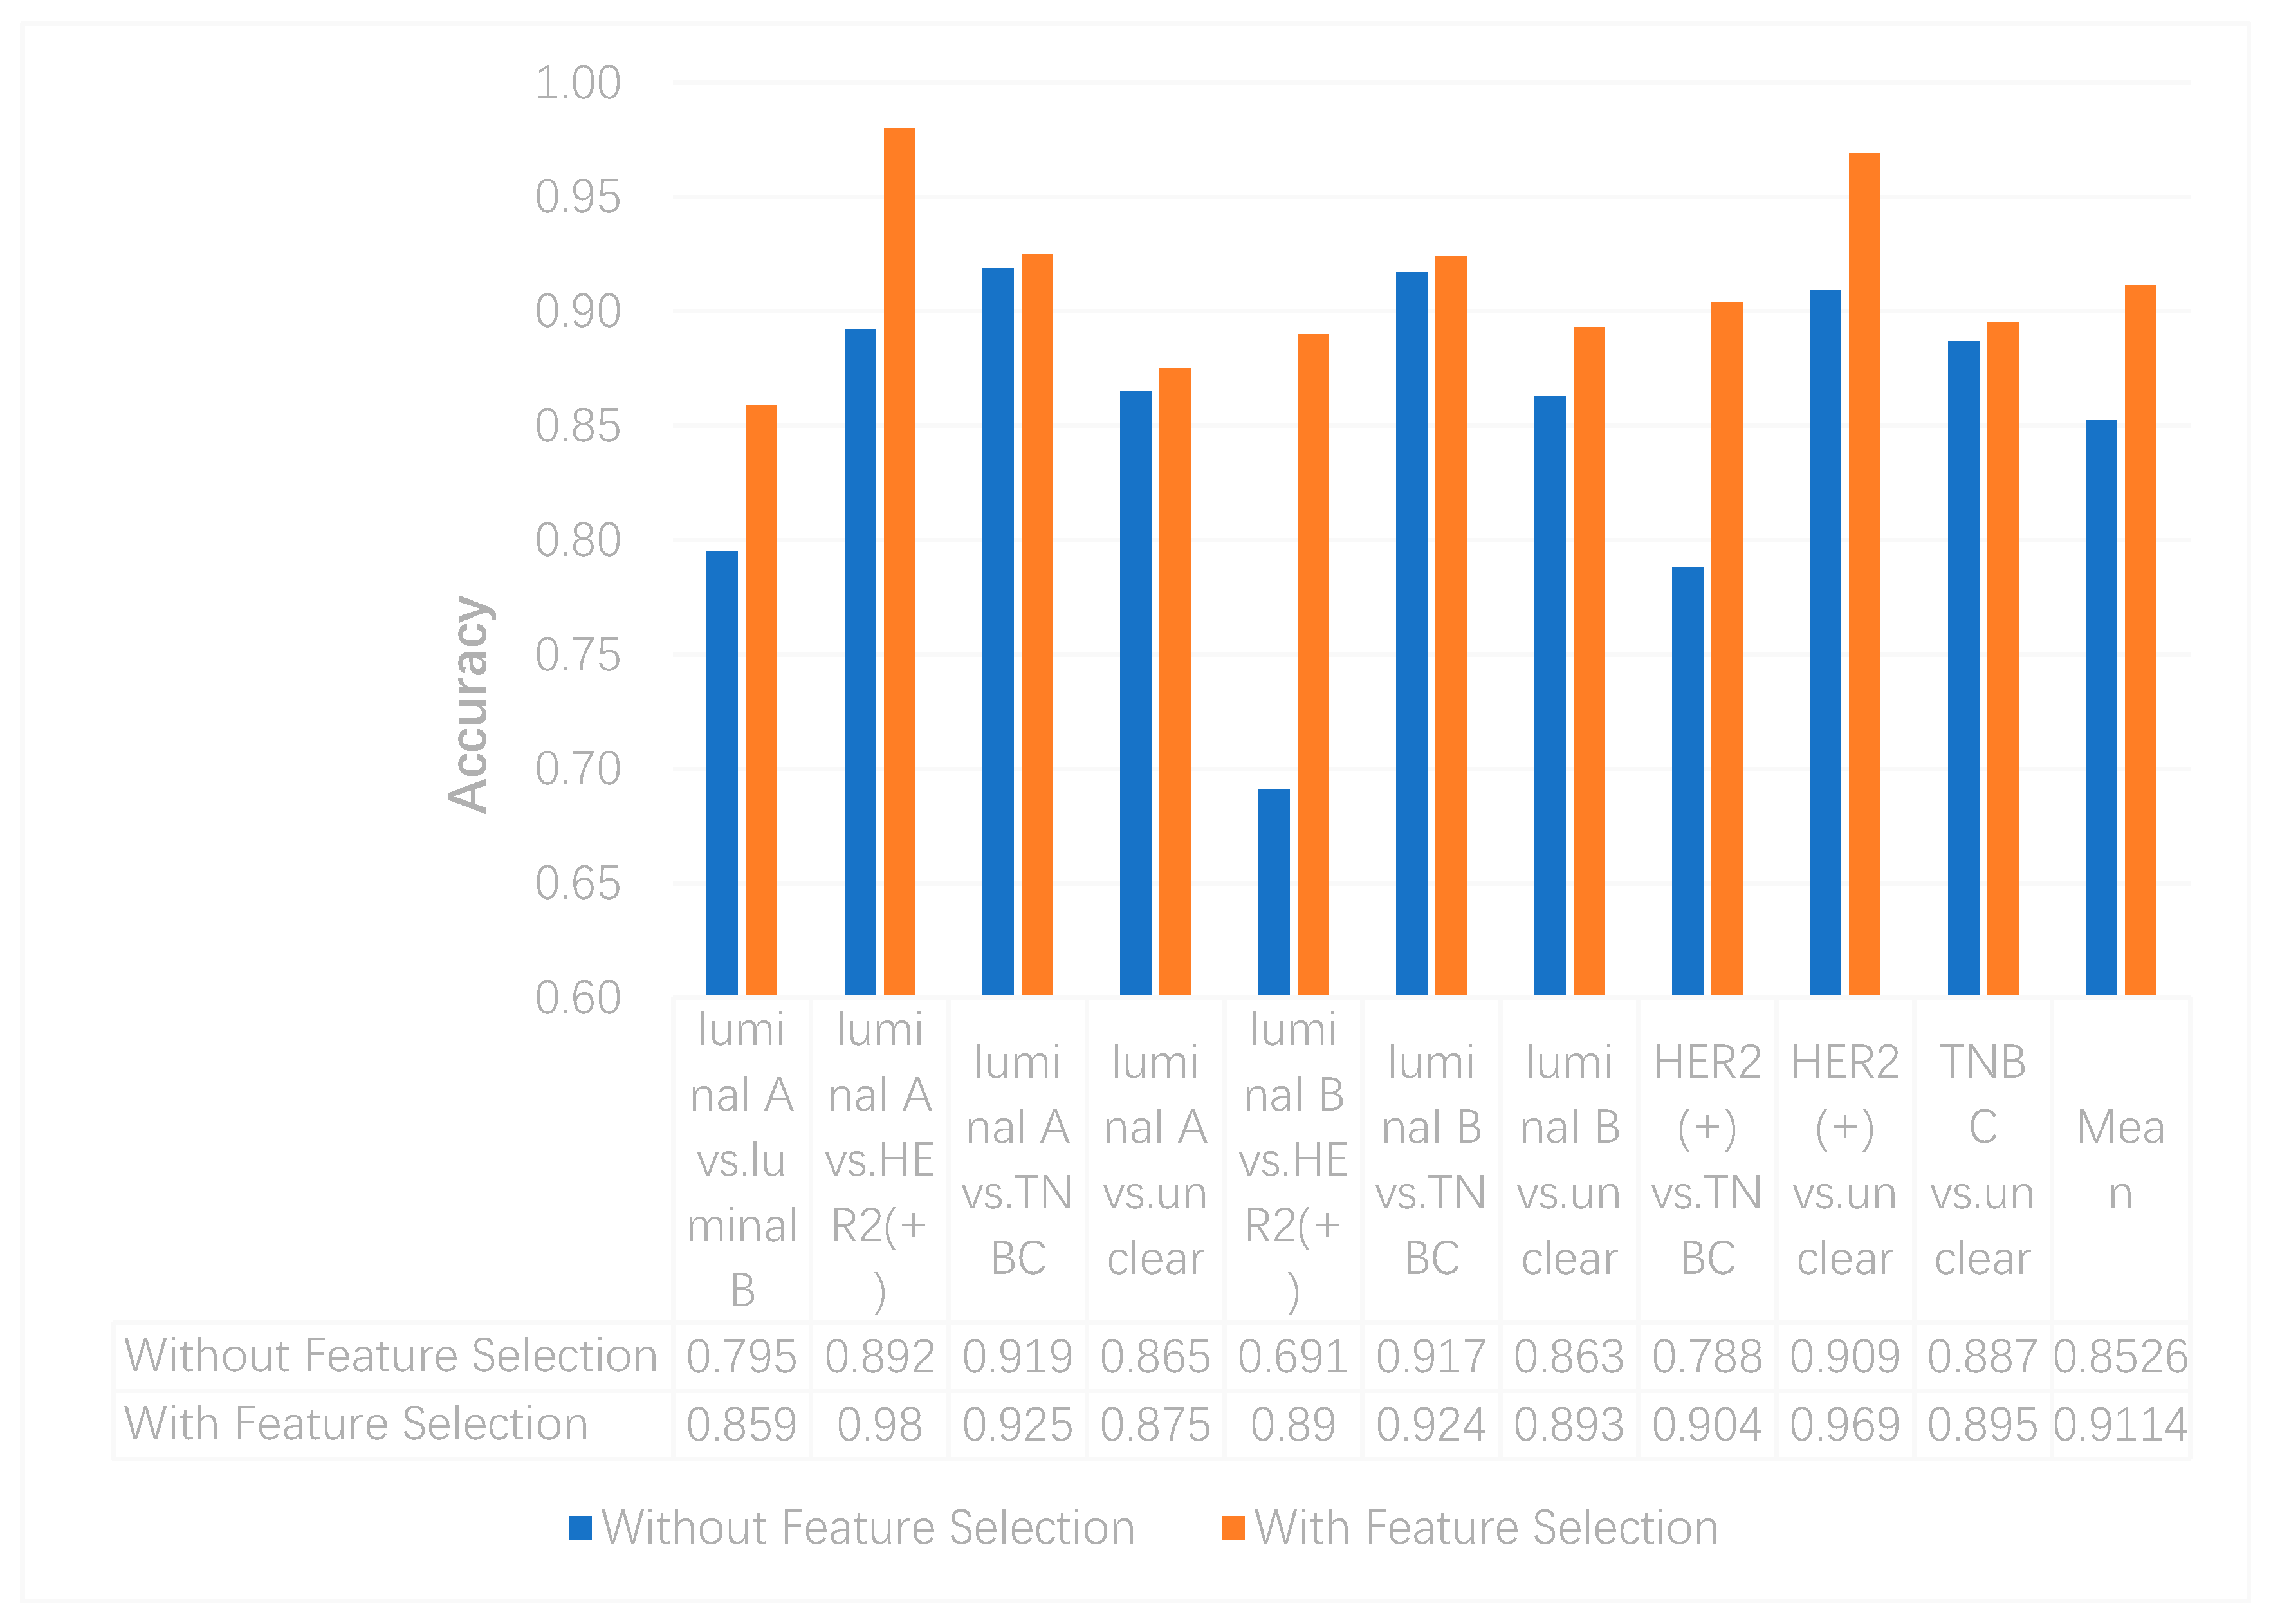
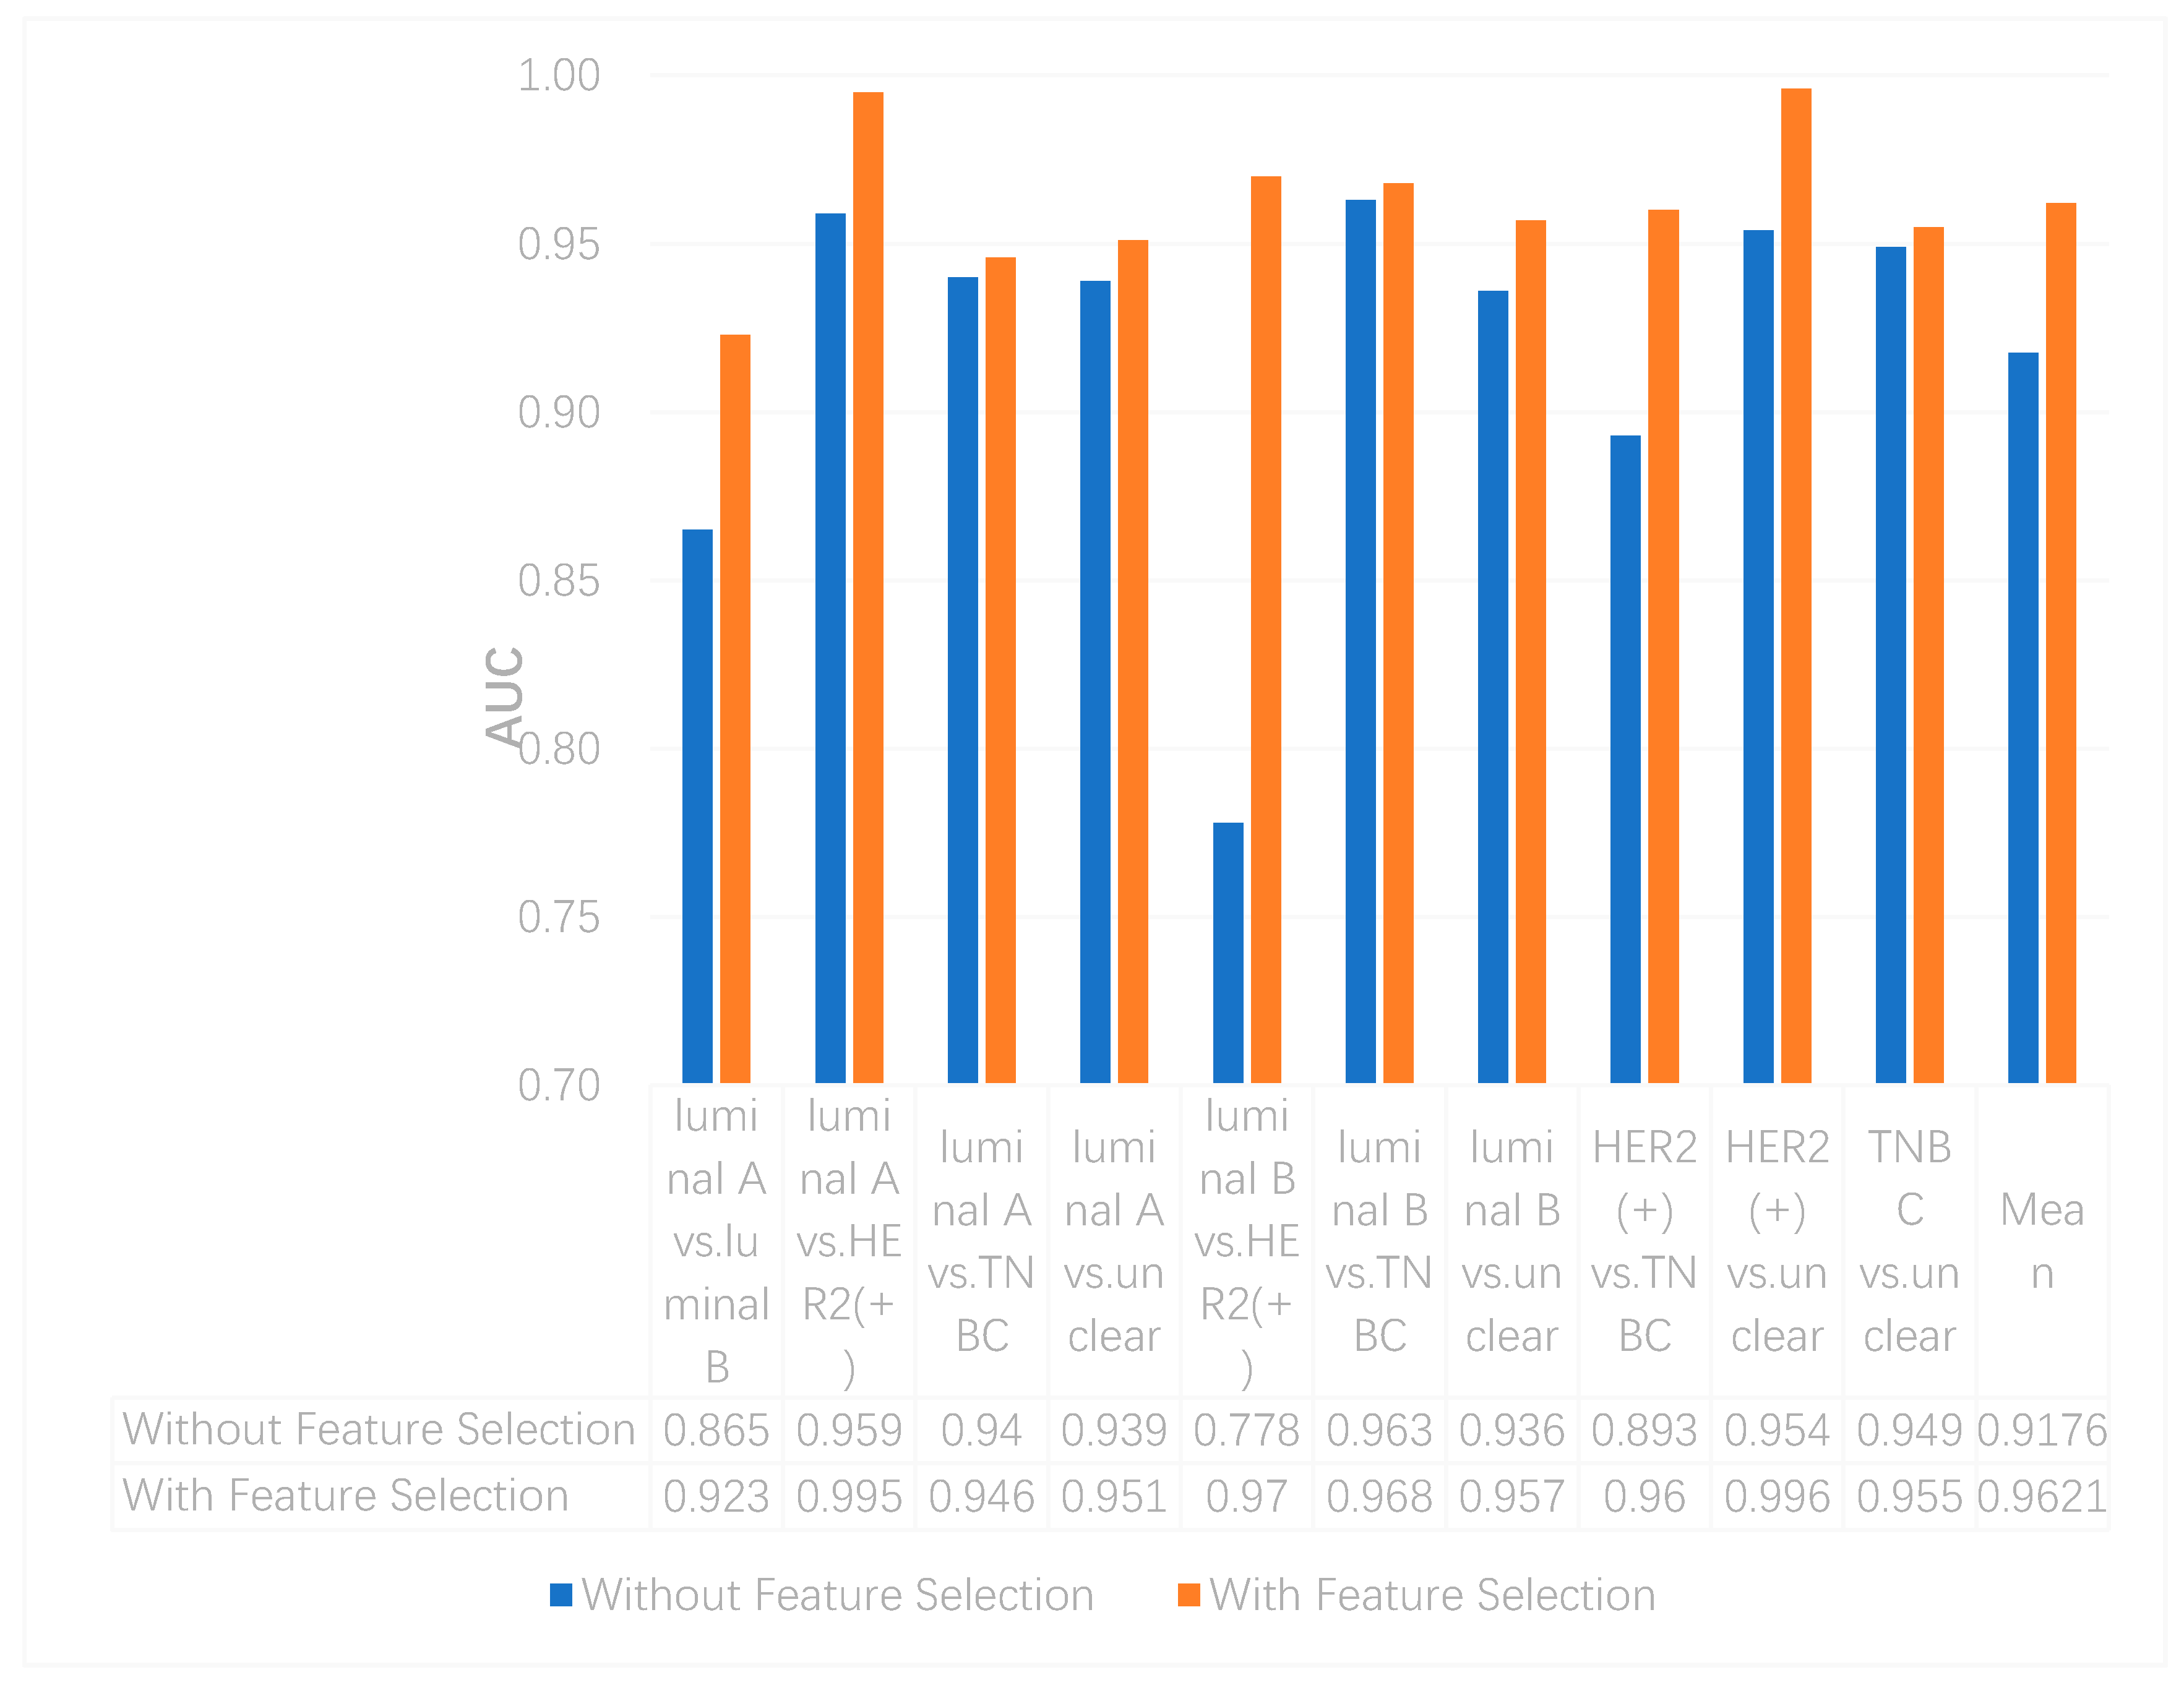
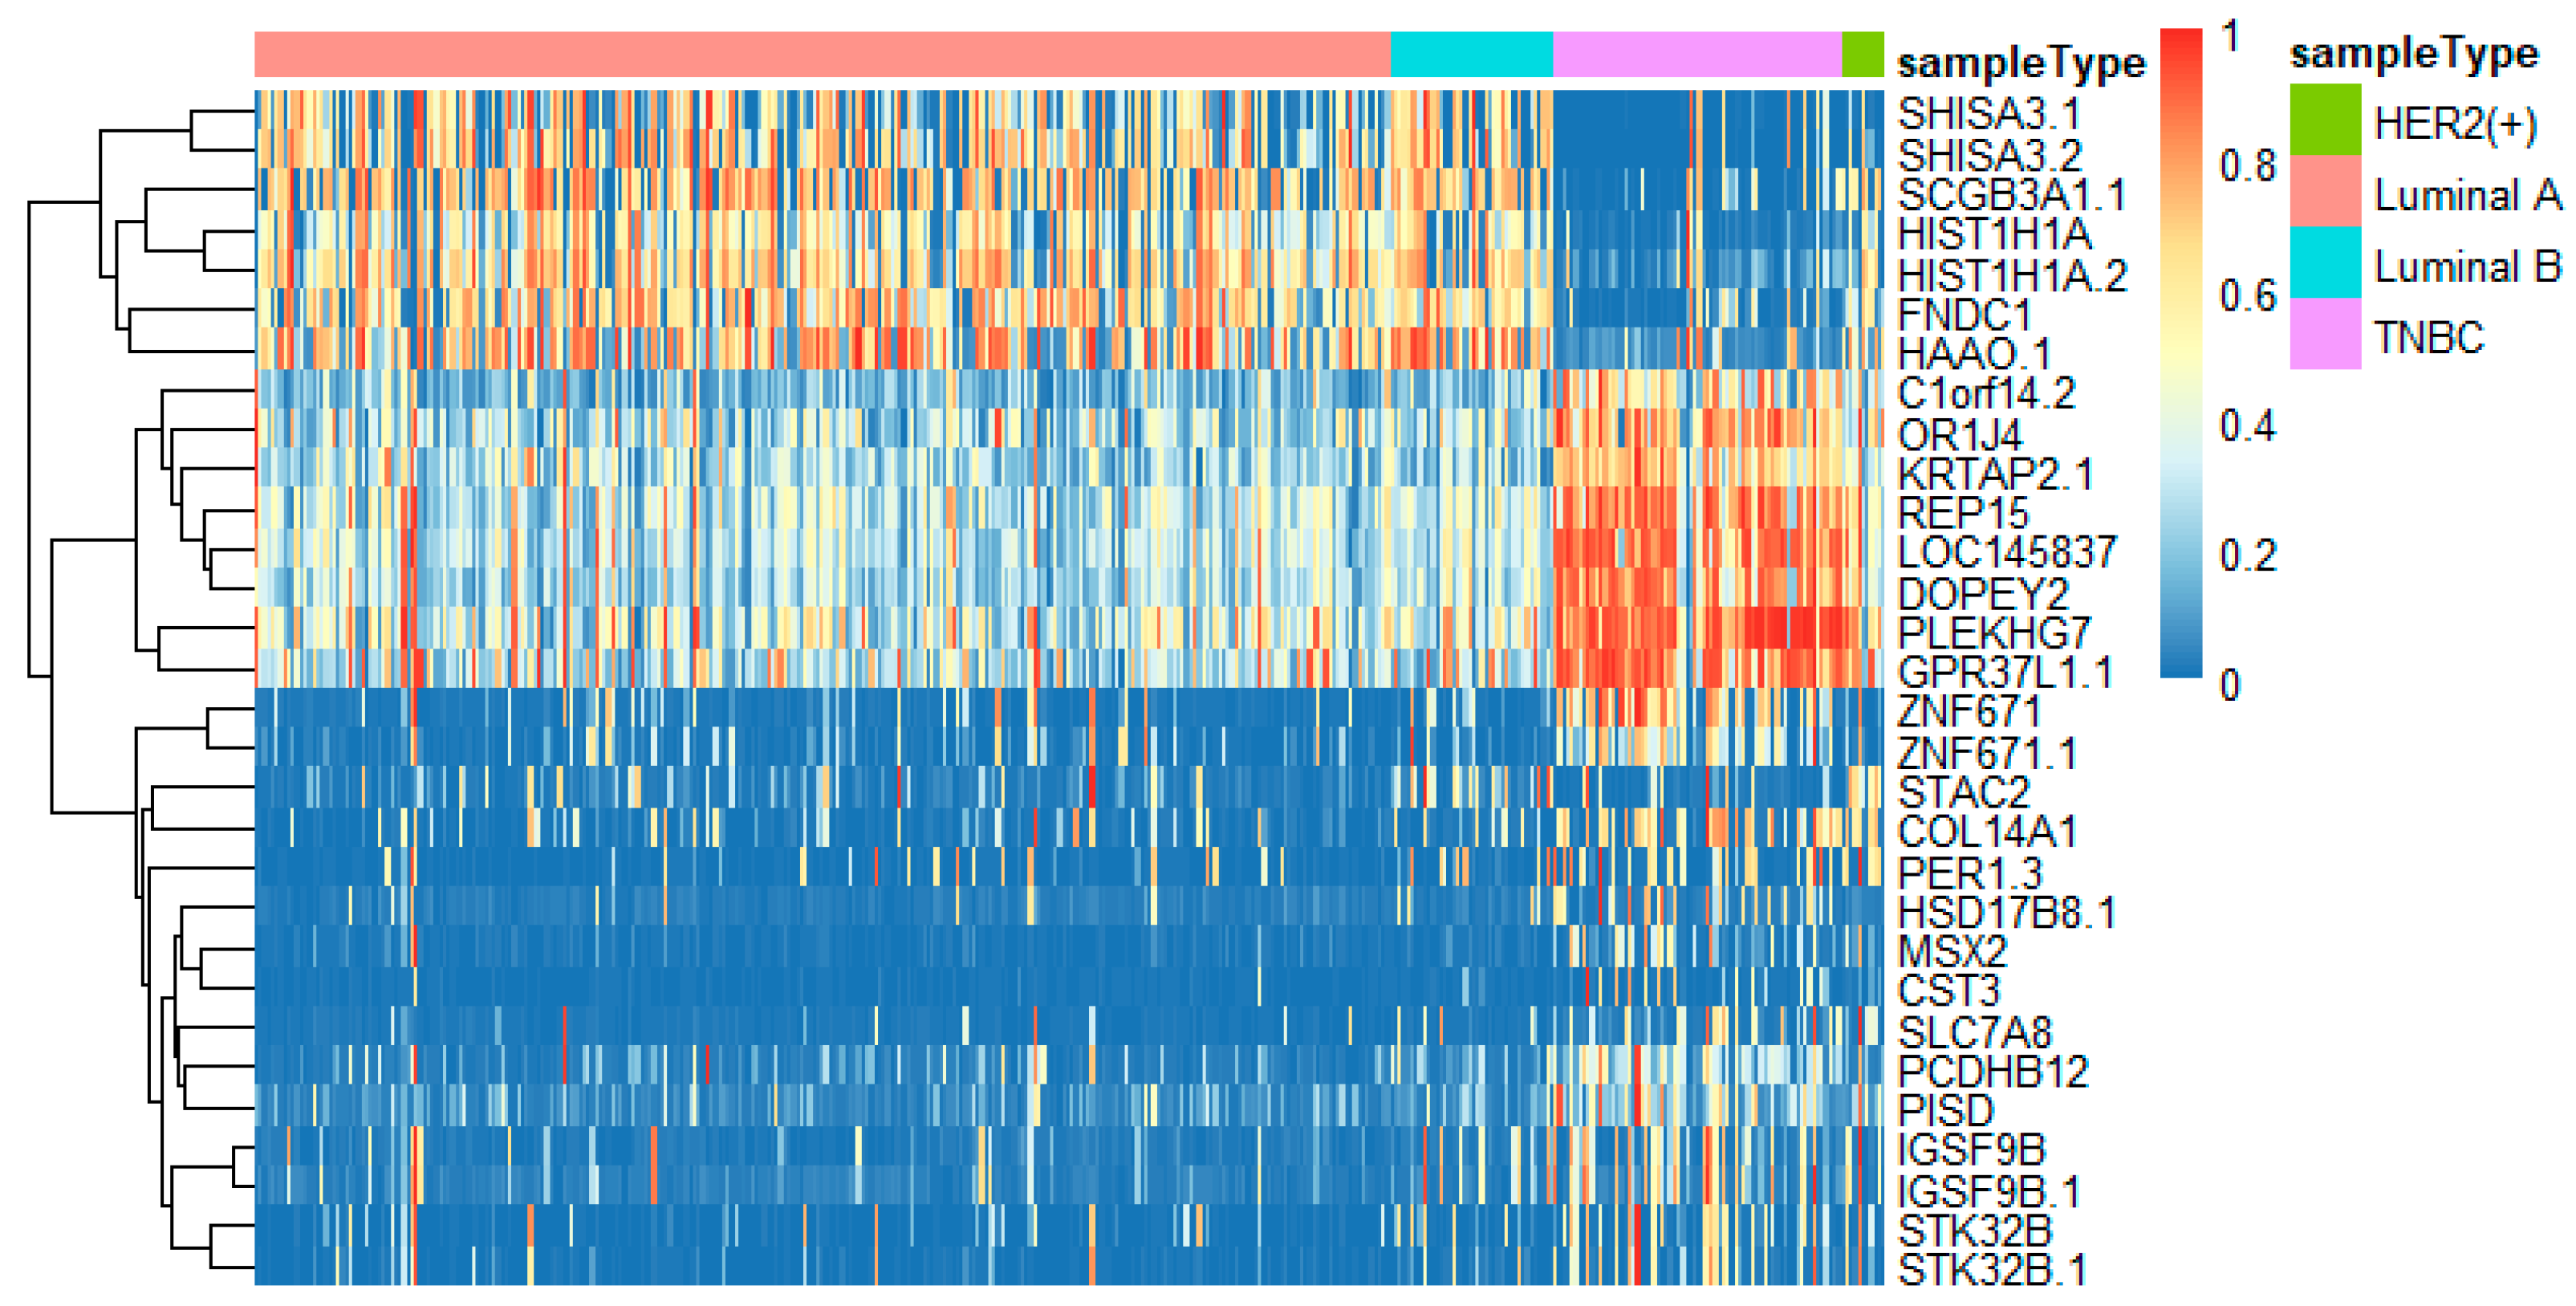
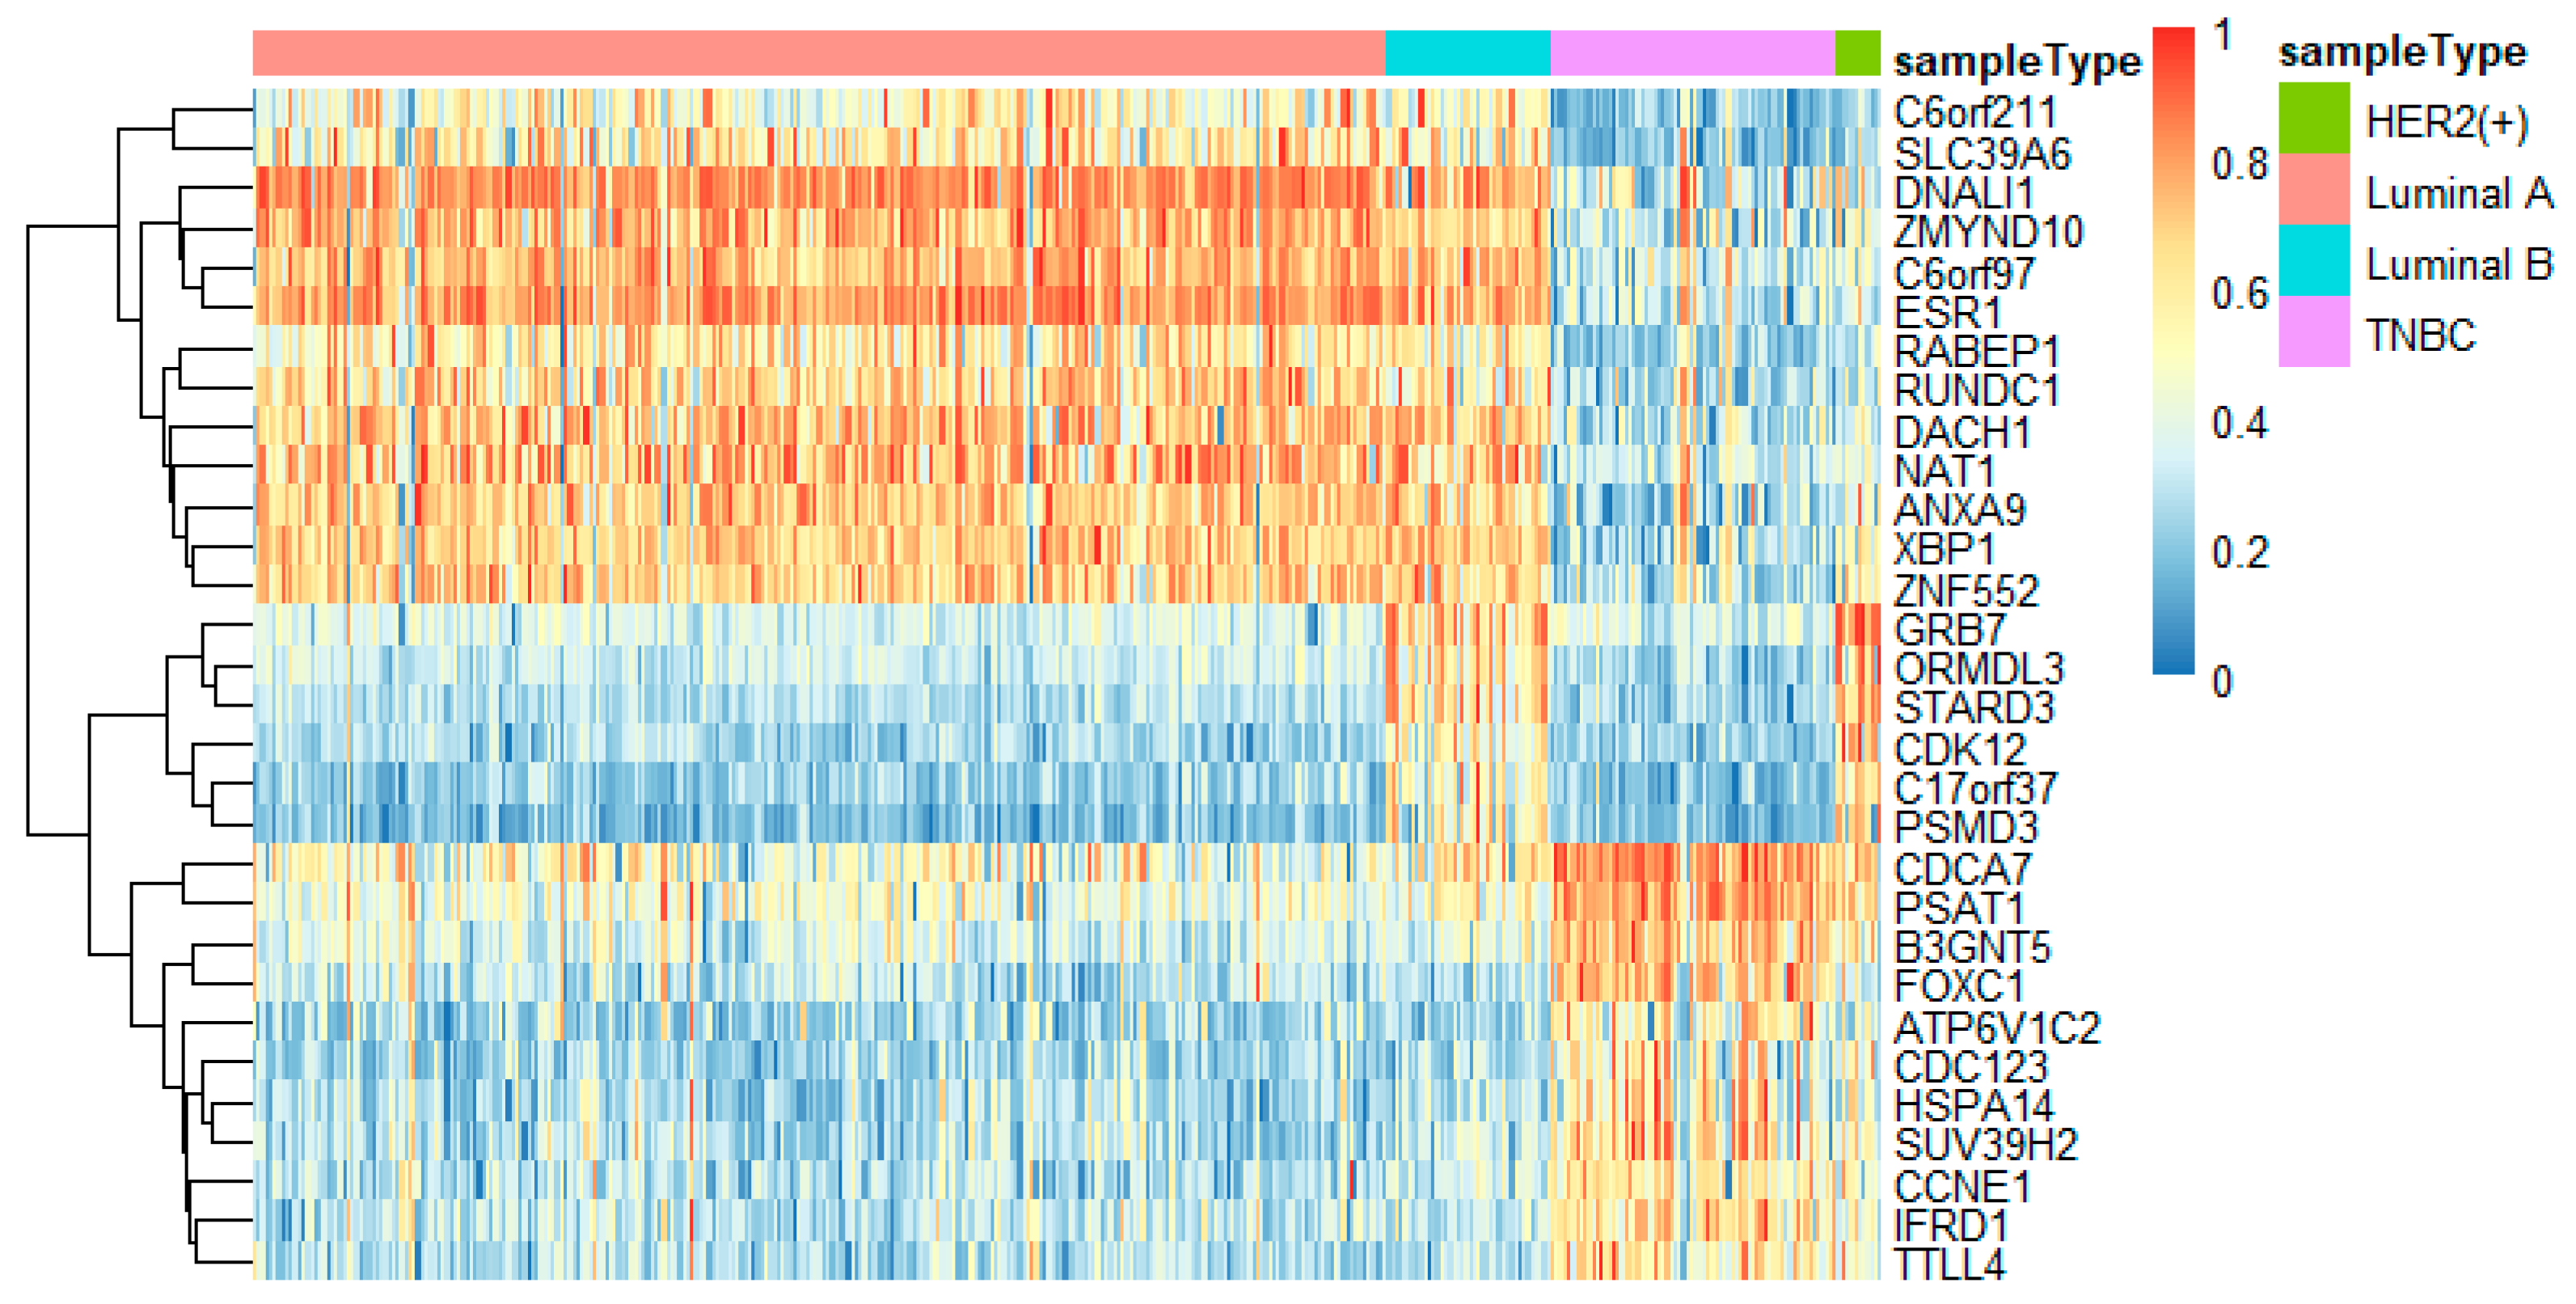
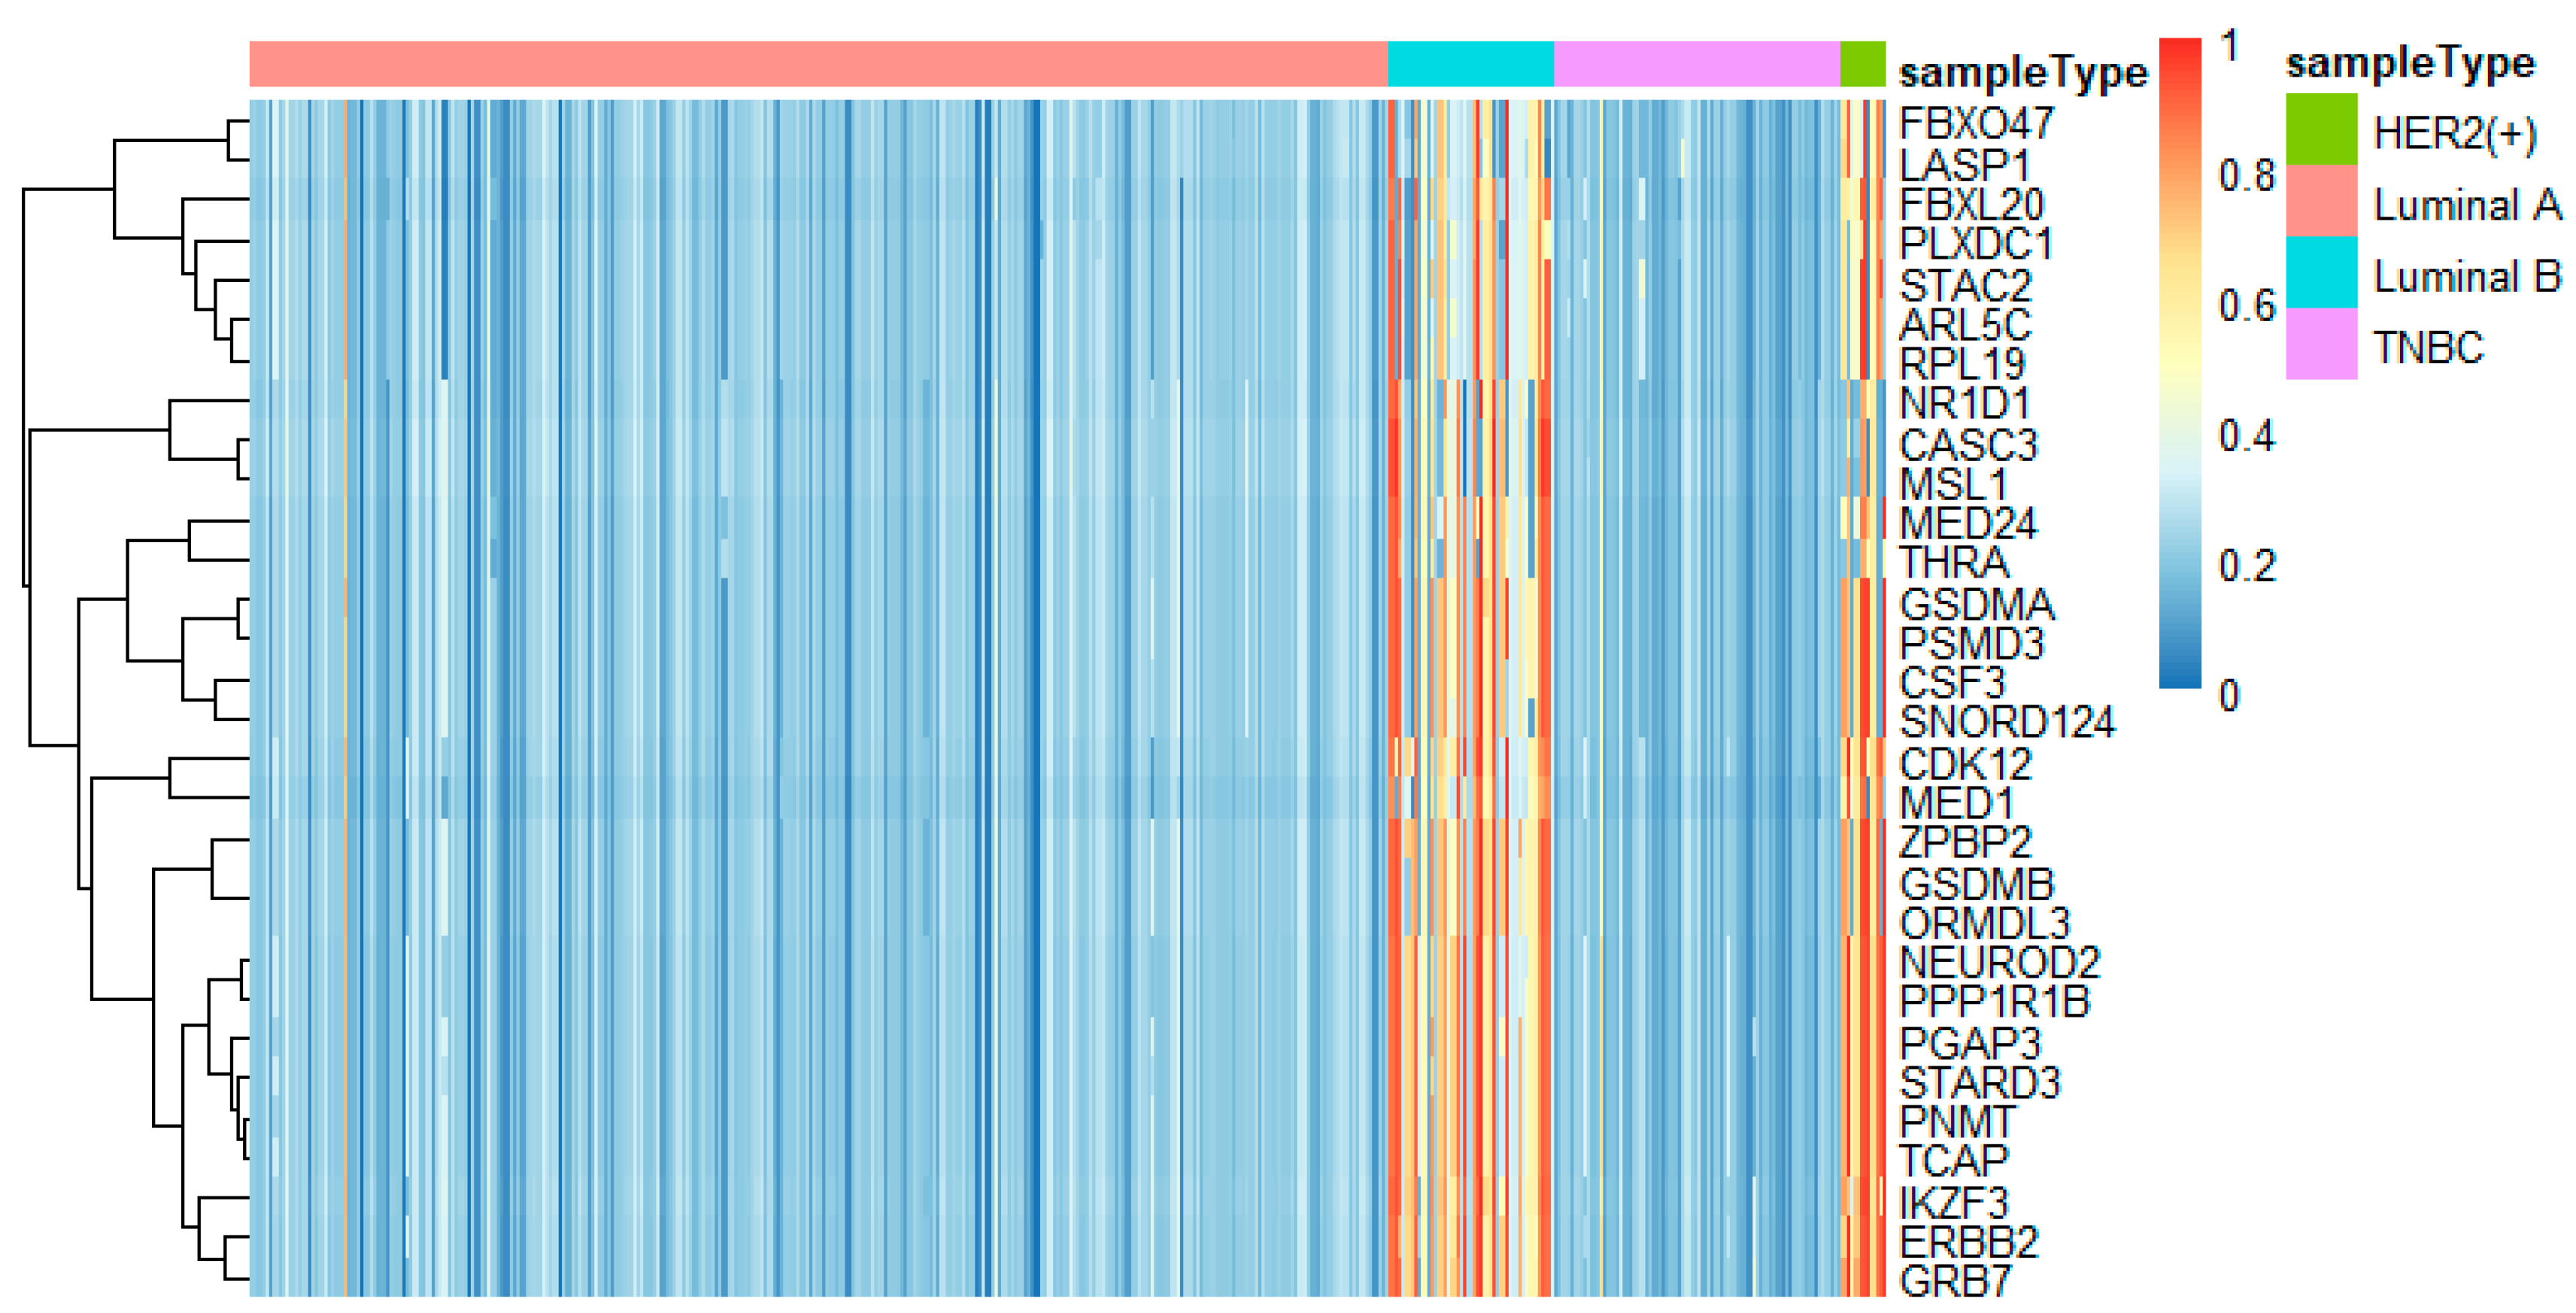
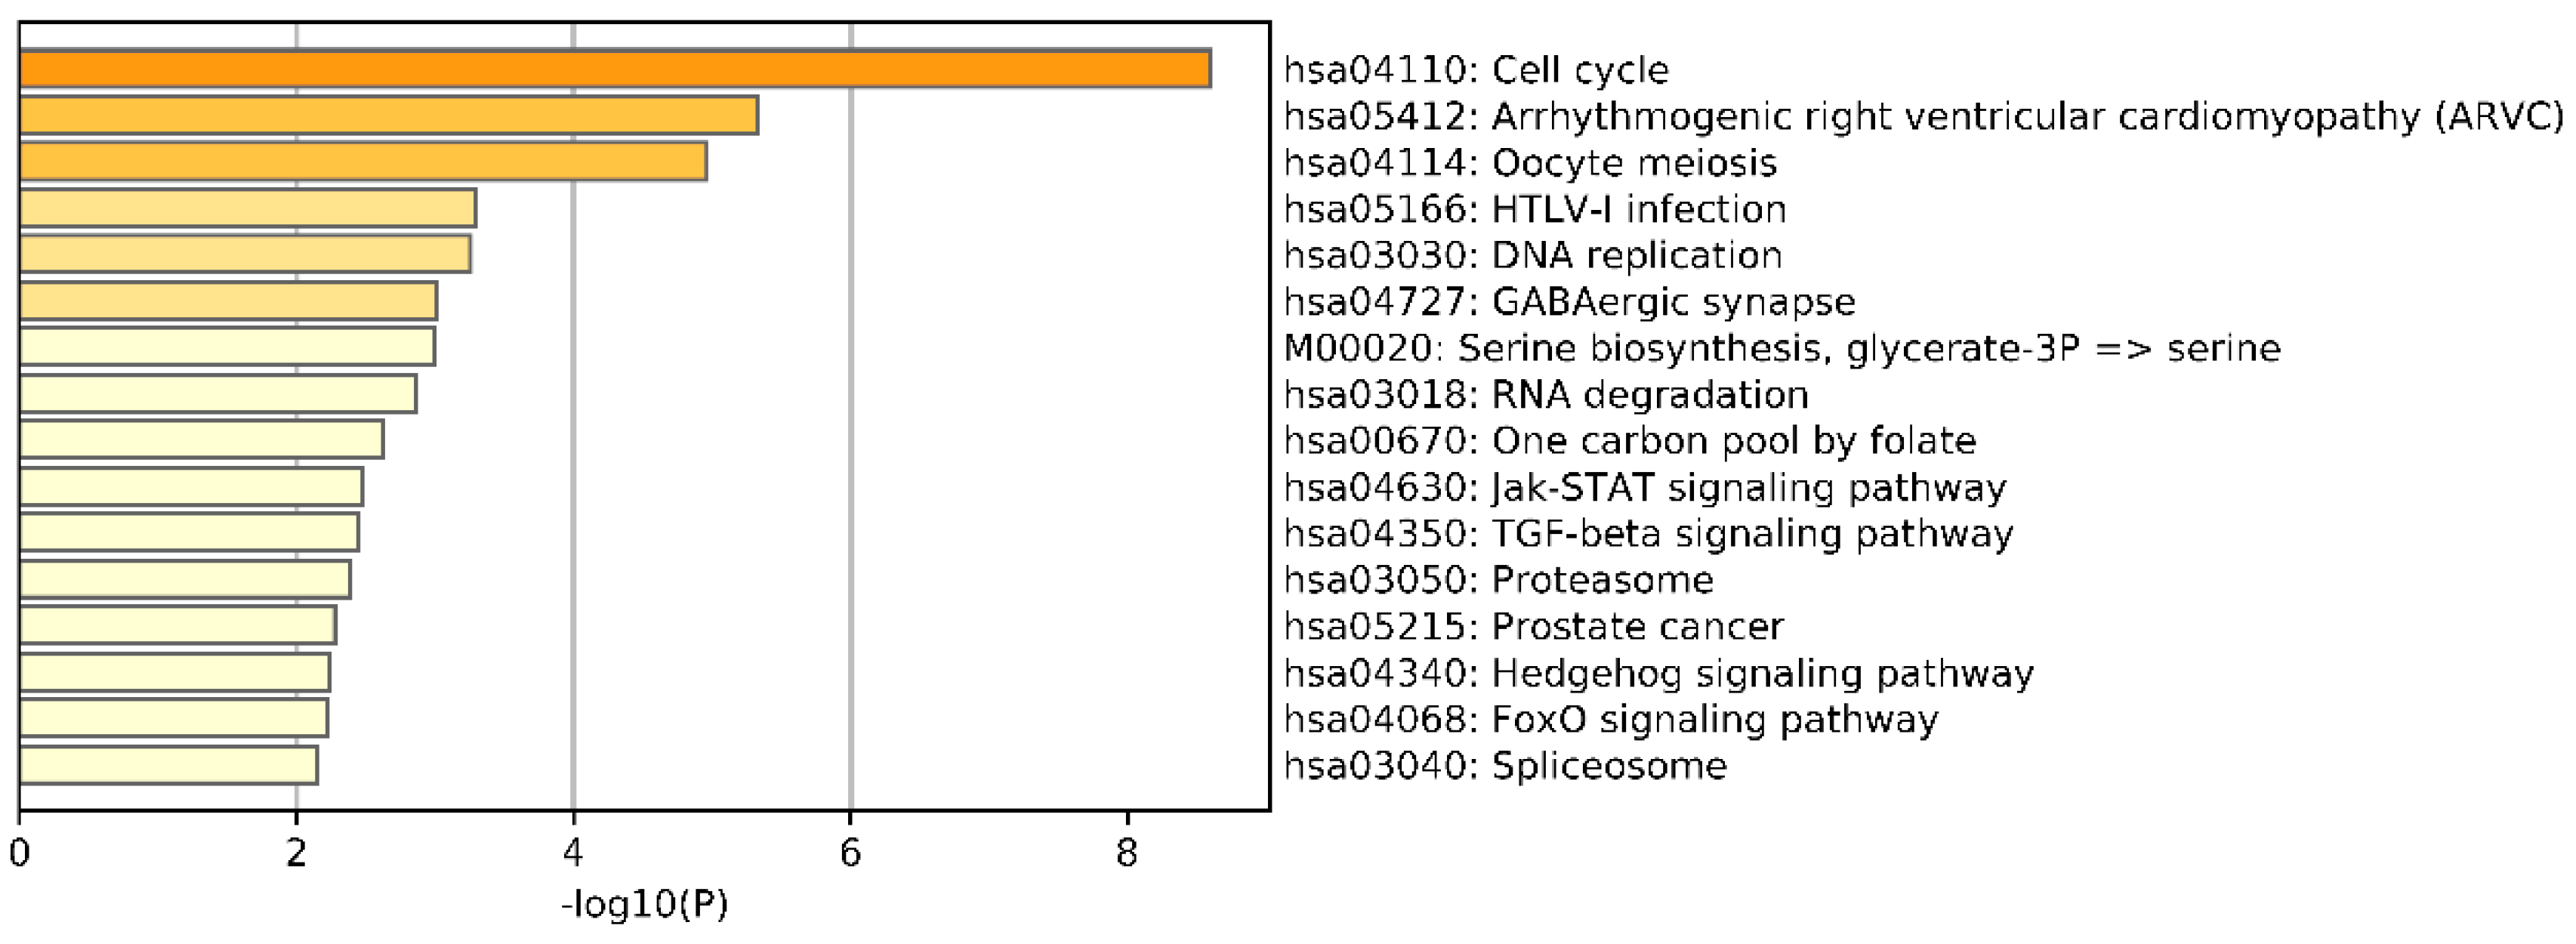
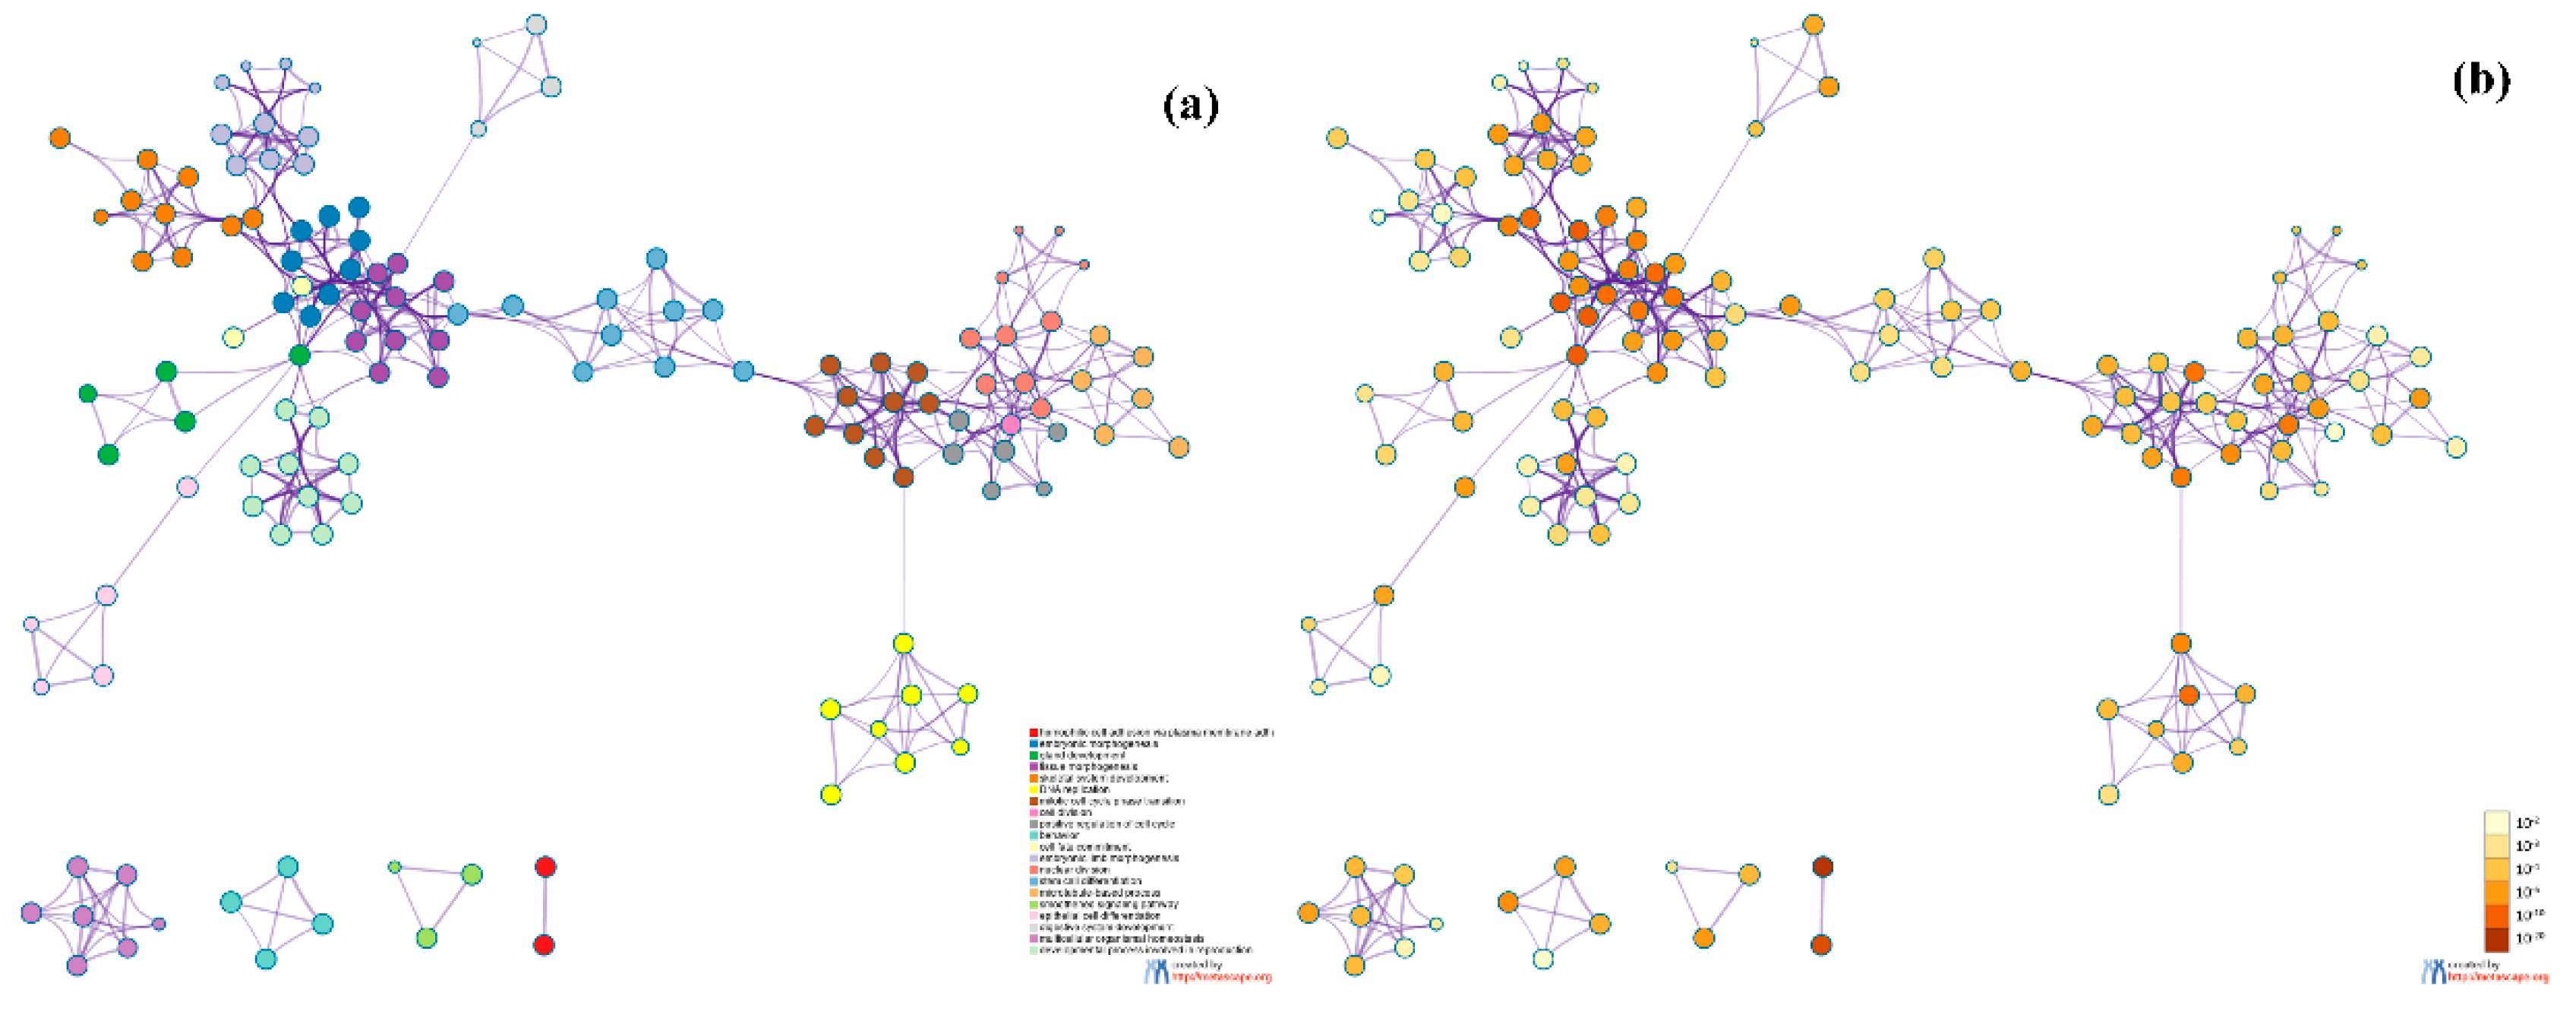
In this study, we utilized DeepMO, a method using deep neural networks and multi-omics late integration to classify breast cancer subtypes. First, we used the chi-squared test to select features that are closely related to labels. Afterward, we validated its performance both on binary classification and multi-classification. For binary classification, we compared accuracy and AUC obtained by DeepMO using single omics data and multiple omics data. We also compared DeepMO with MKL. The results showed that our proposed model based on multi-omics data performed best in most cases. For multi-classification, we first compared DeepMO using multi-omics data and single omics data and found that using multi-omics data can obtain better accuracy. We also compared DeepMO with other data integration methods, including ConcateEN, ConcateRF, EnsembleEN, EnsembleRF, and MKL. The compared results indicated that DeepMO was superior to all these methods. Furthermore, we compared the performance of DeepMO with feature selection and without feature selection. The results indicated that feature selection can improve DeepMO. Subsequently, we plotted the heatmap of some important genes, which visually showed that DNA methylation and mRNA data can distinguish breast cancer subtypes more clearly. Finally, we analyzed pathways and gene ontology, including KEGG, GO_BP, GO_CC, and GO_MF, and found most significant terms and similarity among them.
Feature selection is an effective approach to removing irrelevant and redundant gene features and reducing the dimension. In our model, although encoding networks can learn important features from the original gene features and achieve the reduction of features, there are still too many features inputting into encoding networks, which makes it difficult and slow to train the network weights. In addition to considering the complexity of the algorithm, we assumed that the deep neural network models may be further improved by feature selection algorithms. The results in
Section 3.3 indicated the positive effects of feature selection on our model and proved our assumption well.
As we all know, the hyperparameters in deep neural networks, such as the number of nodes in the hidden layers, mini-batch size, learning rates, weight decay, the number of epochs, and dropout rate, have an important impact on the performance of the neural network. However, in this study, we only used the default or moderate values and did not adjust the hyperparameters. Therefore, the result may be better after tuning hyperparameters and selecting better values. Additionally, the imbalance of data had an effect on the neural network. In this study, we used both the undersampling and oversampling methods to reduce the effect of imbalanced data. We selected samples by the weight of each subtype and the weight was reciprocal to the number of each subtype. Therefore, the subtype with smaller samples had more probability to be selected. This can solve data imbalance to some extent.


