Genetic Characterization of Russian Rapeseed Collection and Association Mapping of Novel Loci Affecting Glucosinolate Content

 , , , and
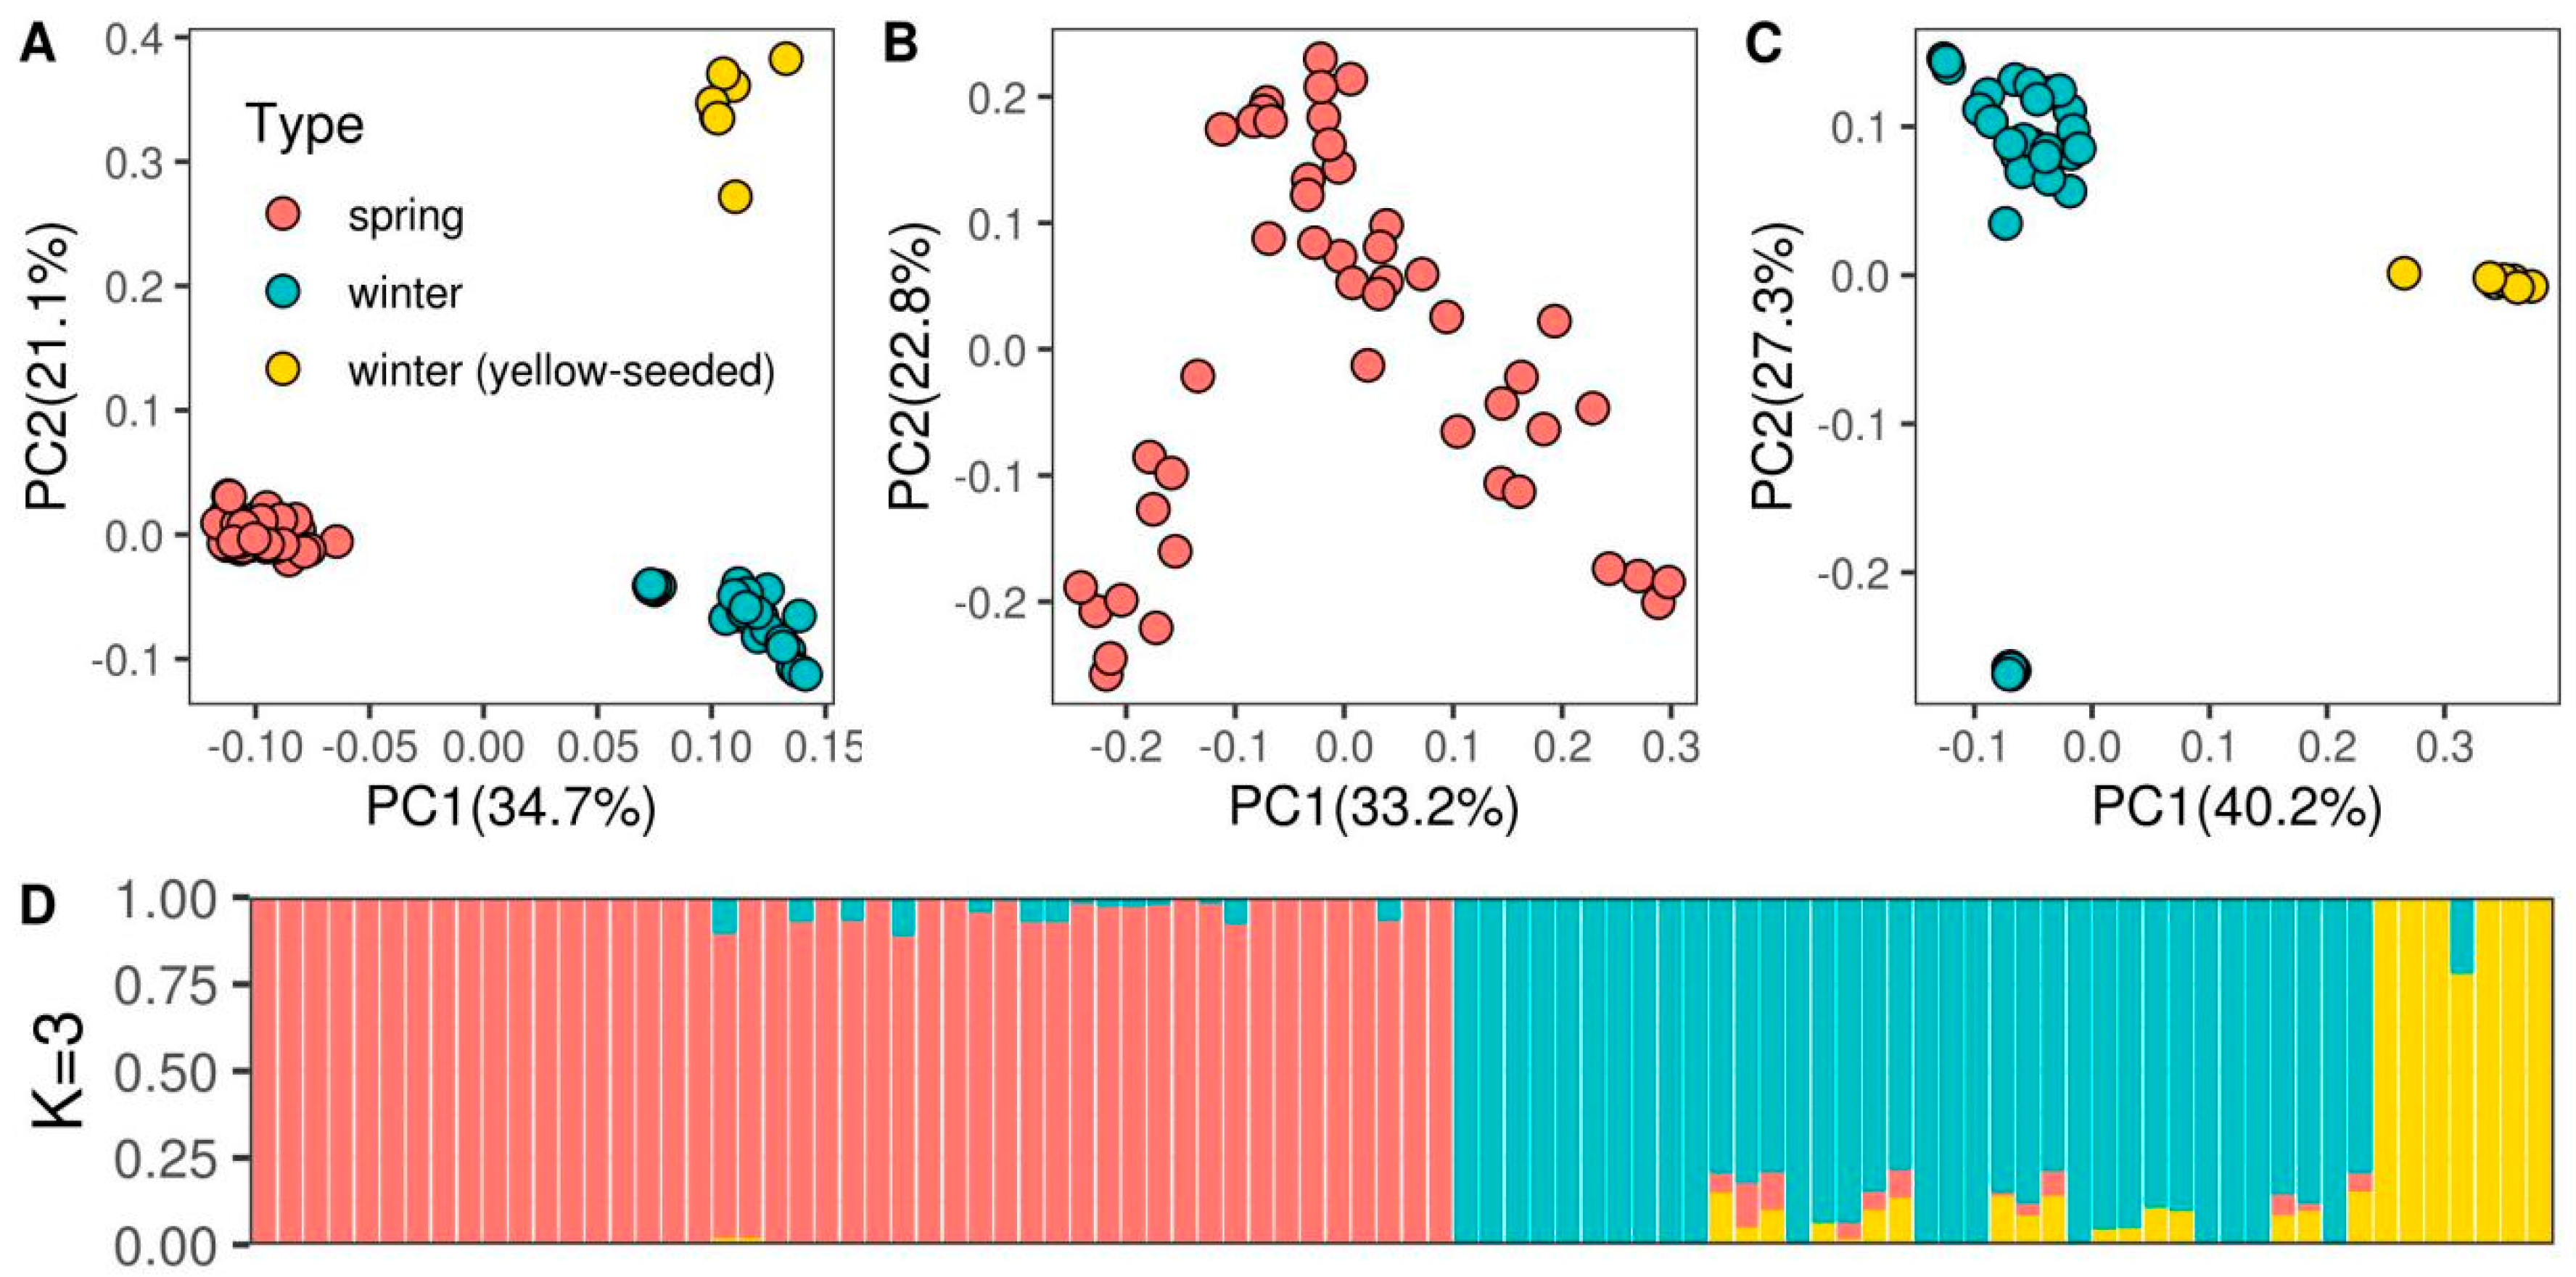
Abstract
1. Introduction
2. Materials and Methods
2.1. Plant Material and Phenotyping
2.2. Genotyping Procedures
2.3. Read Filtering, Alignment, and SNP Calling
2.4. Population Structure and Genetic Diversity Assessment
2.5. Association Mapping, SNP Annotation, and Loci Comparison
3. Results
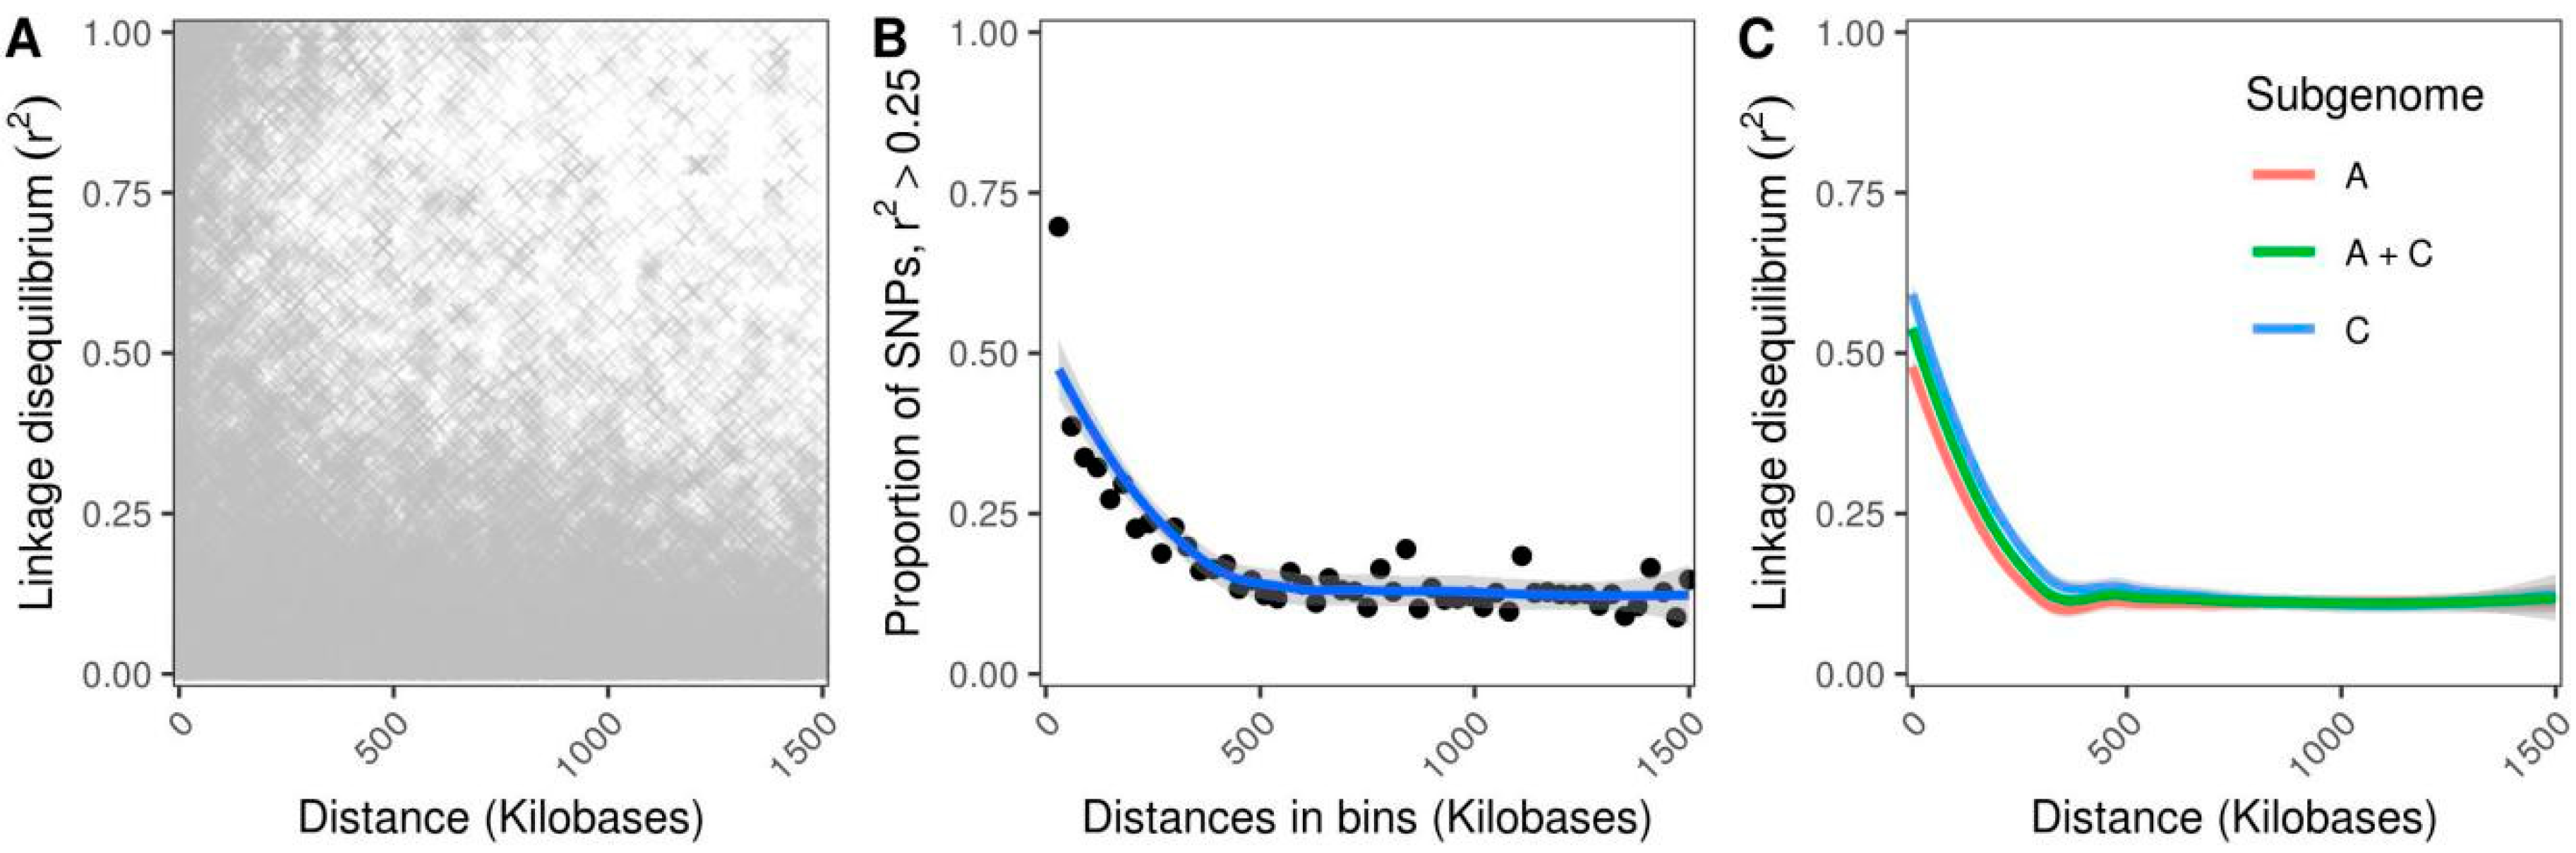
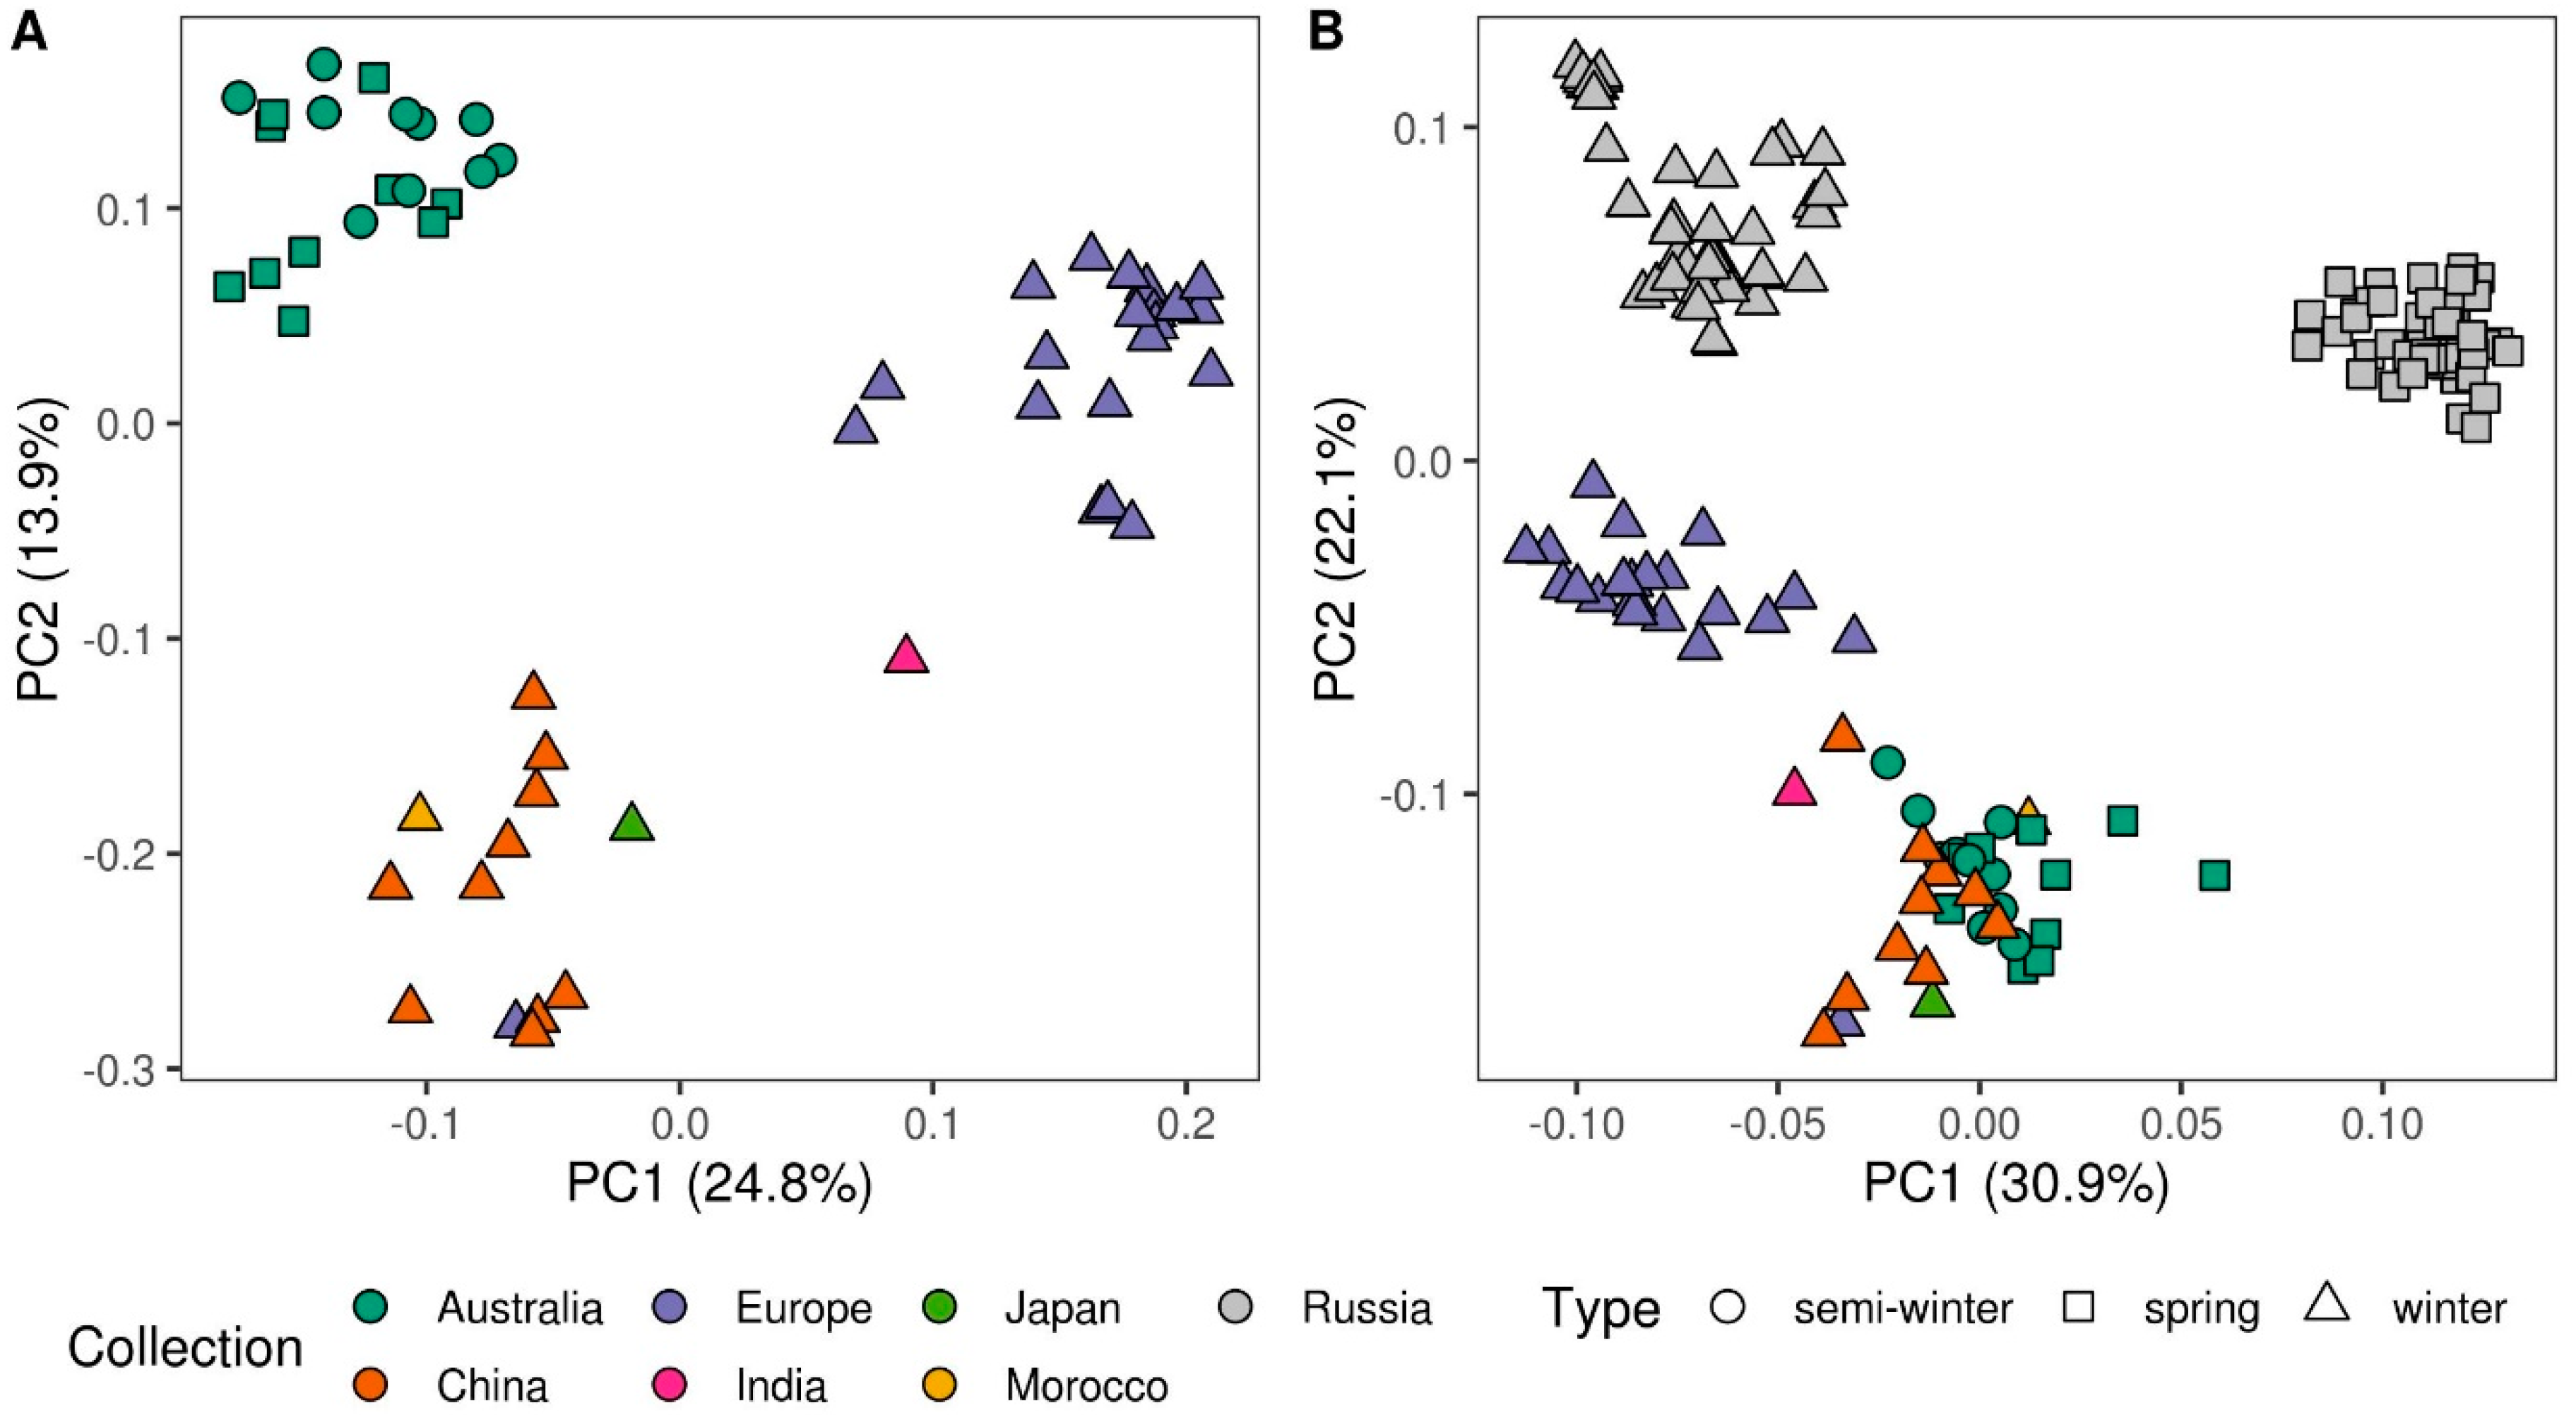
3.1. Population Structure and Genetic Diversity Assessment
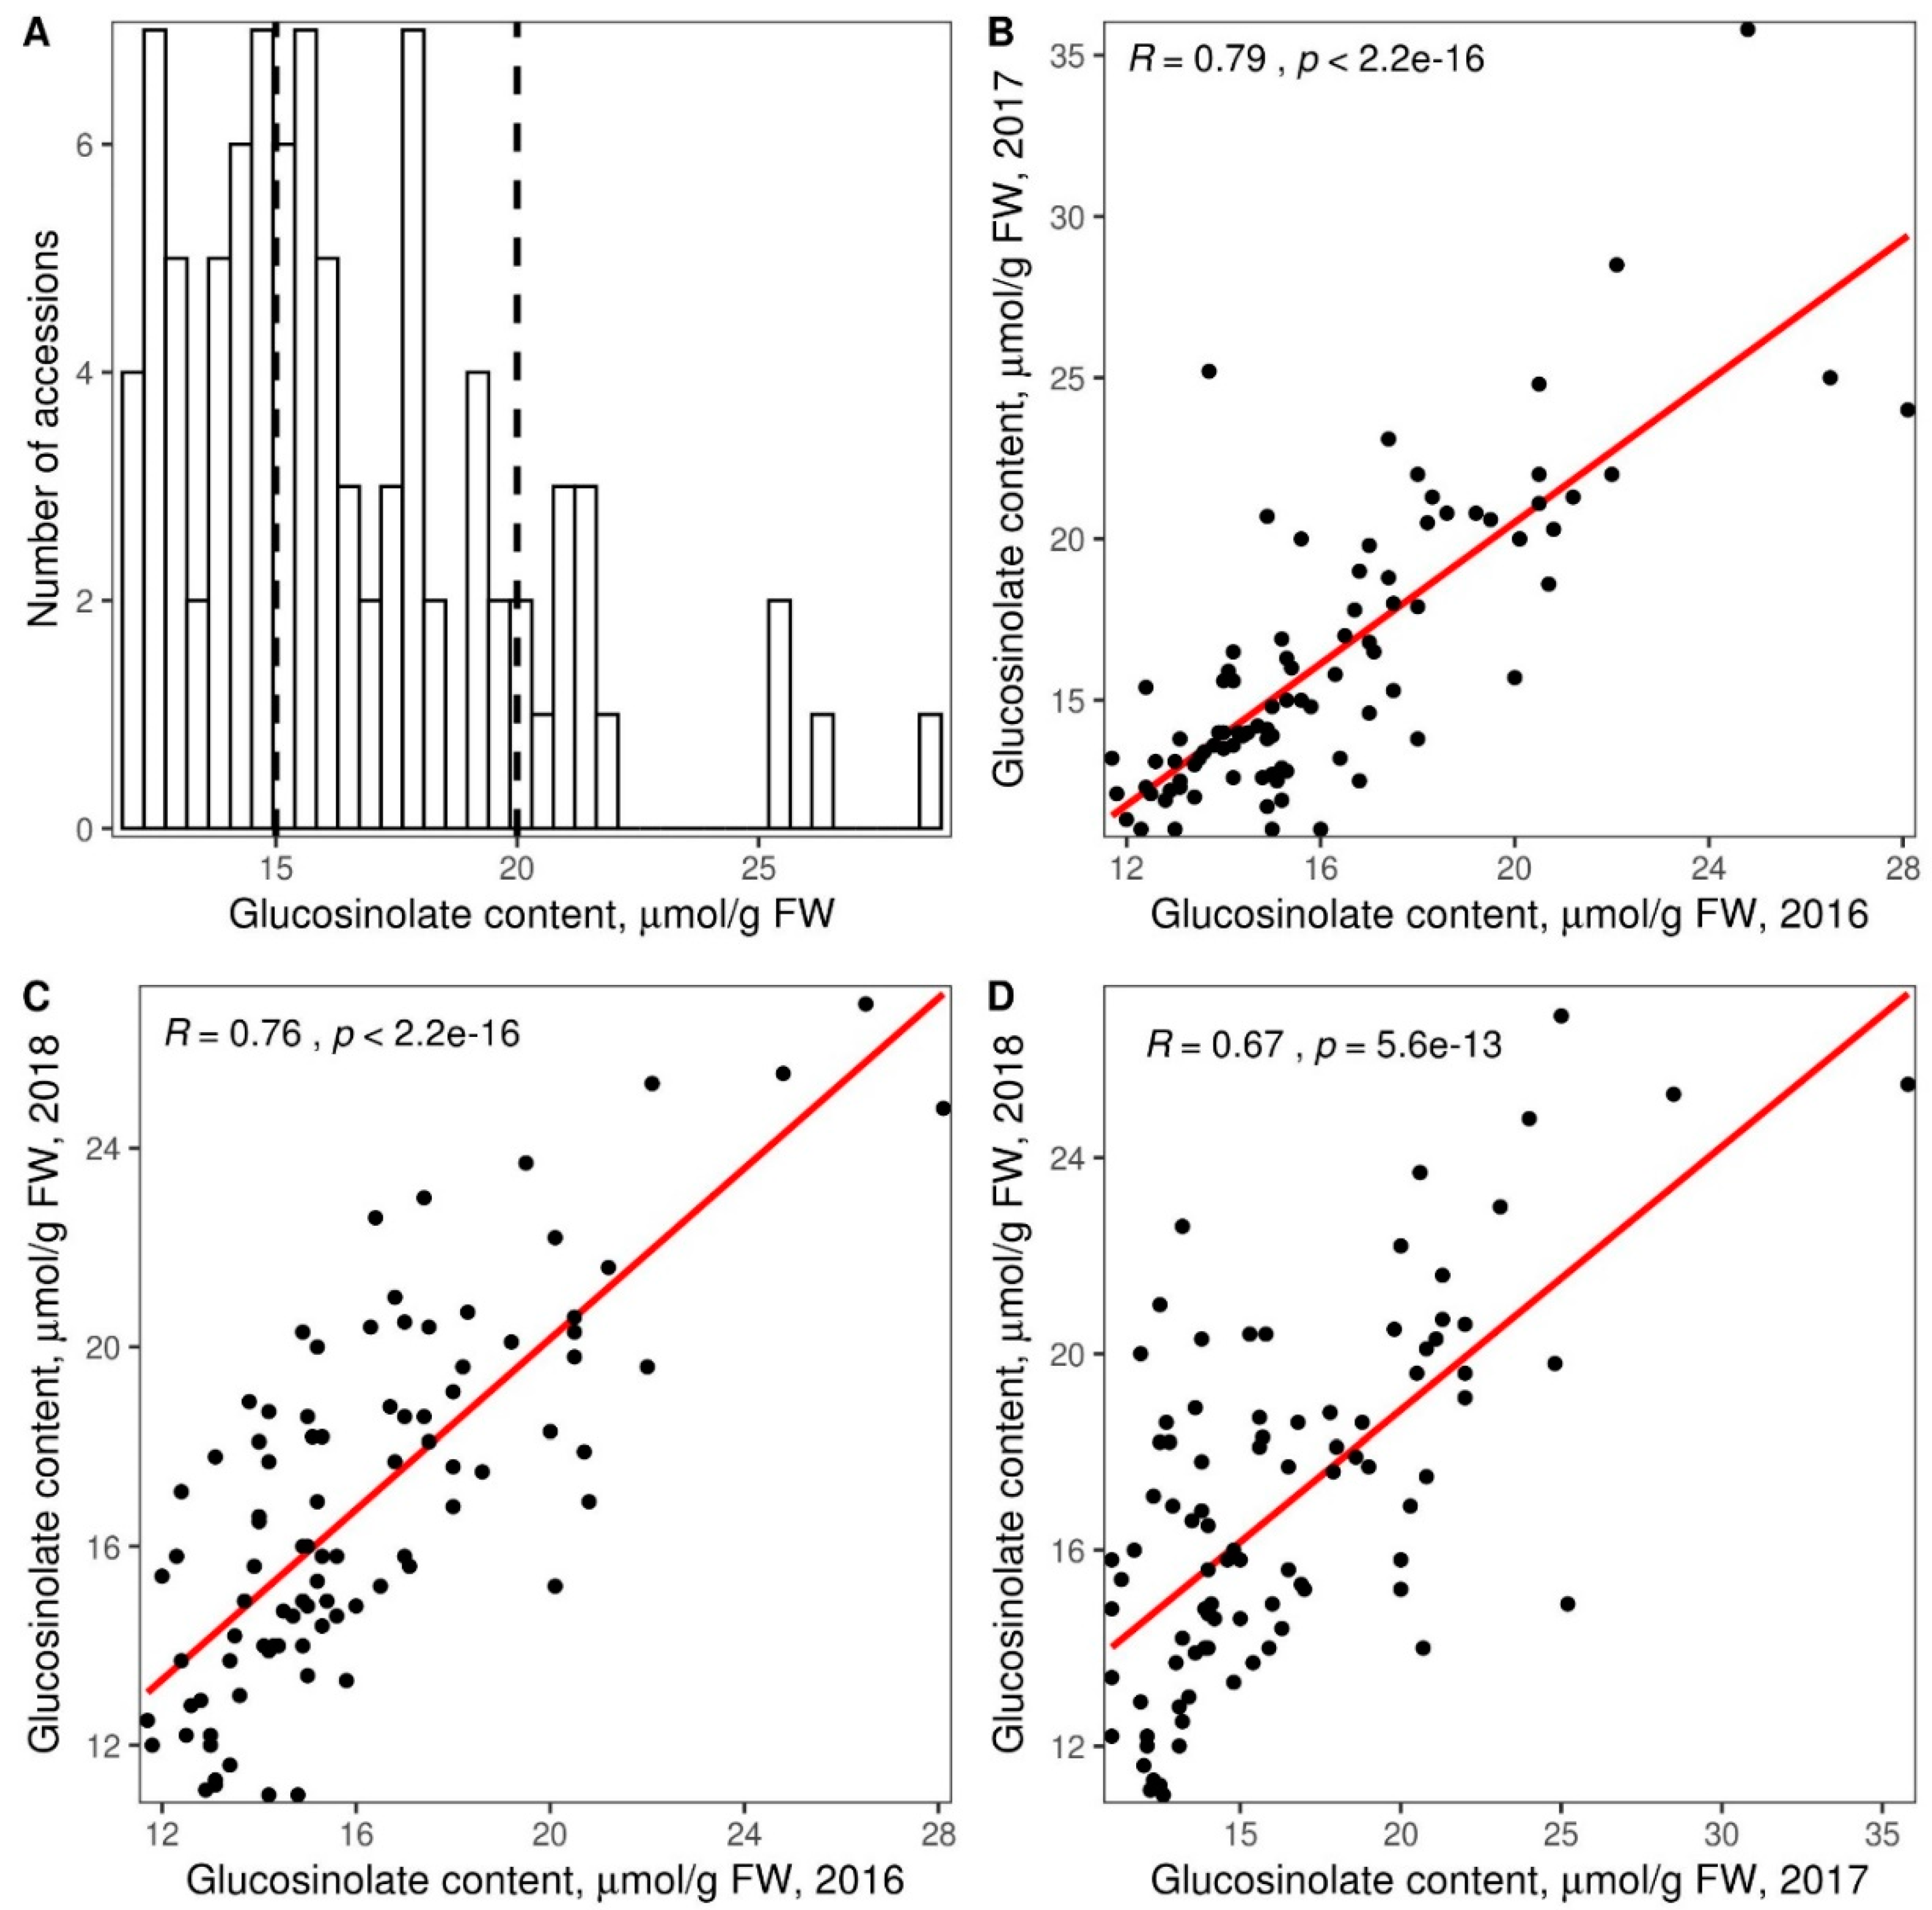
3.2. Glucosinolate Phenotyping and Genetic Association Analysis
4. Discussion
5. Conclusions
Supplementary Materials
Author Contributions
Funding
Acknowledgments
Conflicts of Interest
References
- Varshney, R.K.; Terauchi, R.; McCouch, S.R. Harvesting the Promising Fruits of Genomics: Applying Genome Sequencing Technologies to Crop Breeding. PLoS Biol. 2014, 12, e1001883. [Google Scholar] [CrossRef] [PubMed]
- Vinnichek, L.; Pogorelova, E.; Dergunov, A. Oilseed market: Global trends. IOP Conf. Ser. Earth Environ. Sci. 2019, 274, 012030. [Google Scholar] [CrossRef]
- Chalhoub, B.; Denoeud, F.; Liu, S.; Parkin, I.A.P.; Tang, H.; Wang, X.; Chiquet, J.; Belcram, H.; Tong, C.; Samans, B.; et al. Early allopolyploid evolution in the post-Neolithic Brassica napus oilseed genome. Science 2014, 345, 950–953. [Google Scholar] [CrossRef] [PubMed]
- Sun, F.; Fan, G.; Hu, Q.; Zhou, Y.; Guan, M.; Tong, C.; Li, J.; Du, D.; Qi, C.; Jiang, L.; et al. The high-quality genome of Brassica napus cultivar ‘ZS11’ reveals the introgression history in semi-winter morphotype. Plant J. 2017, 92, 452–468. [Google Scholar] [CrossRef] [PubMed]
- Wan, H.; Chen, L.; Guo, J.; Li, Q.; Wen, J.; Yi, B.; Ma, C.; Tu, J.; Fu, T.; Shen, J. Genome-Wide Association Study Reveals the Genetic Architecture Underlying Salt Tolerance-Related Traits in Rapeseed (Brassica napus L.). Front. Plant Sci. 2017, 8. [Google Scholar] [CrossRef]
- Zheng, M.; Peng, C.; Liu, H.; Tang, M.; Yang, H.; Li, X.; Liu, J.; Sun, X.; Wang, X.; Xu, J.; et al. Genome-Wide Association Study Reveals Candidate Genes for Control of Plant Height, Branch Initiation Height and Branch Number in Rapeseed (Brassica napus L.). Front. Plant Sci. 2017, 8. [Google Scholar] [CrossRef]
- Zhu, Q.; King, G.J.; Liu, X.; Shan, N.; Borpatragohain, P.; Baten, A.; Wang, P.; Luo, S.; Zhou, Q. Identification of SNP loci and candidate genes related to four important fatty acid composition in Brassica napus using genome wide association study. PLoS ONE 2019, 14, e0221578. [Google Scholar] [CrossRef]
- Gazave, E.; Tassone, E.E.; Ilut, D.C.; Wingerson, M.; Datema, E.; Witsenboer, H.M.A.; Davis, J.B.; Grant, D.; Dyer, J.M.; Jenks, M.A.; et al. Population Genomic Analysis Reveals Differential Evolutionary Histories and Patterns of Diversity across Subgenomes and Subpopulations of Brassica napus L. Front. Plant Sci. 2016, 7. [Google Scholar] [CrossRef]
- Lees, C.J.; Li, G.; Duncan, R.W. Characterization of Brassica napus L. genotypes utilizing sequence-related amplified polymorphism and genotyping by sequencing in association with cluster analysis. Mol. Breed. 2016, 36, 155. [Google Scholar] [CrossRef]
- Malmberg, M.M.; Pembleton, L.W.; Baillie, R.C.; Drayton, M.C.; Sudheesh, S.; Kaur, S.; Shinozuka, H.; Verma, P.; Spangenberg, G.C.; Daetwyler, H.D.; et al. Genotyping-by-sequencing through transcriptomics: Implementation in a range of crop species with varying reproductive habits and ploidy levels. Plant Biotechnol. J. 2018, 16, 877–889. [Google Scholar] [CrossRef]
- Wei, D.; Cui, Y.; He, Y.; Xiong, Q.; Qian, L.; Tong, C.; Lu, G.; Ding, Y.; Li, J.; Jung, C.; et al. A genome-wide survey with different rapeseed ecotypes uncovers footprints of domestication and breeding. J. Exp. Bot. 2017, 68, 4791–4801. [Google Scholar] [CrossRef] [PubMed]
- Wu, D.; Liang, Z.; Yan, T.; Xu, Y.; Xuan, L.; Tang, J.; Zhou, G.; Lohwasser, U.; Hua, S.; Wang, H.; et al. Whole-Genome Resequencing of a Worldwide Collection of Rapeseed Accessions Reveals the Genetic Basis of Ecotype Divergence. Mol. Plant 2019, 12, 30–43. [Google Scholar] [CrossRef] [PubMed]
- Clarke, W.E.; Higgins, E.E.; Plieske, J.; Wieseke, R.; Sidebottom, C.; Khedikar, Y.; Batley, J.; Edwards, D.; Meng, J.; Li, R.; et al. A high-density SNP genotyping array for Brassica napus and its ancestral diploid species based on optimised selection of single-locus markers in the allotetraploid genome. Theor. Appl. Genet. 2016, 129, 1887–1899. [Google Scholar] [CrossRef]
- Gacek, K.; Bayer, P.E.; Bartkowiak-Broda, I.; Szala, L.; Bocianowski, J.; Edwards, D.; Batley, J. Genome-Wide Association Study of Genetic Control of Seed Fatty Acid Biosynthesis in Brassica napus. Front. Plant Sci. 2017, 7. [Google Scholar] [CrossRef] [PubMed]
- Elbasyoni, I.S.; Lorenz, A.J.; Guttieri, M.; Frels, K.; Baenziger, P.S.; Poland, J.; Akhunov, E. A comparison between genotyping-by-sequencing and array-based scoring of SNPs for genomic prediction accuracy in winter wheat. Plant Sci. Int. J. Exp. Plant Biol. 2018, 270, 123–130. [Google Scholar] [CrossRef] [PubMed]
- Ganal, M.W.; Polley, A.; Graner, E.-M.; Plieske, J.; Wieseke, R.; Luerssen, H.; Durstewitz, G. Large SNP arrays for genotyping in crop plants. J. Biosci. 2012, 37, 821–828. [Google Scholar] [CrossRef]
- Negro, S.S.; Millet, E.J.; Madur, D.; Bauland, C.; Combes, V.; Welcker, C.; Tardieu, F.; Charcosset, A.; Nicolas, S.D. Genotyping-by-sequencing and SNP-arrays are complementary for detecting quantitative trait loci by tagging different haplotypes in association studies. BMC Plant Biol. 2019, 19. [Google Scholar] [CrossRef]
- Walker, K.C.; Booth, E.J. Agricultural aspects of rape and other Brassica products. Eur. J. Lipid Sci. Technol. 2001, 103, 441–446. [Google Scholar] [CrossRef]
- Wieczorek, M.N.; Walczak, M.; Skrzypczak-Zielińska, M.; Jeleń, H.H. Bitter taste of Brassica vegetables: The role of genetic factors, receptors, isothiocyanates, glucosinolates, and flavor context. Crit. Rev. Food Sci. Nutr. 2018, 58, 3130–3140. [Google Scholar] [CrossRef]
- Liu, Y.; Zhou, X.; Yan, M.; Wang, P.; Wang, H.; Xin, Q.; Yang, L.; Hong, D.; Yang, G. Fine mapping and candidate gene analysis of a seed glucosinolate content QTL, qGSL-C2, in rapeseed (Brassica napus L.). Theor. Appl. Genet. 2020, 133, 479–490. [Google Scholar] [CrossRef]
- Zhao, J.; Meng, J. Detection of loci controlling seed glucosinolate content and their association with Sclerotinia resistance in Brassica napus. Plant Breed. 2003, 122, 19–23. [Google Scholar] [CrossRef]
- He, Y.; Fu, Y.; Hu, D.; Wei, D.; Qian, W. QTL Mapping of Seed Glucosinolate Content Responsible for Environment in Brassica napus. Front. Plant Sci. 2018, 9. [Google Scholar] [CrossRef] [PubMed]
- Liu, J.; Hirani, A.H.; Li, Z.; Wu, C.; McVetty, P.B.; Daayf, F.; Li, G. QTL controlling glucosinolate content in seeds of “Brassica napus” L. Aust. J. Crop Sci. 2016, 10, 152. [Google Scholar]
- Liu, S.; Huang, H.; Yi, X.; Zhang, Y.; Yang, Q.; Zhang, C.; Fan, C.; Zhou, Y. Dissection of genetic architecture for glucosinolate accumulations in leaves and seeds of Brassica napus by genome-wide association study. Plant Biotechnol. J. 2019. [Google Scholar] [CrossRef] [PubMed]
- Qu, C.-M.; Li, S.-M.; Duan, X.-J.; Fan, J.-H.; Jia, L.-D.; Zhao, H.-Y.; Lu, K.; Li, J.-N.; Xu, X.-F.; Wang, R. Identification of Candidate Genes for Seed Glucosinolate Content Using Association Mapping in Brassica napus L. Genes 2015, 6, 1215. [Google Scholar] [CrossRef]
- Wei, D.; Cui, Y.; Mei, J.; Qian, L.; Lu, K.; Wang, Z.-M.; Li, J.; Tang, Q.; Qian, W. Genome-wide identification of loci affecting seed glucosinolate contents in Brassica napus L. J. Integr. Plant Biol. 2019, 61, 611–623. [Google Scholar] [CrossRef]
- Goncharov, S.V.; Gorlova, L.A. Oilseeds: New Challenges and Trends of Their Development (Article in Russian). Oilseeds Sci. Tech. Bull. All Russ. Res. Inst. Oil Crops 2018, 96–100. [Google Scholar] [CrossRef]
- Goncharov, S.V.; Gorlova, L.A. Change in rapeseed assortment in Russia as a result of competition in the seed market (Article in Russian). Oilseeds Sci. Tech. Bull. All Russ. Res. Inst. Oil Crops 2018, 36–41. [Google Scholar] [CrossRef]
- Thies, W. Complex-Formation between Glucosinolates and Tetrachloropalladate(II) and its Utilization in Plant Breeding. Fette Seifen Anstrichm. 1982, 84, 338–342. [Google Scholar] [CrossRef]
- Goryunov, D.V.; Anisimova, I.N.; Gavrilova, V.A.; Chernova, A.I.; Sotnikova, E.A.; Martynova, E.U.; Boldyrev, S.V.; Ayupova, A.F.; Gubaev, R.F.; Mazin, P.V.; et al. Association Mapping of Fertility Restorer Gene for CMS PET1 in Sunflower. Agronomy 2019, 9, 49. [Google Scholar] [CrossRef]
- Murray, K.D.; Borevitz, J.O. Axe: Rapid, competitive sequence read demultiplexing using a trie. Bioinformatics 2018, 34, 3924–3925. [Google Scholar] [CrossRef] [PubMed]
- Bolger, A.M.; Lohse, M.; Usadel, B. Trimmomatic: A flexible trimmer for Illumina sequence data. Bioinforma. Oxf. Engl. 2014, 30, 2114–2120. [Google Scholar] [CrossRef] [PubMed]
- Li, H.; Durbin, R. Fast and accurate short read alignment with Burrows-Wheeler transform. Bioinforma. Oxf. Engl. 2009, 25, 1754–1760. [Google Scholar] [CrossRef] [PubMed]
- McKenna, A.; Hanna, M.; Banks, E.; Sivachenko, A.; Cibulskis, K.; Kernytsky, A.; Garimella, K.; Altshuler, D.; Gabriel, S.; Daly, M.; et al. The Genome Analysis Toolkit: A MapReduce framework for analyzing next-generation DNA sequencing data. Genome Res. 2010, 20, 1297–1303. [Google Scholar] [CrossRef] [PubMed]
- Alexander, D.H.; Novembre, J.; Lange, K. Fast model-based estimation of ancestry in unrelated individuals. Genome Res. 2009, 19, 1655–1664. [Google Scholar] [CrossRef] [PubMed]
- Purcell, S.; Neale, B.; Todd-Brown, K.; Thomas, L.; Ferreira, M.A.R.; Bender, D.; Maller, J.; Sklar, P.; de Bakker, P.I.W.; Daly, M.J.; et al. PLINK: A tool set for whole-genome association and population-based linkage analyses. Am. J. Hum. Genet. 2007, 81, 559–575. [Google Scholar] [CrossRef]
- Malmberg, M.M.; Shi, F.; Spangenberg, G.C.; Daetwyler, H.D.; Cogan, N.O.I. Diversity and Genome Analysis of Australian and Global Oilseed Brassica napus L. Germplasm Using Transcriptomics and Whole Genome Re-sequencing. Front. Plant Sci. 2018, 9. [Google Scholar] [CrossRef]
- Li, H. A statistical framework for SNP calling, mutation discovery, association mapping and population genetical parameter estimation from sequencing data. Bioinforma. Oxf. Engl. 2011, 27, 2987–2993. [Google Scholar] [CrossRef]
- Bradbury, P.J.; Zhang, Z.; Kroon, D.E.; Casstevens, T.M.; Ramdoss, Y.; Buckler, E.S. TASSEL: Software for association mapping of complex traits in diverse samples. Bioinformatics 2007, 23, 2633–2635. [Google Scholar] [CrossRef]
- Quijano Xacur, O.A. The unifed distribution. J. Stat. Distrib. Appl. 2019, 6, 13. [Google Scholar] [CrossRef]
- Cingolani, P.; Platts, A.; Wang, L.L.; Coon, M.; Nguyen, T.; Wang, L.; Land, S.J.; Lu, X.; Ruden, D.M. A program for annotating and predicting the effects of single nucleotide polymorphisms, SnpEff. Fly 2012, 6, 80–92. [Google Scholar] [CrossRef]
- Li, F.; Chen, B.; Xu, K.; Wu, J.; Song, W.; Bancroft, I.; Harper, A.L.; Trick, M.; Liu, S.; Gao, G.; et al. Genome-wide association study dissects the genetic architecture of seed weight and seed quality in rapeseed (Brassica napus L.). DNA Res. Int. J. Rapid Publ. Rep. Genes Genomes 2014, 21, 355–367. [Google Scholar] [CrossRef] [PubMed]
- Jan, H.U.; Guan, M.; Yao, M.; Liu, W.; Wei, D.; Abbadi, A.; Zheng, M.; He, X.; Chen, H.; Guan, C.; et al. Genome-wide haplotype analysis improves trait predictions in Brassica napus hybrids. Plant Sci. 2019, 283, 157–164. [Google Scholar] [CrossRef] [PubMed]
- Camacho, C.; Coulouris, G.; Avagyan, V.; Ma, N.; Papadopoulos, J.; Bealer, K.; Madden, T.L. BLAST+: Architecture and applications. BMC Bioinform. 2009, 10, 421. [Google Scholar] [CrossRef] [PubMed]
- Guo, R.; Qian, H.; Shen, W.; Liu, L.; Zhang, M.; Cai, C.; Zhao, Y.; Qiao, J.; Wang, Q. BZR1 and BES1 participate in regulation of glucosinolate biosynthesis by brassinosteroids in Arabidopsis. J. Exp. Bot. 2013, 64, 2401–2412. [Google Scholar] [CrossRef] [PubMed]
- Hinckley, W.E.; Keymanesh, K.; Cordova, J.A.; Brusslan, J.A. The HAC1 histone acetyltransferase promotes leaf senescence and regulates the expression of ERF022. Plant Direct 2019, 3, e00159. [Google Scholar] [CrossRef] [PubMed]
- Geu-Flores, F.; Nielsen, M.T.; Nafisi, M.; Møldrup, M.E.; Olsen, C.E.; Motawia, M.S.; Halkier, B.A. Glucosinolate engineering identifies a γ-glutamyl peptidase. Nat. Chem. Biol. 2009, 5, 575–577. [Google Scholar] [CrossRef]
- Geu-Flores, F.; Møldrup, M.E.; Böttcher, C.; Olsen, C.E.; Scheel, D.; Halkier, B.A. Cytosolic γ-Glutamyl Peptidases Process Glutathione Conjugates in the Biosynthesis of Glucosinolates and Camalexin in Arabidopsis. Plant Cell 2011, 23, 2456–2469. [Google Scholar] [CrossRef]
- Bus, A.; Körber, N.; Snowdon, R.J.; Stich, B. Patterns of molecular variation in a species-wide germplasm set of Brassica napus. TAG Theor. Appl. Genet. Theor. Angew. Genet. 2011, 123, 1413–1423. [Google Scholar] [CrossRef]
- Dong, H.; Tan, C.; Li, Y.; He, Y.; Wei, S.; Cui, Y.; Chen, Y.; Wei, D.; Fu, Y.; He, Y.; et al. Genome-Wide Association Study Reveals Both Overlapping and Independent Genetic Loci to Control Seed Weight and Silique Length in Brassica napus. Front. Plant Sci. 2018, 9. [Google Scholar] [CrossRef]
- Qian, L.; Qian, W.; Snowdon, R.J. Sub-genomic selection patterns as a signature of breeding in the allopolyploid Brassica napus genome. BMC Genom. 2014, 15, 1170. [Google Scholar] [CrossRef] [PubMed]
- Guan, M.; Huang, X.; Xiao, Z.; Jia, L.; Wang, S.; Zhu, M.; Qiao, C.; Wei, L.; Xu, X.; Liang, Y.; et al. Association Mapping Analysis of Fatty Acid Content in Different Ecotypic Rapeseed Using mrMLM. Front. Plant Sci. 2019, 9. [Google Scholar] [CrossRef] [PubMed]
- Zhou, Q.; Han, D.; Mason, A.S.; Zhou, C.; Zheng, W.; Li, Y.; Wu, C.; Fu, D.; Huang, Y. Earliness traits in rapeseed (Brassica napus): SNP loci and candidate genes identified by genome-wide association analysis. DNA Res. Int. J. Rapid Publ. Rep. Genes Genomes 2018, 25, 229–244. [Google Scholar] [CrossRef] [PubMed]
- Kittipol, V.; He, Z.; Wang, L.; Doheny-Adams, T.; Langer, S.; Bancroft, I. Genetic architecture of glucosinolate variation in Brassica napus. J. Plant Physiol. 2019, 240. [Google Scholar] [CrossRef] [PubMed]


© 2020 by the authors. Licensee MDPI, Basel, Switzerland. This article is an open access article distributed under the terms and conditions of the Creative Commons Attribution (CC BY) license (http://creativecommons.org/licenses/by/4.0/).
Share and Cite
Gubaev, R.; Gorlova, L.; Boldyrev, S.; Goryunova, S.; Goryunov, D.; Mazin, P.; Chernova, A.; Martynova, E.; Demurin, Y.; Khaitovich, P. Genetic Characterization of Russian Rapeseed Collection and Association Mapping of Novel Loci Affecting Glucosinolate Content. Genes 2020, 11, 926. https://doi.org/10.3390/genes11080926
Gubaev R, Gorlova L, Boldyrev S, Goryunova S, Goryunov D, Mazin P, Chernova A, Martynova E, Demurin Y, Khaitovich P. Genetic Characterization of Russian Rapeseed Collection and Association Mapping of Novel Loci Affecting Glucosinolate Content. Genes. 2020; 11(8):926. https://doi.org/10.3390/genes11080926
Chicago/Turabian StyleGubaev, Rim, Lyudmila Gorlova, Stepan Boldyrev, Svetlana Goryunova, Denis Goryunov, Pavel Mazin, Alina Chernova, Elena Martynova, Yakov Demurin, and Philipp Khaitovich. 2020. "Genetic Characterization of Russian Rapeseed Collection and Association Mapping of Novel Loci Affecting Glucosinolate Content" Genes 11, no. 8: 926. https://doi.org/10.3390/genes11080926
APA StyleGubaev, R., Gorlova, L., Boldyrev, S., Goryunova, S., Goryunov, D., Mazin, P., Chernova, A., Martynova, E., Demurin, Y., & Khaitovich, P. (2020). Genetic Characterization of Russian Rapeseed Collection and Association Mapping of Novel Loci Affecting Glucosinolate Content. Genes, 11(8), 926. https://doi.org/10.3390/genes11080926