1. Introduction
Species are isolated from one another by reproductive barriers that limit gene flow, allowing each species to evolve along a separate trajectory. One of the first reproductive barriers to arise between species is behavioral isolation [
1,
2], which prevents mating between males and females from different species. Behavioral isolation is thought to have a greater effect on reproductive isolation as it acts earlier in the reproductive cycle [
3] and is more often found to be the only isolating mechanism between species [
1,
4]. This barrier arises due to divergence in the two species for traits necessary for successful recognition and acquisition of mates, such as differences in pheromone composition (e.g., [
5,
6]) or courtship song (e.g., [
7,
8]). While the results of speciation are usually easily observed, and the ecological basis of many speciation events have been well characterized, the genetic mechanisms via which it occurs remain unclear.
The well-characterized courtship behavior of
Drosophila, paired with the wealth of genetic information available for many
Drosophila species, makes this system an ideal and appropriate model for behavioral isolation studies. The traits that may underlie species isolation among
Drosophila often vary within species. For example, the composition of cuticular hydrocarbons (CHCs), used both as pheromones and for desiccation resistance in
Drosophila, can vary clinally among populations [
9,
10] and diverge between species [
11,
12]. Similarly, courtship song has been shown to vary within (e.g., [
13]) and between (e.g., [
14]) species. Within-species variation can influence the potential for incipient speciation between populations [
15,
16], as well as the strength of isolation between different populations of a species with a sister species [
17,
18]. While the genetic basis of behavioral variation within a species could reasonably be assumed to also contribute to behavioral isolation between species, there is some evidence that the underlying basis of these two traits is instead genetically distinct [
19,
20,
21], but more studies are needed.
The quantitative genetic basis of behavioral isolation between
Drosophila species has been mapped in a number of studies (for reviews, see [
3,
22]). While these studies have not been refined to the level of individual genetic loci, comparisons of the mapped regions have allowed for an assessment of broad evolutionary questions. For example, the genomic regions contributing to behavioral isolation were largely mapped to regions of low recombination [
23]. While the loci for male traits and female preference do not generally appear to co-localize in the genome [
15,
24,
25,
26,
27,
28,
29], these maps are often not refined enough to exclude the possibility of colocalization, and there is evidence that it can occur for the traits and preferences underlying behavioral isolation [
30].
One of the most widely studied genetic model systems for studying reproductive isolation in
Drosophila is the species pair
D. simulans and
D. mauritiana, which are members of the melanogaster subgroup.
D. simulans is generally found worldwide and is allopatric to
D. mauritiana, which is endemic to the island of Mauritius in the Indian Ocean [
25]. The genomes of these two species are almost entirely homosequential, and individual flies can only be phenotypically distinguished from one another morphologically by the shape of the male genital arch [
25]. When paired, these two species exhibit asymmetrical sexual isolation [
25]:
D. mauritiana females rarely mate with
D. simulans males, while
D. simulans females will readily mate with
D. mauritiana males. While this mate discrimination has been well documented, the individual genetic bases of the
D. mauritiana female discrimination and the
D. simulans male traits they are discriminating against remain largely unknown.
A previous study that mapped the genetic basis of behavioral isolation between
D. simulans and
D. mauritiana found seven loci in females for
D. mauritiana female preference, found on all three major chromosomes, and three loci in males for the
D. simulans male trait being discriminated against, all on the third chromosome [
31]. Using the same strains of the two species, a later study confirmed two of these regions using introgressions (the third was not tested) and found a genetic linkage between the male trait and female preference loci [
30]. Here, we expand upon these previous findings to examine whether the loci contributing to behavioral isolation between two species also vary within a species, and whether the genetic contributions to behavioral isolation are robust to subtle variations in a behavior assay. We focus solely on the
D. simulans male traits these females are discriminating against, since this species has a worldwide distribution with a greater potential for population variation, while
D. mauritiana is endemic to a small island. We focus on the third chromosome since all of the regions exhibiting significant associations with the male behavioral isolation traits were located on this chromosome in the original quantitative trait locus (QTL) map.
We first assessed whether there was variation in the strength of behavioral isolation between
D. mauritiana females and males from different strains of
D. simulans. We next performed QTL mapping for courtship and copulation traits in strains from three populations of
D. simulans: the strain used in the original mapping study (
simulans FC: [
31]), a strain conferring relatively high mating of F
1 hybrid males with
D. mauritiana females, and a strain conferring relatively low mating of F
1 hybrid males with
D. mauritiana females. We then repeated these experiments using a slightly different assay paradigm on the same three strains of
D. simulans used above, plus five additional strains of
D. simulans. A comparison of the genetic regions (QTL) contributing significantly to behavioral isolation in these different conditions and across different strains allows for the assessment of whether the same loci or different loci contribute to intraspecific variation in interspecific mating success, and how robust the genetic maps of this trait are when there is a subtle variation in protocol.
2. Materials and Methods
2.1. Drosophila Stocks and Crosses
All stocks, crosses, and collected virgins were maintained on a 14:10 h light–dark cycle at 24 °C and 75% relative humidity in 30 mL (8 dram) vials containing approximately 7 mL of standard Bloomington recipe fly food (Bloomington
Drosophila Stock Center). Six lines of
D. simulans were obtained from the
Drosophila Species Stock Center:
sim194 (14021-0251.194 from Winters, California),
sim196 (14021-0251.196 from Ansirable, Madagascar),
sim197 (14021-0251.197 from Joffreville, Madagascar),
sim198 (14021-0251.198 from Noumea, New Caledonia),
sim199 (14021-0251.199 from Nanyuki, Kenya), and
sim216 (14021-0251.216 from Winters, California).
D. simulans Florida City (
simFC from Florida City, Florida; [
25]),
D. simulans 167.4 (
sim167.4 from Nanyuki, Kenya), and
D. mauritiana Synthetic (
mauSYN; [
25]) were provided by J. Coyne. The
D. simulans strains were selected to represent both a range and a replication of geographic locations.
For all crosses, 6–10 virgin females were paired with 6–10 virgin males, all aged 5–7 days. We first assessed whether there was variation among strains in the degree to which D. simulans males are rejected by D. mauritiana females. Since D. mauritiana females reject pure-species D. simulans males 100% of the time in our assays, we assayed the strain variation using F1 interspecies males. Virgin D. simulans females of the eight strains were each crossed to mauSYN males, producing F1 males for assays.
Male F
1 hybrids between these two species are sterile, but female F
1 hybrids are fertile [
25] and can be used to create recombinant backcross offspring. In the first round of backcross experiments, virgin
D. simulans females of
sim197,
sim216, and
simFC were each crossed to
mauSYN males. These lines were chosen because they had the lowest tendency to mate with
D. mauritiana, had the highest tendency to mate with
D. mauritiana, and were the original line tested [
31], respectively. The resulting F
1 females were collected as virgins and then backcrossed (BC) to
mauSYN males, creating three populations of males used in behavioral assays and subsequent QTL mapping: BC
197, BC
216, and BC
FC, respectively.
In the second round of backcross experiments, conducted 2 years later, virgin D. simulans females of each of the eight lines were crossed to mauSYN males; the resulting F1 females were backcrossed to mauSYN males to make eight populations of backcross males used in behavior assays and mapping: BC167, BC194, BC196, BC197, BC198, BC199, BC216, and BCFC. For all backcrosses, at least 15 independent vials of cross were made for each backcross type. The BC generation possesses one homolog of each chromosome that is entirely D. mauritiana, and the other homolog of each chromosome is a unique mix of D. mauritiana and D. simulans genetic material created through recombination in the F1 female.
2.2. Behavior Assays
No-choice behavioral assays were performed to determine whether male flies were successful in copulating with D. mauritiana female flies. All tested flies were collected as virgins and aged 5–7 days prior to behavioral assays to ensure reproductive maturity. All assays occurred at room temperature (22–24 °C) between 2 and 3 h of ‘lights on’.
For the initial pure-species and F
1 assays, a single male and a single
mauSYN female were aspirated into an 8 dram polystyrene vial containing approximately 2 mL of food medium. Flies were assayed for 45 min in groupings of ~20–30 being observed simultaneously, with equal or near-equal representation from each strain in each assay to control for environmental effects (e.g., [
32]). Whether courtship and copulation occurred was scored. We scored 20 pure-species and 39 F
1 males from each strain.
In the first round of BC male assays, a single male and a single
mauSYN female were aspirated into an 8 dram polystyrene vial containing approximately 2 mL of food medium. Flies were assayed for 1 h in groupings of ~40–60, with equal or near-equal representation from each strain. We scored 493 BC
197, 491 BC
216, and 507 BC
FC males. The original assay using BC
FC [
31] only found significant QTL for the proportion of males that copulated out of those that courted; thus, we used that same metric here of “copulation occurrence” being analyzed only for those assays in which the male courted the female (
N = 292 BC
197, 349 BC
216, and 332 BC
FC). Only those that courted (then mated or did not mate) were used for this metric to ensure that the assay was scoring
mau female choosiness against courting males, and not scoring whether or not a male chose to court a female. To test whether other aspects of mating behavior are also consistent across strains, we additionally scored the time until first courtship (courtship latency), time until successful copulation (copulation latency), and the time from the start to the end of copulation (copulation duration). Note that these traits did not have any significant QTL in the original study’s assay of BC
FC males. After the assay, BC males were promptly frozen and stored at −20 °C.
We performed the second round of assays under slightly different environmental conditions to assess whether QTL are robust across subtle environmental variations. In the second round of assays, a single BC male and a single mauSYN female were aspirated into an 8 dram glass vial sprayed with a light mist of water to provide humidity. Flies were assayed for 1 h in groupings of ~60–100, with equal or near-equal representation from each strain in each assay to control for environmental effects. Males that courted were scored for copulation occurrence; males that did not court were discarded and not genotyped. Approximately 150 individual males that courted were scored for each of the eight D. simulans lines (BC167 = 147, BC194 = 151, BC196 = 155, BC197 = 150, BC198 = 156, BC199 = 160, BC216 = 152, and BCFC = 152), for a total of 1223 BC male flies. As above, BC males were promptly frozen and stored at −20 °C for later genotyping.
2.3. Molecular Markers
DNA was extracted from the assayed BC males using Engel’s method [
33], standard PCR was used to amplify a single marker or multiplex PCR was used to amplify several markers simultaneously [
34], and then the products were visualized using either a 3% agarose gel or fragment analysis, respectively (see below). A touchdown PCR protocol was followed [
35], with annealing temperatures as follows: 95 °C 5 min, three cycles 94 °C 1 min/55 °C 30 s/72 °C 30 s, three cycles 94 °C 1 min/53 °C 30 s/72 °C 30 s, 30 cycles 94 °C 1 min/50 °C 30 s/72 °C 30 s, 5 °C 3 min.
The first round of assays was genotyped for nine molecular markers on the third chromosome (
Supplementary Tables S1 and S2). These microsatellite markers had a size difference between the two species; thus, BC individuals would either be homozygous for the
D. mauritiana genome and have one product on an agarose gel or would be heterozygous and have two differently sized products. To confirm expected band sizes, DNA samples extracted from each of
D. simulans, D. mauritiana, and an F1
simulans/mauritiana hybrid were used as controls. Some microsatellites did not have a notable size difference between a particular strain of
D. simulans and the size in
D. mauritiana; an alternate nearby microsatellite was used in these cases. The cytological locations of markers (based on
D. melanogaster cytology) were as follows: 62B, 63E, 73C, 78D, 82D, 84D/E, 90B, 97D, and 100E. The markers were intentionally clustered around the centromere and telomeres as this is where the initial genetic map identified significant regions contributing to behavioral isolation.
The second round of assays was also genotyped, using 12 microsatellite markers (
Supplementary Tables S1 and S3), but the size differences were assessed using fragment analysis rather than agarose gels, as this method allowed for amplifying all markers simultaneously. In fragment analysis, each of the primer pairs is fluorescently labeled with a different fluorophore, allowing amplified products to be distinguished when run together. Following PCR, samples were dehydrated using an Eppendorf Vacufuge and then shipped to the NAPS Unit at UBC for analysis. Genemapper software was used to classify each individual as either homozygous or heterozygous. The same controls were used as above. Any individual marker genotypes that did not amplify via fragment analysis were reamplified individually via PCR and visualized on an agarose gel. The cytological locations of markers were as follows: 61B, 62B, 63E, 73C, 78D, 82D, 84E, 93E, 94A, 95F, 97F, and 100E.
2.4. QTL Mapping
All raw behavior and genotyping data can be found in
Supplementary Tables S2 and S3. The raw data from [
31] can be found in
Supplementary Table S4. QTL were mapped with this data using composite interval mapping (CIM; [
36]) as implemented by QTL Cartographer software [
37]. This software calculates the likelihood ratio (LR), which is the likelihood of a gene for the trait of interest being present in the interval between two markers. LR values were calculated every 2 cM with marker cofactors at distances greater than 10 cM. The threshold above which the LR value is statistically significant at
p ≤ 0.05 were calculated separately for each line and trait using 1000 permutations of the data, which takes marker correlations and multiple testing effects into consideration [
38,
39]. Since we wanted a permissive, rather than restrictive, comparison, we also calculated significant regions with the less stringent cutoff of
p ≤ 0.1 for the strains that were tested, since their sample size was smaller than that of the original study. While the score of copulation occurrence violates the assumption of normality for CIM mapping since it is a binary measure, CIM has previously been shown to be very robust to departures from normality (e.g., [
31]. QTL boundaries were estimated from the threshold determined by permutations or the 2-LOD support intervals (
p < 0.05), whichever was reached first. QTL effects were calculated at each LR peak as the difference between the phenotypes of heterozygotes vs. homozygotes, scaled by the standard deviation. The proportion of the variance accounted for by the QTL was calculated as
R2 = (
s02 −
s12)/
s2, where
s02 is the sample variance of the residuals,
s12 is the variance of the residuals, and
s2 is the variance of the trait; this value is then scaled by the cofactors in the model to give the adjusted proportion of the variance accounted for by the QTL (called
TR2).
For the first round of assays, using three strains of
D. simulans, we tested for epistasis between loci for mating success in males using multiple interval mapping (MIM) in QTL Cartographer. We did not perform this analysis for the second round of assays on eight strains as the sample size was too small. We used a window size of 10, walk speed of 1 cM, and a significance threshold of 0.10. It was previously shown that a threshold of 0.10 does not compromise the number of false positives and is more likely to capture significant effects than a threshold of 0.05 [
40]. We attempted to identify epistasis between QTLs identified using CIM, as well as between QTLs and genomic regions that did not contain a significant QTL.
We compared whether the same three significant QTL in the original map of BC
FC-ORIG also impacted copulation occurrence when compared to the first or second rounds of assays with BC
FC in the current study. We used a three-way contingency test based on a log-linear model [
41] with the groups being strain (BC
FC-ORIG vs. BC
FC), genotype (heterozygous vs. homozygous), and copulation occurrence (yes vs. no). We used the raw data for the markers closest to the three QTL peaks in BC
FC-ORIG [
31] and compared to the data for the closest markers to those same BC
FC-ORIG peak locations in the new assays of BC
FC. We repeated this same analysis across the eight strains used in round 2.
3. Results
We first quantified whether there was variation in behavioral isolation between different strains of
D. simulans and
D. mauritiana. Although qualitatively almost all of the
D. simulans males of the eight strains we tested courted a
D. mauritiana female, none of them copulated within our 1 h assay (
N = 20), indicating that mating rates were necessarily quite low among all strains. We, therefore, tested F
1 interspecies males made from each of the eight strains to determine if there was genetic variation across the strains for mating success with
D. mauritiana females. We found that 77–95% of F
1 males courted
D. mauritiana females, and, of those males that courted, 10–57% achieved copulation (
Table 1).
In the first round of assays, we tested backcross (BC) males made from the strain used in the original study (BC
FC; [
31]), and the strains we found had the lowest (BC
197) and highest (BC
216) amount of mating with
D. mauritiana (
Table 1). We scored the BC males made from these three lines for their mating success with
D. mauritiana females when assayed in the presence of food. In the second round of assays, we again tested BC males from the above three strains, plus the remaining five strains listed in
Table 1, for their mating success with
D. mauritiana females, but this time assayed in the presence of moisture but no food. We then genotyped and performed QTL mapping to identify genomic regions affecting mating success.
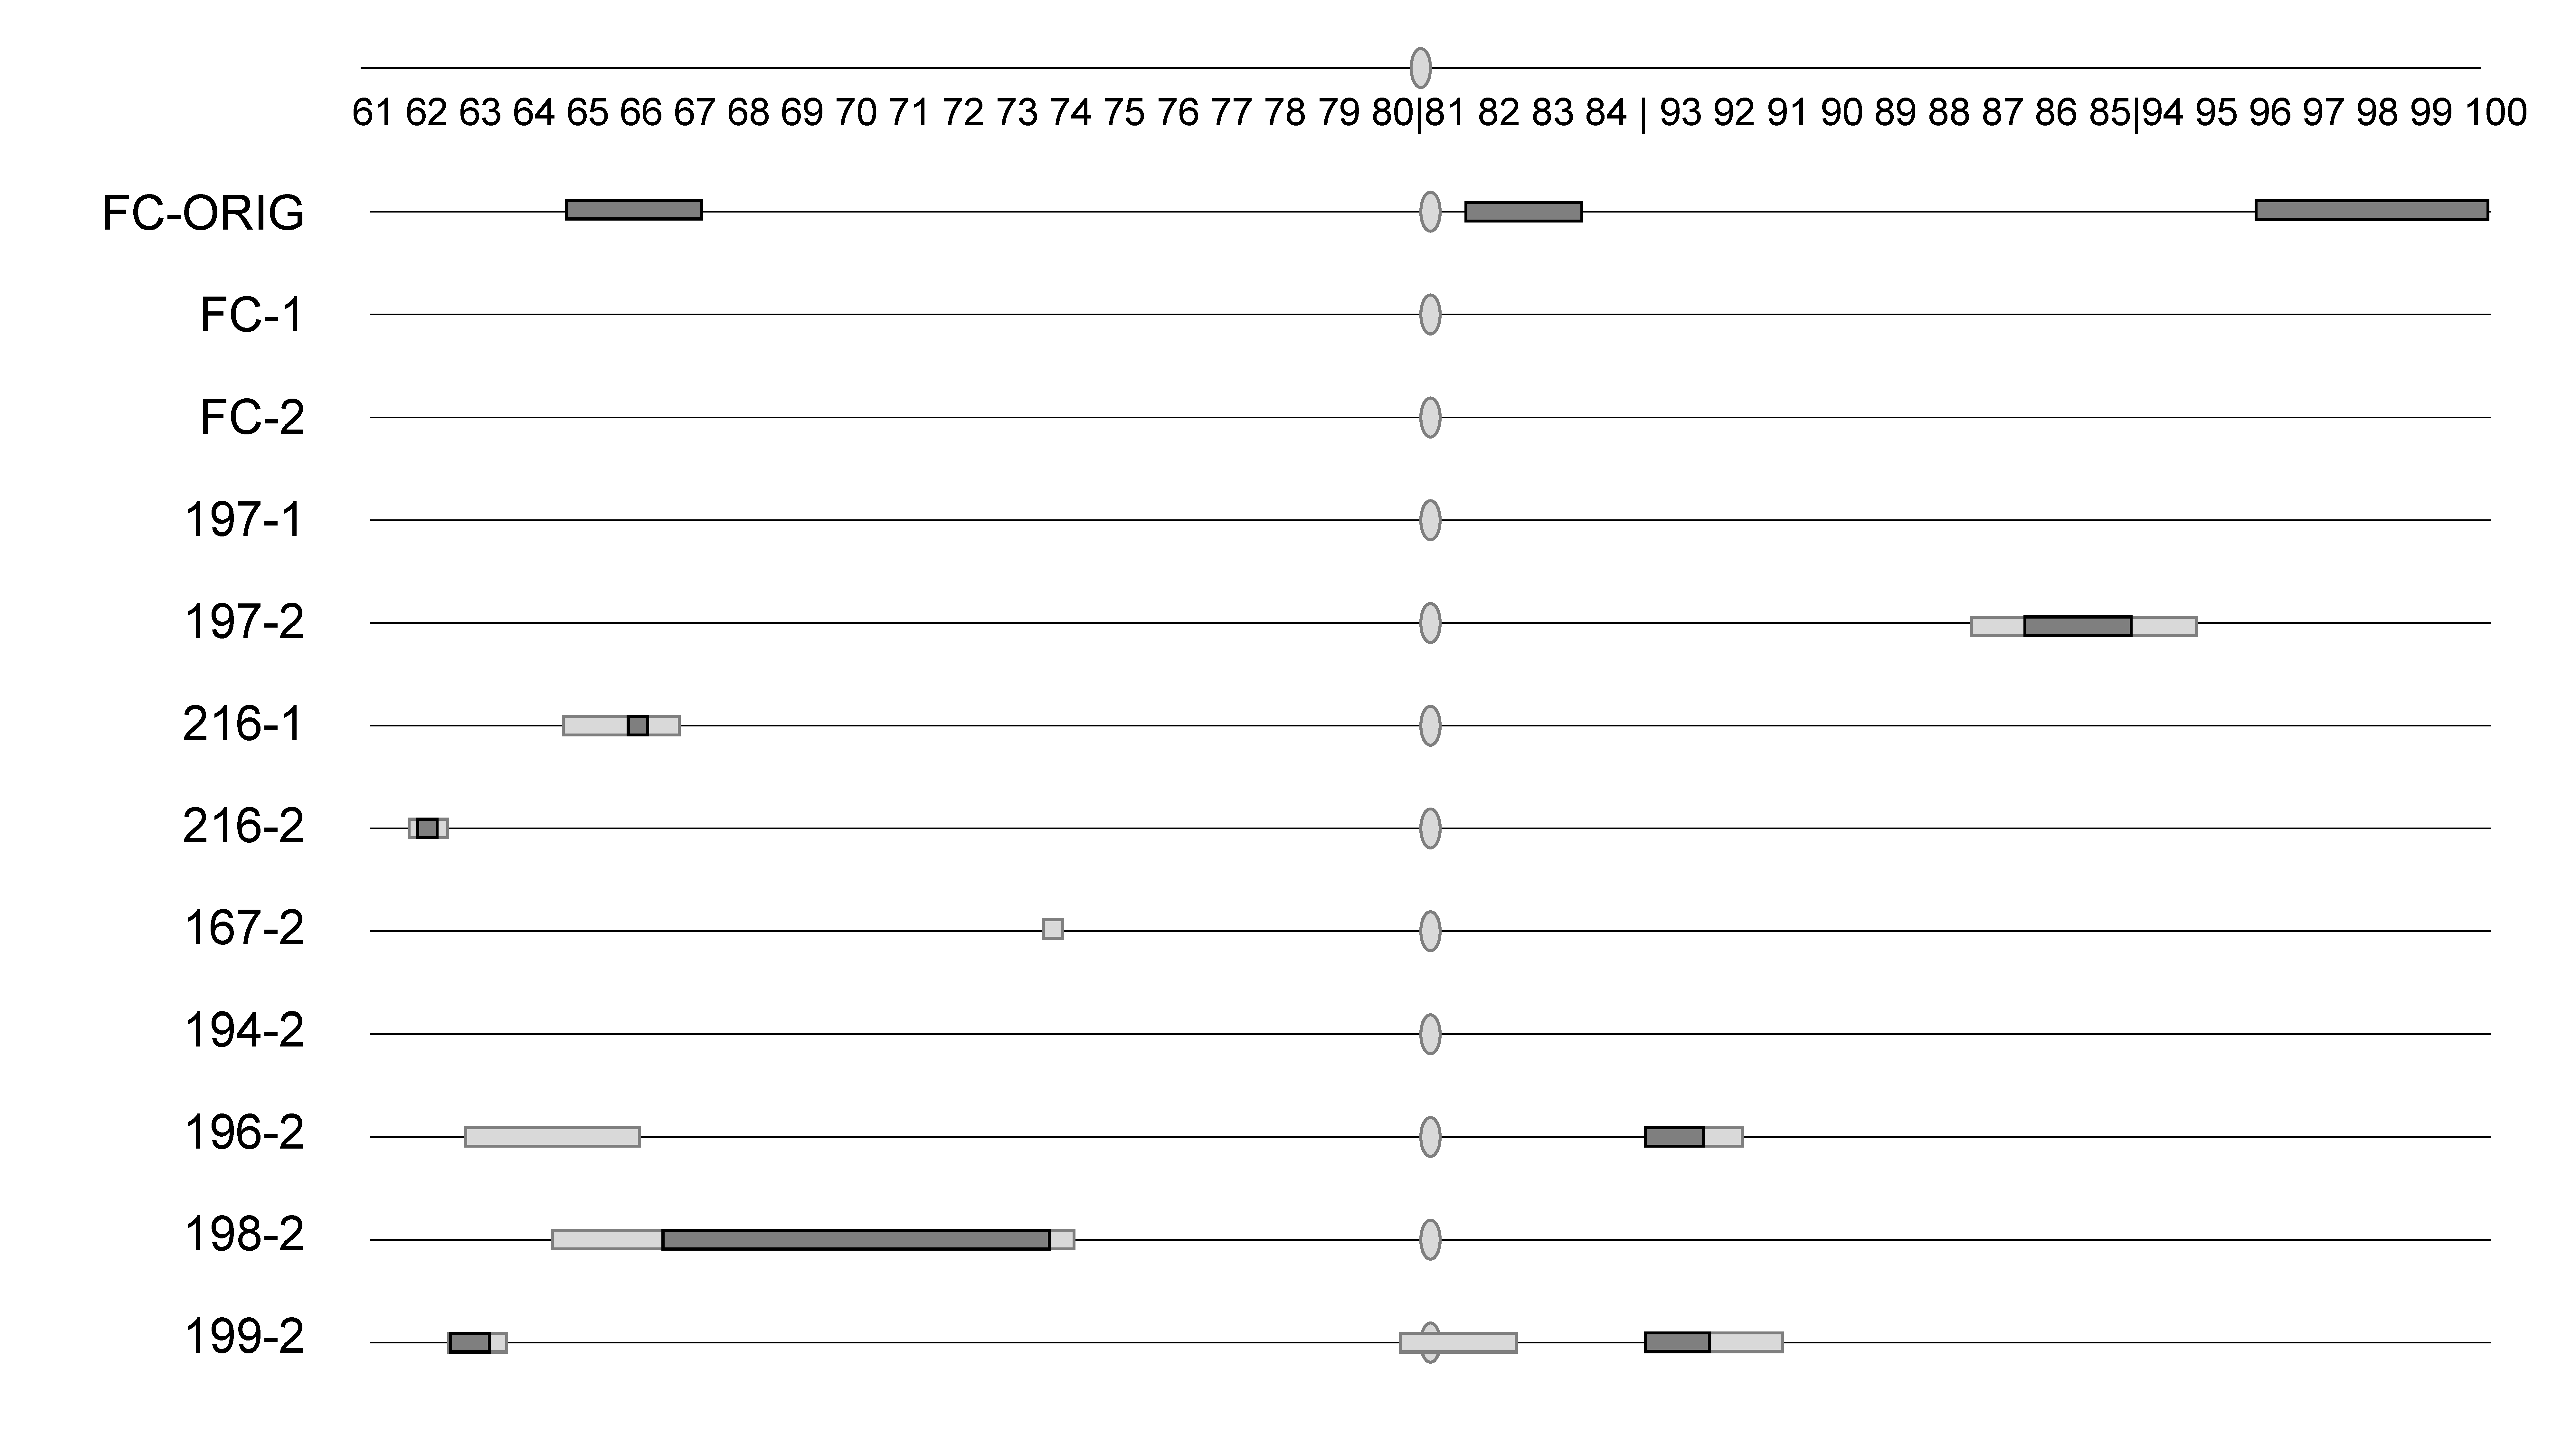
Copulation occurrence, which mapped strongly in the original study (BC
FC-ORIG;
Supplementary Table S4), was not significant for any regions when we retested backcross males made from the same line using either the same (round 1) or different (round 2) assay conditions (
Table 2;
Figure 1;
Supplementary Figures S1 and S2). The results were also significantly (
p < 0.0001 for all) different between BC
FC-ORIG and the first or second round of assays here of BC
FC for each of the three original QTL peaks when compared using a three-way contingency table (66C: G
2 = 51.2, G
2 = 35.1; 82C: G
2 = 86.5, G
2 = 104.5; 97B: G
2 = 58.4, G
2 = 49.3; first and second assays, respectively). While the other two strains that were tested under two conditions (BC
197 and BC
216) had significant regions for copulation occurrence, these regions varied by assay condition. When looking across all eight strains under the same assay condition (e.g., across condition #2), there was very little overlap, with no region shared among three or more strains (
Table 2;
Figure 1;
Supplementary Figure S2). Similar to the above comparison of one strain across the three assay conditions, here, we compared the QTL peaks across the eight strains used in round 2 assays. We chose the molecular marker closest to the significant peaks found in any strain for copulation occurrence (62B, 67E, 84E, 93E). As above, the results were significantly (
p < 0.0001 for all) different across the eight strains when compared using a three-way contingency table.
To test whether additional traits other than copulation success are consistent across strains, we also scored three strains (BC
197, BC
216, and BC
FC) for the additional mating behaviors of courtship latency, copulation latency, and copulation duration. Note that none of these behavioral traits mapped a significant region in the original assay of BC
FC-ORIG. Two lines (BC
FC and BC
216) also mapped loci for copulation latency but the regions did not overlap (
Table 3;
Supplementary Figure S1). Copulation duration mapped loci in all three of the populations tested here, with the significant regions overlapping. Two of the strains (BC
197 and BC
216) had significant regions on the third chromosome for courtship latency, which was not measured in the original study, and this region overlapped. Similarly to what was found in the original study [
31], none of the traits showed epistasis between QTL or between the QTL and nonsignificant regions for males from any of the lines.
4. Discussion
The division of populations into defined species is thought to occur when natural selection acts on variation in a trait affecting gene flow among these different populations. These incipient species then become reproductively isolated from one another and diverge into two distinct species. Mating behavior varies within
D. simulans when males are paired with conspecific females [
42]; therefore, we thought it likely that there would also be underlying genetic variation in the male mating behaviors that affect species isolation. By comparing the regions in
D. simulans males that
D. mauritiana females discriminate against in eight different lines of
D. simulans, we determined whether the underlying genetic basis of species isolation is consistent or varies across a species.
We predicted that there would be some genomic regions that were consistent across strains, due to common ancestry from the original speciation event. Likewise, we expected that variation in some loci would have arisen across strains due to variation that arose after the species expanded to a worldwide distribution. Since
D. mauritiana females strongly and consistently reject
D. simulans males [
25], we also predicted that these loci would be robust across subtly different environmental conditions. Lastly, we predicted that loci affecting behavioral isolation would be found in regions of low recombination, i.e., near the centromere and telomeres. Our predictions were not confirmed. Only one of the nine identified regions was at a centromere or telomere. We found that different strains tested across the same conditions had no consistent QTL among them and, indeed, had almost no overlap at all in genomic regions contributing to male interspecies copulation success. Likewise, we found that the same strains tested using slightly different conditions yielded different QTL for male interspecies copulation success. It is possible that the strength of effect of loci may vary across different populations and, therefore, that greater overlap would be found with larger sample sizes that could detect loci of smaller effect. If so, then the conclusion might not be that the loci differ among populations, but rather that their effect sizes differ among populations. This possibility requires further exploration. A second possibility is that the populations of
D. simulans originally had a shared genetic basis for male traits leading to behavioral isolation, but that loci were gained and lost over evolutionary time, leading to divergent bases today. Lastly, it is possible that different populations did not share male variants that affect behavioral isolation and, instead, independent variants arose over time that affect male traits in ways that contribute to behavioral isolation.
In contrast to copulation occurrence, there was consistency in the genetic basis of copulation duration across populations of
D. simulans. Pure-species
D. simulans and
D. mauritiana have notably different copulation duration (20–26 min vs. 11–17 min, respectively; [
43,
44,
45]). The shared genetic basis of this time difference across the three strains we tested indicates a potentially robust genetic basis of this difference. However, this conclusion has the caveat in that one of the same strains (
simFC) did not yield any QTL at all for this trait when it was assessed at an earlier time [
31]. It is possible that, although this strain had the same collection origin, its separate maintenance as a stock in different locations in the intervening years yielded enough genetic divergence to produce these varying genetic mapping results. Regardless of the cause, the major loci contributing to mating behavior traits, at least as produced via QTL mapping, do not appear to be robust to subtle changes in strains or assay conditions. This does not negate the usefulness of QTL studies for identifying candidate loci for traits of interest, but does demonstrate the importance of performing follow-up studies for fine mapping and confirming causal genes using the exact same strains and conditions as used in the original study. It also indicates that caution must be exercised in extrapolating results outside of the specific assay conditions and population studied.
These findings add to previous work (e.g., [
17,
18]) that demonstrate that loci for behavioral isolation between species may have a high amount of variation within species, where different loci are the primary contributors to behavioral isolation in different populations. Since female
D. mauritiana consistently display rejection toward all strains of
D. simulans that we tested, our genetic mapping results suggest that the male behavioral traits that isolate these closely related species may occur through different means. They may be caused by the same male traits being generated via different molecular pathways in the different strains or be caused by female discrimination against males using one or more combinations of different characteristics. Regardless of the cause, the presence of variation among strains for isolation between species means that loci that are identified for behavioral isolation using one strain may not contribute to isolation across the entire species.


