Article

Quantitative Phosphoproteomics of cipk3/9/23/26 Mutant and Wild Type in Arabidopsis thaliana

1
Key Laboratory of Forest Genetics and Biotechnology Ministry of Education, Nanjing Forestry University, Nanjing 210037, China
2
Co-Innovation Center for Sustainable Forestry in Southern China, Nanjing Forestry University, Nanjing 210037, China
*
Author to whom correspondence should be addressed.
Genes 2021, 12(11), 1759; https://doi.org/10.3390/genes12111759
Submission received: 11 October 2021 / Revised: 1 November 2021 / Accepted: 2 November 2021 / Published: 4 November 2021
(This article belongs to the Section Plant Genetics and Genomics)

Abstract

:
CBL-interacting protein kinases 3/9/23/26 (CIPK3/9/23/26) are central regulation components of magnesium ion homeostasis. CBL2/3 interacts with CIPK3/9/23/26, which phosphorylates their downstream targets, suggesting that protein phosphorylation is a key factor influencing the maintenance of cellular magnesium homeostasis in higher plants. The cipk3/9/23/26 quadruple mutant is very sensitive to high levels of magnesium. In this study, TMT quantitative phosphoproteomics were used to compare the global variations in phosphoproteins in wild type and cipk3/9/23/26 quadruple mutant seedlings of Arabidopsis thaliana, and 12,506 phosphorylation modification sites on 4537 proteins were identified, of which 773 phosphorylated proteins exhibited significant variations at the phosphorylation level under magnesium sensitivity. Subsequently, we used bioinformatics methods to systematically annotate and analyze the data. Certain transporters and signaling components that could be associated with magnesium sensitivity, such as ATP-binding cassette transporters and mitogen-activated protein kinases, were identified. The results of this study further our understanding of the molecular mechanisms of CIPK3/9/23/26 in mediating magnesium homeostasis.

1. Introduction

Plants require all kinds of mineral elements, which are absorbed from soil in the form of ions by the plant roots and transported to various plant tissues through a series of transportation vehicles, to maintain their growth and development [1]. Plants sometimes absorb more or less mineral nutrients from the soil due to the influence of external environmental factors, which forces plants to evolve mechanisms of ion homeostasis that can maintain the dynamic balance of each nutrient ion.
Calcineurin B-like protein (CBL) is an uncommon class of calcium ion (Ca2+) sensors in plants, which can physically and functionally interact with the CBL-interacting protein kinase (CIPK) family, and decode various dynamic Ca2+ signals and regulate relevant physiological processes by phosphorylating downstream target proteins [2]. Numerous CBL and CIPK family members constitute the CBL-CIPK signaling network, which can facilitate the regulation of ion homeostasis. Studies have revealed that the CBL-CIPK signaling network is a vital factor influencing various physiological activities and multiple signaling pathways in plants, such as salt stress responses, low potassium stress response, regulation of the abscisic acid (ABA) signal transduction, and regulation of plasma membrane H+-ATPase activity, among others. For instance, Pandey et al. [3] reported that the growth of the CIPK21 loss-of-function mutant, cipk21, exhibited hypersensitivity to high salinity and osmotic stress. The CBL2 and CBL3 Ca2+ sensors have been demonstrated to physically interact with CIPK21 and target the kinase to the vacuolar membrane. Studies have revealed that CIPK21 is involved in responses to high salinity in Arabidopsis thaliana by balancing ion and water homeostasis on the vacuolar membrane. Sanyal et al. [4] reported that CBL9 could be phosphorylated by CIPK3, and ABA repressor 1 (ABR1) was the downstream target of CIPK3. CIPK3 and ABR1 not only regulate the function of the ABA response during seed germination, but are also involved in ABA-dependent signaling in the adult plant development.
Among the essential nutrient ions, magnesium ion (Mg2+) is one of the most abundant metal ions in cells and is a key element necessary for plant growth and development [5]. However, the presence of excess Mg2+ in the environment can influence the normal growth and development of plants, causing plants to exhibit severe growth retardation. cipk3/9/23/26 is a quadruple mutant produced through the hybridization of two double mutants, cipk9/23 and cipk3/26, which is sensitive to Mg under moderate or high external Mg2+ levels. Arabidopsis is defective in the four tonoplast-localized cipk3/9/23/26 proteins intolerant to medium and high concentrations of Mg2+, which exhibits similar severe growth retardation to that of cbl2 cbl3. Tang et al. [6] revealed a regulatory mechanism, which demonstrated that CBL2/3 and CIPK3/9/23/26 constituted a network of multivalent interactions that enabled plant cells to sequester excess Mg2+ into vacuoles, consequently shielding plant cells from high Mg2+ toxicity. Mogami et al. [7] revealed that ABA-activated SRK2D/E/I and CIPK26/3/9/23 were essential in Arabidopsis for plant growth at high external Mg2+ concentrations, and that they mediated phosphorylation signaling pathways that maintained cellular Mg2+ homeostasis.
In this study, TMT label-based quantitative phosphoproteomics were used to analyze phosphorylated proteins, with the aim of qualitatively and quantitatively analyzing the variations in phosphoproteomics of wild type (WT) and cipk3/9/23/26 quadruple mutant seedlings of Arabidopsis. The results of the present study provide comprehensive insights into how CIPK3/9/23/26 mediates Mg2+ homeostasis and adapts to variations in cellular physiology and biochemical processes.

2. Materials and Methods

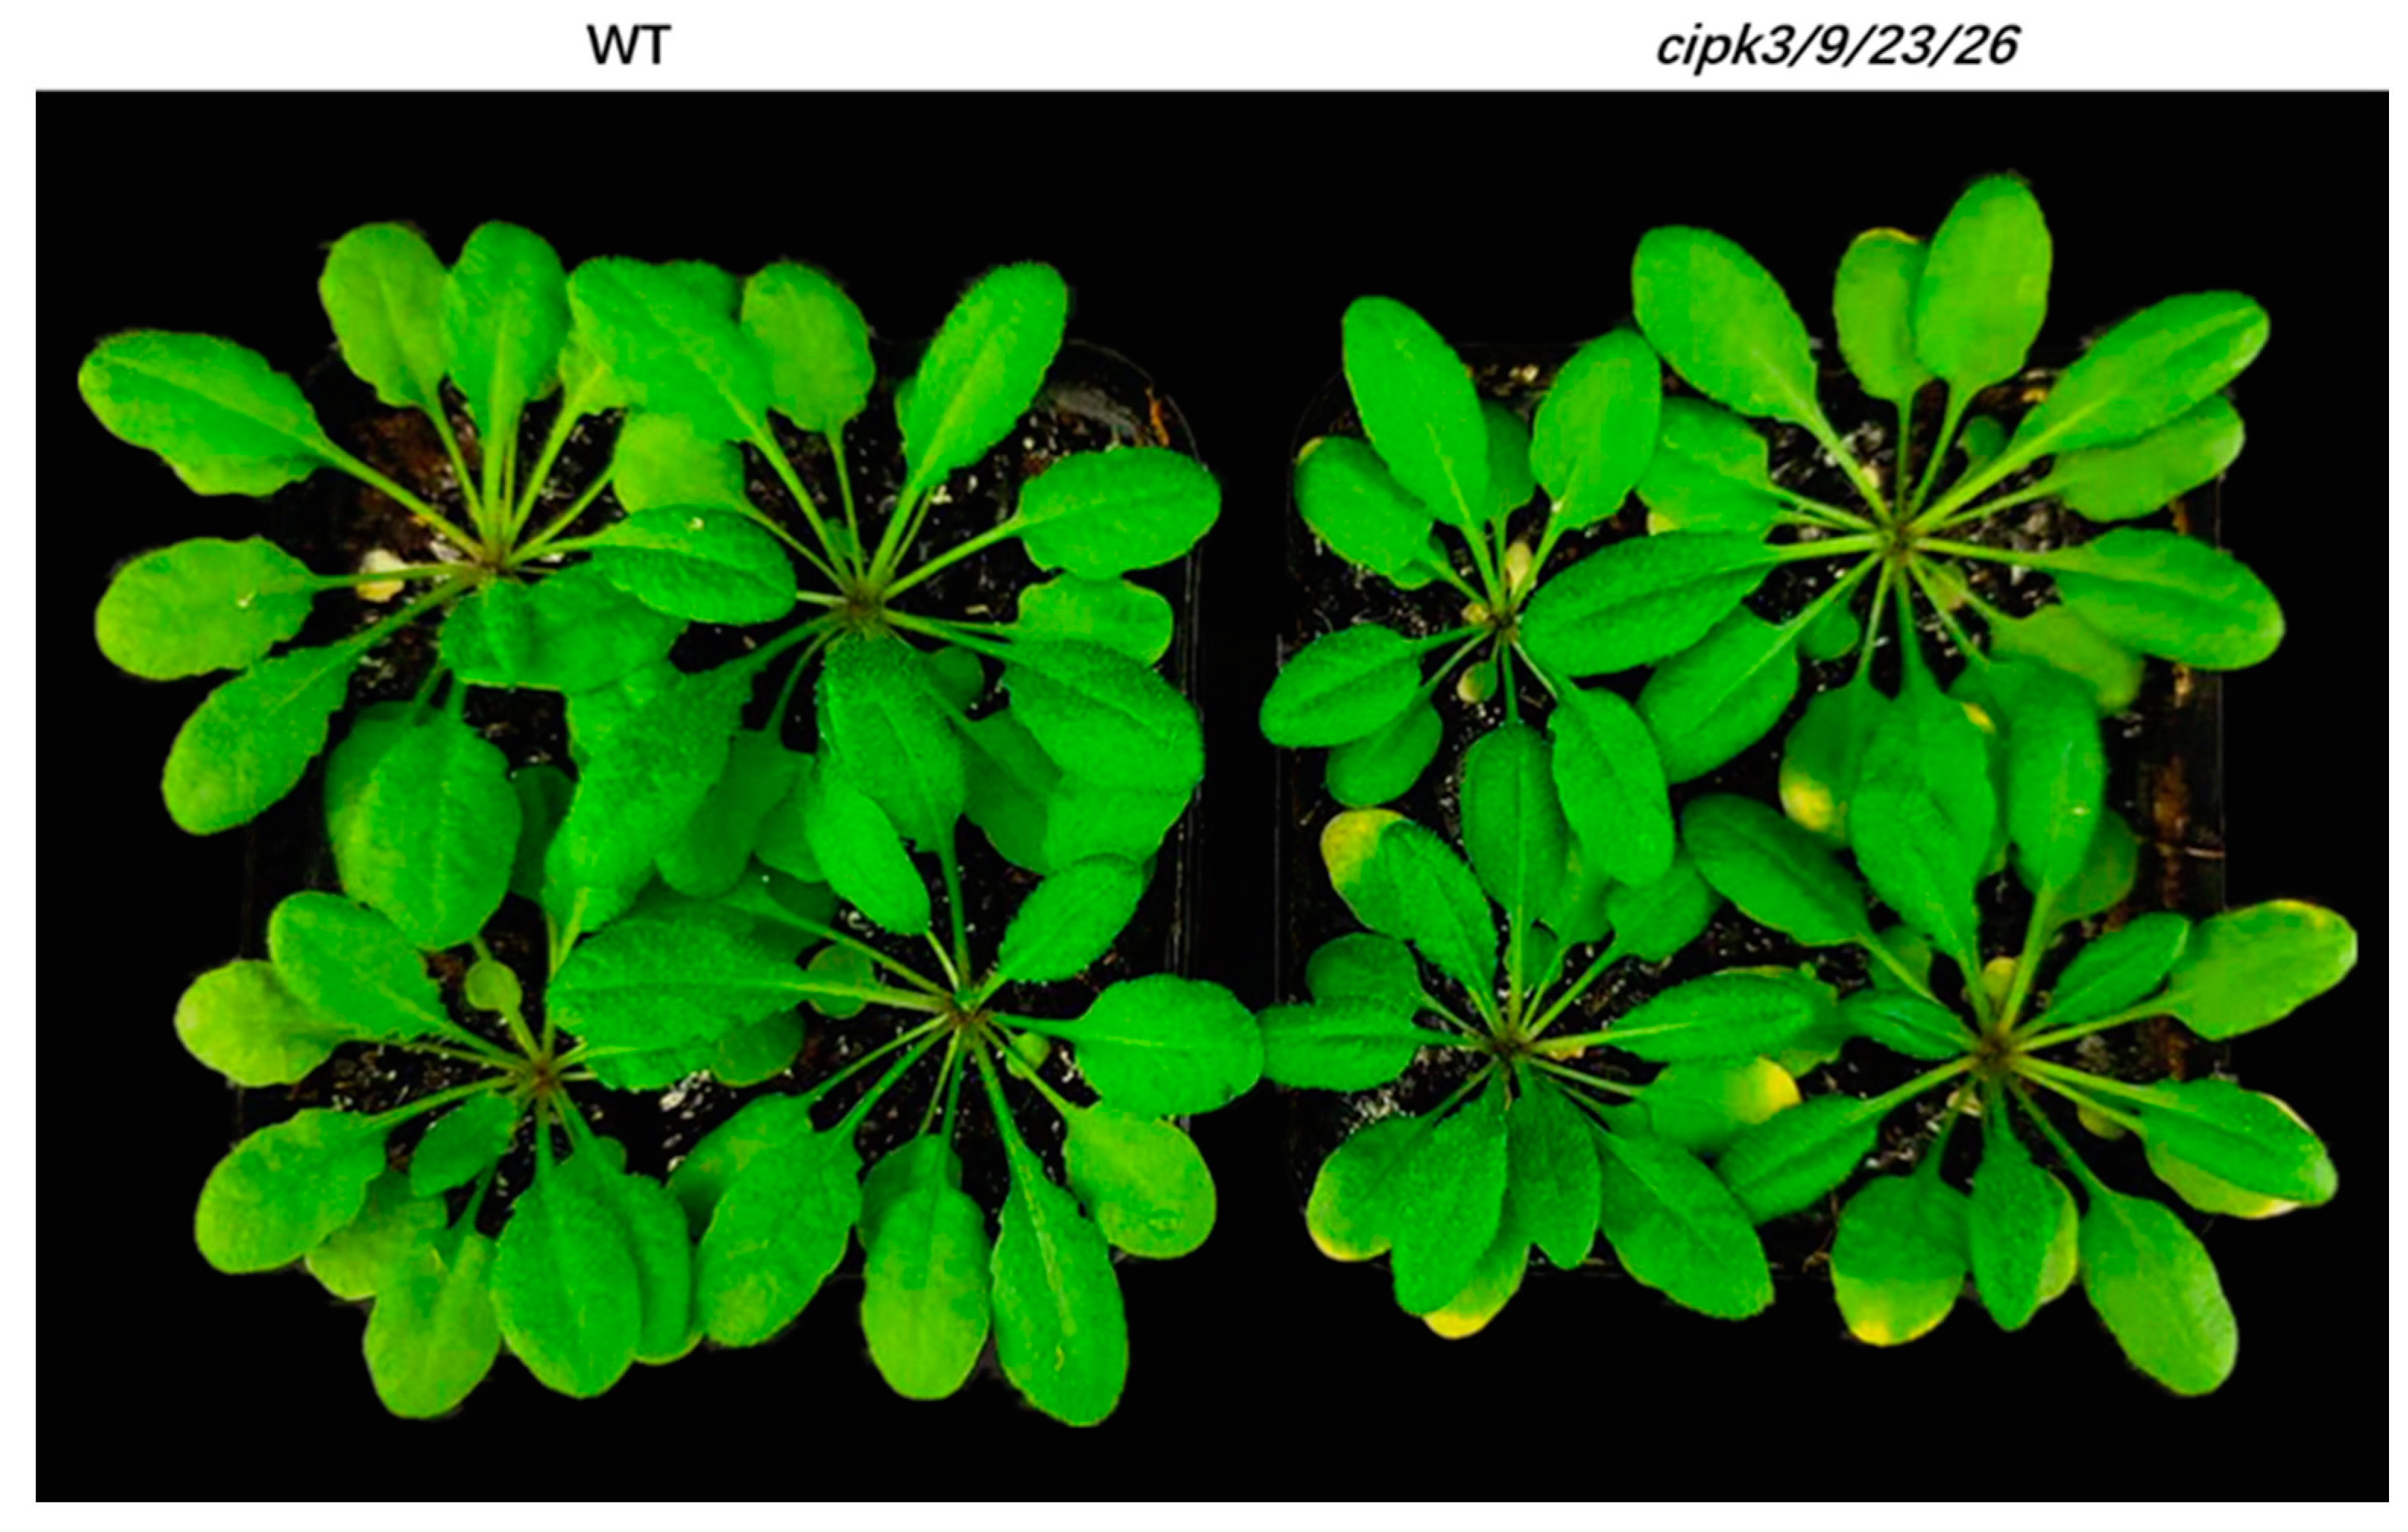
2.1. Plant Material and Growth Conditions

A. thaliana (Colombia) seeds and its cipk3/9/23/26 quadruple mutant, which is very sensitive to moderate and high levels of external Mg2+ [6], were used in the present study. The seeds were sterilized with 10% (v/v) sodium hypochlorite for 14 min, and then washed three to four times with distilled water. Seeds were sown in Murashige and Skoog medium (pH 5.8). One week after germination, the seedlings were transferred to plastic trays with nutrient soil, which was a mixture of 70% turf, 20% perlite, and 10% vermiculite. WT and mutant seedlings were grown in an artificial illumination incubator with approximately 70% relative humidity, 200 μmol·m−2·s−1 photon flux density, and an 8 h light (21 °C): 16 h dark (19 °C) photoperiod. The seedlings were watered every three days. Four weeks after growth, the rosette leaves of two A. thaliana samples were collected and immediately preserved at −80 °C until analysis. Three biologically independent replicates of control and treatment samples were analyzed in the experiment.

2.2. Protein Extraction and Trypsin Digestion

One gram of each sample was placed in a pre-cooled mortar, and thoroughly ground into fine powder with liquid nitrogen. Four volumes of phenol extraction buffer (including 1% TritonX-100, 10 mM of dithiothreitol, 1% Protease Inhibitor Cocktail (Thermo Scientific™, Waltham, MA, USA), 50 μM PR-619, 3 μM TSA, 50 mM NAM, and 2 mM EDTA) were added to each group of leaf samples, followed by three ultrasonic treatments on ice using a high-intensity ultrasound processor (Scientz Biotechnology Co., Ningbo, China). A similar volume of tris-saturated phenol (pH 8.0) was added and centrifuged at 4 °C, 5000× g, for 10 min. The upper phenol phase was collected and five volumes of 0.1 M ammonium acetate in methanol were added, followed by incubation overnight. After centrifugation at 4 °C for 10 min, the protein precipitates were collected and washed once with ice-cold methanol, then three times with ice-cold acetone. The precipitates were subsequently redissolved in 8 M urea, and protein concentrations were determined using a BCA protein assay kit (Sigma-Aldrich, St. Louis, MO, USA).
For digestion, the protein solution was reduced with 5 mM of dithiothreitol for 30 min at 56 °C and alkylated with 11 mM of iodoacetamide for 15 min at room temperature in darkness. The protein sample was then diluted by adding 100 mM of TEAB to a urea concentration of less than 2 M. Finally, trypsin (Promega, Madison, WI, USA) was added at a 1:50 trypsin-to-protein mass ratio for the first digestion overnight and a 1:100 trypsin-to-protein mass ratio for a second 4 h digestion.

2.3. TMT Labeling and Reversed-Phase High-Performance Liquid Chromatography Fractionation

The peptides were desalted using the Strata X C18 solid-phase extraction column (Phenomenex, Torrance, CA, USA) after digestion with trypsin, then redissolved in 0.5 M triethylammonium bicarbonate. TMT labeling was performed using TMT mass tagging kits (ThermoFisher Scientific, Waltham, MA, USA) according to the manufacturer’s instructions: the thawed labeling reagents were dissolved in acetonitrile, and incubated for 2 h at 25 °C after mixing with the peptides. Finally, the peptide segment mixture was desalted and freeze-dried using vacuum centrifugation.
Subsequently, the peptide segment mixture obtained after enzymatic hydrolysis and desalination was separated using high-pH reversed-phase high-performance liquid chromatography on the Strata X C18 SPE column (Phenomenex, Torrance, CA, USA). The gradient was comprised of an increase from 6% to 23% of solvent B (0.1% formic acid in 98% acetonitrile) over 26 min, 23% to 35% in 8 min, and climbing to 80% in 3 min then holding at 80% for the last 3 min, all at a constant flow rate of 400 nL/min on an EASY-nLC 1000 UPLC system.

2.4. Modified Enrichment and LC-MS/MS Analyses

Phosphorylated peptide components were enriched using solid-phase metal ion affinity chromatography (IMAC). Briefly, peptides were dissolved in enrichment buffer (50% acetonitrile and 6% trifluoroacetic acid). The supernatant was aspirated into the IMAC material and incubated on a shaker. Subsequently, the peptide resin was washed three times with 50% acetonitrile (Pierce™, Waltham, MA, USA) in 6% trifluoroacetic acid and 30% acetonitrile in 0.1% trifluoroacetic acid to remove non-specifically adsorbed peptides, and 10% ammonia was added to elute the enriched phosphopeptides. Eluates containing phosphopeptides were collected, lyophilized, and desalted for LC-MS/MS analysis.
The enriched phosphopeptide components were analyzed using the EASY-nLC 1200 ultra-high-performance liquid chromatography system (Thermo Fisher Scientific, Waltham, MA, USA). Mobile phase A consisted of 0.1% (v/v) formic acid and 2% (v/v) acetonitrile, and mobile phase B consisted of 0.1% formic acid (PierceTM, Waltham, MA, USA) and 90% acetonitrile. The liquid phase linear gradient was set as follows: 4–22% B for 38 min, 22–32% B for 14 min, 32–80% B for 4 min, and 80% B for 4 min. The flow rate was maintained at 450 nL/min.
The peptides were subjected to a NSI source followed by tandem mass spectrometry (MS/MS) in Q Exactive Plus (Thermo ScientificTM, Waltham, MA, USA) coupled online to the UPLC. The electrospray voltage applied was 2.0 kV. The m/z scan range was 350 to 1800 for a full scan, and intact peptides were detected in the Orbitrap at a resolution of 70,000. Peptides were then selected for MS/MS using the NCE setting as 28, and the fragments were detected in the Orbitrap at a resolution of 17,500. A data-dependent procedure alternated between one MS scan followed by 20 MS/MS scans with 15.0 s dynamic exclusion. Automatic gain control (AGC) was set at 5E4. The fixed first mass was set as 100 m/z.

2.5. Database Search and LC-MS/MS Data Analyses

The MS/MS spectra data were searched against the A. thaliana 3702 reference database (39,363 sequences) using Maxquant (v.1.5.2.8) with the following parameters: peptide tolerance of first search and main search were set to 20 and 10 ppm respectively, fragment ion mass tolerance was 0.02 Da, alkylation at cysteine was set as a fixed modification, oxidation at methionine, acetylation and deamidation at the N-terminal of protein, and phosphorylation at tyrosine, threonine, and serine were set as variable modifications. The enzymatic digestion model was trypsin/P, and two missing cleavages were allowed on trypsin. Using TMT 6-plex as the quantitative method, the false discovery rates of peptide-spectrum match identification and protein identification were set to 1%. To ensure high credibility of the results, the identified datasets were filtered based on a criterion of localization probability >0.75.
MoMo (http://meme-suite.org/tools/momo, accessed on 11 November 2019) was used to analyze motif characteristics of various phosphorylation modification sites. GO analyses were performed using the UniProt-GOA database (http://www.ebi.ac.uk/GOA/, accessed on 11 November 2019). If the UniProt-GOA database was not annotated, the GO function of the proteins was annotated using the InterPro domain database (http://www.ebi.ac.uk/interpro/, accessed on 11 November 2019) based on the protein sequence alignment method. The InterPro domain database was also used to analyze and identify functional descriptions of protein domains. Annotation analyses of protein pathways were conducted using the KEGG pathway database (http://www.genome.jp/kaas-bin/kaas_main; http://www.kegg.jp/kegg/mapper.html, accessed on 11 November 2019). The submitted proteins were annotated for subcellular localization using WoLF PSORT (http://www.genscript.com/psort/wolf_psort.html, accessed on 11 November 2019). In addition, the database numbers or protein sequences of the differentially modified proteins screened from various comparison groups were compared using the STRING 10.5 PPI network database (http://string-db.org/cgi/input.pl, accessed on 11 November 2019), and differential protein interaction relationships were extracted based on a confidence score of ≥0.7 (high confidence). Afterward, the “networkD3” package in R (https://cran.r-project.org/web/packages/networkD3/, accessed on 11 November 2019) was used to visualize protein interactions.

3. Results

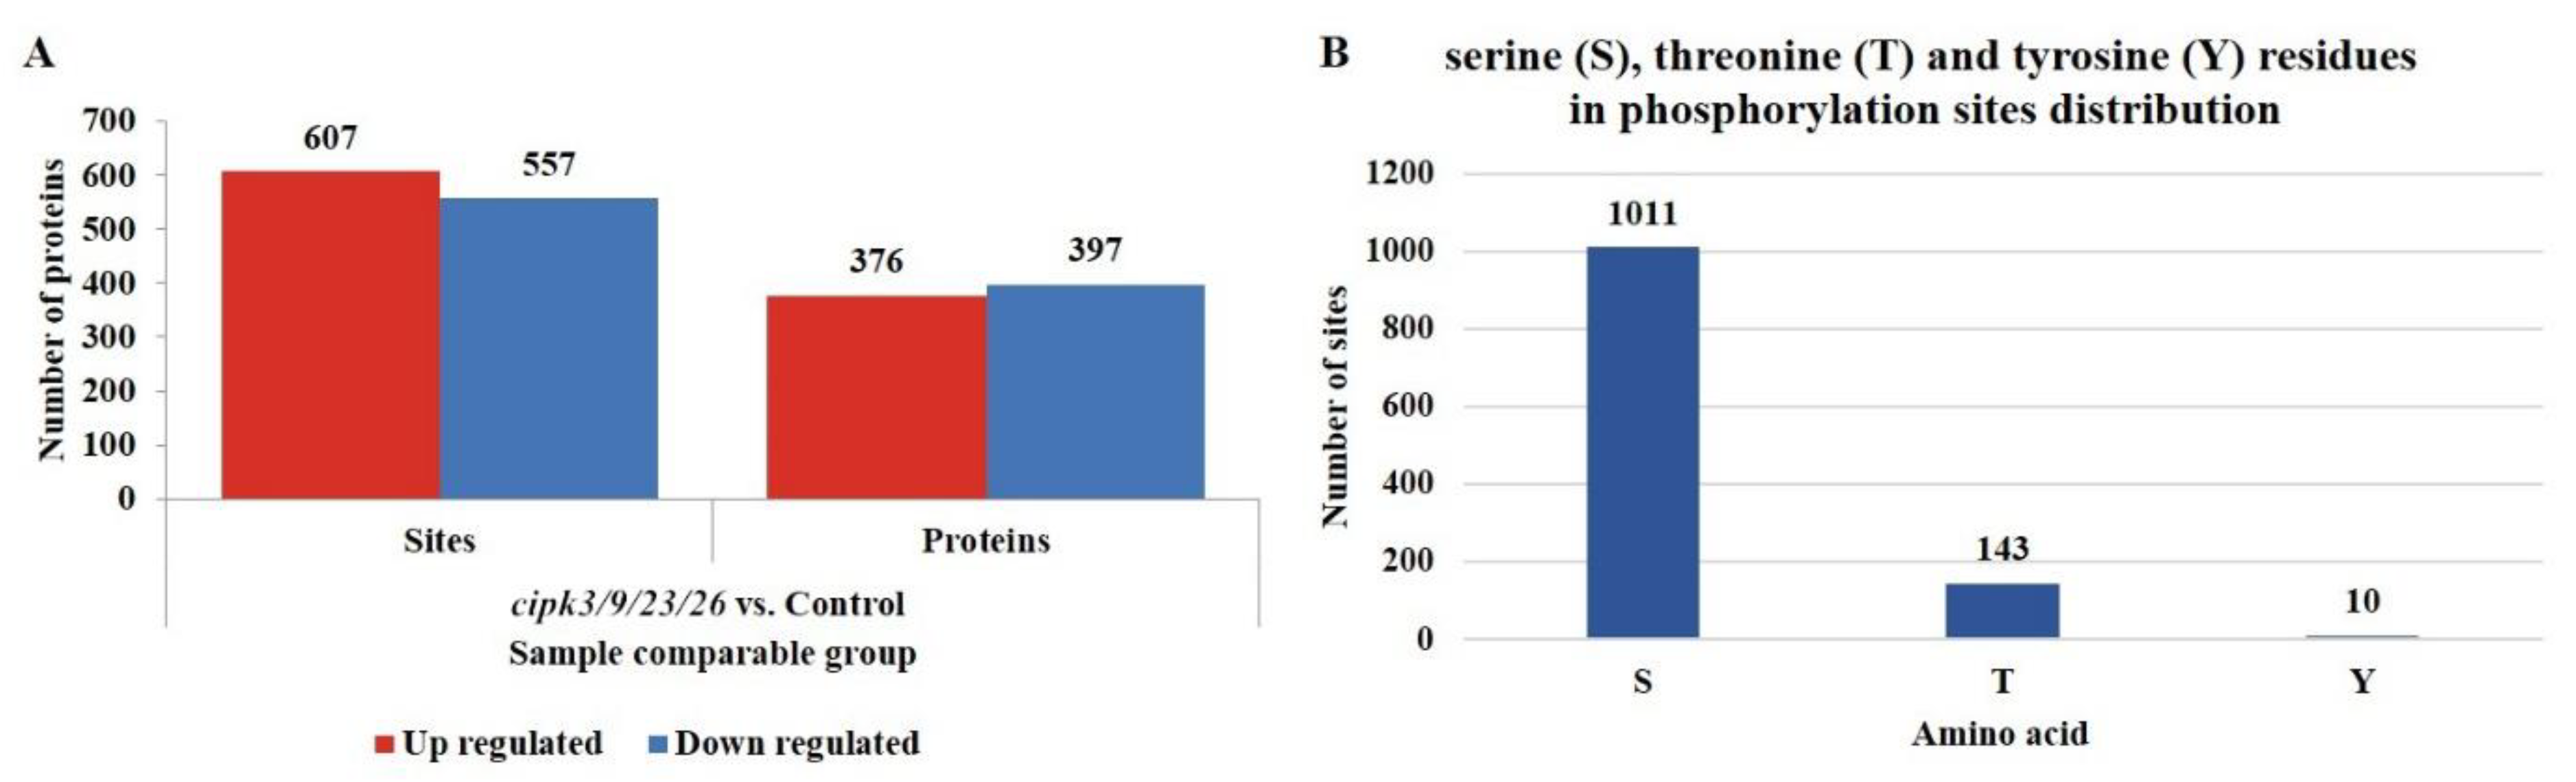
3.1. Quantitative Phosphoproteomic Data Analysis

We applied IMAC enrichment and TMT labeling, coupled with liquid chromatography-tandem mass spectrometry (LC-MS/MS) approaches to identify cipk3/9/23/26-regulated phosphoproteomes in WT and cipk3/9/23/26 quadruple mutant seedlings (Figure 1). Quality control evaluations of mass spectrometry data are illustrated in Figure 2. All points in the figure that represent peptides had mass errors within 10 ppm, which indicates that the data satisfied the requirements of high-precision characteristics of mass spectrometry (Figure 2A). Most of the peptides were distributed between seven and 20 amino acids, which was consistent with the general guidelines based on trypsin-induced enzymatic hydrolysis and higher energy collisional dissociation fragmentation (Figure 2B). Three statistical analysis methods, including principal component analysis, relative standard deviation, and Pearson’s correlation coefficient, were used to analyze the quantitative results of biological replicates. The analyses revealed that quantitative repeatability was high. Correlation between samples was satisfactory, and satisfied the expectation of the experimental design (Figure 2C).

3.2. Identification of Differential Phosphorylation Modification Sites and Proteins in the cipk3/9/23/26 Mutant and WT

In the present study, 12,506 phosphorylation sites were identified on 4537 proteins, of which 10,565 phosphorylation sites on 4258 proteins presented quantitative information (Table S1). To ensure high credibility of the results, multiple comparisons were used to normalize the data. A difference in the degree of modification greater than 1.2 when the p-value was <0.05 was considered a significant upregulation, whereas a difference less than 1/1.2 was considered a significant downregulation. Finally, 1164 differential phosphorylation sites were identified among the 773 phosphoproteins, of which 607 sites on 376 phosphoproteins were upregulated and 557 sites on 397 phosphoproteins were downregulated (Figure 3A). Among the 1164 differential phosphorylation sites, 1011 sites were involved in the phosphorylation of serine (S) residues, 143 sites were involved in the phosphorylation of threonine (T) residues, and 10 sites were involved in the phosphorylation of tyrosine (Y) residues, accounting for 86.86%, 12.28%, and 0.86% of the total differential phosphorylation sites, respectively (Figure 3B, Table S2). Notably, a comparison of the phosphorylation ratios of the three residue types in different plants and tissues revealed that the ratios calculated in the present study were very close to those reported previously [8,9,10], which suggests that the distribution of phosphorus among plant tissues was relatively conservative.

3.3. Motif Analysis of cipk3/9/23/26 Mutant Phosphoprotein Modification

Post-translational modification of proteins generally requires upstream kinases to recognize substrate-specific conserved amino acid motifs. Therefore, identifying and studying conserved motifs around phosphorylation sites is of great significance in the prediction of protein phosphorylation modifications and modification sites, as well as in the identification of cell signaling pathways. In the present study, the identified peptide sequences, which consisted of phosphorylation modification sites and their six upstream and downstream amino acids, were analyzed. A total of 8470 sequences were obtained, including 7688 (90.77%) phosphoserine-centered and 782 (9.23%) phosphothreonine-centered sequences (Table S3). The Motif-X algorithm detected 59 over-represented motifs for phosphoserine and nine over-represented motifs for phosphothreonine (Table 1). The most prevalent motif for phosphoserine was [sP], which appeared 930 times and accounted for 12.17% of the identified motifs, followed by [Gs], [Rxxs], [sxE], and [sPR] motifs, which appeared 338, 314, 303, and 300 times, respectively. The two predominant motifs in phosphothreonine were [tP] and [PxtP]. Notably, no phosphotyrosine-centered sequences were obtained in the present study, which could be due to the low phosphotyrosine content that was not enriched in plant tissues.

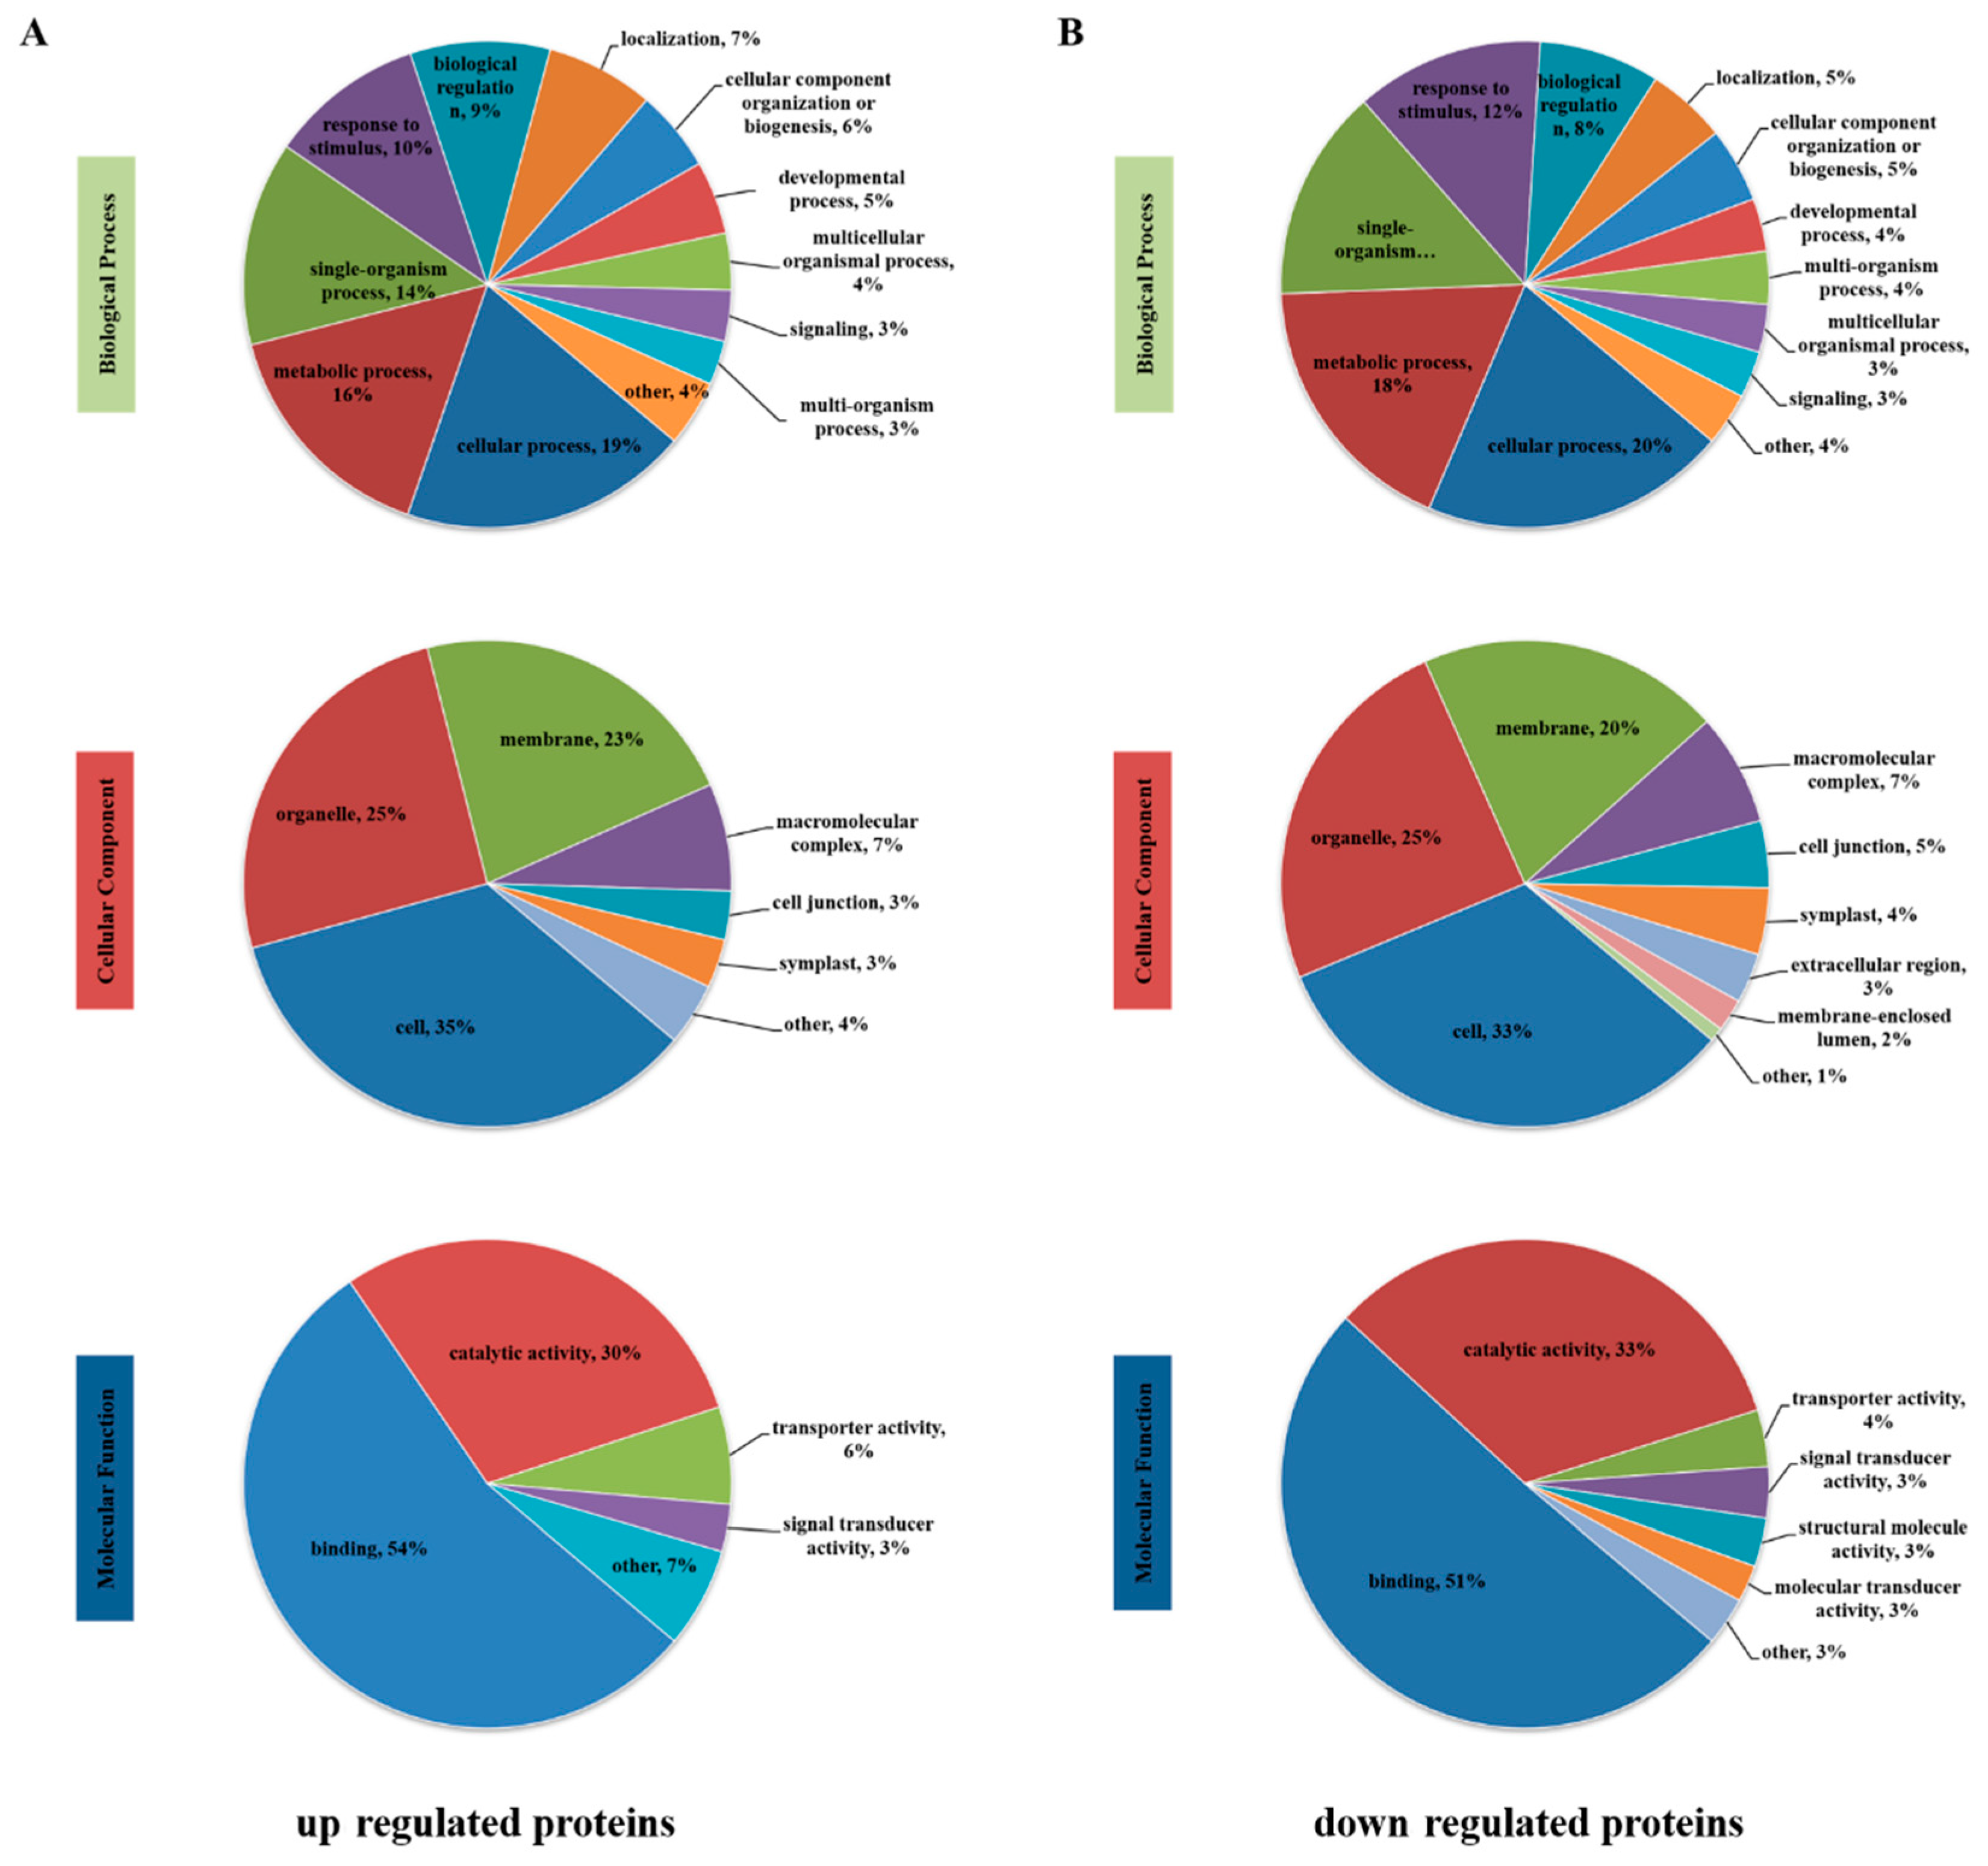
3.4. Functional Classification of Differentially Phosphorylated Proteins

The identified differentially phosphorylated proteins (DPPs) were annotated and classified using the Gene Ontology (GO) approach based on three aspects: biological process, cellular component, and molecular function (Figure 4A). The principal classifications were based on ‘biological process’, ‘cellular process’, ‘metabolic process’, and ‘single-organism process’, while ‘behavior’, ‘biological adhesion’, and ‘locomotion’ were under-represented. In the category of ‘cellular component’, most of the differential phosphoproteins were associated with cells, organelles, and membranes, and only a few differential phosphoproteins occurred in the nucleoid. With regard to the ‘molecular function’ classification, differential phosphoproteins associated with catalytic activity and binding accounted for more than 80% of all identified phosphoproteins, and differential phosphoproteins associated with protein tagging and metallochaperone activity were not annotated.
Various organelles in plant tissues are often exposed to varying physical and chemical environments. Proteins can be specifically localized to various organelles based on their structural characteristics and functions. In the present study, WoLF PSORT was used to predict the subcellular structure and classify differentially phosphorylated proteins. The results revealed that differentially phosphorylated proteins were divided into 15 subcellular components, of which the nucleus (1740 proteins), chloroplast (1019 proteins), and cytoplasm (736 proteins) were the primary subcellular components (Figure 4B). Similarly, we used the UniProt-GOA database to perform a functional classification of differentially phosphorylated proteins, which was divided into 4 categories and 25 sub-categories: information storage and processing, cellular processes and signaling, metabolism, and poorly characterized. Detailed classification information is presented in Figure S1.

3.5. Differential Expression of Related Phosphoproteins between the cipk3/9/23/26 Mutant and WT

All the identified DPPs were analyzed statistically based on the distribution of GO terms to compare the differential expression of phosphoproteins and predict their biological functions. Among the upregulated proteins selected based on the GO terms, ‘cellular process’ (209 proteins) had the highest number of DPPs in ‘biological process’. The most dominant cellular component was ‘cell’ (267 proteins), while ‘binding’ (262 proteins) constituted the highest proportion in ‘molecular function’ (Figure 5A). Among the downregulated proteins, ‘cellular process’ (249 proteins), ‘cell’ (316 proteins), and ‘binding’ (270 proteins) were ranked among the top three major categories (Figure 5B). The classification results of GO enrichment revealed that ‘chloroplast relocation’, ‘establishment of plastid localization’, and ‘chloroplast localization’ were the most enriched GO terms in the biological process category of upregulated DPPs. Auxin efflux transmembrane transporter activity and Ca2+ binding were the primary molecular functions. ‘Cytoskeletal part’ was the most significantly enriched GO term in the cellular component category. Downregulated DPPs were mainly enriched in response to cytokinin, mRNA binding, chloroplast stroma, plastid stroma, and chloroplast.

3.6. Enrichment Analyses of DPPs

The Kyoto Encyclopedia of Genes and Genomes (KEGG) enrichment analyses revealed that the upregulated DPPs were closely associated with plant-pathogen interactions, ABC transporters, and carotenoid biosynthesis pathways. Downregulated DPPs were primarily closely associated with carbon fixation in photosynthetic organisms, glyoxylate and dicarboxylate metabolism, one-carbon pool by folate and glycine, and serine and threonine metabolism pathways (Figure 6A). The protein domain enrichment analyses revealed that the EF-hand domain, ABC transporter type 1, transmembrane domain, and ABC transporter-like proteins were significantly enriched in upregulated DPPs, while downregulated DPPs were closely associated with pyruvate phosphate dikinase, phosphoenolpyruvate/pyruvate-binding, glyceraldehyde 3-phosphate dehydrogenase, NAD(P)-binding domain, catalytic domains, and other aspects (Figure 6B).

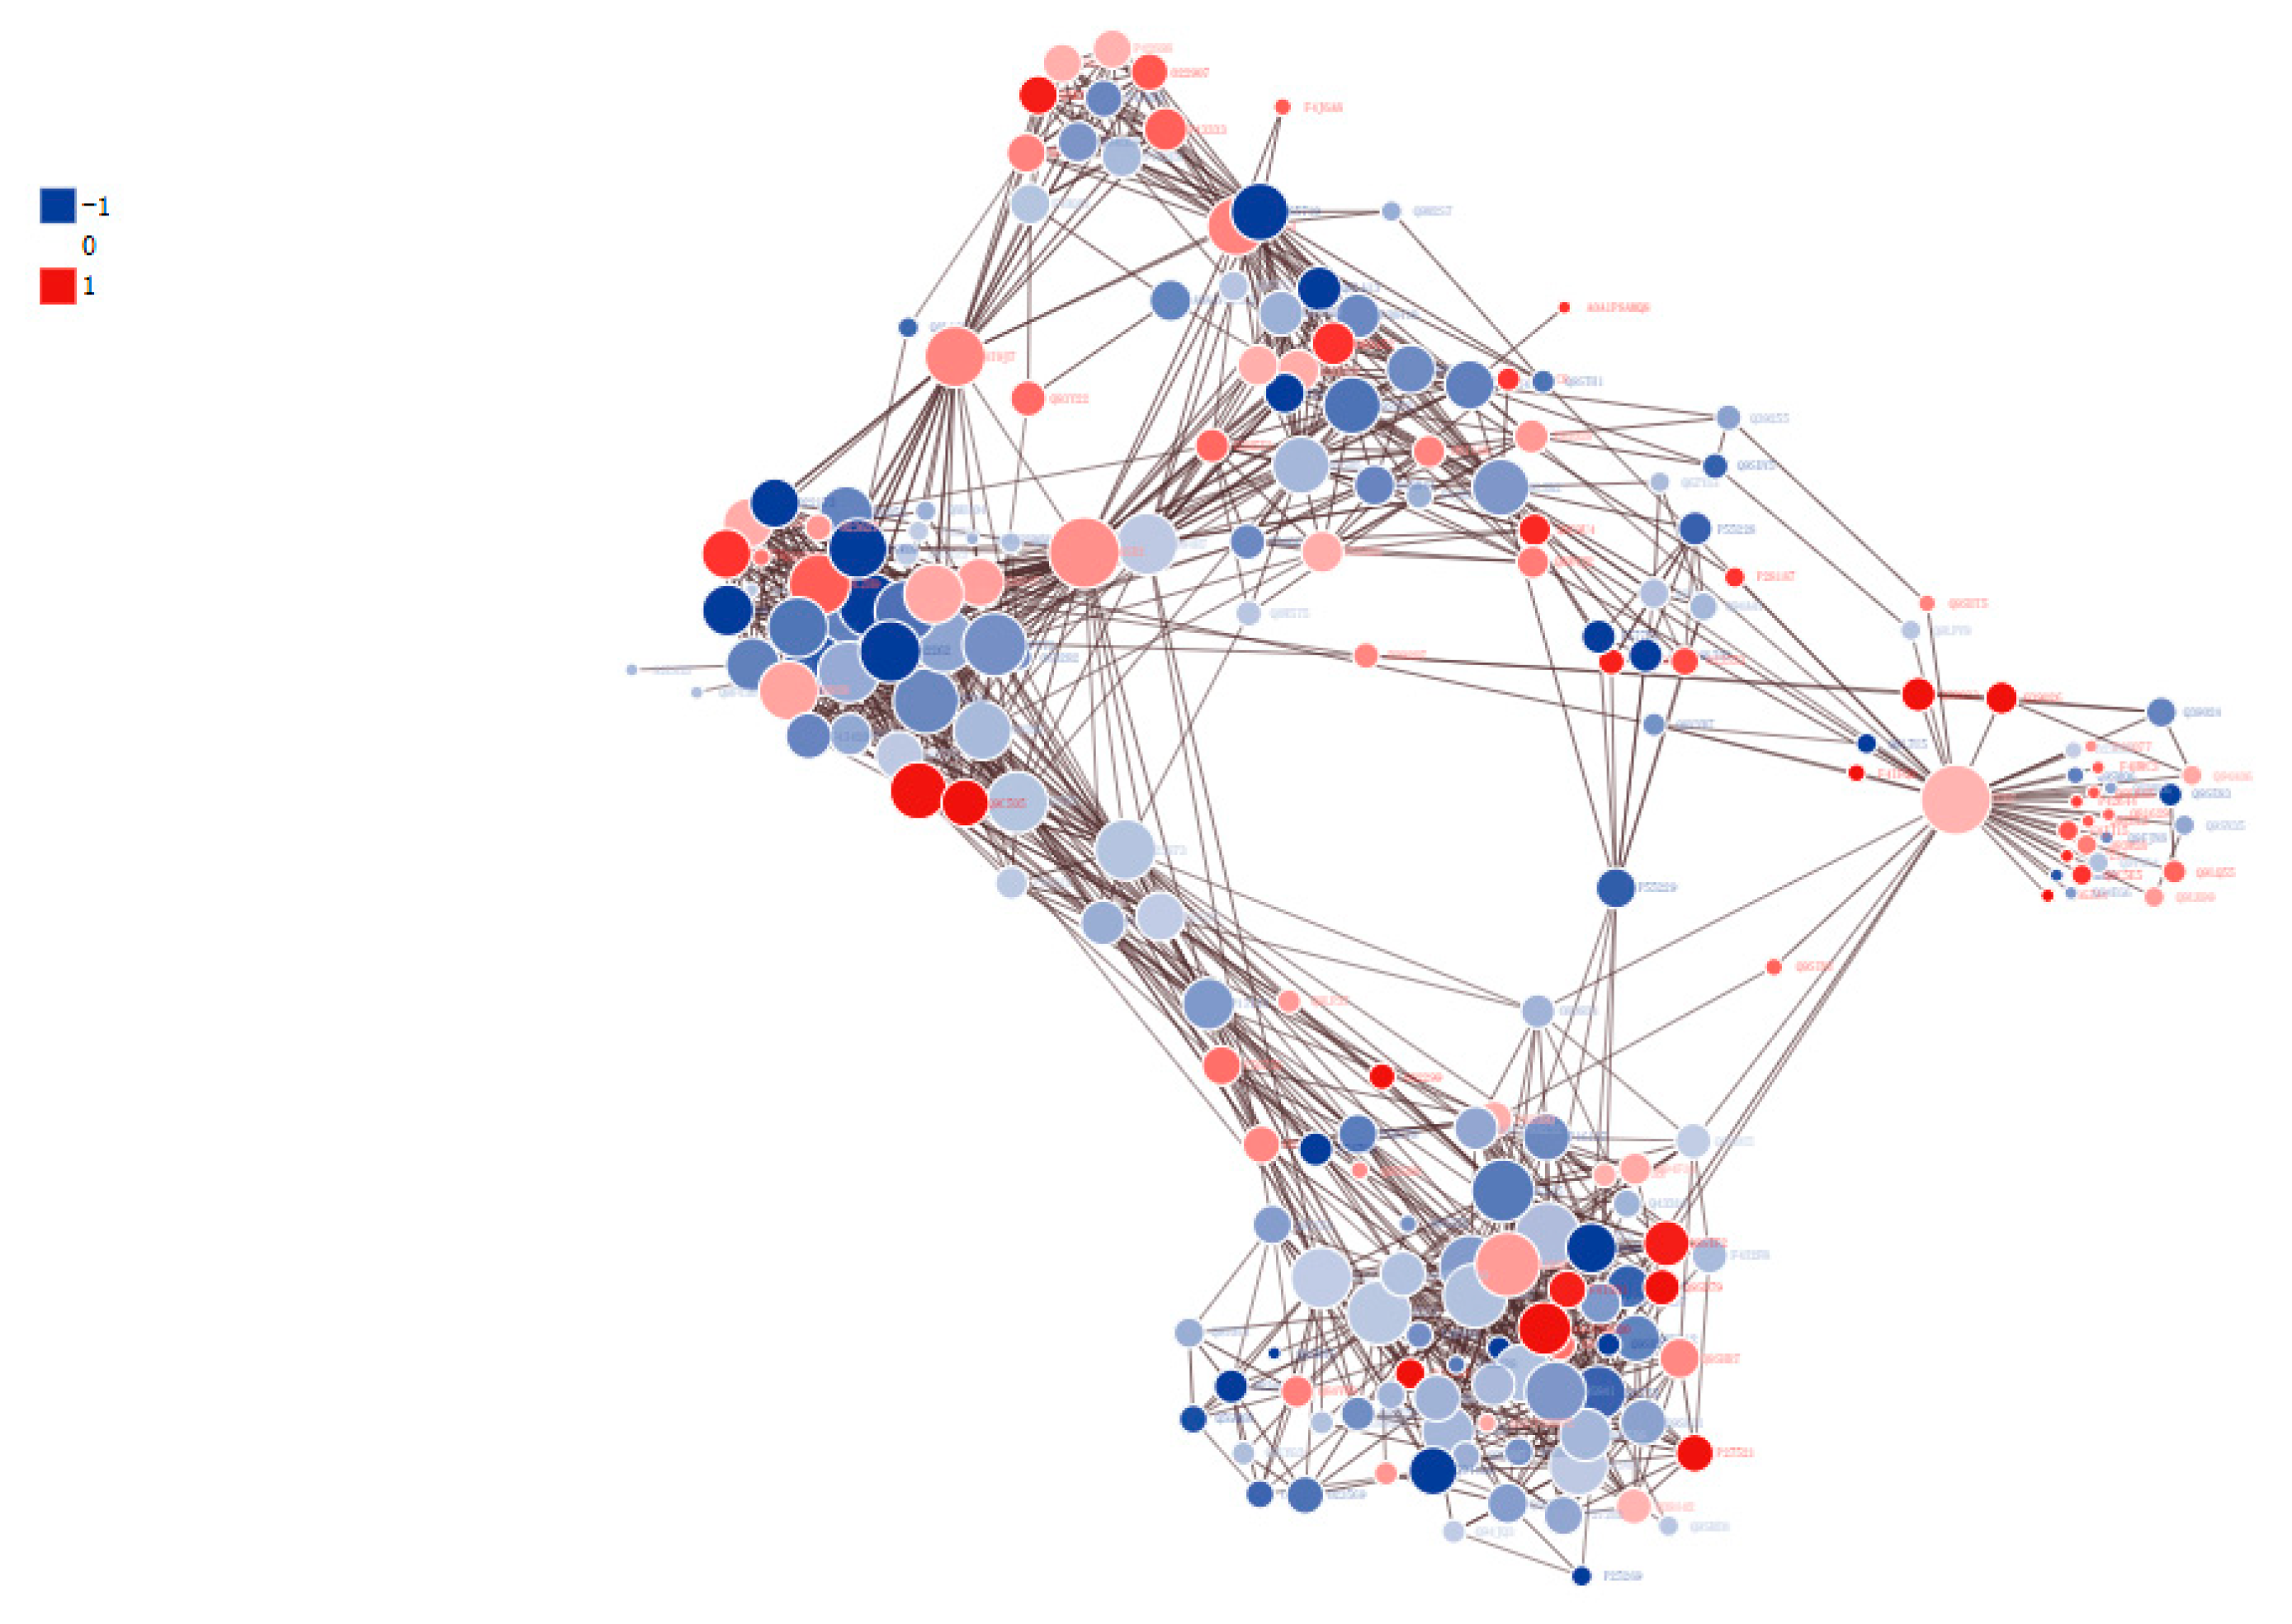
3.7. Protein–Protein Interaction (PPI) Networks of DPPs

The samples were analyzed using the STRING 10.5 (v.10.5) protein interaction network database to explore interactions among DPPs, and the results were visualized using the networkD3 package in R. With the confidence score > 0.7 as the filtering criterion, a total of 209 DPPs were screened, including 77 upregulated and 132 downregulated proteins, and 1264 pairs of PPIs were obtained (Figure 7, Table S4). The circles in Figure 7 represent the differentially modified proteins, shown by different colors (blue represents the downregulated protein and red represents the upregulated proteins). The circle size represents the number of differentially modified proteins and their interacting proteins. The larger the circle, the more proteins that interact with it, indicating that the protein is more important in the network. In order to clearly show the interaction between proteins, we screened the top 50 proteins with the closest interaction and mapped the protein interaction network.

4. Discussion

Protein phosphorylation is a key factor influencing the CBL-CIPK Ca2+ signaling network and Mg2+ homeostasis in Arabidopsis. Ca2+ signals can be detected by CBL2 and CBL3, which recruit and activate CBL-CIPK subsets. The CIPKs can interact with and phosphorylate Mg2+ transport systems to transport Mg2+ into vacuoles. Phosphorylated proteins with regard to membranes, transporters, and signal transductions were identified in the present study. The results could enhance our understanding of the cipk3/9/23/26 mutant response to Mg2+ and signal transduction in Arabidopsis.

4.1. Response of the Cipk3/9/23/26 Mutant to Magnesium Toxicity

Mg2+ acts as a cofactor for enzymes and serves as a key chlorophyll metal ion in green tissues. High Mg2+ levels are toxic to the cipk3/9/23/26 quadruple mutant, which not only results in severe growth retardation, but also causes chlorosis of leaf tips. Quantitative phosphoproteomics analyses revealed that the Mg-chelatase subunit, CHLI-1, was downregulated in the cipk3/9/23/26 quadruple mutant, which could influence the loss of chlorophyll in leaf tips (Figure 1). Vacuolar (V-type) proton ATPase and vacuolar proton pyrophosphatase (V-PPase) take the responsibility for generating a proton gradient and membrane potential, which activate secondary transport across the vacuolar membrane [11]. In the cipk3/9/23/26 quadruple mutant, the V-type proton ATPase subunit was downregulated, which in turn influenced the tonoplast membrane potential and consequent ion transport, resulting in high Mg2+ in the cytoplasm, which is toxic to the cipk3/9/23/26 quadruple mutant.

4.2. Transport-Related Proteins

Three subfamilies (ABCB, ABCC, and ABCG) were detected in this study, which belong to members of the ABC transporter superfamily. Studies have uncovered that ABC transporters are not only mediated the transportation of hormones, lipids, metal ions, secondary metabolites, and exogenous substances in plants, but are also beneficial to plant–pathogen interactions, and the regulation of ion channels in plants [12]. Among them, ABCB transporters are mostly localized to the plasma membrane, and a few transporters are localized to the mitochondrial and chloroplast membranes. ABCB transporters can collaborate with auxin transporters to regulate polar auxin transport and are essential to plant growth and development. For example, ABCB1, ABCB4, ABCB14, ABCB19, and ABCB21 have been successively reported to be related to auxin transport [13,14,15,16,17]. ABCC transporters largely occur in vacuolar membranes, and their primary function is to transport a series of toxic substances to the vacuoles. Metal complexes with phytochelatins (PCs, known as class metallothioneins, which are induced in plants and are considered to detoxify metals by forming PC-metal complexes), and is transported into vacuoles by the ABCC transporter. The ABCC transporter is also associated with the regulation of ion channels and plant-mediated pathogenic responses [18]. The ABCC subfamily proteins have been associated with the transportation of a broad range of xenobiotics to the vacuoles. For example, AtABCC1 and AtABCC2 transporters are required for arsenic detoxification in Arabidopsis, and the C-type ATP-binding cassette transporter (OsABCC7) takes part in root-to-shoot translocation of arsenic in rice [19]. The ABCC subfamilies, which are vacuolar transporters, take part in lead detoxification in Saccharomyces cerevisiae [20]. ABCG transporters are functionally diverse. For example, ABCG transporter genes are expressed when plants are subjected to salt stress, tissue hypoxia, heavy metal stress, bacterial infection, and other external stresses [21,22]. In the present study, 10 ABC transporters that were upregulated at the phosphorylation level were identified, including the ABC transporter B family members 1, 6, 19, 21, and 27, ABC transporter C family members 1 and 14, and ABC transporter G family members 12, 22, and 36 (Table 2). In the ABCB subfamily, ABCB1, ABCB19, and ABCB21 expression levels, as well as PIN3, were upregulated, which suggests that the transporters could be involved in the regulation of auxin and ion transport. ABCG36 is a multifunctional protein in Arabidopsis that acts as a metal exporter [23]. The upregulated expression of ABCG36 in the present study suggests that it could be involved in maintaining Mg2+ balance in the cipk3/9/23/26 mutant. In addition to ABC transporters, the expression levels of some transporters, such as vacuolar cation/proton exchanger 1 (CAX1), aquaporin (PIP2-6), cationic amino acid transporter 9 (CAT9), and potassium ion efflux antiporter 1 (KEA1), were upregulated to varying degrees (Table 2). Vacuolar cation/proton exchangers (CAXs) are universal types of ion transporters in plants. CAX transporters in Arabidopsis have been demonstrated to exhibit diverse roles in vacuolar sequestration of Ca2+ and other cations, presenting a vital mechanism for ion stress [24]. The cipk3/9/23/26 mutant has a defective pathway for vacuolar Mg2+ sequestration, which increases toxicity in the cytoplasm under moderate and high Mg2+ levels. The general toxic effects of high Mg2+ in the cipk3/9/23/26 mutant could impair Ca2+ homeostasis, which in turn inhibits Ca2+ uptake [6]. Mg2+ induces a specific Ca2+ signal, which is modulated by CAX. The signal is decoded by CBL2 and CBL3 sensors; however, CIPK3/9/23/26 does not interact with CBL2 and CBL3 in cipk3/9/23/26, and in turn, target proteins are not activated. Therefore, Mg2+ accumulates in the cytoplasm and is not sequestered into vacuoles, which leads to Mg2+ toxicity in plants.
Based on previous studies, variations in the phosphorylation states of the transporters in the cipk3/9/23/26 mutant suggest that they could regulate ion concentrations to balance cell osmotic potential and facilitate the storage of Mg2+ in vacuoles, maintaining non-toxic Mg2+ levels in the cytoplasm.

4.3. Signal Transduction and Protein Kinases

Reversible protein phosphorylation, which is mediated by protein kinases and phosphatase, is one of the key post-translational modifications (PTMs) of proteins in signal transductions [25]. Mitogen-activated protein kinases (MAPKs) are serine/threonine protein kinases that are ubiquitous in eukaryotes. The resulting MAPK cascade pathways are the most widespread signaling pathways regulating plant growth, development, and stress response, which can transmit external stimuli into cells and enable cells to develop effective and timely defense responses. In the present study, we established that MKK1, MPK3, MPK6, MPK15, MPK16, and partial At1g80180 (MASS1) proteins, which were upregulated at the phosphorylation level, were associated with the MAPK cascade pathway, while MPK4 and partial At1g80180 proteins were downregulated at the phosphorylation level (Table 2). The MKK component is a member of the MAPKK gene family. MPK3, MPK4, and MPK6 are a family of MAPK protein kinases which are located downstream of the MAPK cascade signal. MPK3 and MPK6 are homologous proteins. Previous studies have revealed that the MEKK1-MKK1/MKK2-MPK4 cascade in Arabidopsis responds to cold and salt stress and negatively regulates immune responses mediated by SUMM2 [26,27,28,29]. In Glycine max, the GmMEKK1-GmMKK1/2/4/9-GmMPK3/6 cascade regulates cell death and participates in immune defense responses [30]. At1g80180 is a substrate protein of MPK3 and MPK6, and its overexpression can regulate the production and aggregation of stomata [31]. Specifically, the mechanisms of interaction between the MPK and MAPK signaling cascades and CBL-CIPK networks in the regulation of Mg2+ homeostasis require further study.
Ca2+ is a key second messenger in plant cell signal transduction. Ca2+ signals in the cell can be transmitted to downstream components by Ca2+ sensor proteins (CaM/CML/CBLs/CDPKs), exposing them to external stimuli, which can cause protein phosphorylation and the expression of related genes, thereby regulating plant growth and development, as well as immune and stress responses [32]. In the present study, CaM5, CML24, CPK3, and CPK9 were upregulated at the phosphorylation level, CPK10 and CPK13 were downregulated, while the expressions of CML35, CML41, CPK1, and CPK21 were upregulated or downregulated to varying degrees at the phosphorylation level (Table 2). Calmodulin (CaM) is a receptor protein that primarily mediates the regulation of enzymes, ion channels, and other proteins by Ca2+. Studies have revealed that CaM5 expression could be caused by fungal infections and mechanical damage [33,34]. CML is similar to CaM in structure and it is composed of EF-hand domains, and has the ability to bind to Ca2+. In Arabidopsis, AtCML24 can positively regulate polar growth of pollen tubes as a downstream receptor of Ca2+ signals, and take part in the regulation of plant root growth and development under mechanical stimulation [35,36]. AtCML41 can mediate the deposition of the corpus callosum by the Ca2+ signaling pathway to resist infection by pathogens [37]. CDPK is a class of serine/threonine protein kinases, which can interact with substrates without binding to other proteins due to having their own protein kinase domain. In the CDPK/Ca2+-mediated ABA signaling pathway, CPK3 and CPK6 positively regulate the ABA signaling pathway and are key factors influencing the regulation of guard cell anions, while CPK10 participates in the regulation of stomatal closure in Arabidopsis under drought conditions [38,39]. CPK21 exerts a negative regulatory effect in hyperosmotic stress [40]. In Oryza sativa, OsCPK9 can improve drought resistance in plants by promoting stomatal closure [41], and overexpression of the OsCPK9 gene can enhance salt tolerance [42]. CDPK has a variety of substrates; among them, 14-3-3 proteins can either bind to phosphorylated CDPK or be phosphorylated by CDPK. In this study, two 14-3-3 proteins (GRF3 and GRF4) were upregulated at the phosphorylation level. Studies have revealed that peroxisome-bound CPK1 and CPK3 can phosphorylate 14-3-3 proteins at multiple sites, and that the 14-3-3 proteins exert direct regulatory effects on CDPK activity and stability in plant cells [43]. The results show that 14-3-3 proteins interact with CDPK and participate in stress response and signal transduction pathways, among others. The characterization of key signal transduction proteins suggests that phosphorylation enables cells to rapidly respond to Mg2+ sensitivity.

5. Conclusions

In the present study, 12,506 phosphorylation modification sites on 4537 proteins were identified in the Arabidopsis cipk3/9/23/26 mutant and WT using phosphorylation modification enrichment technology, and TMT labeling coupled with LC-MS/MS. We detected 773 DPPs (1164 differential phosphorylation sites), of which 376 were upregulated (607 sites) and 397 were downregulated (557 sites) based on a p-value < 0.05 and a change threshold of 1.2. We focused on the global variations in phosphorylated proteins involved in transportation, signal transduction, and protein kinases in various cellular pathways and processes. The results of the study revealed that the abundance of phosphopeptides of certain ABC transporters, CAX1, PIP2-6, CAT9, and KEA1, were upregulated to varying degrees, in addition to the upregulation of several protein kinases, such as MAPKs and CDPKs. The results are a fundamental resource, which provide insights into how the cipk3/9/23/26 mutant plants respond to Mg2+ sensitivity and adapt to physical and chemical changes, thereby maintaining Mg2+ homeostasis, and a balance in the physiological and biochemical processes of the cellular components. The research of PTM events would elucidate a major checkpoint for cellular signaling in plant responses to Mg2+ sensitivity.

Supplementary Materials

The following are available online at https://www.mdpi.com/article/10.3390/genes12111759/s1, Figure S1: KOG functional classification of phosphorylated proteins and differential phosphorylated proteins, Table S1: The detail information of identified phosphorylation modification sites and proteins, Table S2: The detail information on the number of screened differentially modified proteins and modified sites, Table S3: The detail information of motif analysis of cipk3/9/23/26 phosphoprotein modification, Table S4: Node Information of PPI.

Author Contributions

Conceptualization, Y.Z. and J.S.; formal analysis, Y.Z. and Z.Y.; data curation, Y.Z. and Z.Y.; writing—original draft preparation, Z.Y.; writing—review and editing, Y.Z. and Z.Y. All authors have read and agreed to the published version of the manuscript.

Funding

This research receive Major Research project of the Natural Science Foundation of Jiangsu Higher Education Institutions (No. 12KJA220002).

Institutional Review Board Statement

Not applicable.

Informed Consent Statement

Not applicable.

Data Availability Statement

No new data were created or analyzed in this study. Data sharing is not applicable to this article.

Acknowledgments

This study was supported by the Priority Academic Program Development of Jiangsu Higher Education Institutions (PAPD). We thank Sheng Luan and Renjie Tang from the Department of Plant and Microbial Biology, University of California, Berkeley, for providing cipk3/9/23/26 mutant seeds.

Conflicts of Interest

The authors declare that they have no conflict of interest.

References

  1. Grusak, M.A.; Broadley, M.R.; White, P.J. Plant macro-and micronutrient minerals. In Encyclopedia Life Sciences; Wiley & Sons: Hoboken, NJ, USA, 2016; pp. 1–6. [Google Scholar]
  2. Luan, S. The CBL–CIPK network in plant calcium signaling. Trends Plant Sci. 2009, 14, 37–42. [Google Scholar] [CrossRef] [PubMed]
  3. Pandey, G.K.; Kanwar, P.; Singh, A.; Steinhorst, L.; Pandey, A.; Yadav, A.K.; Tokas, I.; Sanyal, S.K.; Kim, B.-G.; Lee, S.-C.; et al. Calcineurin B-like protein-interacting protein kinase CIPK21 regulates osmotic and salt stress responses in Arabidopsis. Plant Physiol. 2015, 169, 780–792. [Google Scholar] [CrossRef] [PubMed] [Green Version]
  4. Sanyal, S.K.; Kanwar, P.; Yadav, A.K.; Sharma, C.; Kumar, A.; Pandey, G.K. Arabidopsis CBL interacting protein kinase 3 interacts with ABR1, an APETALA2 domain transcription factor, to regulate ABA responses. Plant Sci. 2017, 254, 48–59. [Google Scholar] [CrossRef]
  5. Gerendás, J.; Führs, H. The significance of magnesium for crop quality. Plant Soil 2013, 368, 101–128. [Google Scholar] [CrossRef] [Green Version]
  6. Tang, R.; Zhao, F.-G.; Garcia, V.J.; Kleist, T.J.; Yang, L.; Zhang, H.-X.; Luan, S. Tonoplast CBL-CIPK calcium signaling network regulates magnesium homeostasis in Arabidopsis. Proc. Natl. Acad. Sci. USA 2015, 112, 3134–3139. [Google Scholar] [CrossRef] [Green Version]
  7. Mogami, J.; Fujita, Y.; Yoshida, T.; Tsukiori, Y.; Nakagami, H.; Nomura, Y.; Fujiwara, T.; Nishida, S.; Yanagisawa, S.; Ishida, T.; et al. Two distinct families of protein kinases are required for plant growth under high external Mg2+ concentrations in Arabidopsis. Plant Physiol. 2015, 167, 1039–1057. [Google Scholar] [CrossRef] [PubMed] [Green Version]
  8. Qiu, J.; Hou, Y.; Tong, X.; Wang, Y.; Lin, H.; Liu, Q.; Zhang, W.; Li, Z.; Nallamilli, B.R.; Zhang, J. Quantitative phosphoproteomic analysis of early seed development in rice (Oryza sativa L.). Plant Mol. Biol. 2016, 90, 249–265. [Google Scholar] [CrossRef] [PubMed]
  9. Yu, B.; Li, J.; Koh, J.; Dufresne, C.; Yang, N.; Qi, S.; Zhang, Y.; Ma, C.; Duong, B.V.; Chen, S.; et al. Quantitative proteomics and phosphoproteomics of sugar beet monosomic addition line M14 in response to salt stress. J. Proteom. 2016, 143, 286–297. [Google Scholar] [CrossRef] [Green Version]
  10. Wang, Y.; Tong, X.; Qiu, J.; Li, Z.; Zhao, J.; Hou, Y.; Tang, L.; Zhang, J. A phosphoproteomic landscape of rice (Oryza sativa) tissues. Physiol. Plant 2017, 160, 458–475. [Google Scholar] [CrossRef] [PubMed] [Green Version]
  11. Graus, D.; Konrad, K.R.; Bemm, F.; Nebioglu, M.G.P.; Lorey, C.; Duscha, K.; Güthoff, T.; Herrmann, J.; Ferjani, A.; Cuin, T.A.; et al. High V-PPase activity is beneficial under high salt loads, but detrimental without salinity. New Phytol. 2018, 219, 1421–1432. [Google Scholar] [CrossRef] [PubMed]
  12. Kang, J.; Park, J.Y.; Choi, H.; Burla, B.; Kretzschmar, T.; Lee, Y.; Martinoia, E. Plant ABC transporters. Arab. Book 2011, 9, e0153. [Google Scholar] [CrossRef] [Green Version]
  13. Sidler, M.; Hassa, P.O.; Hasan, S.; Ringli, C.; Dudler, R. Involvement of an ABC transporter in a developmental pathway regulating hypocotyl cell elongation in the light. Plant Cell. 1998, 10, 1623–1636. [Google Scholar] [CrossRef] [Green Version]
  14. Lewis, D.R.; Miller, N.D.; Splitt, B.L.; Wu, G.; Spalding, E.P. Separating the roles of acropetal and basipetal auxin transport on gravitropism with mutations in two Arabidopsis multidrug resistance-like ABC transporter genes. Plant Cell. 2007, 19, 1838–1850. [Google Scholar] [CrossRef] [Green Version]
  15. Kaneda, M.; Schuetz, M.; Lin, B.S.; Chanis, C.; Hamberger, B.; Western, T.L.; Ehlting, J.; Samuels, A.L. ABC transporters coordinately expressed during lignification of Arabidopsis stems include a set of ABCBs associated with auxin transport. J. Exp. Bot. 2011, 62, 2063–2077. [Google Scholar] [CrossRef] [Green Version]
  16. Kubes, M.; Yang, H.; Richter, G.L.; Cheng, Y.; Mlodzinska, E.; Wang, X.; Blakeslee, J.J.; Carraro, N.; Petrasek, J.; Zazimalova, E.; et al. The Arabidopsis concentration-dependent influx/efflux transporter ABCB4 regulates cellular auxin levels in the root epidermis. Plant J. 2012, 69, 640–654. [Google Scholar] [CrossRef]
  17. Jenness, M.K.; Carraro, N.; Pritchard, C.A.; Murphy, A.S. The Arabidopsis ATP-BINDING CASSETTE transporter ABCB21 Regulates auxin levels in cotyledons, the root pericycle, and leaves. Front. Plant Sci. 2019, 10, 806. [Google Scholar] [CrossRef] [Green Version]
  18. Wanke, D.; Üner Kolukisaoglu, H. An update on the ABCC transporter family in plants: Many genes, many proteins, but how many functions? Plant Biol. 2010, 12, 15–25. [Google Scholar] [CrossRef]
  19. Tang, Z.; Chen, Y.; Miller, A.J.; Zhao, F.-J. The C-type ATP-binding cassette transporter OsABCC7 is involved in the root-to-shoot translocation of arsenic in rice. Plant Cell Physiol. 2019, 60, 1525–1535. [Google Scholar] [CrossRef] [PubMed]
  20. Sousa, C.A.; Hanselaer, S.; Soares, E.V. ABCC subfamily vacuolar transporters are involved in Pb (lead) detoxification in Saccharomyces cerevisiae. Appl. Biochem. Biotechnol. 2015, 175, 65–74. [Google Scholar] [CrossRef] [PubMed] [Green Version]
  21. Jasinski, M.; Banasiak, J.; Radom, M.; Kalitkiewicz, A.; Figlerowicz, M. Full-size ABC transporters from the ABCG subfamily in Medicago truncatula. Mol. Plant-Microbe Interact. 2009, 22, 921–931. [Google Scholar] [CrossRef] [PubMed]
  22. Ruocco, M.; Ambrosino, P.; Lanzuise, S.; Woo, S.L.; Lorito, M. Four potato (Solanum tuberosum) ABCG transporters and their expression in response to abiotic factors and Phytophthora infestans infection. J. Plant Physiol. 2011, 168, 2225–2233. [Google Scholar] [CrossRef] [PubMed]
  23. Dhara, A.; Raichaudhuri, A. ABCG transporter proteins with beneficial activity on plants. Phytochemistry. 2021, 184, 112663. [Google Scholar] [CrossRef] [PubMed]
  24. Bickerton, P.D.; Pittman, J.K. Role of cation/proton exchangers in abiotic stress signaling and stress tolerance in plants. In Elucidation of Abiotic Stress Signaling in Plants; Springer: New York, NY, USA, 2015; pp. 95–117. [Google Scholar]
  25. Yang, L.; Ji, W.; Gao, P.; Li, Y.; Cai, H.; Bai, X.; Chen, Q.; Zhu, Y. GsAPK, an ABA-activated and calcium-independent SnRK2-type kinase from G. soja, mediates the regulation of plant tolerance to salinity and ABA stress. PLoS ONE 2012, 7, e33838. [Google Scholar] [CrossRef] [PubMed] [Green Version]
  26. Gao, M.; Liu, J.; Bi, D.; Zhang, Z.; Cheng, F.; Chen, S.; Zhang, Y. MEKK1, MKK1/MKK2 and MPK4 function together in a mitogen-activated protein kinase cascade to regulate innate immunity in plants. Cell Res. 2008, 18, 1190–1198. [Google Scholar] [CrossRef] [PubMed] [Green Version]
  27. Kong, Q.; Qu, N.; Gao, M.H.; Zhang, Z.B.; Ding, X.J.; Yang, F.; Li, Y.Z.; Dong, O.X.; Chen, S.; Li, X.; et al. The MEKK1-MKK1/MKK2-MPK4 kinase cascade negatively regulates immunity mediated by a mitogen-activated protein kinase kinase kinase in Arabidopsis. Plant Cell 2012, 24, 2225–2236. [Google Scholar] [CrossRef] [Green Version]
  28. Zhang, Z.; Wu, Y.; Gao, M.; Zhang, J.; Kong, Q.; Liu, Y.; Ba, H.; Zhou, J.; Zhang, Y. Disruption of PAMP-induced MAP kinase cascade by a Pseudomonas syringae effector activates plant immunity mediated by the NB-LRR protein SUMM2. Cell Host Microbe 2012, 11, 253–263. [Google Scholar] [CrossRef] [Green Version]
  29. Zhao, C.Z.; Wang, P.C.; Si, T.; Hsu, C.C.; Wang, L.; Zayed, O.; Yu, Z.P.; Zhu, Y.F.; Dong, J.; Tao, W.A.; et al. MAP kinase cascades regulate the cold response by modulating ICE1 protein stability. Dev. Cell 2017, 43, 618–629.e5. [Google Scholar] [CrossRef] [Green Version]
  30. Xu, H.Y.; Zhang, C.; Li, Z.C.; Wang, Z.-R.; Jiang, X.-X.; Shi, Y.-F.; Tian, S.-N.; Braun, E.; Mei, Y.; Qiu, W.-L.; et al. The MAPK kinase kinase GmMEKK1 regulates cell death and defense responses. Plant Physiol. 2018, 178, 907–922. [Google Scholar] [CrossRef] [Green Version]
  31. Xue, X.; Bian, C.; Guo, X.; Di, R.; Dong, J. The MAPK substrate MASS proteins regulate stomatal development in Arabidopsis. PLoS Genet. 2020, 16, e1008706. [Google Scholar] [CrossRef] [Green Version]
  32. McAinsh, M.R.; Brownlee, C.; Hetherington, A.M. Calcium ions as second messengers in guard cell signal transduction. Physiol. Plant. 1997, 100, 16–29. [Google Scholar] [CrossRef]
  33. Heo, D.W.; Lee, S.H.; Kim, M.C.; Chung, W.S.; Chun, H.J.; Lee, K.J.; Park, H.C.; Choi, J.Y.; Cho, M.J. Involvement of specific calmodulin isoforms in salicylic acid-independent activation of plant disease resistance responses. Proc. Natl. Acad. Sci. USA 1999, 96, 766–771. [Google Scholar] [CrossRef] [Green Version]
  34. Peng, H.; Yang, T.; Li, W.M.J. Calmodulin gene expression in response to mechanical wounding and Botrytis cinerea infection in tomato fruit. Plants 2014, 3, 427–441. [Google Scholar] [CrossRef] [PubMed] [Green Version]
  35. Wang, Y.; Wang, B.; Gilroy, S.; Chehab, E.W.; Braam, J. CML24 is involved in root mechanoresponses and cortical microtubule orientation in Arabidopsis. J. Plant Growth Regul. 2011, 30, 467–479. [Google Scholar] [CrossRef]
  36. Yang, X.; Wang, S.S.; Wang, M.; Qiao, Z.; Bao, C.-C.; Zhang, W. Arabidopsis thaliana calmodulin-like protein CML24 regulates pollen tube growth by modulating the actin cytoskeleton and controlling the cytosolic Ca2+ concentration. Plant Mol. Biol. 2014, 86, 225–236. [Google Scholar] [CrossRef]
  37. Xu, B.; Cheval, C.; Laohavisit, A.; Hocking, B.; Chiasson, D.; Olsson, T.S.G.; Shirasu, K.; Faulkner, C.; Gilliham, M. A calmodulin-like protein regulates plasmodesmal closure during bacterial immune responses. New Phytol. 2017, 215, 77–84. [Google Scholar] [CrossRef] [Green Version]
  38. Mori, I.C.; Murata, Y.; Yang, Y.; Munemasa, S.; Wang, Y.-F.; Andreoli, S.; Tiriac, H.; Alonso, J.M.; Harper, J.F.; Ecker, J.R.; et al. CDPKs CPK6 and CPK3 function in ABA regulation of guard cell S-type anion-and Ca2+-permeable channels and stomatal closure. PLoS Biol. 2006, 4, e327. [Google Scholar] [CrossRef] [Green Version]
  39. Zou, J.J.; Wei, F.J.; Wang, C.; Wu, J.-J.; Ratnasekera, D.; Liu, W.-X.; Wu, W.-H. Arabidopsis calcium-dependent protein kinase CPK10 functions in abscisic acid-and Ca2+-mediated stomatal regulation in response to drought stress. Plant Physiol. 2010, 154, 1232–1243. [Google Scholar] [CrossRef] [Green Version]
  40. Franz, S.; Ehlert, B.; Liese, A.; Kurth, J.; Cazalé, A.-C.; Romeis, T. Calcium-dependent protein kinase CPK21 functions in abiotic stress response in Arabidopsis thaliana. Mol. Plant 2011, 4, 83–96. [Google Scholar] [CrossRef] [PubMed]
  41. Wei, S.; Hu, W.; Deng, X.; Zhang, Y.; Liu, X.; Zhao, X.; Luo, Q.; Jin, Z.; Zhou, S.; Sun, T.; et al. A rice calcium-dependent protein kinase OsCPK9 positively regulates drought stress tolerance and spikelet fertility. BMC Plant Biol. 2014, 14, 1–13. [Google Scholar] [CrossRef] [PubMed] [Green Version]
  42. Asano, T.; Hakata, M.; Nakamura, H.; Aoki, N.; Komatsu, S.; Ichikawa, H.; Hirochika, H.; Ohsugi, R. Functional characterisation of OsCPK21, a calcium-dependent protein kinase that confers salt tolerance in rice. Plant Mol. Biol. 2011, 75, 179–191. [Google Scholar] [CrossRef]
  43. Swatek, K.N.; Wilson, R.S.; Ahsan, N.; Tritz, R.L.; Thelen, J.J. Multisite phosphorylation of 14-3-3 proteins by calcium-dependent protein kinases. Biochem. J. 2014, 459, 15–25. [Google Scholar] [CrossRef] [PubMed] [Green Version]
Figure 1. Wild type Arabidopsis thaliana (Colombia wild) and its cipk3/9/23/26 mutant.
Genes 12 01759 g001
Figure 2. Quality control (QC) evaluation of mass spectrometry (MS) data. (A) Mass error distribution of phosphorylated peptides identified by mass spectrometry. (B) Length distribution of all phosphorylated peptides identified by mass spectrometry. (C) Modified quantitative principal component analyses, relative standard deviation, and Pearson’s correlation coefficient among repeated samples.
Genes 12 01759 g002
Figure 3. Identification of phosphorylation modification sites and proteins. (A) The number distributions of differentially phosphorylated proteins and phosphorylation sites in various comparison groups. (B) Serine (S), threonine (T), and tyrosine (Y) residues in phosphorylation site distributions.
Genes 12 01759 g003
Figure 4. Classification of all identified phosphorylated proteins and differentially phosphorylated proteins (DPPs). (A) Gene Ontology (GO) analyses of all identified phosphorylated proteins and DPPs. All proteins were classified using GO terms based on three categories: molecular function, biological process, and cellular component. (B) Subcellular structure classification of phosphorylated protein and DPPs.
Genes 12 01759 g004
Figure 5. GO annotation analyses of DPPs. (A) Distribution of upregulated proteins identified using the GO annotation tool. (B) Distribution of downregulated proteins identified using the GO annotation tool. Different color blocks represent different terms, including cellular component, molecular function, and biological process.
Genes 12 01759 g005
Figure 6. Kyoto Encyclopedia of Genes and Genomes (KEGG) and domain enrichment analyses of DPPs in Arabidopsis thaliana. (A) Significantly enriched KEGG pathways associated with the DPPs. (B) Significantly enriched protein domains associated with the DPPs.
Genes 12 01759 g006
Figure 7. Protein–protein interaction network of DPPs. Different circles in the figure represent different DPPs, in which red is the upregulated protein and blue is the downregulated protein. The larger the circle, the greater the number of proteins that interact with it, indicating that the protein is more important in the network.
Genes 12 01759 g007
Table 1. Over-represented motifs detected using the Motif-X algorithm.
MotifMotif ScoreForegroundBackgroundFold Increase
MatchesSizeMatchesSize
xxxxPx_S_PxRxxx39.87618351255952,65927.3
xxxxPx_S_PRxxxx40.29538290219952,40427.8
xxxxPx_S_PKxxxx39.63418237169952,18528.0
xxxxxx_S_PRxxxx32.0030081962586952,01613.5
xxxxPx_S_Pxxxxx32.0028178963314949,43010.2
xxxxxx_S_PxRxxx32.0024676152235946,11613.7
xxxRxx_S_PxPxxx38.69477369229943,88126.3
xxxxxx_S_PxxxRx32.0019973222288943,65211.2
xxxxxx_S_PKxxxx29.5116371232114941,36410.2
xxxRSx_S_xPxxxx38.04456960388939,25015.7
xxxxxx_S_PxxxxR30.0214969151948938,86210.4
xLxRxx_S_xxxxxx32.0029267665590936,9147.2
xxxxxR_S_Pxxxxx27.8211264741486931,32410.8
xxxxxG_S_Pxxxxx27.9812463621797929,83810.1
xxxRSx_S_xxxxxx32.0023462385119928,0416.8
xxxxxx_S_PxxRxx25.389360041423922,92210.0
xxxxxx_S_Pxxxxx16.00930591129,886921,4994.9
xxxRxx_S_Fxxxxx32.0011649811886891,61311.0
xxxRxx_S_xDxxxx28.358548651907889,7278.2
xxxxxx_S_DDExxx38.28464780478887,82017.9
xxxxxx_S_DGExxx39.07284734235887,34222.3
xMxRxx_S_xxxxxx25.45484706986887,1079.2
xxxxxx_S_DxExxx32.0011246583395886,1216.3
xxxRxx_S_xPxxxx24.236345461741882,7267.0
xxxxxG_S_Gxxxxx25.219944835462880,9853.6
xLxKSx_S_xxxxxx38.37294384497875,52311.7
xxxxxD_S_DxDxxx39.45374355422875,02617.6
xxxRxx_S_xExxxx23.856543182050874,6046.4
xxxKxx_S_Fxxxxx32.008542532802872,5546.2
xxxRxx_S_xGxxxx32.006641682312869,7526.0
xxxxxx_S_ExExxx32.0010541025008867,4404.4
xxxxxx_S_DxGxxx24.525539972966862,4324.0
xxxxxx_S_DxDxxx32.008639423168859,4665.9
xxxxxG_S_Fxxxxx25.255238562487856,2984.6
xxxxRx_S_xDxxxx26.265438042257853,8115.4
xxxxxx_S_ExGxxx24.295337503143851,5543.8
xLxKxx_S_xxxxxx24.767136974574848,4113.6
xxxxSx_S_Fxxxxx29.036836264094843,8373.9
xxxxxG_S_xxxxxx16.00338355847,187839,7431.7
xxxRxx_S_xxxxxx16.00314322025,377792,5563.0
xxxxSR_S_xxxxxx24.335429064112767,1793.5
xxxxxx_S_xExxxx16.00303285243,739763,0671.9
xxxxxx_S_xGxxxx16.00285254948,192719,3281.7
xxxxxx_S_xPxSPx39.01292264388671,13622.2
xxxxxx_S_xDxxxx16.00261223537,147670,7482.1
xxxxxx_S_GPLxxx39.06241974245633,60131.4
xxRxxx_S_xPxxxx23.733419502060633,3565.4
xxxxRx_S_xSxxxx29.927419164763631,2965.1
xxxxxx_S_FRxxxx27.423318421453626,5337.7
RxxSxx_S_xxxxxx20.274918094205625,0804.0
xxxxxD_S_xxxxxx12.49167176032,542620,8751.8
xxxxxx_S_xPxxxx13.05172159334,988588,3331.8
xxxKxx_S_xxxxxx10.30139142130,182553,3451.8
xxxxxx_S_xRxxxx12.48149128232,477523,1631.9
xxxxxx_S_Fxxxxx9.3899113321,946490,6862.0
xxxxSx_S_xNxxxx15.133110343443468,7404.1
xxxxxx_S_Dxxxxx7.2782100320,145465,2971.9
xxxxxx_S_xxGxxx7.969892125,916445,1521.8
xxxxxx_S_xKxxxx8.2911582333,536419,2361.7
xxxxPx_T_Pxxxxx32.0014310572335529,61530.7
xxxxxx_T_PxRxxx27.88639141278527,28028.4
xxxxxx_T_PRxxxx24.65488511115526,00226.6
xxxxxx_T_PTxxxx24.66548031470524,88724.0
xxxxxx_T_PKxxxx23.80477491406523,41723.4
xxxxxx_T_Pxxxxx16.0023970219,445522,0119.1
xxxRxx_T_xxxxxx16.008346325,391502,5663.5
xxxxxx_T_xExxxx10.576338031,767477,1752.5
xxxxxx_T_Dxxxxx6.443831721,640445,4082.5
Motif: simplified form of motifs; Motif Score: log odds score of the motif matrix, higher scores are better matches; Foreground Matches: indicates the number of peptides containing a given motif in the identified modification site peptides after removing all the peptides containing the previously extracted motifs; Background Matches: indicates the number of peptides with a given motif in the same length of peptides composed of amino acids that can be modified in the input database full protein sequence, after removing all the peptides containing the previously extracted motifs; Foreground Size: indicates the number of remaining peptides in the identified modified site peptides after removing all peptides containing the previously extracted motifs; Background Size: indicates the number of peptides remaining in the same-length peptides composed of amino acids that can be modified in the input database full protein sequence after removing all the peptides containing the previously extracted motifs; Fold Increase: to assess the enrichment level of the extracted motifs.
Table 2. Signaling and transport-related proteins differentially expressed in cipk3/9/23/26 leaves at the phosphorylation level.
Protein AccessionPositionRatioProtein DescriptionModified Sequence
Q9ZR7210141.49ABC transporter B family member 1KTEIEPDDPDT(0.203)T(0.797)PVPDR
Q9ZR726421.386ABC transporter B family member 1NS(0.016)S(0.979)Y(0.005)GRS(0.965)PY(0.005)S(0.03)R
Q9LJX06241.262ABC transporter B family member 19T(0.157)RS(0.831)T(0.094)RLS(0.917)HS(0.32)LS(0.672)T(0.008)K
Q9LJX06201.405ABC transporter B family member 19T(0.157)RS(0.831)T(0.094)RLS(0.917)HS(0.32)LS(0.672)T(0.008)K
Q9LJX06111.335ABC transporter B family member 19DFS(0.999)NPS(0.001)TR
Q9M1Q96601.554ABC transporter B family member 21LSMES(1)MKR
Q0WML06391.252ABC transporter B family member 27QLQS(0.009)S(0.086)S(0.889)S(0.016)VTTL
Q9C8G914851.778ABC transporter C family member 1S(0.007)IT(0.993)LENKR
Q9LZJ58971.403ABC transporter C family member 14SIS(1)IES(1)PRQPKS(1)PK
Q9LZJ58941.615ABC transporter C family member 14SIS(1)IES(1)PRQPKS(1)PK
Q9LZJ59031.345ABC transporter C family member 14SIS(1)IES(1)PRQPKS(1)PK
Q9C8K26671.237ABC transporter G family member 12KVPS(0.003)LS(0.162)S(0.162)LS(0.68)S(0.994)RR
Q9C8K26661.289ABC transporter G family member 12KVPSLS(0.003)S(0.009)LS(0.9)S(0.088)RR
Q9C8K26611.245ABC transporter G family member 12KVPS(0.999)LS(0.002)S(0.009)LS(0.829)S(0.162)R
Q93YS4711.29ABC transporter G family member 22LMGMS(0.996)PGRS(0.175)S(0.806)GAGT(0.022)HIR
Q93YS4661.428ABC transporter G family member 22RLMGMS(1)PGR
Q9XIE2401.266ABC transporter G family member 36NIEDIFSS(0.003)GS(0.997)R
A0A1P8AZ845862.017p-glycoprotein 6QKS(0.888)NGS(0.116)DPES(0.988)PIS(0.007)PLLISDPQNER
A0A1P8AZ846101.419p-glycoprotein 6S(0.002)HS(0.997)QT(0.001)FSRPLGHSDDTSASVK
A0A1P8AZ845931.548p-glycoprotein 6QKS(0.888)NGS(0.116)DPES(0.988)PIS(0.007)PLLISDPQNER
Q9S7Z82351.326Auxin efflux carrier component 3PSNLTGAEIYS(1)LS(0.003)T(0.201)T(0.797)PR
F4IS06381.674Vacuolar cation/proton exchangerTAHNMS(0.993)S(0.119)S(0.539)S(0.348)LRK
Q9ZV072821.214Probable aquaporin PIP2-6S(1)QLHELHA
A0A1P8AU30301.27Cationic amino acid transporter 9S(0.012)KS(0.986)LPPPS(0.001)S(0.001)QT(0.001)AVR
Q9ZTZ71201.733K(+) efflux antiporter 1, chloroplasticIGES(0.002)S(0.013)ES(0.864)S(0.121)DETEATDLK
Q8W4J25271.374Mitogen-activated protein kinase 16T(0.237)QPCKS(0.763)NRGDEDCATAAEGPSR
Q94A06271.235Mitogen-activated protein kinase kinase 1FLT(0.096)QS(0.9)GT(0.005)FKDGDLR
Q9C9U45301.742Mitogen-activated protein kinase 15ASQQAEGTENGGGGGYS(1)AR
Q390262212.126Mitogen-activated protein kinase 6VTSESDFMT(1)EY(1)VVTR
Q390262232.106Mitogen-activated protein kinase 6VTSESDFMT(1)EY(1)VVTR
Q390231982.156Mitogen-activated protein kinase 3PTSENDFMT(1)EY(1)VVTR
Q390231962.309Mitogen-activated protein kinase 3PTSENDFMT(1)EY(1)VVTR
Q390241950.637Mitogen-activated protein kinase 4T(0.036)KS(0.908)ET(0.056)DFMTEYVVTR
Q9SSC1981.208MAPK kinase substrate protein At1g80180VS(1)PAVDPPS(1)PR
Q9SSC1161.429MAPK kinase substrate protein At1g80180RQGS(1)S(1)GIVWDDR
Q9SSC1171.33MAPK kinase substrate protein At1g80180RQGS(1)S(1)GIVWDDR
Q9SSC1820.464MAPK kinase substrate protein At1g80180S(0.013)RS(0.987)NGGGAIR
F4IVN6801.251Calmodulin 5MKDT(0.998)DS(0.002)EEELK
F4IVN6821.21Calmodulin 5MKDT(0.017)DS(0.983)EEELK
P30188271.812Probable calcium-binding protein CML35AS(0.008)VS(0.183)RS(0.803)EPS(0.501)S(0.501)FS(0.002)S(0.002)NASSSSSDGSYGNLK
P30188110.765Probable calcium-binding protein CML35LAASLNRLS(1)PK
P30188440.208Probable calcium-binding protein CML35SEPSSFSSNASSSSSDGS(1)YGNLK
P25070461.215Calcium-binding protein CML24ALS(0.937)PT(0.059)AS(0.004)PEETVTMMK
Q8L3R21590.593Probable calcium-binding protein CML41GSGCIT(1)PK
Q8L3R2261.321Probable calcium-binding protein CML41LNLS(1)FQNR
Q8L3R2470.566Probable calcium-binding protein CML41SNSS(0.001)S(0.003)T(0.017)LNS(0.98)PRS(1)NSDDNNNIK
Q38868691.208Calcium-dependent protein kinase 9AAAAAPGLS(1)PK
Q38868511.627Calcium-dependent protein kinase 9TTQQPEKPGS(0.997)VNS(0.003)QPPPWR
Q38868781.889Calcium-dependent protein kinase 9S(0.001)NS(0.999)ILENAFEDVK
Q9ZSA22440.432Calcium-dependent protein kinase 21DIVGS(1)AYYVAPEVLR
Q9ZSA2531.322Calcium-dependent protein kinase 21PMTQPIHQQIS(0.964)T(0.036)PSSNPVSVR
Q9ZSA24141.449Calcium-dependent protein kinase 21LGS(0.997)RLS(0.003)ETEVK
Q9ZSA24170.744Calcium-dependent protein kinase 21LS(0.971)ET(0.029)EVK
Q9M9V8400.394Calcium-dependent protein kinase 10LNPFAGDFT(0.002)RS(0.998)PAPIR
Q8W4I7180.712Calcium-dependent protein kinase 13EDVKS(1)NY(0.001)S(0.999)GHDHAR
Q8W4I7210.454Calcium-dependent protein kinase 13SNYS(1)GHDHAR
Q8W4I7430.511Calcium-dependent protein kinase 13VLS(1)DVPKENIEDR
Q42479181.485Calcium-dependent protein kinase 3SSDPPPSS(0.005)S(0.768)S(0.175)S(0.041)S(0.009)S(0.002)GNVVHHVKPAGER
Q068501300.778Calcium-dependent protein kinase 1RVS(0.076)S(0.924)AGLR
Q06850641.878Calcium-dependent protein kinase 1LSDEVQNKPPEQVT(0.997)MPKPGT(0.003)DVETK
Q068501290.549Calcium-dependent protein kinase 1RVS(0.994)S(0.006)AGLR
P460772481.3114-3-3-like protein GF14 phiDNLTLWTSDMQDES(1)PEEIKEAAAPKPAEEQK
P426442381.57514-3-3-like protein GF14 psiDNLTLWTSDMT(1)DEAGDEIK
Publisher’s Note: MDPI stays neutral with regard to jurisdictional claims in published maps and institutional affiliations.

