Article

Retinal Oxygenation in Inherited Diseases of the Retina

by
Cengiz Türksever
1,
Lisette T. López Torres
2,
Christophe Valmaggia
2,3,4 and
Margarita G. Todorova
2,3,4,*
1
VISTA Clinic Binningen BL, 4201 Binningen, Switzerland
2
Department of Ophthalmology, University of Basel, 4056 Basel, Switzerland
3
Department of Ophthalmology, Cantonal Hospital, 9007 St. Gallen, Switzerland
4
Department of Ophthalmology, University of Zürich, 8091 Zürich, Switzerland
*
Author to whom correspondence should be addressed.
Genes 2021, 12(2), 272; https://doi.org/10.3390/genes12020272
Submission received: 13 January 2021 / Revised: 6 February 2021 / Accepted: 7 February 2021 / Published: 14 February 2021
(This article belongs to the Special Issue Study of Inherited Retinal Diseases)

Abstract

:
(1) Background: The aim of our study was to investigate the relationship between retinal metabolic alterations (retinal vessel oximetry, RO) and structural findings (retinal vessel diameter, central retinal thickness and retinal nerve fiber layer thickness, RNFL) in patients with inherited retinal diseases (IRDs). (2) Methods: A total of 181 eyes of 92 subjects were examined: 121 eyes of 62 patients with IRDs were compared to 60 eyes of 30 healthy age-matched controls. The retinal vessel oximetry was performed with the oxygen saturation measurement tool of the Retinal Vessel Analyser (RVA; IMEDOS Systems UG, Jena, Germany). The oxygen saturation in all four major peripapillary retinal arterioles (A-SO2; %) and venules (V-SO2; %) were measured and their difference (A-V SO2; %) was calculated. Additionally, retinal vessel diameters of the corresponding arterioles (D-A; µm) and venules (D-V; µm) were determined. The peripapillary central retinal thickness and the RNFL thickness were measured using spectral domain optical coherence tomography (SD-OCT) (Carl Zeiss Meditec, Dublin, CA, USA). Moreover, we calculated the mean central retinal oxygen exposure (cO2-E; %/µm) and the mean peripapillary oxygen exposure (pO2-E; %/µm) per micron of central retinal thickness and nerve fiber layer thickness by dividing the mean central retinal thickness (CRT) and the RNFL thickness with the mean A-V SO2. (3) Results: Rod-cone dystrophy patients had the highest V-SO2 and A-SO2, the lowest A-V SO2, the narrowest D-A and D-V and the thickest RNFL, when compared not only to controls (p ≤ 0.040), but also to patients with other IRDs. Furthermore, in rod-cone dystrophies the cO2-E and the pO2-E were higher in comparison to controls and to patients with other IRDs (p ≤ 0.005). Cone-rod dystrophy patients had the lowest cO2-E compared to controls and patients with other IRDs (p ≤ 0.035). Evaluated in central zones, the cO2-E was significantly different when comparing cone-rod dystrophy (CRD) against rod-cone dystrophy (RCD) patients in all zones (p < 0.001), whereas compared with controls and patients with inherited macular dystrophy this was observed only in zones 1 and 2 (p ≤ 0.018). The oxygen exposure was also the highest in the RCD group for both the nasal and the temporal peripapillary area, among all the evaluated groups (p ≤ 0.025). (4) Conclusions: The presented metabolic-structural approach enhances our understanding of inherited photoreceptor degenerations. Clearly demonstrated through the O2-E comparisons, the central and the peripapillary retina in rod-cone dystrophy eyes consume less oxygen than the control-eyes and eyes with other IRDs. Rod-cone dystrophy eyes seem to be proportionally more exposed to oxygen, the later presumably leading to more pronounced oxidative damage-related remodeling.

1. Introduction

Inherited retinal diseases (IRDs) have been summarized in a heterogeneous group presenting progressive photoreceptor degeneration [1,2,3,4]. Although the classical phenotypes of these entities are morphologically different [3,4], in severe phenotypes they may show similar generalized rod-cone or cone-rod dysfunction as measured by full field electroretinography (ffERG) [5,6,7,8,9]. The underlying photoreceptor dysfunction has been discussed to have a significant impact on the metabolic environment and might therefore be associated with remodeling and apoptosis that occur with the progression of IRDs [10,11,12,13,14,15,16,17].
Oxygen constitutes a crucial energy release reagent, the primarily biological tissue oxidant [18]. Compared with the human brain, the retina is known to share the most extensive metabolic supply and exchange in the body [19]. Oxygenation of the human retina is a dynamic process of which the regulation is maintained by different mechanisms. For the retina, not only lower oxygen levels, but also higher oxygen levels are destructive. Thus, in order to maintain proper visual function, adequate blood supply and oxygen metabolism are necessary [16,18,19,20]. Based on published data, the inner retina is supplied mainly by the retinal arterial vessels and the superficial retinal capillaries, whereas the outer retina is supplied generally by the choroidal vessels and to lesser extent by the deep retinal capillaries [20]. Notably, although the retinal blood flow is auto-regulated, the choroidal blood flow is not auto-regulated [20]. Therefore, in the presence of the degeneration of photoreceptor, the oxygen delivery to the outer retina remains unchanged, whereas the intraretinal oxygen level continues to increase [21,22,23,24].
According to the published research on microelectrode-based measurements in animal models, under normal conditions, regional variations in the intraretinal oxygen distribution have been found. Three oxygen consumption zones, corresponding to the superficial and deep retinal capillary and choroidal beds, have been clearly identified. According to these data, the metabolic supply of rod photoreceptors is supported mainly by the choroidal vessels and additionally by the deep retinal capillaries [25,26,27]. Under dark-adapted conditions, the metabolic activity of rod photoreceptors is further supported by oxygen diffusion from the superficial retinal capillary vessels [27,28,29].
In vivo studies on animal models of outer retinal degeneration have reported a marked reduction in oxygen utilization with acceleration of rod photoreceptor degeneration [26,27]. Although less oxygen is used by the degenerative photoreceptors, the oxygen delivery to the outer retina remains unchanged and the oxygenation of the inner retina increases [27]. With the progression of degeneration and continuous loss of photoreceptors, an increased oxygen level in the retina leads to the elevation of superoxide radicals and the generation of other reactive oxygen species in the retina, resulting in an increased risk of cell apoptosis [30]. Once the cones are involved, the central vision is impaired and is lost [31]. Subsequently, changes in the oxygen environment are reported to play a role in the progression of the degenerative process and the neurovascular remodeling [21,22,23,24].
Retinal vessel oximetry (RO) is a novel in vivo method, which allows researchers to study oxygen saturation of the retinal vessels and to explore metabolic alterations of the retina [19,32,33,34,35,36,37]. Recent RO studies on adults and children affected by inherited retinal disease have shown an altered oxygen metabolism by means of a significant increase in oxygen saturation in the retinal arterioles and venules, explained as a result of reduced oxygen consumption [38,39,40]. These findings were more pronounced in patients with rod-cone dystrophy (RCD) [38,39,40]. Furthermore, the oxygen saturation values correlated well with structural and functional changes [39,41,42,43]. In addition, peripapillary retinal vessel diameters were reduced proportionally to the functional and structural changes [39,44]. As the highest amount of oxygen is used by retinal photoreceptors, a reduction in retinal oxygen demand with a subsequent increase in oxygen saturation in the retinal vessels, followed by cellular apoptosis, has been hypothesized [39,41,43,45]. Based on the evidence discussed above, the degeneration of photoreceptors with secondary neurovascular remodeling seems to be a causative factor of increased retinal vessel oxygen saturation.
Spectral domain optical coherence tomography (SD-OCT) allows a precise in vivo evaluation of retinal structural alterations. Many contradictory results have been reported in regard to the thickness of the retinal nerve fiber layer (RNFL) in patients affected by IRD [39,46,47,48,49,50]. Nevertheless, the amount of peripapillary RNFL structural changes correlates well with the metabolic alterations detected by RO in IRDs [39]. In addition, the presence of cystoid macular edema (CME) in OCT imaging, reported to occur in 10%–50% of retinitis pigmentosa patients [51,52,53,54], has been well associated with the best-corrected visual acuity [55,56] and also with the degree of metabolic alterations and foveal vascular anomalies in RCD [42,57].
In order to deeper understand the compromised metabolic function and structural alterations in patients with IRDs, we continued studying the mechanism related to the retinal oxygen saturation which impacts the retinal structural alterations in different IRDs. Although the arterio-venous difference (A-V SO2; %), known to be proportional to the oxygen saturation, has been defined as a parameter for oxygen consumption [58], and the correlation between the level of structural damage and retinal vessel oxygen saturation has been confirmed in previous studies in RCD patients [39,41,42], the oxygen exposure for a certain amount of retinal and RNFL tissue (O2-E; %/µm) has not been studied yet. A central aim of the present study was therefore to calculate the mean retinal oxygen exposure per micron of central retinal thickness (CRT; µm) and per micron of nerve fiber layer thickness by dividing the mean CRT and RNFL thickness with the mean A-V SO2.

2. Materials and Methods

This cross-sectional consecutive study was performed on 92 subjects (53♀, 39♂). A total of 60 eyes of 30 healthy subjects (21♀, 9♂; mean 46.34 ± 10.50 years) were compared with 69 eyes affected by rod-cone dystrophy (RCD, 18 ♀ 17 ♂; 43.88 ± 13.54 years), 26 eyes with cone-rod dystrophy (CRD, 8♀ and 6 ♂; 41.08 ± 13.02 years) and 26 eyes with inherited macular dystrophy (IMD, 6 ♀ 7 ♂; 54.16 ± 13.49 years). The RCD subgroup included patients with a clinical picture of retinitis pigmentosa with predominantly rod over cone dysfunction. The CRD subgroup consisted of patients suffering from CRD with predominantly cone over rod dysfunction. The IMD subgroup included patients affected by Stargardt’s disease and Best’s disease.
Our study adhered to the tenets of the Declaration of Helsinki. All subjects provided informed consent before the study. The data were collected between September 2016 and December 2017.

2.1. Subjects

Our inclusion criteria for patients with IRDs were as follows: characteristic clinical and funduscopic features of IRD [3,4], Caucasian origin and typical electrophysiological findings [5,6,7,8,9]. The inclusion criteria for controls were as follows: Caucasian origin and having best-corrected visual acuity >0.8. Exclusion criteria for patients and controls were the presence of ocular and/or systemic pathology other than IRD (for instance, diabetes mellitus, hypertension or other metabolic and neurodegenerative diseases) and RO images with inadequate quality. Neither controls, nor patients with IRDs were under topical or systemic treatment with antioxidative, capillaroprotective, anti-inflammatory or antithrombotic action, which may influence the RO imaging. We performed for all controls and patients with IRD a standard ophthalmologic examination, including best-corrected visual acuity (Snellen charts), Goldmann applanation tonometry, biomicroscopy and fundoscopy.

2.2. Retinal Vessel Imaging

Each subject received tropicamide 0.5% and phenylephrine 1% eye drops for both eyes for mydriasis. The pupils were dilated to 7.0–8.0 mm. After a minimum of 20 min, four test–retest fundus images were obtained, as described previously [36]. We followed a standard procedure for RO acquisition in our clinic. Optic disc-centered fundus images, with a 50° field, were taken for each eye using the Retinal Vessel Analyser (RVA; Imedos UG, Jena, Germany), which was connected to the fundus camera FF450 (Carl Zeiss Meditec, Jena, Germany). Images of both eyes were obtained, starting with the right eye. At least four RO images with good image quality were taken. The three-channel luminance histogram tool of the RVA (Imedos UG) was used to control RO images for optimal brightness to reduce the possible effect of pigmentation of the retina and brightness on RO. As previously described, we selected for further analyses only images with optimal illumination, red channel illumination <160 step of the scale and green channel illumination >60 step of the scale [36]. An optic disc-centered image protocol was applied, where two rings, with a radius of 1.0 and 1.5 optic disc diameters, in the peripapillary area were plotted (Figure 1). The annulus between these two rings defined the area of interest in which we performed RO and vessel diameter measurements. All main arterioles and venules within the measurement area were analyzed. The average arteriolar and venular S-O2 (A-SO2 and V-SO2, %) and mean arteriolar and venular vessel diameter (D-A and D-V, µm) were obtained by simultaneously selecting the main vessels in all four quadrants. Their difference (A-V SO2, %), known to be proportional to the oxygen saturation of the retina, was calculated as well.
We evaluated the average, the naso-temporal, as well as the central SO2 parameters (A-SO2, V-SO2 and A-V SO2), retinal vessel diameters (D-A and D-V), as well as the corresponding oxygen exposure parameters (cO2-E and pO2-E). The naso-temporal values were calculated from the values corresponding to the nasal and temporal main peripapillary vessels. The ETDRS chart for calculation of the central retinal exposure parameters in zones was plotted around the fovea.

2.3. Optical Coherence Tomography Imaging

For the evaluation of the retinal structure, we performed standard spectral domain OCT (SD-OCT) using Cirrus OCT (Carl Zeiss Meditec, Dublin, CA, USA). The OCT images were taken by implementing a macular thickness protocol (Macular Cube 512 × 128, Figure 1 and Figure 2) and a high-definition image-protocol (HD 5 Line Raster). The software of the Cirrus OCT provided a macular thickness map divided into nine subfields. For statistical analyses, the data were averaged, based on the anatomical and physiological structure of the central retina. We computed the mean macular thickness (µm) into three areas, as follows: zone 1 at 3°; zone 2 between 3° and 8°, and zone 3 between 8° and 15° (Figure 1 and Figure 2).
To evaluate the RNFL thickness, we performed an image protocol with a series of 12 scans, 6-mm optic nerve head-cantered raster, each on the Cirrus OCT (Carl Zeiss Meditec, Dublin, CA, USA). The average RNFL thickness (µm) was calculated automatically.
In addition, we calculated the mean retinal oxygen exposure (cO2-E; %/µm) and the mean peripapillary oxygen exposure (pO2-E; %/µm) per micron of central retinal thickness and per micron of nerve fiber layer thickness, by dividing the mean A-V SO2 by the mean CRT and by the mean RNFL thickness, respectively. The oxygen exposure in the central retina was assessed thereafter in zones, as follows: zone 1 (z1O2-E; %/µm); zone 2 (z2O2-C; %/µm), and zone 3 (z3O2-C; %/µm).

Statistical Procedures

For statistical analysis we used the IBM SPSS Statistics software, version 21 (International Business Machines Corp., Armonk, NY, USA). Mixed effects models are suitable for repeated measurements data. A linear mixed-effects model was performed for each pair of the tested methods, in which one parameter of the tested pair was a dependent variable. Results are presented as adjusted means and standard deviations for controls and the corresponding mean difference in patients’ subgroups with the respective p-values.
In the present study, ‘subject’ was taken as a random factor, and the ‘group’, ‘age’, ‘gender’, ‘location’ and the ‘eye’ were taken as fixed factors. The study groups were treated as covariates. The mean SO2 parameters (A-SO2, V-SO2, their difference: A-V SO2), oxygen exposure (O2-E), as well as the mean of the vessel diameter measurements (D-A and D-V) and the RNFL and macular thickness were taken as independent variables.
Our results are presented as p-values with corresponding regression coefficients. Statistical significance was defined as p < 0.05.

3. Results

In total, 181 eyes of 92 subjects were enrolled in the study: 69 eyes of 35 patients diagnosed with rod-cone dystrophy (RCD), 26 eyes of 13 patients with cone-rod dystrophy (CRD) and 26 eyes of 13 patients with inherited macular dystrophy (IMD) were compared to 60 eyes of 30 age-matched controls. All demographic characteristics of our participants are summarized in Table 1.

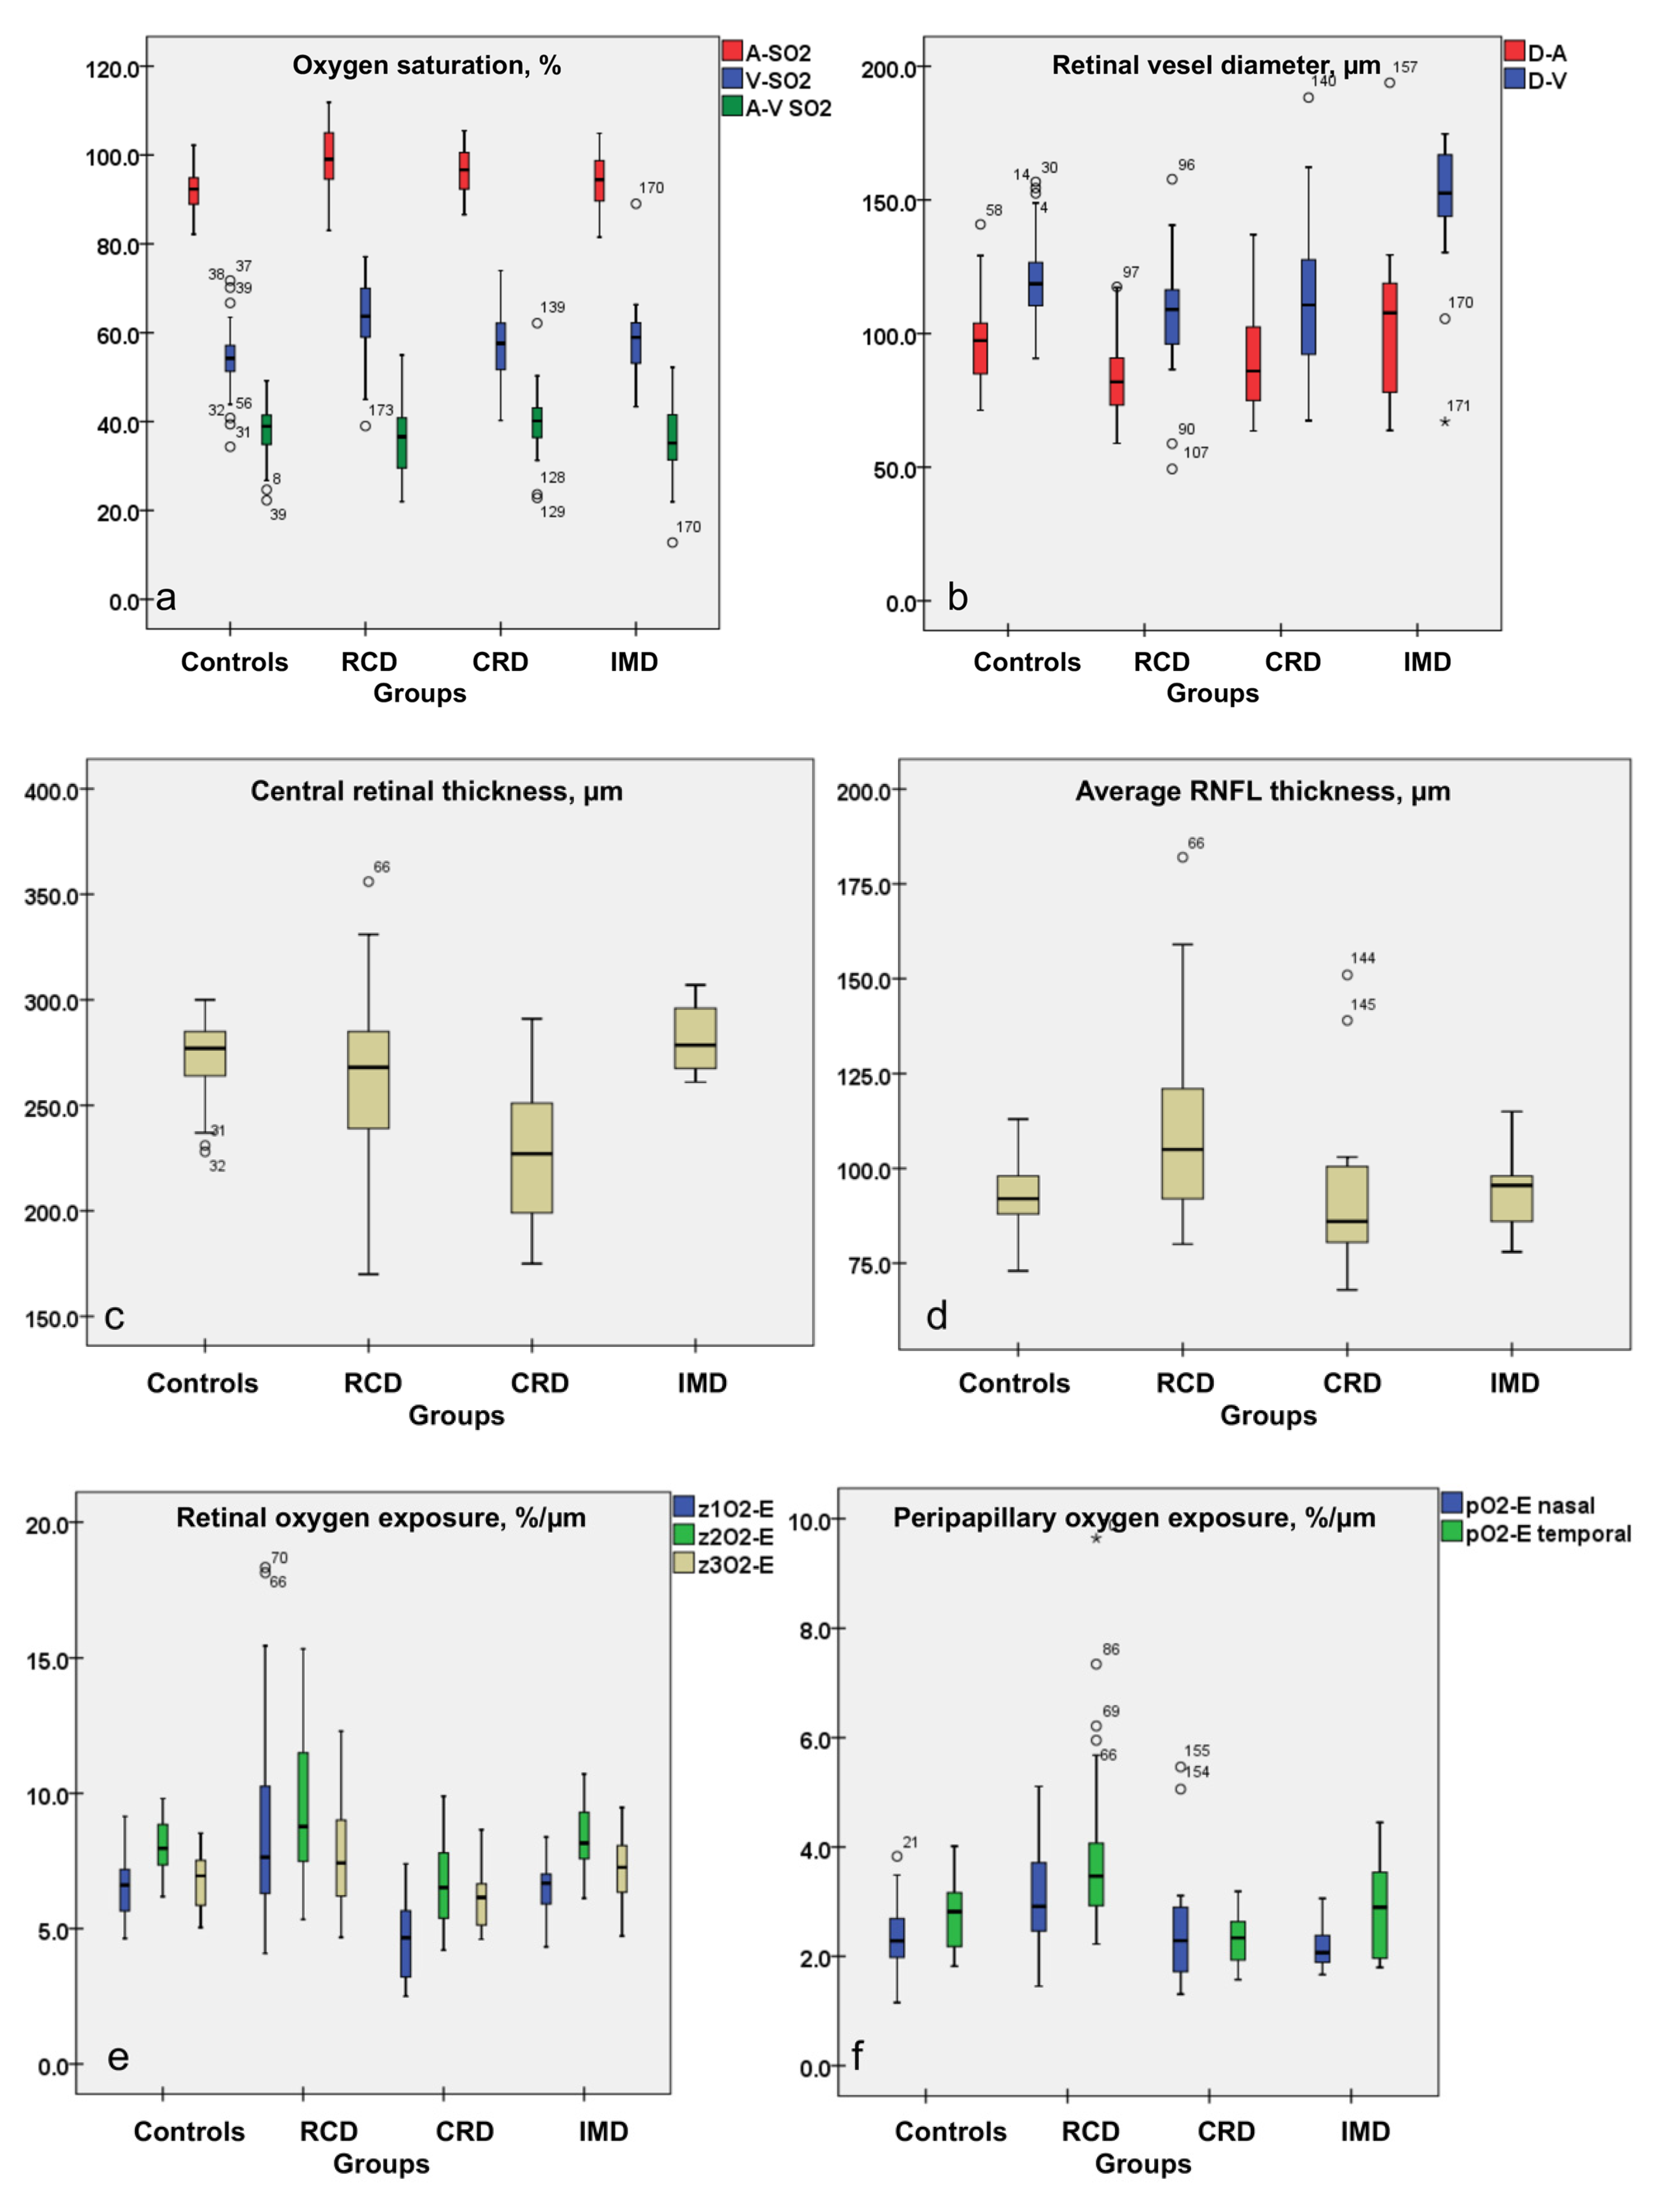
3.1. Increased A-SO2, V-SO2, O2-C and Decreased A-V SO2 Values in RCD Patients

In general, patients with RCD had higher average A-SO2 and V-SO2 and lower A-V SO2 values when compared to controls (p ≤ 0.04, ANOVA based on mixed-effect models; Figure 3a). For instance, in controls, the average A-SO2 and V-SO2 were measured at 92.08% and at 53.94%, respectively, and the corresponding average A-V SO2 at 38.21%. In RCD patients, the averaged retinal A-SO2 and V-SO2 showed a significantly increased difference (7.03% and 9.60%) when compared to controls, whereas the A-V SO2 decreased significantly by 2.98% (Table 2). The CRD group also revealed increased average A-SO2 values, and the IMD group presented increased average V-SO2 values compared to controls (p ≤ 0.012), but these were still not as high as those in the RCD group (Table 2, Figure 3a).
The box plots in Figure 3 represent the interquartile range; the short horizontal bold line depicts the median. In each graph the groups as labelled on the x-axis (from left to right: controls, rod-cone dystrophy (RCD), cone-rod dystrophy (CRD), inherited macular dystrophy (IMD)) and the evaluated parameters—on the y-axis.

3.2. Attenuated Retinal Vessel Diameters in RCD Patients

In general, the average peripapillary retinal vessel diameters, both the D-A and D-V, were significantly narrower in the RCD patients than in controls and in patients with IMD (p ≤ 0.001; Table 2, Figure 3b). Noticeably, the CRD group also showed narrower average peripapillary vessel diameters when compared to the IMD group (p ≤ 0.004), but not when compared to controls or RCD patients (Table 2, Figure 3b).

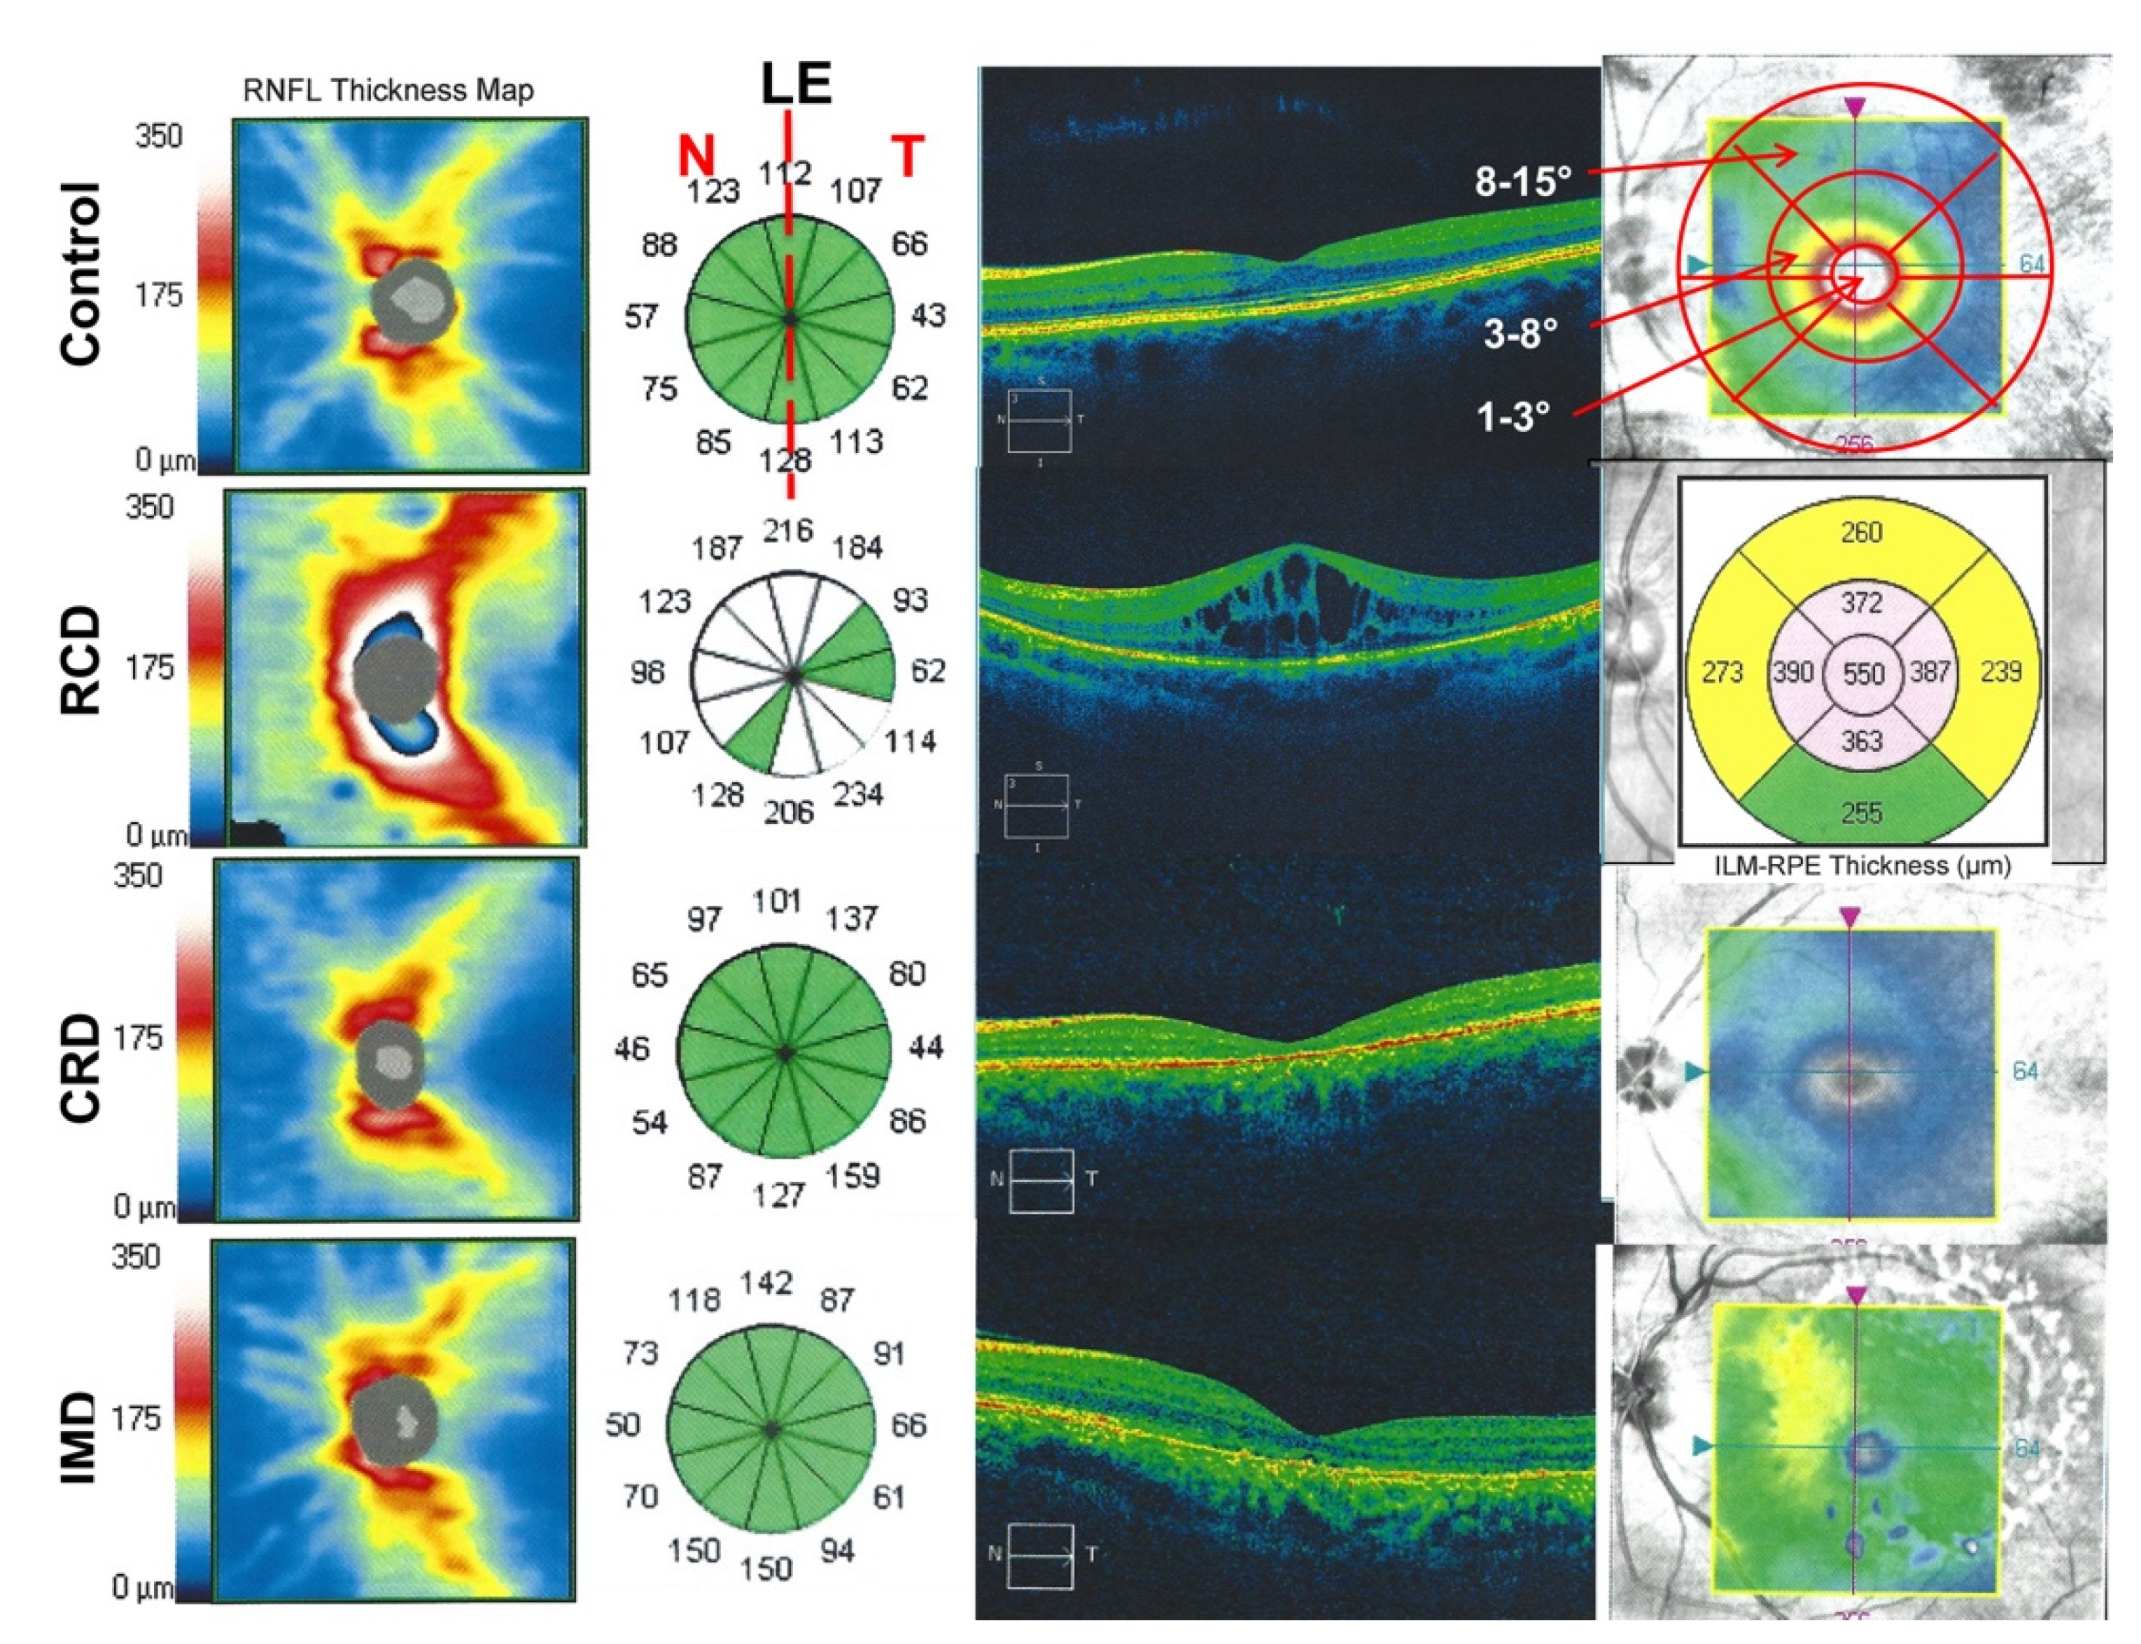
3.3. Peripapillary Retinal Nerve Fiber Layer Thickness Results: Thickest Peripapillary RNFL in RCD Patients

RCD patients have significantly greater average peripapillary RNFL thickness than controls and patients with other IRDs (p ≤ 0.001; Table 2, Figure 3d). In the temporal part of the RNFL this difference was more pronounced (p ≤ 0.001; Table 3, Figure 3f). Patients with IRDs other than RCD did not differ from controls in this respect.

3.4. Central Retinal Thickness in RCD

The OCT of the central retina imaging, consistent with previous studies on patients with IRDs [51,52,53,54,56,59], confirmed the loss of photoreceptors (IS/OS line integrity), distortions of the retinal microstructure and the presence of intra-retinal cystic spaces.
Within the entire IRD group only subjects with CRD differed from controls by means of significantly thinner central retina thickness with a mean difference from controls of 42.68 µm (p < 0.01; Table 2, Figure 3c). The mean CRT of CRD was significantly thinner in all zones, when evaluated in comparison to controls and patients with other IRDs (p ≤ 0.001) but to RCD only in zone 1 and zone 2 (p < 0.001; Table 4, Figure 3c).
The mean CRT of RCD did not differ significantly from controls (p = 0.227), probably due to the presence of intra-retinal cysts. However, evaluated in zones, the retinal thickness within zone 3 was significantly thinner than in controls (p = 0.043; Table 4).

3.5. Oxygen Exposure of the Retina in Patients with IRDs

Since the oxygen saturation, vessel diameters and central retinal and peripapillary structures are all affected in IRDs and to a greater extent in patients with RCD, we calculated the mean central retinal oxygen exposure (cO2-E; %/µm) and the mean peripapillary oxygen exposure (pO2-E; %/µm) per micron of central retinal thickness and per micron of RNFL thickness, by dividing the mean A-V SO2 with the mean CRT and respectively with the mean RNFL thickness.
In patients with RCD, the average central and peripapillary oxygen exposures (cO2-E and pO2-E) were significantly higher than those in controls, and were also higher than those in patients with other IRDs (p ≤ 0.005; Table 3 and Table 4). The oxygen exposure was also the highest in the RCD group for both the nasal and the temporal peripapillary area, among all the evaluated groups (p ≤ 0.025; Table 3). In addition, compared to the controls, for whom the peripapillary naso-temporal comparison showed significantly higher increased pO2-E values in the temporal area, this parameter did not reach statistically significant values in the RCD patients.
Cone-rod dystrophy patients had the lowest cO2-E compared to controls and patients with other IRDs (p ≤ 0.035; Table 2, Figure 3e). Evaluated in central zones, the cO2-E was significantly different comparing cone-rod dystrophy patients to rod-cone dystrophy patients in all zones (p < 0.001), whereas against controls and patients with inherited macular dystrophy only in zones 1 and 2 (p ≤ 0.018; Table 4, Figure 3e).
Patients with IMD did not differ from controls in these parameters.

4. Discussion

Alterations in the retinal structure and oxygen metabolism have been reported in patients with inherited retinal disease (IRD) and are mainly considered to be a consequence of metabolic and structural changes [38,39,46,47,54,60,61].
Deducting a structural–metabolic approach by evaluating patients with inherited retinal disease in comparison to controls, apart from studying retinal structure and oxygenation, we additionally evaluated the effect of retinal oxygen exposure for certain retinal- and RNFL tissues (O2-E). In order to do this, we calculated the mean retinal oxygen exposure per micron of central retinal thickness and per micron of nerve fiber layer thickness, O2-C (%/µm) by dividing the mean CRT and RNFL thickness with the mean A-V SO2.

4.1. Altered Structural and Metabolic Function in IRDs

Consistent with the results of the studies published to date [39,41,43], we reconfirmed increased A-SO2 and even more an increased V-SO2, with a corresponding decrease in the A-V SO2 values within the RCD group. A novel finding in the present study is that RCD patients also indicated significantly increased oxygen exposure when compared to controls and patients with other IRDs.
As rods are discussed to be much more oxygen demanding, their primary affliction would explain the more altered metabolic function when compared to other patients with IRD. This means that, following rod-cone dystrophy, due to the marked reduction in oxygen consumption under the continuing oxygen supply, more oxygen would be delivered to the inner retina, where the retinal oxygen saturation is measured. Increased intra-retinal levels of oxygen leads in turn to elevation of superoxide radicals and the generation of other reactive oxygen species in the retina, which increases the risk of cell apoptosis. The latter is clearly demonstrated in the presented data with much attenuated retinal vessels in the rod-cone dystrophy patients, and also with thickening of otherwise distorted central and peripapillary retina, consistent with the neurovascular remodeling that occurs with degeneration [21,22,23,24]. Here, increased oxygen flux due to the lack of the choroidal autoregulation [20] seems to have a significant impact on increased mean oxygen exposure in RCD patients, as confirmed now in our study.
The present study also revealed significantly altered central and peripapillary retinal structures that correspond to disturbed oxygenation, with the RCD group found to be the most affected among IRD patients.

4.2. Altered Central Structure and Metabolic Function in IRDs

The OCT imaging of the central retina, consistent with previous studies on patients with IRD [55,56,59], confirmed the loss of photoreceptors with IS/OS line integrity, distortions of the retinal microstructure and/or macular edema. Although the central retinal thickness in RCD patients did not differ from that of controls (p = 0.227), it was significantly thinner in CRD. The later held true when compared to controls and also to patients with other inherited retinal dystrophies (p < 0.001).
A novel finding in the present study is the significantly increased central oxygen exposure in our RCD group when compared to controls and patients with other IRDs (p ≤ 0.005). Interestingly, even if the central retinal thickness in RCD patients was within the normal range (p = 0.227), the oxygen exposure was significantly increased. This finding was more pronounced in zone 1 (up to 3°) and zone 2 (3°–8°), when patients with other IRDs were considered.
Many studies have already reported on structural and functional alterations within the RCD group in the macular area. Outside zone 2 (3°–8°), a study by Konieczka et al. found a reduction in mfERG responses corresponding to the reduction in the central retinal layer thickness [56]. Funatsu et al. [62] reported in RCD patients reduced central retinal sensitivity measured by microperimetry corresponding to reduced outer retinal thickness at 6°–8°. Several studies on fundus autofluorescense imaging in RCD patients have paid attention to increased annular hyperautofluorescence in the parafoveolar area (within 3.0° to 10.5°), which is supposed to indicate a metabolic abnormality [63,64]. Considerably, the progression of the hyperautofluorescence ring constriction has been found to correlate strongly with retinal eccentricity. More precisely, the mean outer ring (within 3.0° to 10.5°) has shown significantly rapid radius reduction per year, compared to the mean inner ring (0.2°–3.0°) [64]. The authors suggested that the rod system dysfunction in RCD patients may lead to a consequent cone dysfunction and thus to progressive visual field constriction and central vision impairment. In agreement with this, studies using adaptive optics scanning laser en-face images in RCD patients have shown reduced cone photoreceptor density and a strong correlation with retinal eccentricity [59,65]. Since using antioxidants in RCD models supposedly decreases the oxidative damage and prevents the death of cone photoreceptors, it is inferred that oxidative damage is a major contributor to cone photoreceptor apoptosis [66].
In agreement with the results of the studies stated above, in our RCD patients a significant oxygen exposure at the region corresponding to zone 2 was found. We suppose that as part of the tissue apoptosis, increased oxygen exposure occurs, with a consequent increase in the oxidative stress of rod photoreceptors on the border the retina, which is severely affected by remodeling. These results seem to have a significant impact on abnormal autofluorescence, reduced sensitivity in microperimetry and mfERG measurement, as well as on distortions of retinal microstructure in the central retina.
Contrarily, in our CRD patients, opposite to the controls and other IRD patients, the CRT was significantly reduced (p < 0.001), as well as the oxygen exposure (p ≤ 0.035). In accordance with the published studies, the cone density is higher in the central retina [67,68,69]. It is, however, also known that rods are more oxygen-demanding than cones [27,28,29]. Therefore, in the presence of cone-rod dystrophy, where cone photoreceptors are primarily affected and rod photoreceptors remain intact for a long period, an oxygen influx from choroidea into the retina is expected to remain unchanged, explaining our results.

4.3. Altered Peripapillary Metabolic Function in IRDs

Peripapillary RNFL thickness in RCD patients has gained attention in many studies and has been discussed as related to the neurovascular remodeling [39,46,47,48,49,50]. In our patient group, the RNFL was significantly thicker in the RCD group when compared to controls and to patients with other IRDs. Interestingly, in the temporal part of the RNFL this difference was more pronounced. Furthermore, in the peripapillary temporal retina, oxygen use as determined by the A-V SO2 parameter was significantly reduced compared to controls and cone-rod dystrophies (p ≤ 0.019). In the comparison with IMDs, this parameter was significantly altered only in the nasal RNFL (p = 0.004). The oxygen exposure was, however, the highest in the RCD group for both the nasal and the temporal peripapillary area, among all the evaluated groups. However, compared to controls, for whom the peripapillary naso-temporal difference showed significantly increased oxygen exposure values in the temporal area, the RCD patients did not reach statistically significant values in this parameter. A possible explanation for these results could be as follows.
According to the topographic mapping in controls, more rod photoreceptors would be observed in the temporal retina, whereas more cone photoreceptors would be observed in the nasal retina [69]. This finding has already been discussed as related to the increased intensity of the cellular metabolism in the macula in controls [70]. Thus, although the capillary-free zone close to the macula is supposed to have higher extracellular oxygen diffusion, the higher density of photoreceptors and ganglion cells in the macula yields to higher oxygen extraction in the temporal peripapillary retina. This would explain the higher oxygen exposure values in the temporal peripapillary area in controls, which we were able to document.
A novel finding in the present study is the loss of peripapillary naso-temporal difference in oxygen exposure values within the RCD group. Compared to controls and CRDs, this naso-temporal difference in the RCD group was not present. This finding could be explained by the more rapid and progressive degeneration measured in RCD in the temporal part of the retina, with a consecutively more increased choroidal flux, and correspondingly increased oxygen exposure, as confirmed now in the present study. Contrarily, any possible reduction in the peripapillary naso-temporal oxygen exposure difference in RCD may serve as a predictor for the progression of RCD once the cones, which are denser in the macula, are affected.
In eyes with cone-rod dystrophy, based on the underlined primary degeneration of cones and according to the topographic mapping of the cone density in controls, the oxygen exposure map would be presented differently. Here, due to the primary affliction of cone photoreceptors, and thus greater effects on the nasal retina, the oxygen exposure may increase in the peripapillary nasal retina, diminishing the naso-temporal difference compared to controls and patients with RCD. Furthermore, taking the generalized cone photoreceptor degeneration in patients with CRD into account, less oxygen influx from the choroidea in to the retina may be measured, resulting in less affected oxygen exposure in CRDs. The latter would explain why the RNFL thickness, as well as the diameters of the peripapillary vessels, remain stable for a longer period. This explanation may serve also to indicate that changes in cone photoreceptors’ oxygen metabolism are limited, as clearly demonstrated with less pronounced tissue remodeling.
Our study has, however, some limitations that include among others the genetic heterogeneity, different clinical stages of our IRD patients and the small sample size in the IMD subgroup. in addition, possible interactions between retinal blood flow, oxygen delivery, oxygen consumption, as well as changes in choroidal contribution should have been taken into consideration for the interpretation of oxygen extraction. Therefore, further studies are needed to evaluate to what extent the altered retinal and choroidal perfusion in IRD patients may contribute to the measured metabolic dysfunction.

5. Conclusions

Clearly demonstrated through the applied metabolic–structural approach, we were able to differentiate RCD patients not only from controls, but also from patients with other IRDs.
With the adopted pO2-E/cO2-E model, the oxidative stress in the retina may be accessed in vivo and be used as a metabolic parameter in understanding inherited retinal diseases. Furthermore, these parameters of mean oxygen exposure in relation to the amount of central retinal thickness and retinal nerve fiber layer thickness may serve as a biomarker in evaluating the progression rate of the degeneration, as well as the effect of future therapies.

Author Contributions

Conceptualization, C.T. and M.G.T.; methodology, C.T. and M.G.T.; formal analysis, M.G.T. and C.T.; investigation, L.T.L.T. and C.T.; resources, M.G.T. and C.V.; data curation, C.T. and M.G.T.; writing—original draft preparation, C.T. and M.G.T.; writing—review and editing, L.T.L.T.; visualization, C.V.; supervision, M.G.T.; project administration, C.V.; funding acquisition, M.G.T. All authors have read and agreed to the published version of the manuscript.

Funding

This research received no external funding.

Institutional Review Board Statement

The study was conducted according to the guidelines of the Declaration of Helsinki, and approved by the Institutional Review Board (or Ethics Committee) of Ethikkommission Nordwest- und Zentralschweiz, Switzerland (protocol code EKNZ BASEC 2016-01054, 06.09.2016).

Informed Consent Statement

Informed consent was obtained from all subjects involved in the study.

Data Availability Statement

Data Access and Responsibility: Margarita Todorova has full access to all the data in the study and hold complete responsibility for the data integrity and the accuracy of the analysis.

Acknowledgments

Margarita G. Todorova was partially supported by unrestricted grant by OPOS (Stiftung Ostschweizerische Pleoptik- und Orthoptik- Schule).

Conflicts of Interest

The authors declare no conflict of interest.

References

  1. Ammann, F.; Klein, D.; Franceschetti, A. Genetic and epidemiological investigations on pigmentary degeneration of the retina and allied disorders in Switzerland. J. Neurol. Sci. 1965, 2, 183–196. [Google Scholar] [CrossRef]
  2. Michaelides, M.; Hunt, D.M.; Moore, A.T. The genetics of inherited macular dystrophies. J. Med. Genet. 2003, 40, 641–650. [Google Scholar] [CrossRef]
  3. Hamel, C. Retinitis pigmentosa. Orphanet J. Rare Dis. 2006, 11, 40. [Google Scholar] [CrossRef] [PubMed]
  4. Hamel, C. Cone rod dystrophies. Orphanet J. Rare Dis. 2007, 1, 7. [Google Scholar] [CrossRef] [Green Version]
  5. Fishman, G. Electrophysiology and inherited retinal disorders. Doc. Ophthalmol. 1985, 60, 107–119. [Google Scholar] [CrossRef]
  6. Gouras, P.; Carr, R.E. Electrophysiological studies in early retinitis pigmentosa. Arch. Ophthalmol. 1964, 72, 104–110. [Google Scholar]
  7. Birch, D.G.; Sandberg, M.A. Dependence of cone b-wave implicit time on rod amplitude in retinitis pigmentosa. Vision Res. 1987, 27, 1105–1112. [Google Scholar] [CrossRef]
  8. Sandberg, M.A.; Weigel-DiFranco, C.; Rosner, B.; Berson, E.L. The relationship between visual field size and electroretinogram amplitude in retinitis pigmentosa. Invest. Ophthalmol. Vis. Sci. 1996, 37, 1693–1698. [Google Scholar]
  9. Tzekov, R.T.; Locke, K.G.; Hood, D.C.; Birch, D.G. Cone and rod ERG phototransduction parameters in retinitis pigmentosa. Invest. Ophthalmol. Vis. Sci. 2003, 44, 3993–4000. [Google Scholar] [CrossRef] [Green Version]
  10. Milam, A.H.; Li, Z.Y.; Fariss, R.N. Histopathology of the human retina in retinitis pigmentosa. Prog. Retin. Eye Res. 1998, 17, 175–205. [Google Scholar]
  11. Marc, R.E.; Jones, B.W. Retinal remodeling in inherited photoreceptor degenerations. Mol. Neurobiol. 2003, 28, 139–147. [Google Scholar] [CrossRef]
  12. Marc, R.E.; Jones, B.W.; Watt, C.B.; Strettoi, E. Neural remodeling in retinal degeneration. Prog. Retin. Eye Res. 2003, 22, 607–655. [Google Scholar] [CrossRef]
  13. Jones, B.W.; Pfeiffer, R.L.; Ferrell, W.D.; Watt, C.B.; Marmor, M.; Marc, R.E. Retinal remodeling in human retinitis pigmentosa. Exp. Eye Res. 2016, 150, 149–165. [Google Scholar] [CrossRef] [PubMed] [Green Version]
  14. Jones, B.W.; Watt, C.B.; Frederick, J.M.; Baehr, W.; Chen, C.K.; Levine, E.M.; Milam, A.H.; Lavail, M.M.; Marc, R.E. Retinal remodeling triggered by photoreceptor degenerations. J. Comp. Neurol. 2003, 464, 1–16. [Google Scholar] [CrossRef]
  15. Sancho-Pelluz, J.; Arango-Gonzalez, B.; Kustermann, S.; Romero, F.J.; van Veen, T.; Zrenner, E.; Ekström, P.; Paquet-Durand, F. Photoreceptor cell death mechanisms in inherited retinal degeneration. Mol. Neurobiol. 2008, 38, 253–269. [Google Scholar] [CrossRef]
  16. Cottet, S.; Schorderet, D.F. Mechanisms of apoptosis in retinitis pigmentosa. Curr. Mol. Med. 2009, 9, 375–383. [Google Scholar] [CrossRef]
  17. Panfoli, I.; Calzia, D.; Ravera, S.; Morelli, A.M.; Traverso, C.E. Extra-mitochondrial aerobic metabolism in retinal rod outer segments: New perspectives in retinopathies. Med. Hypotheses. 2012, 78, 423–427. [Google Scholar] [CrossRef]
  18. Vanderkooi, J.M.; Erecińska, M.; Silver, I.A. Oxygen in mammalian tissue: Methods of measurement and affinities of various reactions. Am. J. Physiol. 1991, 260, C1131–C1150. [Google Scholar] [CrossRef]
  19. Stefánsson, E.; Olafsdottir, O.B.; Eliasdottir, T.S.; Vehmeijer, W.; Einarsdottir, A.B.; Bek, T.; Torp, T.L.; Grauslund, J.; Eysteinsson, T.; Karlsson, R.A.; et al. Retinal oximetry: Metabolic imaging for diseases of the retina and brain. Prog. Retin. Eye Res. 2019, 70, 1–22. [Google Scholar] [CrossRef]
  20. Bill, A.; Sperber, G. Control of retinal and choroidal blood flow. Eye (Lond) 1990, 4, 319–325. [Google Scholar] [CrossRef]
  21. Yu, D.Y.; Cringle, C.S.; Su, E.N.; Yu, P.K. Intraretinal oxygen levels before and after photoreceptor loss in the RCS rat. Invest. Ophthalmol. Vis. Sci. 2000, 41, 3999–4006. [Google Scholar] [PubMed]
  22. Yu, D.Y.; Cringle, C.S.; Valter, K.; Walsh, N.; Lee, D.; Stone, J. Photoreceptor death, trophic factor expression, retinal oxygen status, and photoreceptor function in the P23H rat. Invest. Ophthalmol. Vis. Sci. 2004, 45, 2013–2019. [Google Scholar] [CrossRef]
  23. Yu, D.Y.; Cringle, C.S. Retinal degeneration and local oxygen metabolism. Exp. Eye Res. 2005, 80, 745–751. [Google Scholar] [CrossRef]
  24. Padnick-Silver, L.; Kang Derwelt, J.; Giuliano, E.; Narfström, K.; Linsenmeier, R.A. Retinal oxygenation and oxygen metabolism in Abyssinian cats with a hereditary retinal degeneration. Invest. Ophthalmol. Vis. Sci. 2006, 47, 3683–3689. [Google Scholar] [CrossRef] [PubMed]
  25. Haugh, L.M.; Linsenmeier, R.A.; Goldstick, T.K. Mathematical models of the spatial distribution of retinal oxygen tension and consumption, including changes upon illumination. Ann. Biomed Eng. 1990, 18, 19–36. [Google Scholar] [CrossRef]
  26. Cringle, S.J.; Yu, D. A multi-layer model of retinal oxygen supply and consumption helps explain the muted rise in inner retinal PO(2) during systemic hyperoxia. Comp. Biochem. Physiol. A Mol. Integr. Physiol. 2002, 132, 61–66. [Google Scholar] [CrossRef]
  27. Cringle, S.J.; Yu, D.; Yu, P.K.; Su, E.N. Intraretinal oxygen consumption in the rat in vivo. Invest. Ophthalmol. Vis. Sci. 2002, 43, 1922–1927. [Google Scholar]
  28. Stefánsson, E.; Wolbarsht, M.L.; Landers, M.B. In vivo O2 consumption in rhesus monkeys in light and dark. Exp. Eye Res. 1983, 37, 251–256. [Google Scholar] [CrossRef]
  29. Linsenmeier, R. Effects of light and darkness on oxygen distribution and consumption in the cat retina. J. Gen. Physiol. 1986, 88, 521–542. [Google Scholar] [CrossRef] [Green Version]
  30. Usui, S.; Brian, C.O.; Lee, S.Y.; Jo, Y.J.; Yoshida, T.; Akiko, M.; Katsuaki, M.; Iwase, T.; Lu, L.; Campochiaro, P.A. NADPH oxidase plays a central role in cone cell death in retinitis pigmentosa. J. Neurochem. 2009, 110, 1028–1037. [Google Scholar] [CrossRef] [PubMed] [Green Version]
  31. Shen, J.; Yang, X.; Dong, A.; Petters, R.M.; Peng, Y.W.; Wong, F.; Campochiaro, P.A. Oxidative damage is a potential cause of cone cell death in retinitis pigmentosa. J. Cell Physiol. 2005, 203, 457–464. [Google Scholar] [CrossRef] [PubMed]
  32. Schweitzer, D.; Thamm, E.; Hammer, M.; Kraft, J. A new method for the measurement of oxygen saturation at the human ocular fundus. Int. Ophthalmol. 2001, 23, 347–353. [Google Scholar] [PubMed]
  33. Hammer, M.; Thamm, E.; Schweitzer, D. A simple algorithm for in vivo ocular fundus oximetry compensating for non-haemoglobin absorption and scattering. Phys. Med. Biol. 2002, 47, 233–238. [Google Scholar] [CrossRef] [PubMed] [Green Version]
  34. Hardarson, S. Retinal oximetry. Acta Ophthalmol. 2013, 91, 1–47. [Google Scholar] [CrossRef]
  35. Geirsdottir, A.; Palsson, O.; Hardarson, S.H.; Olafsdottir, O.B.; Kristjansdottir, J.V.; Stefánsson, E. Retinal vessel oxygen saturation in healthy individuals. Invest. Ophthalmol. Vis. Sci. 2012, 13, 5433–5442. [Google Scholar] [CrossRef] [Green Version]
  36. Türksever, C.; Orgül, S.; Todorova, M.G. Reproducibility of retinal oximetry measurements in healthy and diseased retinas. Acta Ophthalmol. 2015, 93, e439–e445. [Google Scholar] [CrossRef]
  37. Türksever, C.; Valmaggia, C.; Orguel, S.; Schorderet, D.F.; Todorova, M.G. Retinal vessel oxygen saturation in retinitis pigmentosa patients. Acta Ophthalmol. 2013, 91, eTO23. [Google Scholar] [CrossRef]
  38. Todorova, M.G.; Türksever, C.; Schorderet, D.F.; Valmaggia, C. Retinal vessel Oxygen Saturation in patients suffering from inherited diseases of the retina. Klin. Monbl. Augenheilkd. 2014, 231, 447–452. [Google Scholar]
  39. Bojinova, R.I.; Türksever, C.; Schötzau, A.; Valmaggia, C.; Schorderet, D.F.; Todorova, M.G. Reduced metabolic function and structural alterations in inherited retinal dystrophies: Investigating the effect of peripapillary vessel oxygen saturation and vascular diameter on the retinal nerve fibre layer thickness. Acta Ophthalmol. 2017, 95, 252–261. [Google Scholar] [CrossRef]
  40. Della-Volpe, W.M.; Scholl, H.P.N.; Valmaggia, C.; Todorova, M.G. Retinal vessel oximetry in children with inherited retinal diseases. Acta Ophthalmol. 2020. Epub ahead of print. [Google Scholar] [CrossRef] [PubMed]
  41. Türksever, C.; Valmaggia, C.; Orgül, S.; Schorderet, D.F.; Flammer, J.; Todorova, M.G. Retinal vessel oxygen saturation and its correlation with structural changes in retinitis pigmentosa. Acta Ophthalmol. 2014, 92, 454–460. [Google Scholar] [CrossRef] [PubMed]
  42. Bojinova, R.I.; Schorderet, D.F.; Valmaggia, C.; Türksever, C.; Schoetzau, A.; Todorova, M.G. Higher retinal vessel oxygen saturation: Investigating its relationship with macular oedema in retinitis pigmentosa patients. Eye (Lond) 2018, 32, 1209–1219. [Google Scholar] [CrossRef] [Green Version]
  43. Todorova, M.G.; Türksever, C.; Schötzau, A.; Schorderet, D.F.; Valmaggia, C. Metabolic and functional changes in retinitis pigmentosa: Comparing retinal vessel oximetry to full-field electroretinography, electrooculogram and multifocal electroretinography. Acta Ophthalmol. 2016, 94, e231–e241. [Google Scholar] [CrossRef]
  44. Lopez-Torres, L.T.; Türksever, C.; Schötzau, A.; Orgül, S.; Todorova, M.G. Peripapillary retinal vessel diameter correlates with mfERG alterations in retinitis pigmentosa. Acta Ophthalmol. 2015, 93, e527–e533. [Google Scholar] [CrossRef]
  45. Waizel, M.; Türksever, C.; Todorova, M.G. The effect of autoimmune retinopathy on retinal vessel oxygen saturation. Eye (Lond) 2018, 32, 1455–1462. [Google Scholar] [CrossRef] [Green Version]
  46. Walia, S.; Fishman, G.A.; Edward, D.P.; Lindeman, M. Retinal nerve fiber layer defects in RP patients. Invest. Ophthalmol. Vis. Sci. 2007, 48, 4748–4752. [Google Scholar] [CrossRef]
  47. Walia, S.; Fishman, G.A. Retinal nerve fiber layer analysis in RP patients using Fourier-domain OCT. Invest. Ophthalmol. Vis. Sci. 2008, 49, 3525–3528. [Google Scholar] [CrossRef]
  48. Hood, D.C.; Lin, C.E.; Lazow, M.A.; Locke, K.G.; Zhang, X.; Birch, D.G. Thickness of receptor and post-receptor retinal layers in patients with retinitis pigmentosa measured with frequency-domain optical coherence tomography. Invest. Ophthalmol. Vis. Sci. 2009, 50, 2328–2336. [Google Scholar]
  49. Anastasakis, A.; Genead, M.A.; McAnany, J.J.; Fishman, G.A. Evaluation of retinal nerve fiber layer thickness in patients with retinitis pigmentosa using spectral-domain optical coherence tomography. Retina 2012, 32, 358–363. [Google Scholar] [CrossRef]
  50. Xue, K.; Wang, M.; Chen, J.; Huang, X.; Xu, G. Retinal nerve fiber layer analysis with scanning laser polarimetry and RTVue-OCT in patients of retinitis pigmentosa. Ophthalmologica 2013, 229, 38–42. [Google Scholar] [CrossRef]
  51. Hajali, M.; Fishman, G.A.; Anderson, R.J. The prevalence of cystoid macular oedema in retinitis pigmentosa patients determined by optical coherence tomography. Br. J. Ophthalmol. 2008, 92, 1065–1068. [Google Scholar]
  52. Testa, F.; Rossi, S.; Colucci, R.; Gallo, B.; Di Iorio, V.; della Corte, M.; Azzolini, C.; Melillo, P.; Simonelli, F. Macular abnormalities in Italian patients with retinitis pigmentosa. Br. J. Ophthalmol. 2014, 98, 946–950. [Google Scholar] [CrossRef] [Green Version]
  53. Adackapara, C.A.; Sunness, J.S.; Dibernardo, C.W.; Melia, B.M.; Dagnelie, G. Prevalence of cystoid macular edema and stability in oct retinal thickness in eyes with retinitis pigmentosa during a 48-week lutein trial. Retina 2008, 28, 103–110. [Google Scholar] [CrossRef]
  54. Hood, D.C.; Lazow, M.A.; Locke, K.G.; Greenstein, V.C.; Birch, D.G. The transition zone between healthy and diseased retina in patients with retinitis pigmentosa. Invest. Ophthalmol. Vis. Sci. 2011, 52, 101–108. [Google Scholar] [CrossRef] [PubMed] [Green Version]
  55. Sandberg, M.A.; Brockhurst, R.J.; Gaudio, A.R.; Berson, E.L. The association between visual acuity and central retinal thickness in retinitis pigmentosa. Invest. Ophthalmol. Vis. Sci. 2005, 46, 3349–3354. [Google Scholar] [CrossRef] [Green Version]
  56. Konieczka, K.; Bojinova, R.J.; Valmaggia, C.; Schorderet, D.F.; Todorova, M.G. Preserved functional and structural integrity of the papillomacular area correlates with better visual acuity in retinitis pigmentosa. Eye (Lond) 2016, 30, 1310–1323. [Google Scholar] [CrossRef] [PubMed]
  57. Todorova, M.G.; Scholl, H.P.N.; Della Volpe-Waizel, M. The impact of macular edema on microvascular and metabolic alterations in retinitis pigmentosa. Graefes. Arch. Clin. Exp. Ophthalmol. 2020. [Google Scholar] [CrossRef]
  58. Sutherland, F.S.; Stefansson, E.; Hatchell, D.L.; Reiser, H. Retinal oxygen consumption in vitro. The effect of diabetes mellitus, oxygen and glucose. Acta Ophthalmol. (Copenh) 1990, 68, 715–720. [Google Scholar] [CrossRef]
  59. Iriyama, A.; Yanagi, Y. Fundus autofluorescence and retinal structure as determined by spectral domain optical coherence tomography, and retinal function in retinitis pigmentosa. Graefes. Arch. Clin. Exp. Ophthalmol. 2012, 250, 333–339. [Google Scholar] [CrossRef]
  60. Wirtschafter, J.D. Optic nerve axons and acquired alterations in the appearance of the optic disc. Trans. Am. Ophthalmol. Soc. 1983, 81, 1034. [Google Scholar]
  61. Todorova, M.G.; Bojinova, R.I.; Valmaggia, C.; Schorderet, D.F. Prominent Optic Disc Featured in Inherited Retinopathy. Klin. Monbl. Augenheilkd. 2017, 234, 577–583. [Google Scholar] [CrossRef]
  62. Funatsu, J.; Murakami, Y.; Nakatake, S.; Akiyama, M.; Fujiwara, K.; Shimokawa, S.M.; Tachibana, T.; Hisatomi, T.; Koyanagi, Y.; Momozawa, Y.; et al. Direct comparison of retinal structure and function in retinitis pigmentosa by co-registering microperimetry and optical coherence tomography. PLoS ONE 2019, 14, e0226097. [Google Scholar] [CrossRef] [PubMed] [Green Version]
  63. Robson, A.G.; Egan, C.A.; Luong, V.A.; Bird, A.C.; Holder, G.E.; Fitzke, F.W. Comparison of fundus autofluorescence with photopic and scotopic fine-matrix mapping in patients with retinitis pigmentosa and normal visual acuity. Invest. Ophthalmol. Vis. Sci. 2004, 45, 4119–4125. [Google Scholar]
  64. Robson, A.G.; Lenassi, E.; Saihan, Z.; Luong, V.A.; Fitzke, F.W.; Holder, G.E.; Webster, A.R. Comparison of fundus autofluorescence with photopic and scotopic fine matrix mapping in patients with retinitis pigmentosa: 4- to 8-year follow-up. Invest. Ophthalmol. Vis. Sci. 2012, 53, 6187–6195. [Google Scholar] [CrossRef] [Green Version]
  65. Nakatake, S.; Murakami, Y.; Funatsu, J.; Koyanagi, Y.; Akiyama, M.; Momozawa, Y.; Ishibashi, T.; Sonoda, K.H.; Ikeda, Y. Early detection of cone photoreceptor cell loss in retinitis pigmentosa using adaptive optics scanning laser ophthalmoscopy. Graefes. Arch. Clin. Exp. Ophthalmol. 2019, 257, 1169–1181. [Google Scholar] [CrossRef]
  66. Komeima, K.; Rogers, B.S.; Lu, L.; Campochiaro, P.A. Antioxidants reduce cone cell death in a model of retinitis pigmentosa. Proc. Natl. Acad. Sci. USA 2006, 103, 11300–11305. [Google Scholar] [CrossRef] [Green Version]
  67. Curcio, C.A.; Sloan, K.R.; Kalina, R.E.; Hendrickson, A.E. Human photoreceptor topography. J. Comp. Neurol. 1990, 292, 497–523. [Google Scholar] [CrossRef]
  68. Curcio, C.A.; Sloan, K.R. Packing geometry of human cone photoreceptors: Variation with eccentricity and evidence for local anisotropy. Vis. Neurosci. 1992, 9, 169–180. [Google Scholar] [CrossRef]
  69. Curcio, C.A.; Sloan, K.R.; Packer, O.; Hendrickson, A.E.; Kalina, R.E. Distribution of Cones in human and monkey retina: Individual variability and radial asymmetry. Science 1987, 236, 579–582. [Google Scholar] [CrossRef] [Green Version]
  70. Jani, P.D.; Mwanza, J.; Billow, K.B.; Waters, A.M.; Moyer, S.; Garg, S. Normative values and predictors of retinal oxygen saturation. Retina 2014, 34, 394–401. [Google Scholar] [CrossRef]
Figure 1. Vessel map of the retinal oximetry (RO) image, showing color-coded oxygen saturation (SO2) values of retinal vessels within the peripapillary annulus of a control. Scheme: 1.0–1.5 optic disc diameter distances from the optic disc margin. CRD—cone-rod dystrophy; IMD—inherited macular dystrophy; RCD—rod-cone dystrophy.
Genes 12 00272 g001
Figure 2. An example of RNFL thickness (12 scans, 6-mm optic nerve head-centered raster) and macular thickness protocol (Macular Cube 512 × 128) of a control subject (top, left eye), a patient with RCD (left eye), a patient with CRD (left eye) and a patient with IMD (bottom, left eye). The naso-temporal values were calculated from the values corresponding to the nasal and temporal main peripapillary vessels. The ETDRS chart for calculation of the central retinal exposure parameters in zones is plotted around the fovea.
Genes 12 00272 g002
Figure 3. Box plots for the evaluated parameters, as follows: oxygen saturation (a); retinal vessel diameter (b), central retinal thickness (c), RNFL thickness (d), central oxygen exposure in zones (e) and peripapillary naso-temporal oxygen exposure (f) parameters.
Genes 12 00272 g003
Table 1. Demographic characteristics including age, gender, best corrected visual acuity (BCVA, Snellen charts) in eyes of controls and patients suffering inherited retinal diseases in subgroups as mean ± standard deviation (SD).
GroupsNumber
of Subjects
Evaluated Eyes Age, Y;
Mean (±SD)
Gender
(♀:♂)
Mean BCVA, (±SD)
(Snellen Charts)
RELE
Controls30303046.34 (10.50)21:91.0 (0.03)
RCD35343543.88 (13.54)18:170.53 (0.26)
CRD13131341.08 (13.02)8:60.47 (0.36)
IMD13131354.16 (13.49)6:70.75 (0.30)
Table 2. Oxygen saturation parameters (A-SO2, V-SO2 and A-V SO2), retinal vessel diameters (D-A and D-V), the central retinal thickness and the RNFL thickness and the oxygen exposure (O2-E).
Adjusted Means in Groups
(±SD)
Comparison between
Groups
ANOVA, Based on Mixed Effects Model
ControlsRCDCRDIMDGroup 1Group 2Mean Differencep-Values between Groups
A-SO2 (%)
92.08 (4.51)99.12 (6.42)96.55
(4.95)
94.30
(6.03)
Controls
Controls
Controls
RCD
RCD
CRD
RCD
CRD
IMD
CRD
IMD
IMD
−7.03
−4.47
−2.21
2.57
4.82
−2.26
<0.001
0.001
0.102
0.052
<0.001
0.148
V-SO2 (%)
53.94 (6.65)63.55
(7.64)
56.67
(8.03)
58.61
(8.63)
Controls
Controls
Controls
RCD
RCD
CRD
RCD
CRD
IMD
CRD
IMD
IMD
−9.60
−2.72
−4.66
6.88
4.94
−1.94
<0.001
0.138
0.012
<0.001
0.006
0.358
A-V SO2 (%)
38.21 (5.52)35.54
(8.59)
39.86
(7.74)
35.69
(9.00)
Controls
Controls
Controls
RCD
RCD
CRD
RCD
CRD
IMD
CRD
IMD
IMD
2.98
−1.65
2.52
−4.32
−0.15
4.17
0.040
0.374
0.177
0.018
0.935
0.053
D-A (μm)
96.21 (13.910)84.12
(14.43)
91.20
(19.63)
106.93
(29.65)
Controls
Controls
Controls
RCD
RCD
CRD
RCD
CRD
IMD
CRD
IMD
IMD
12.10
5.01
−10.72
−7.09
−22.82
−15.71
<0.001
0.236
0.027
0.086
<0.001
0.004
D-V (μm)
121.00 (14.67)107.60
(17.88)
112.23
(28.58)
147.70
(26.31)
Controls
Controls
Controls
RCD
RCD
CRD
RCD
CRD
IMD
CRD
IMD
IMD
13.40
8.77
−26.70
−4.63
−40.10
−35.47
0.001
0.074
<0.001
0.329
<0.001
<0.001
Central retinal thickness (μm)
271.67 (19.60)263.80
(36.02)
229.00
(35.84)
281.88
(15.77)
Controls
Controls
Controls
RCD
RCD
CRD
RCD
CRD
IMD
CRD
IMD
IMD
7.87
42.68
−10.20
34.80
−18.07
−52.88
0.227
<0.001
0.275
<0.001
0.037
<0.001
RNFL thickness (μm)
92.83 (8.42)109.85
(22.91)
92.50
(20.63)
92.89
(9.90)
Controls
Controls
Controls
RCD
RCD
CRD
RCD
CRD
IMD
CRD
IMD
IMD
−17.02
0.33
−0.06
17.35
16.96
−0.39
<0.001
0.946
0.991
<0.001
0.001
0.947
cO2-E (µm/%)
6.92 (1.05)8.08
(2.15)
5.88
(1.30)
7.51
(1.14)
Controls
Controls
Controls
RCD
RCD
CRD
RCD
CRD
IMD
CRD
IMD
IMD
−1.16
1.05
−0.60
2.20
0.56
−1.64
0.002
0.035
0.242
<0.001
0.005
0.005
pO2-E (µm/%)
2.35 (0.36)3.36
(1.02)
2.36
(0.60)
2.58
(0.64)
Controls
Controls
Controls
RCD
RCD
CRD
RCD
CRD
IMD
CRD
IMD
IMD
−1.01
−0.01
−0.23
1.00
0.78
−0.21
<0.001
0.946
0.320
<0.001
<0.001
0.404
Table 3. The naso-temporal RNFL thickness parameters and the corresponding oxygen exposure parameters (pO2-E nasal, pO2-E temporal).
Adjusted Means in Groups
(±SD)
Comparison between
Groups
ANOVA, Based on Mixed Effects Model
ControlsRCDCRDIMDGroup 1Group 2Mean Differencep-Values between Groups
RNFL nasal (μm)
87.80 (13.97)103.88
(28.02)
90.10
(31.83)
88.62
(13.10)
Controls
Controls
Controls
RCD
RCD
CRD
RCD
CRD
IMD
CRD
IMD
IMD
−16.07
−4.30
−0.82
11.80
15.25
3.48
0.001
0.490
0.904
0.053
0.023
0.649
RNFL temporal (μm)
96.23 (11.91)113.97
(25.35)
88.36
(17.16)
96.88
(14.03)
Controls
Controls
Controls
RCD
RCD
CRD
RCD
CRD
IMD
CRD
IMD
IMD
−17.740
7.874
−0.650
25.614
17.090
−8.524
<0.001
0.121
0.904
<0.001
0.001
0.164
A-V SO2 nasal (%)
38.20 (5.36)37.04
(5.89)
36.88
(5.30)
41.62
(6.91)
Controls
Controls
Controls
RCD
RCD
CRD
RCD
CRD
IMD
CRD
IMD
IMD
1.151
1.313
−3.421
0.162
−4.572
−4.734
0.390
0.393
0.039
0.912
0.004
0.008
A-V SO2 temporal (%)
36.35 (6.45)32.60
(6.71)
38.39
(6.63)
34.29
(8.61)
Controls
Controls
Controls
RCD
RCD
CRD
RCD
CRD
IMD
CRD
IMD
IMD
3.743
−2.041
2.058
−5.784
−1.685
−4.099
0.019
0.261
0.298
0.001
0.380
0.055
pO2-E nasal (µm/%)
2.35 (0.58)3.03
(0.91)
2.54
(1.05)
2.15
(0.42)
Controls
Controls
Controls
RCD
RCD
CRD
RCD
CRD
IMD
CRD
IMD
IMD
−0.681
−0.184
0.200
0.498
0.881
−0.383
0.001
0.438
0.457
0.025
0.001
0.177
pO2-E temporal (µm/%)
2.73 (0.66)3.82
(1.45)
2.31
(0.45)
2.83
(0.91)
Controls
Controls
Controls
RCD
RCD
CRD
RCD
CRD
IMD
CRD
IMD
IMD
−1.095
0.420
−0.104
1.516
0.991
0.525
<0.001
0.162
0.765
<0.001
0.004
0.159
Table 4. The retinal thickness in zones and the corresponding oxygen exposure parameters (z1O2-E, z2O2-E and z3O2-E).
Adjusted Means in Groups
(±SD)
Comparison between GroupsANOVA, Based on Mixed Effects Model
ControlsRCDCRDIMDGroup 1Group 2Mean Differencep-Values between Groups
Retinal thickness, Zone 1 (μm)
259.56 (28.32)272.11
(77.02)
179.22
(43.32)
246.69
(15.92)
Controls
Controls
Controls
RCD
RCD
CRD
RCD
CRD
IMD
CRD
IMD
IMD
−13.74
80.34
12.87
94.08
26.61
−64.47
0.274
<0.001
0.473
<0.001
0.109
0.001
Retinal thickness, Zone 2 (μm)
318.79 (12.34)303.16
(55.52)
258.49
(44.85)
312.26
(27.29)
Controls
Controls
Controls
RCD
RCD
CRD
RCD
CRD
IMD
CRD
IMD
IMD
15.86
60.30
6.52
44.44
−9.34
−53.78
0.094
<0.001
0.628
<0.001
0.452
0.001
Retinal thickness, Zone 3 (μm)
268.69 (25.47)255.92
(33.22)
239.47
(30.44)
270.88
(27.36)
Controls
Controls
Controls
RCD
RCD
CRD
RCD
CRD
IMD
CRD
IMD
IMD
13.26
29.22
−2.18
15.96
−15.44
−31.40
0.043
0.001
0.814
0.053
0.073
0.003
z1O2-E (µm/%)
6.62
(1.18)
8.48
(3.06)
4.66
(1.52)
6.59
(1.05)
Controls
Controls
Controls
RCD
RCD
CRD
RCD
CRD
IMD
CRD
IMD
IMD
−1.86
1.96
0.03
3.82
1.90
−1.93
<0.001
0.004
0.961
<0.001
0.004
0.015
z2O2-E (µm/%)
8.11
(1.03)
9.36
(2.58)
6.67
(1.66)
8.30
(1.20)
Controls
Controls
Controls
RCD
RCD
CRD
RCD
CRD
IMD
CRD
IMD
IMD
−1.26
1.44
−0.19
2.70
1.07
−1.63
0.004
0.014
0.755
<0.001
0.059
0.018
z3O2-E (µm/%)
6.83
(1.03)
7.81
(1.02)
6.15
(1.20)
7.24
(1.36)
Controls
Controls
Controls
RCD
RCD
CRD
RCD
CRD
IMD
CRD
IMD
IMD
−0.98
0.68
−0.42
1.66
0.56
−1.10
0.006
0.150
0.399
<0.001
0.222
0.051
Publisher’s Note: MDPI stays neutral with regard to jurisdictional claims in published maps and institutional affiliations.

