
A Complex Gene Network Mediated by Ethylene Signal Transduction TFs Defines the Flower Induction and Differentiation in Olea europaea L.

 ,
,  , ,
, , 
 ,
,  and
and 
Abstract
:
1. Introduction
2. Materials and Methods
2.1. Plant Material and Sample Collection
2.2. RNA Purification and Quantification
2.3. Library Construction and RNA Sequencing
2.4. Bioinformatics Analysis
2.5. qRT-PCR for Transcriptomic Data Validation
3. Results
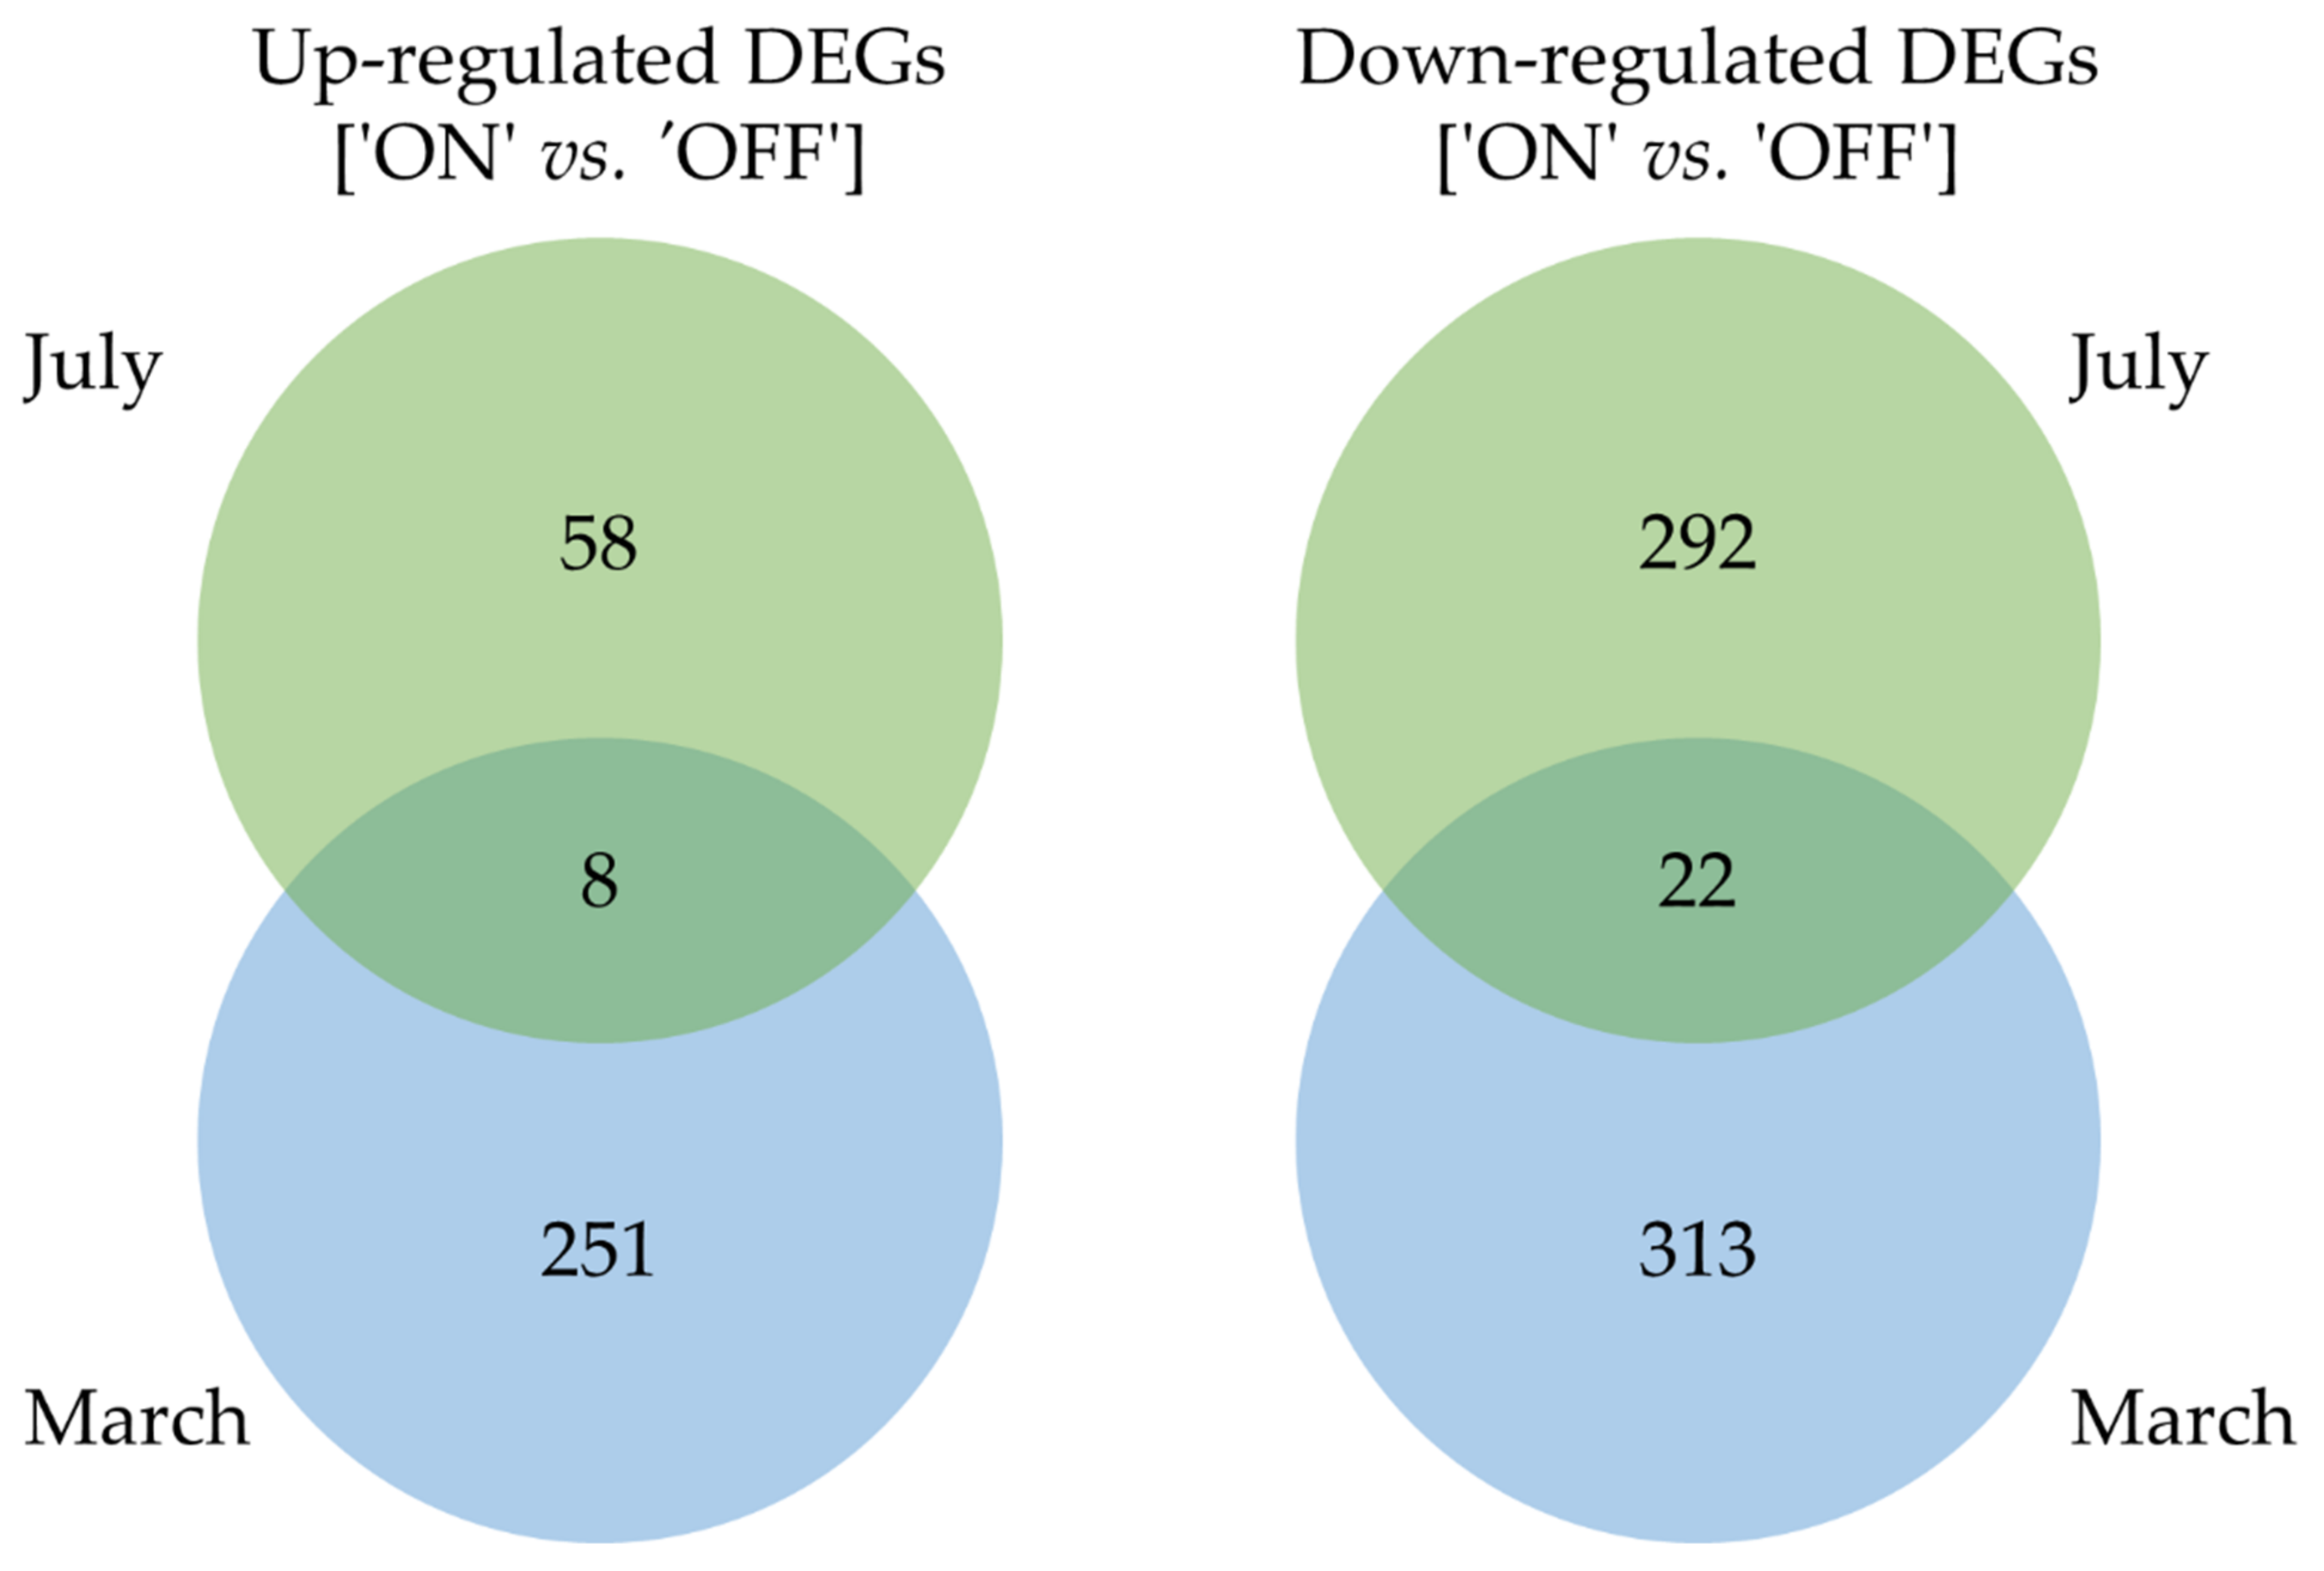
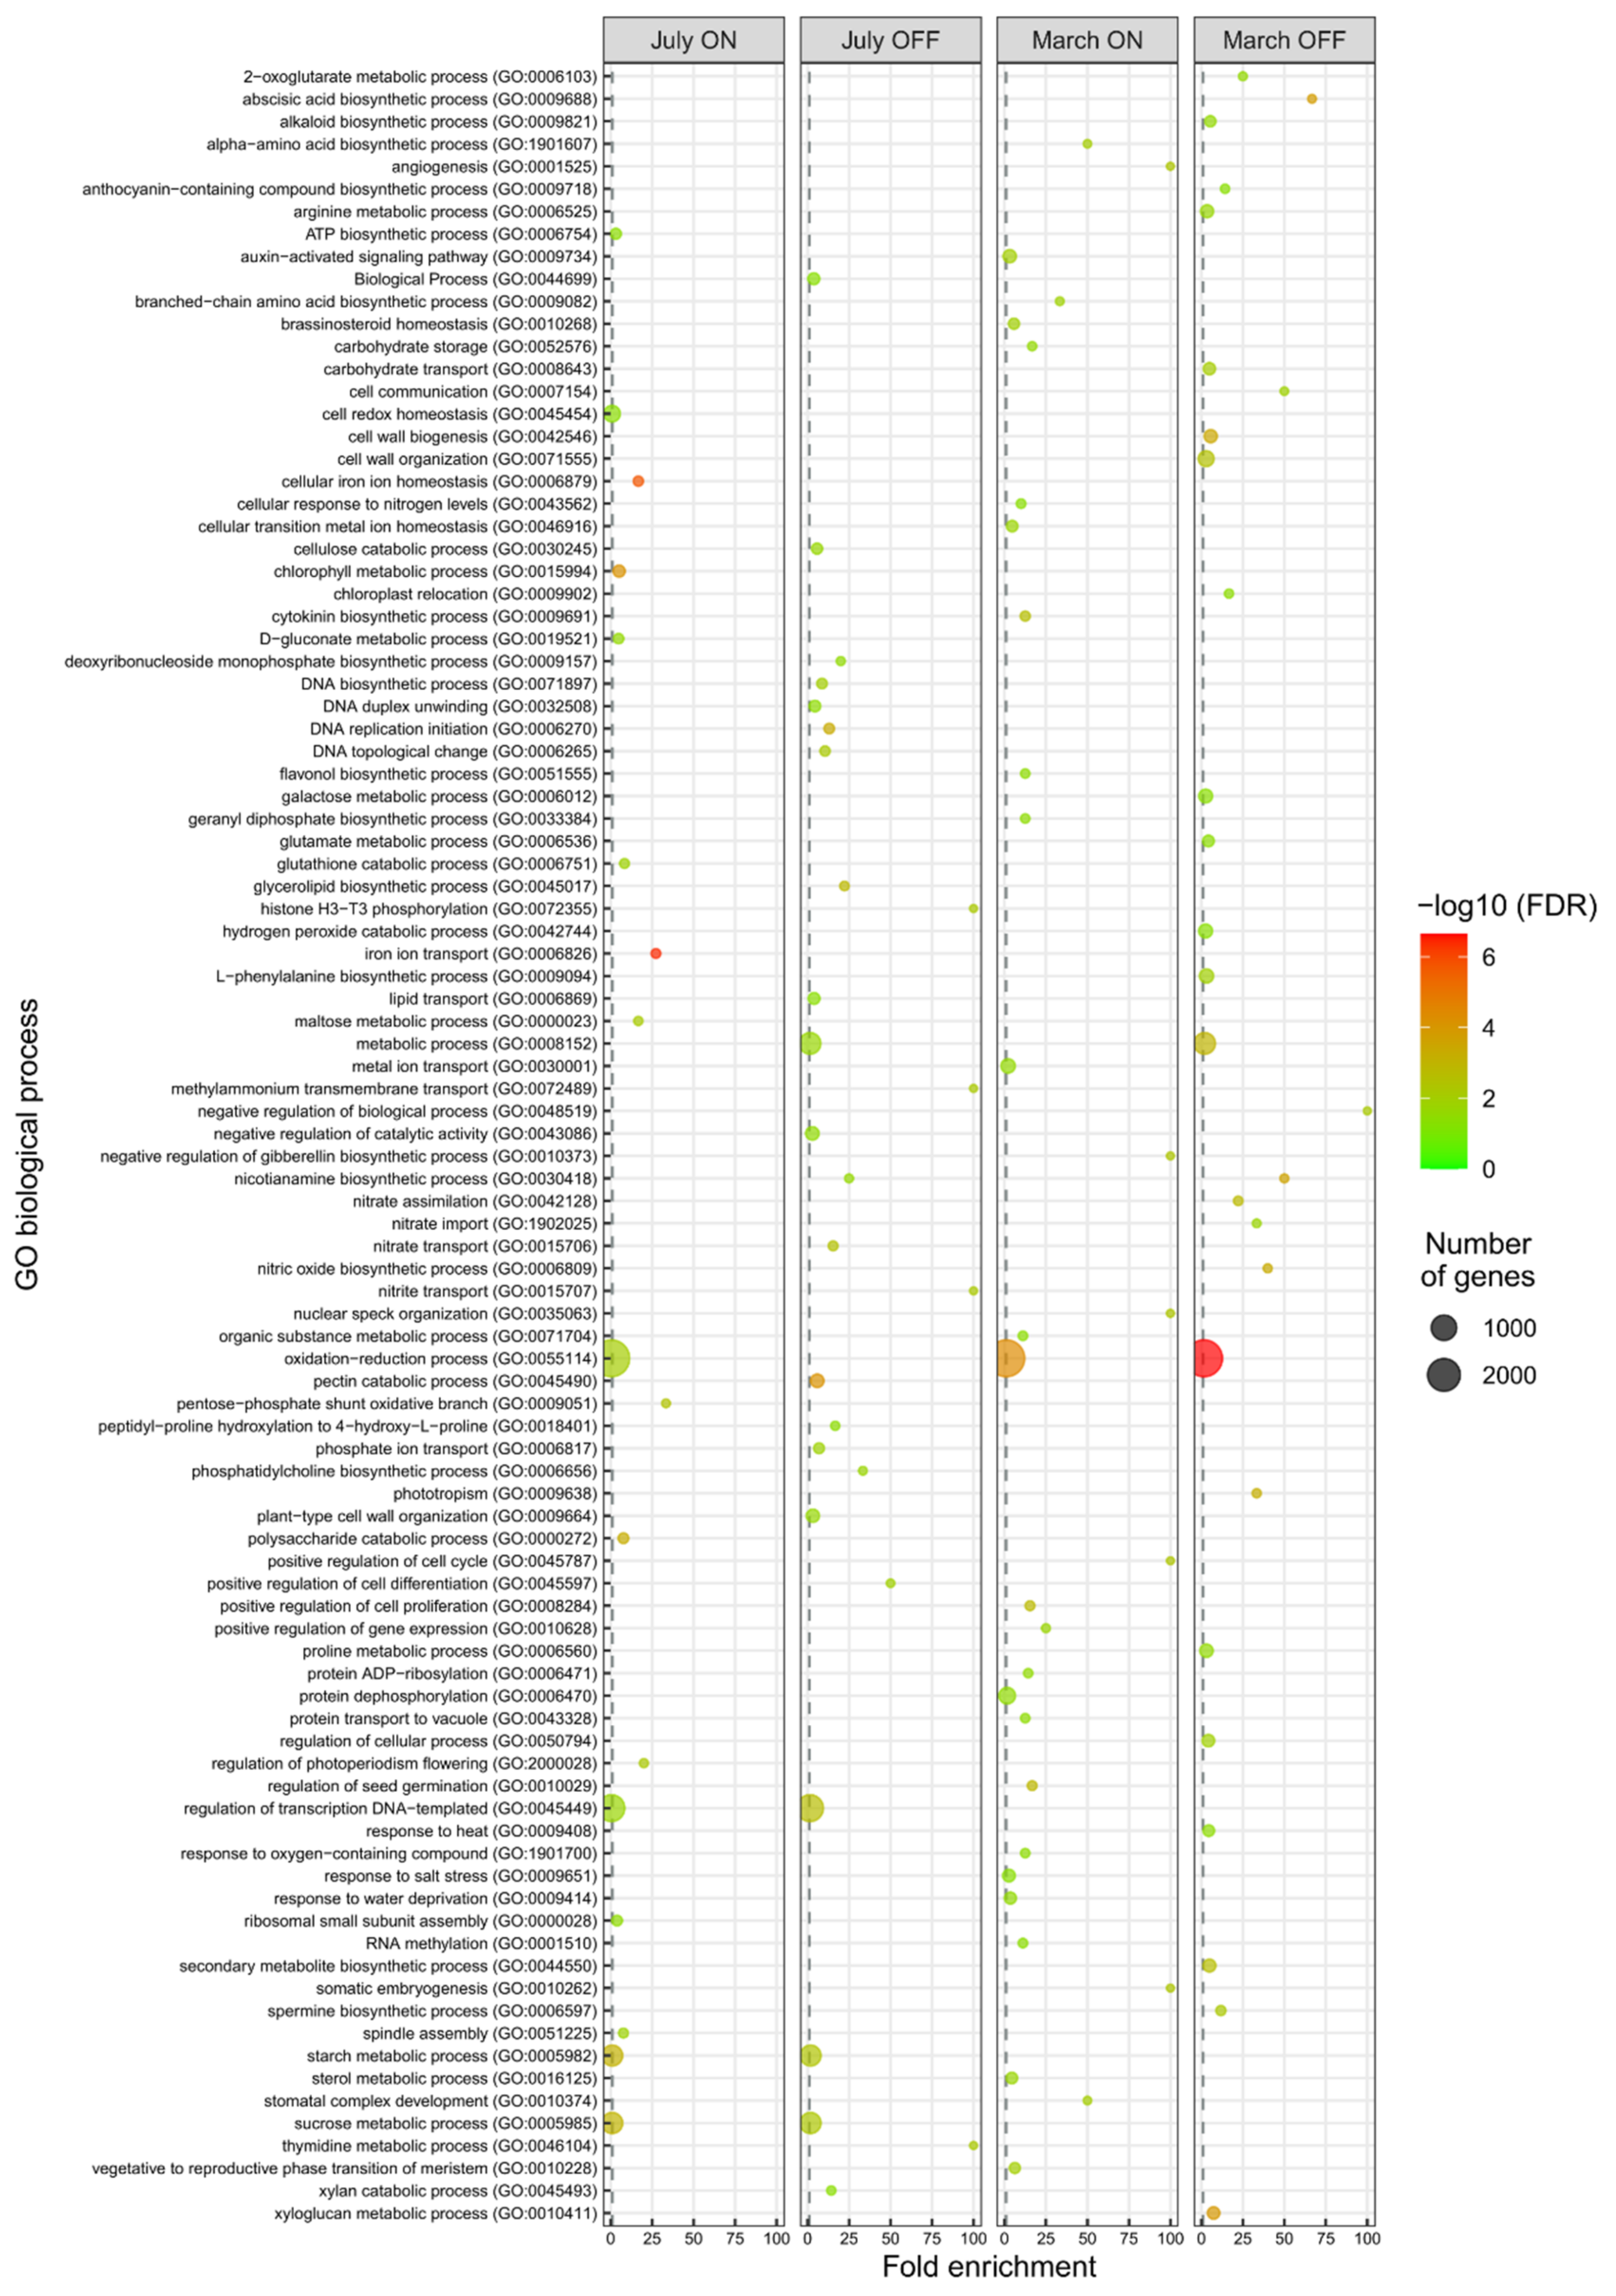
3.1. Gene Ontology Classification of Differentially Expressed Genes
3.2. Functional Data Mining of the Differential Transcriptome
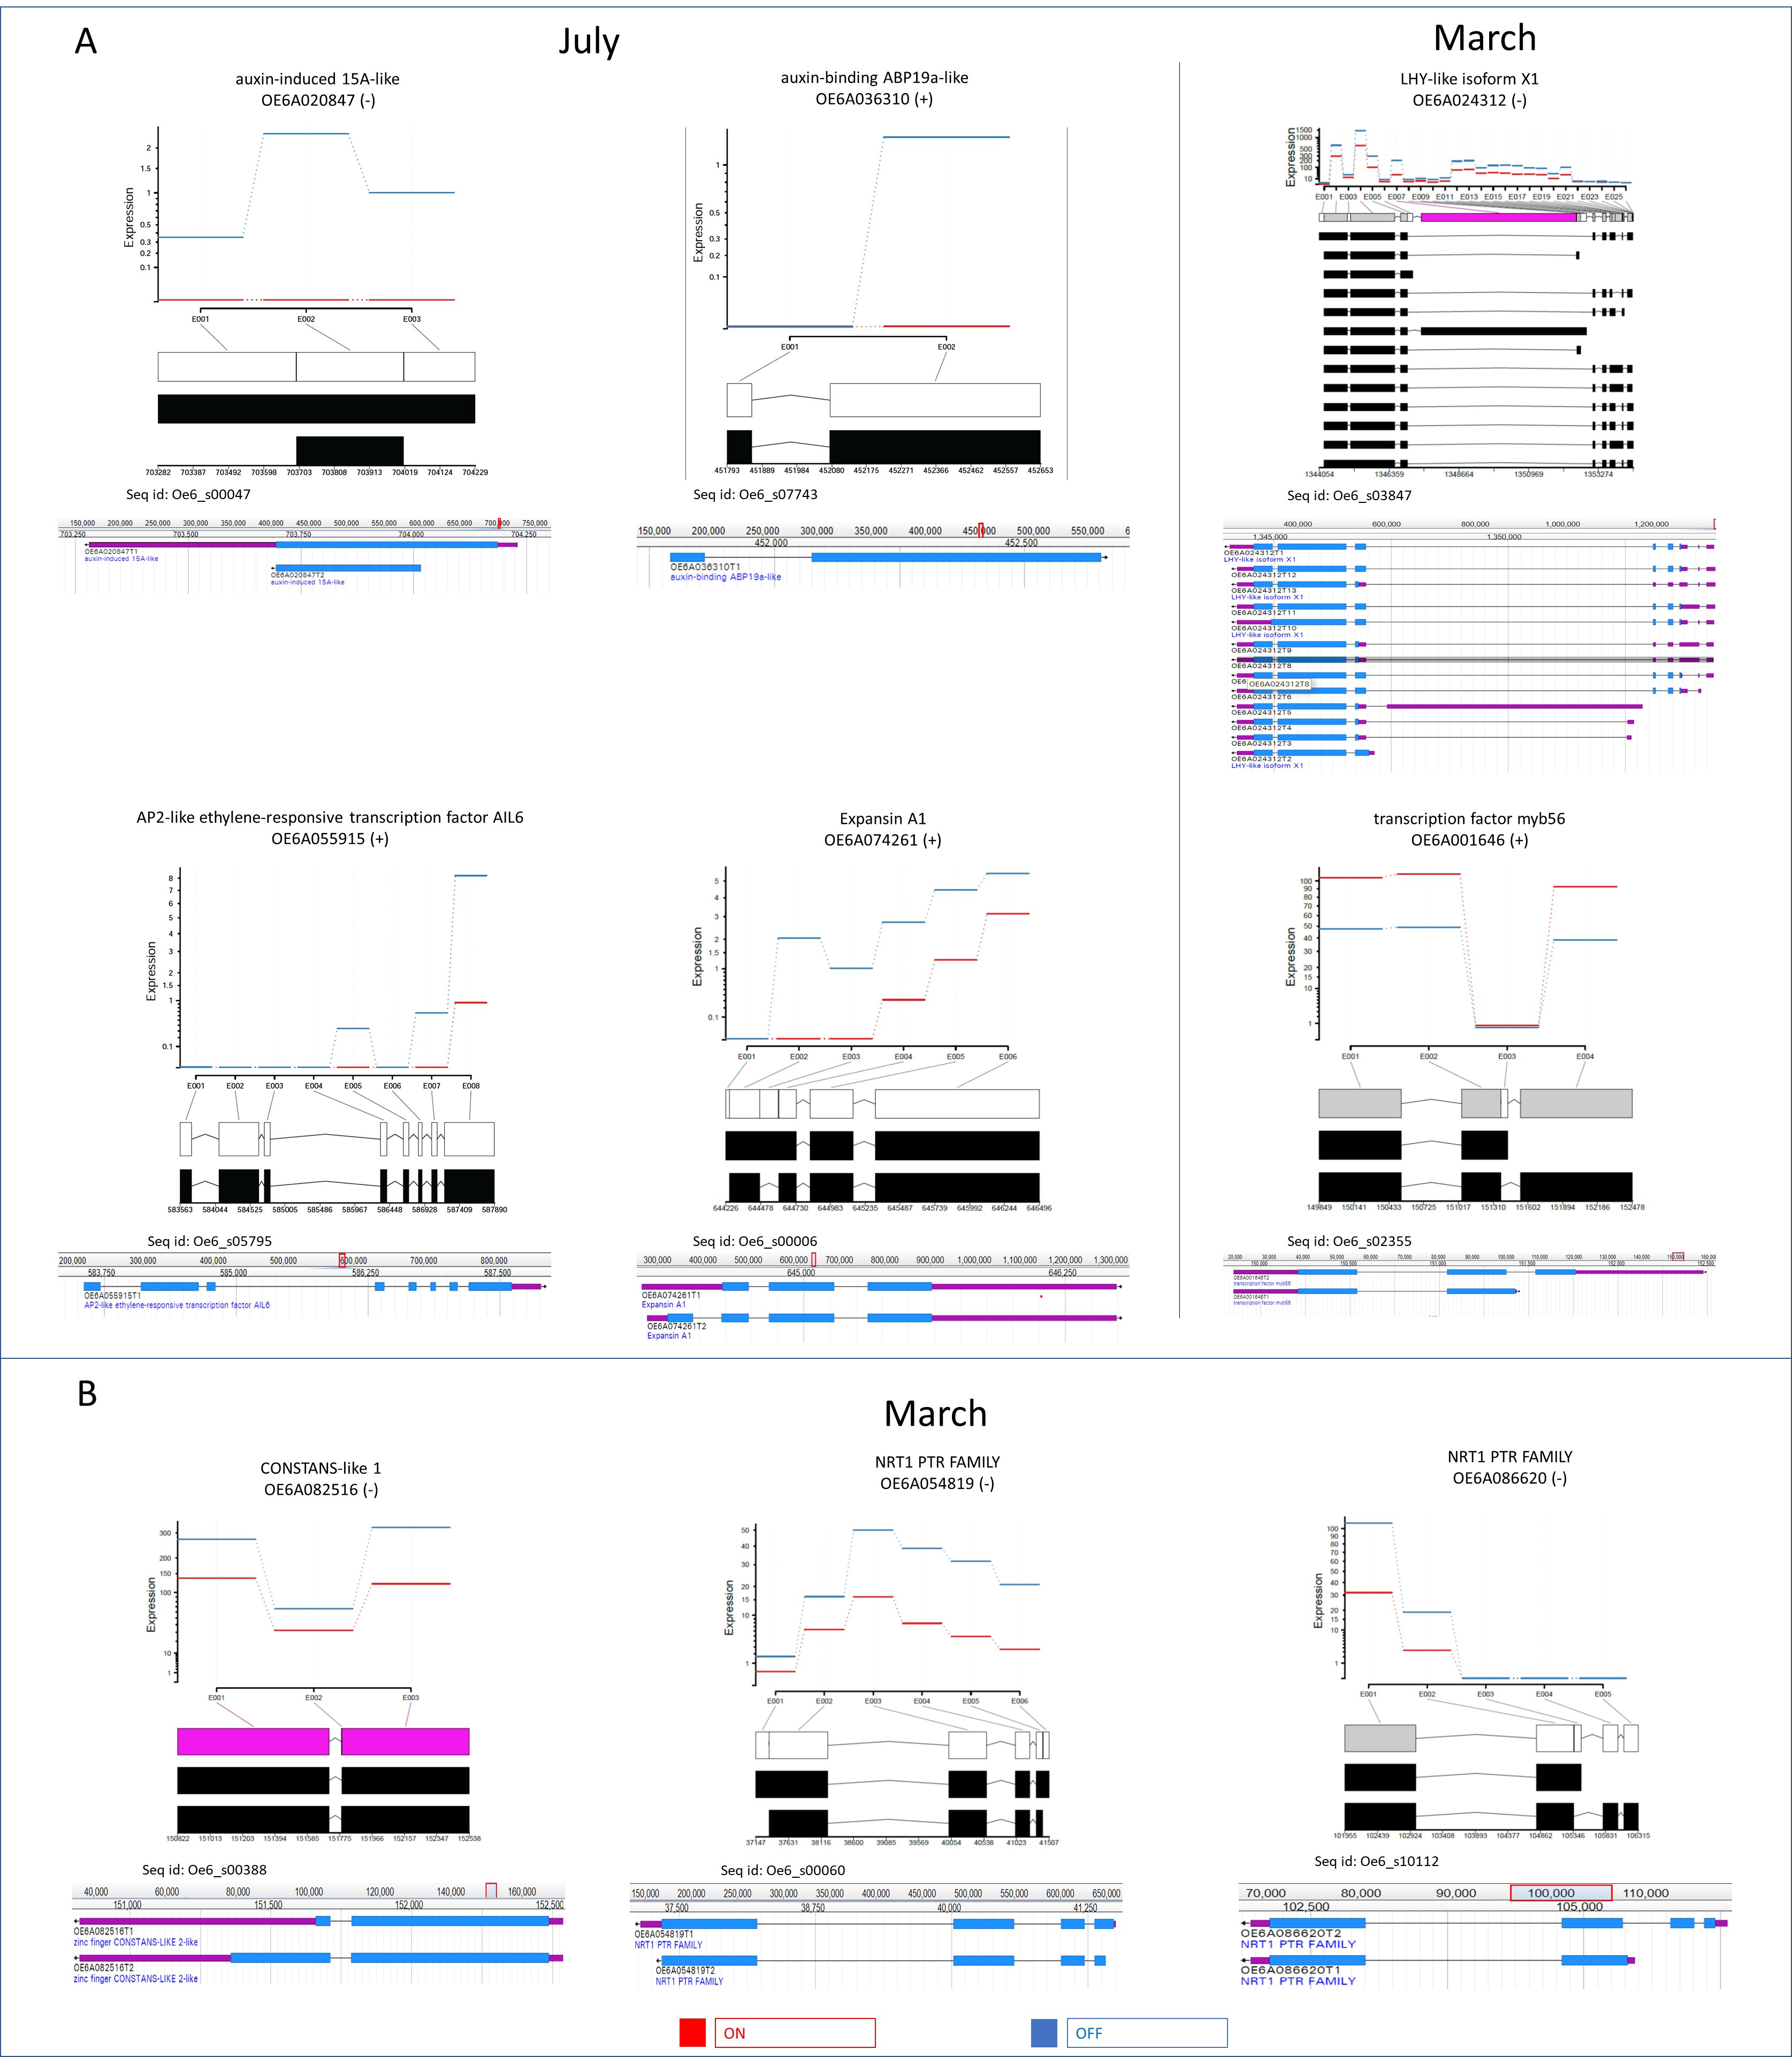
3.3. Differential Expression of mRNA Isoforms
3.4. Validation of RNA-Seq Expressions of Selected Genes by Real-Time qRT-PCR
4. Discussion
4.1. Carbohydrate Metabolism/Transport and Phenylpropanoid Genes
4.2. Ethylene Signal Transduction TFs
4.3. Photo-Perception and Flowering Control Genes
5. Conclusions
Supplementary Materials
Author Contributions
Funding
Institutional Review Board Statement
Informed Consent Statement
Data Availability Statement
Acknowledgments
Conflicts of Interest
References
- Besnard, G.; Henry, P.; Wille, L.; Cooke, D.; Chapuis, E. On the Origin of the Invasive Olives (Olea europaea L., Oleaceae). Heredity 2007, 99, 608–619. [Google Scholar] [CrossRef] [Green Version]
- Seyyednejad, M.; Ebrahimzadeh, H.; Talaie, A. Carbohydrate Content in Olive Zard c.v. and Alternate Bearing Pattern. Int. Sugar J. 2001, 103, 84–87. [Google Scholar]
- Ben-Gal, A.; Dag, A.; Basheer, L.; Yermiyahu, U.; Zipori, I.; Kerem, Z. The Influence of Bearing Cycles on Olive Oil Quality Response to Irrigation. J. Agric. Food Chem. 2011, 59, 11667–11675. [Google Scholar] [CrossRef]
- Bustan, A.; Avni, A.; Lavee, S.; Zipori, I.; Yeselson, Y.; Schaffer, A.A.; Riov, J.; Dag, A. Role of Carbohydrate Reserves in Yield Production of Intensively Cultivated Oil Olive (Olea europaea L.) Trees. Tree Physiol. 2011, 31, 519–530. [Google Scholar] [CrossRef] [PubMed] [Green Version]
- Goldschmidt, E. Regulatory Aspects of Alternate Bearing in Fruit Trees; Italus Hortus: Sesto Fiorentino, Italy, 2005; pp. 11–17. [Google Scholar]
- Lavee, S. Biology and Physiology of the Olive. In World Olive Encyclopaedia; Blazquez, J.M., Ed.; Plaza and Janes SA: Barcelona, Spain, 1996; pp. 61–105. [Google Scholar]
- Monselise, S.P.; Goldschmidt, E.E. Alternate Bearing in Fruit Trees. Hortic. Rev. 1982, 4, 128–173. [Google Scholar]
- Baktir, I.; Ulger, S.; Kaynak, L.; Himelrick, D.G. Relationship of Seasonal Changes in Endogenous Plant Hormones and Alternate Bearing of Olive Trees. Hortscience 2004, 39, 987–990. [Google Scholar] [CrossRef] [Green Version]
- Rosecrance, R. Alternate Bearing Affects Nitrogen, Phosphorus, Potassium and Starch Storage Pools in Mature Pistachio Trees. Ann. Bot. 1998, 82, 463–470. [Google Scholar] [CrossRef]
- Huijser, P.; Schmid, M. The Control of Developmental Phase Transitions in Plants. Development 2011, 138, 4117–4129. [Google Scholar] [CrossRef] [Green Version]
- Fernández-Escobar, R.; Moreno, R.; García-Creus, M. Seasonal Changes of Mineral Nutrients in Olive Leaves during the Alternate-Bearing Cycle. Sci. Hortic. 1999, 82, 25–45. [Google Scholar] [CrossRef]
- La Rosa, R.; Angiolillo, A.; Guerrero, C.; Pellegrini, M.; Rallo, L.; Besnard, G.; Bervillé, A.; Martin, A.; Baldoni, L. A First Linkage Map of Olive (Olea europaea L.) Cultivars Using RAPD, AFLP, RFLP and SSR Markers. Theor. Appl. Genet. 2003, 106, 1273–1282. [Google Scholar] [CrossRef]
- Khadari, B.; Breton, C.; Moutier, N.; Roger, J.; Besnard, G.; Bervillé, A.; Dosba, F. The Use of Molecular Markers for Germplasm Management in a French Olive Collection. Theor. Appl. Genet. 2003, 106, 521–529. [Google Scholar] [CrossRef] [PubMed]
- Galla, G.; Barcaccia, G.; Ramina, A.; Collani, S.; Alagna, F.; Baldoni, L.; Cultrera, N.G.M.; Martinelli, F.; Sebastiani, L.; Tonutti, P. Computational Annotation of Genes Differentially Expressed along Olive Fruit Development. BMC Plant. Biol. 2009, 9, 128. [Google Scholar] [CrossRef] [PubMed] [Green Version]
- Alagna, F.; D’Agostino, N.; Torchia, L.; Servili, M.; Rao, R.; Pietrella, M.; Giuliano, G.; Chiusano, M.L.; Baldoni, L.; Perrotta, G. Comparative 454 Pyrosequencing of Transcripts from Two Olive Genotypes during Fruit Development. BMC Genom. 2009, 10, 399. [Google Scholar] [CrossRef] [PubMed] [Green Version]
- Lavee, S. Biennial Bearing in Olive (Olea europaea). Ann. Ser. Hist. Nat. 2007, 1, 101–112. [Google Scholar]
- Al-Shdiefat, S.S.; Qrunfleh, M.M. Alternate Bearing of the Olive (Olea europaea L.) as Related to Endogenous Hormonal Content. Int. J. Agric. Sci. 2008, 4, 11–25. [Google Scholar]
- Muñoz-Fambuena, N.; Mesejo, C.; González-Mas, M.C.; Primo-Millo, E.; Agustí, M.; Iglesias, D.J. Fruit Load Modulates Flowering-Related Gene Expression in Buds of Alternate-Bearing ‘Moncada’ Mandarin. Ann. Bot. 2012, 110, 1109–1118. [Google Scholar] [CrossRef] [PubMed] [Green Version]
- Ziv, D.; Zviran, T.; Zezak, O.; Samach, A.; Irihimovitch, V. Expression Profiling of FLOWERING LOCUS T-like Gene in Alternate Bearing “Hass” Avocado Trees Suggests a Role for PaFT in Avocado Flower Induction. PLoS ONE 2014, 9, e110613. [Google Scholar] [CrossRef] [PubMed]
- Kofler, J.; Milyaev, A.; Capezzone, F.; Stojnić, S.; Mićić, N.; Flachowsky, H.; Hanke, M.-V.; Wünsche, J.-N. High Crop Load and Low Temperature Delay the Onset of Bud Initiation in Apple. Sci. Rep. 2019, 9, 17986. [Google Scholar] [CrossRef]
- Ansorge, W.J. Next-Generation DNA Sequencing Techniques. New Biotechnol. 2009, 25, 195–203. [Google Scholar] [CrossRef]
- Carmona, R.; Arroyo, M.; Jiménez-Quesada, M.J.; Seoane, P.; Zafra, A.; Larrosa, R.; Alché, J.d.D.; Claros, M.G. Automated Identification of Reference Genes Based on RNA-Seq Data. Biomed. Eng. Online 2017, 16, 65. [Google Scholar] [CrossRef] [Green Version]
- Iaria, D.L.; Chiappetta, A.; Muzzalupo, I. A De Novo Transcriptomic Approach to Identify Flavonoids and Anthocyanins “Switch-Off” in Olive (Olea europaea L.) Drupes at Different Stages of Maturation. Front. Plant. Sci. 2016, 6. [Google Scholar] [CrossRef] [Green Version]
- Carbone, F.; Bruno, L.; Perrotta, G.; Bitonti, M.B.; Muzzalupo, I.; Chiappetta, A. Identification of MiRNAs Involved in Fruit Ripening by Deep Sequencing of Olea europaea L. Transcriptome. PLoS ONE 2019, 14, e0221460. [Google Scholar] [CrossRef] [PubMed]
- Cruz, F.; Julca, I.; Gómez-Garrido, J.; Loska, D.; Marcet-Houben, M.; Cano, E.; Galán, B.; Frias, L.; Ribeca, P.; Derdak, S.; et al. Genome Sequence of the Olive Tree, Olea Europaea. GigaScience 2016, 5, 29. [Google Scholar] [CrossRef]
- Unver, T.; Wu, Z.; Sterck, L.; Turktas, M.; Lohaus, R.; Li, Z.; Yang, M.; He, L.; Deng, T.; Escalante, F.J.; et al. Genome of Wild Olive and the Evolution of Oil Biosynthesis. Proc. Natl. Acad. Sci. USA 2017, 114, E9413–E9422. [Google Scholar] [CrossRef] [PubMed] [Green Version]
- Jiménez-Ruiz, J.; Ramírez-Tejero, J.A.; Fernández-Pozo, N.; Leyva-Pérez, M.D.L.O.; Yan, H.; Rosa, R.D.L.; Belaj, A.; Montes, E.; Rodríguez-Ariza, M.O.; Navarro, F.; et al. Transposon Activation Is a Major Driver in the Genome Evolution of Cultivated Olive Trees (Olea europaea L.). Plant. Genome 2020, 13, e20010. [Google Scholar] [CrossRef] [PubMed] [Green Version]
- Dastkar, E.; Soleimani, A.; Jafary, H.; de Dios Alche, J.; Bahari, A.; Zeinalabedini, M.; Salami, S.A. Differential Expression of Genes in Olive Leaves and Buds of ON- versus OFF-Crop Trees. Sci. Rep. 2020, 10, 15762. [Google Scholar] [CrossRef]
- Andrews, S. FastQC: A Quality Control Tool for High Throughput Sequence Data. 2010. Available online: https://www.scienceopen.com/document?vid=de674375-ab83-4595-afa9-4c8aa9e4e736 (accessed on 4 April 2021).
- Bolger, A.M.; Lohse, M.; Usadel, B. Trimmomatic: A Flexible Trimmer for Illumina Sequence Data. Bioinformatics 2014, 30, 2114–2120. [Google Scholar] [CrossRef] [Green Version]
- Liao, Y.; Smyth, G.K.; Shi, W. The R Package Rsubread Is Easier, Faster, Cheaper and Better for Alignment and Quantification of RNA Sequencing Reads. Nucleic Acids Res. 2019, 47, e47. [Google Scholar] [CrossRef] [Green Version]
- Robinson, M.D.; McCarthy, D.J.; Smyth, G.K. EdgeR: A Bioconductor Package for Differential Expression Analysis of Digital Gene Expression Data. Bioinformatics 2010, 26, 139–140. [Google Scholar] [CrossRef] [Green Version]
- Draw Venn Diagram. Available online: http://bioinformatics.psb.ugent.be/webtools/Venn/ (accessed on 8 April 2021).
- Young, M.D.; Wakefield, M.J.; Smyth, G.K.; Oshlack, A. Gene Ontology Analysis for RNA-Seq: Accounting for Selection Bias. Genome Biol. 2010, 11, R14. [Google Scholar] [CrossRef] [Green Version]
- Wickham, H. Ggplot2; Springer: New York, NY, USA, 2009; ISBN 978-0-387-98140-6. [Google Scholar]
- Anders, S.; Reyes, A.; Huber, W. Detecting Differential Usage of Exons from RNA-Seq Data. Genome Res. 2012, 22, 2008–2017. [Google Scholar] [CrossRef] [PubMed]
- Shannon, P.; Markiel, A.; Ozier, O.; Baliga, N.S.; Wang, J.T.; Ramage, D.; Amin, N.; Schwikowski, B.; Ideker, T. Cytoscape: A Software Environment for Integrated Models of Biomolecular Interaction Networks. Genome Res. 2003, 13, 2498–2504. [Google Scholar] [CrossRef]
- Tzfadia, O.; Diels, T.; De Meyer, S.; Vandepoele, K.; Aharoni, A.; Van de Peer, Y. CoExpNetViz: Comparative Co-Expression Networks Construction and Visualization Tool. Front. Plant. Sci. 2016, 6. [Google Scholar] [CrossRef] [PubMed] [Green Version]
- Livak, K.J.; Schmittgen, T.D. Analysis of Relative Gene Expression Data Using Real-Time Quantitative PCR and the 2−ΔΔCT Method. Methods 2001, 25, 402–408. [Google Scholar] [CrossRef]
- Past 4—The Past of the Future-Natural History Museum. Available online: https://www.nhm.uio.no/english/research/infrastructure/past/ (accessed on 8 April 2021).
- Hürkan, K.; Sezer, F.; Özbilen, A.; Taşkın, K.M. Identification of Reference Genes for Real-Time Quantitative Polymerase Chain Reaction Based Gene Expression Studies on Various Olive (Olea europaea L.) Tissues. J. Hortic. Sci. Biotechnol. 2018, 93, 644–651. [Google Scholar] [CrossRef]
- Wuriyanghan, H.; Zhang, B.; Cao, W.-H.; Ma, B.; Lei, G.; Liu, Y.-F.; Wei, W.; Wu, H.-J.; Chen, L.-J.; Chen, H.-W.; et al. The Ethylene Receptor ETR2 Delays Floral Transition and Affects Starch Accumulation in Rice. Plant. Cell 2009, 21, 1473–1494. [Google Scholar] [CrossRef] [Green Version]
- Aguilar-Jaramillo, A.E.; Marín-González, E.; Matías-Hernández, L.; Osnato, M.; Pelaz, S.; Suárez-López, P. Tempranillo is a Direct Repressor of the MicroRNA MiR172. Plant. J. 2019, 100, 522–535. [Google Scholar] [CrossRef] [PubMed]
- Staiger, D.; Apel, K.; Trepp, G. The Atger3 Promoter Confers Circadian Clock-Regulated Transcription with Peak Expression at the Beginning of the Night. Plant. Mol. Biol. 1999, 40, 873–882. [Google Scholar] [CrossRef] [PubMed]
- Stortenbeker, N.; Bemer, M. The SAUR Gene Family: The Plant’s Toolbox for Adaptation of Growth and Development. J. Exp. Bot. 2019, 70, 17–27. [Google Scholar] [CrossRef] [PubMed] [Green Version]
- Chen, L.; Bernhardt, A.; Lee, J.; Hellmann, H. Identification of Arabidopsis MYB56 as a Novel Substrate for CRL3 BPM E3 Ligases. Mol. Plant. 2015, 8, 242–250. [Google Scholar] [CrossRef] [PubMed] [Green Version]
- Qin, W.; Yu, Y.; Jin, Y.; Wang, X.; Liu, J.; Xi, J.; Li, Z.; Li, H.; Zhao, G.; Hu, W.; et al. Genome-Wide Analysis Elucidates the Role of CONSTANS-like Genes in Stress Responses of Cotton. Int. J. Mol. Sci. 2018, 19, 2658. [Google Scholar] [CrossRef] [PubMed] [Green Version]
- Rapoport, H.F. The Reproductive Biology of the Olive Tree and Its Relationship to Extreme Environmental Conditions. Acta Hortic. 2014, 41–50. [Google Scholar] [CrossRef] [Green Version]
- Cheng, X.-F.; Wang, Z.-Y. Overexpression of COL9, a CONSTANS-LIKE Gene, Delays Flowering by Reducing Expression of CO and FT in Arabidopsis Thaliana: Overexpression of COL9 Delays Flowering. Plant. J. 2005, 43, 758–768. [Google Scholar] [CrossRef]
- Wu, W.; Zheng, X.-M.; Chen, D.; Zhang, Y.; Ma, W.; Zhang, H.; Sun, L.; Yang, Z.; Zhao, C.; Zhan, X.; et al. OsCOL16, Encoding a CONSTANS-like Protein, Represses Flowering by up-Regulating Ghd7 Expression in Rice. Plant. Sci. 2017, 260, 60–69. [Google Scholar] [CrossRef]
- Putterill, J.; Robson, F.; Lee, K.; Simon, R.; Coupland, G. The CONSTANS Gene of Arabidopsis Promotes Flowering and Encodes a Protein Showing Similarities to Zinc Finger Transcription Factors. Cell 1995, 80, 847–857. [Google Scholar] [CrossRef] [Green Version]
- Shim, J.S.; Kubota, A.; Imaizumi, T. Circadian Clock and Photoperiodic Flowering in Arabidopsis: CONSTANS Is a Hub for Signal Integration. Plant. Physiol. 2017, 173, 5–15. [Google Scholar] [CrossRef] [PubMed]
- Liu, K.H.; Huang, C.Y.; Tsay, Y.F. CHL1 Is a Dual-Affinity Nitrate Transporter of Arabidopsis Involved in Multiple Phases of Nitrate Uptake. Plant. Cell 1999, 11, 865–874. [Google Scholar] [CrossRef]
- Teng, Y.; Liang, Y.; Wang, M.; Mai, H.; Ke, L. Nitrate Transporter 1.1 Is Involved in Regulating Flowering Time via Transcriptional Regulation of Flowering Locus C in Arabidopsis Thaliana. Plant. Sci. 2019, 284, 30–36. [Google Scholar] [CrossRef] [PubMed]
- Yan, Y.; Shen, L.; Chen, Y.; Bao, S.; Thong, Z.; Yu, H. A MYB-Domain Protein EFM Mediates Flowering Responses to Environmental Cues in Arabidopsis. Dev. Cell 2014, 30, 437–448. [Google Scholar] [CrossRef] [PubMed] [Green Version]
- Gaudinier, A.; Rodriguez-Medina, J.; Zhang, L.; Olson, A.; Liseron-Monfils, C.; Bågman, A.-M.; Foret, J.; Abbitt, S.; Tang, M.; Li, B.; et al. Transcriptional Regulation of Nitrogen-Associated Metabolism and Growth. Nature 2018, 563, 259–264. [Google Scholar] [CrossRef]
- Suárez-López, P.; Wheatley, K.; Robson, F.; Onouchi, H.; Valverde, F.; Coupland, G. Constans Mediates between the Circadian Clock and the Control of Flowering in Arabidopsis. Nature 2001, 410, 1116–1120. [Google Scholar] [CrossRef]
- Mas, P. Circadian Clock Signaling in Arabidopsis Thaliana: From Gene Expression to Physiology and Development. Int. J. Dev. Biol. 2005, 49, 491–500. [Google Scholar] [CrossRef] [PubMed] [Green Version]
- Nagel, D.H.; Doherty, C.J.; Pruneda-Paz, J.L.; Schmitz, R.J.; Ecker, J.R.; Kay, S.A. Genome-Wide Identification of CCA1 Targets Uncovers an Expanded Clock Network in Arabidopsis. Proc. Natl. Acad. Sci. USA 2015, 112, E4802–E4810. [Google Scholar] [CrossRef] [PubMed] [Green Version]
- Rawat, R.; Takahashi, N.; Hsu, P.Y.; Jones, M.A.; Schwartz, J.; Salemi, M.R.; Phinney, B.S.; Harmer, S.L. Reveille8 and Pseudo-reponse regulator5 form a Negative Feedback Loop within the Arabidopsis Circadian Clock. PLoS Genet. 2011, 7, e1001350. [Google Scholar] [CrossRef] [PubMed]
- Tossi, V.E.; Regalado, J.J.; Iannicelli, J.; Laino, L.E.; Burrieza, H.P.; Escandón, A.S.; Pitta-Álvarez, S.I. Beyond Arabidopsis: Differential UV-B Response Mediated by UVR8 in Diverse Species. Front. Plant. Sci. 2019, 10, 780. [Google Scholar] [CrossRef]
- Sun, Z.; Guo, T.; Liu, Y.; Liu, Q.; Fang, Y. The Roles of Arabidopsis CDF2 in Transcriptional and Posttranscriptional Regulation of Primary MicroRNAs. PLoS Genet. 2015, 11, e1005598. [Google Scholar] [CrossRef] [Green Version]
- Dag, A.; Bustan, A.; Avni, A.; Tzipori, I.; Lavee, S.; Riov, J. Timing of Fruit Removal Affects Concurrent Vegetative Growth and Subsequent Return Bloom and Yield in Olive (Olea europaea L.). Sci. Hortic. 2010, 123, 469–472. [Google Scholar] [CrossRef]
- Sharma, N.; Singh, S.K.; Mahato, A.K.; Ravishankar, H.; Dubey, A.K.; Singh, N.K. Physiological and Molecular Basis of Alternate Bearing in Perennial Fruit Crops. Sci. Hortic. 2019, 243, 214–225. [Google Scholar] [CrossRef]
- Barranco, D.; Fernandez-Escobar, R.; Rallo, L. Olive Growing; RIRDC Australia: Bathurst, Australia, 2010; ISBN 978-1-74151-869-6. [Google Scholar]
- Turktas, M.; Inal, B.; Okay, S.; Erkilic, E.G.; Dundar, E.; Hernandez, P.; Dorado, G.; Unver, T. Nutrition Metabolism Plays an Important Role in the Alternate Bearing of the Olive Tree (Olea europaea L.). PLoS ONE 2013, 8, e59876. [Google Scholar] [CrossRef] [Green Version]
- Oliveira, C.M.; Priestley, C.A. Carbohydrate Reserves in Deciduous Fruit Trees. In Horticultural Reviews; Janick, J., Ed.; John Wiley & Sons, Inc.: Hoboken, NJ, USA, 2011; pp. 403–430. ISBN 978-1-118-06083-4. [Google Scholar]
- Yap, Y.-M.; Loh, C.-S.; Ong, B.-L. Regulation of Flower Development in Dendrobium Crumenatum by Changes in Carbohydrate Contents, Water Status and Cell Wall Metabolism. Sci. Hortic. 2008, 119, 59–66. [Google Scholar] [CrossRef]
- Xing, L.-B.; Zhang, D.; Li, Y.-M.; Shen, Y.-W.; Zhao, C.-P.; Ma, J.-J.; An, N.; Han, M.-Y. Transcription Profiles Reveal Sugar and Hormone Signaling Pathways Mediating Flower Induction in Apple (Malus Domestica Borkh.). Plant. Cell Physiol. 2015, 56, 2052–2068. [Google Scholar] [CrossRef] [PubMed] [Green Version]
- Grace, S.C.; Logan, B.A. Energy Dissipation and Radical Scavenging by the Plant Phenylpropanoid Pathway. Philos Trans. R. Soc. Lond. B Biol. Sci. 2000, 355, 1499–1510. [Google Scholar] [CrossRef] [PubMed] [Green Version]
- Mert, C.; Barut, E.; Ipek, A. Quantitative Seasonal Changes in the Leaf Phenolic Content Related to the Alternate-Bearing Patterns of Olive (Olea europaea L. Cv. Gemlik). J. Agric. Sci. Technol. 2013, 15, 995–1006. [Google Scholar]
- Shalom, L.; Samuels, S.; Zur, N.; Shlizerman, L.; Zemach, H.; Weissberg, M.; Ophir, R.; Blumwald, E.; Sadka, A. Alternate Bearing in Citrus: Changes in the Expression of Flowering Control Genes and in Global Gene Expression in ON- versus OFF-Crop Trees. PLoS ONE 2012, 7, e46930. [Google Scholar] [CrossRef] [PubMed] [Green Version]
- Andrés, F.; Kinoshita, A.; Kalluri, N.; Fernández, V.; Falavigna, V.S.; Cruz, T.M.D.; Jang, S.; Chiba, Y.; Seo, M.; Mettler-Altmann, T.; et al. The Sugar Transporter SWEET10 Acts Downstream of FLOWERING LOCUS T during Floral Transition of Arabidopsis Thaliana. BMC Plant. Biol. 2020, 20, 53. [Google Scholar] [CrossRef] [Green Version]
- Muñoz-Fambuena, N.; Mesejo, C.; González-Mas, M.C.; Primo-Millo, E.; Agustí, M.; Iglesias, D.J. Fruit Regulates Seasonal Expression of Flowering Genes in Alternate-Bearing ‘Moncada’ Mandarin. Ann. Bot. 2011, 108, 511–519. [Google Scholar] [CrossRef]
- Haberman, A.; Bakhshian, O.; Cerezo-Medina, S.; Paltiel, J.; Adler, C.; Ben-Ari, G.; Mercado, J.A.; Pliego-Alfaro, F.; Lavee, S.; Samach, A. A Possible Role for Flowering Locus T-Encoding Genes in Interpreting Environmental and Internal Cues Affecting Olive (Olea europaea L.) Flower Induction: Olive Flowering. Plant Cell Environ. 2017, 40, 1263–1280. [Google Scholar] [CrossRef]
- Sharma, M.K.; Kumar, R.; Solanke, A.U.; Sharma, R.; Tyagi, A.K.; Sharma, A.K. Identification, Phylogeny, and Transcript Profiling of ERF Family Genes during Development and Abiotic Stress Treatments in Tomato. Mol. Genet. Genom. 2010, 284, 455–475. [Google Scholar] [CrossRef]
- Licausi, F.; Ohme-Takagi, M.; Perata, P. APETALA2/Ethylene Responsive Factor (AP2/ERF) Transcription Factors: Mediators of Stress Responses and Developmental Programs. New Phytol. 2013, 199, 639–649. [Google Scholar] [CrossRef]
- Li, Z.; Wang, J.; Zhang, X.; Lei, M.; Fu, Y.; Zhang, J.; Wang, Z.; Xu, L. Transcriptome Sequencing Determined Flowering Pathway Genes in Aechmea Fasciata Treated with Ethylene. J. Plant. Growth Regul. 2016, 35, 316–329. [Google Scholar] [CrossRef]
- Liu, C.-H.; Fan, C. De Novo Transcriptome Assembly of Floral Buds of Pineapple and Identification of Differentially Expressed Genes in Response to Ethephon Induction. Front. Plant. Sci. 2016, 7. [Google Scholar] [CrossRef] [Green Version]
- Anh Tuan, P.; Bai, S.; Saito, T.; Imai, T.; Ito, A.; Moriguchi, T. Involvement of EARLY BUD-BREAK, an AP2/ERF Transcription Factor Gene, in Bud Break in Japanese Pear (Pyrus Pyrifolia Nakai) Lateral Flower Buds: Expression, Histone Modifications and Possible Target Genes. Plant. Cell Physiol. 2016, 57, 1038–1047. [Google Scholar] [CrossRef] [Green Version]
- Solomon, C.U.; Drea, S. Besides and beyond Flowering: Other Roles of EuAP2 Genes in Plant Development. Genes 2019, 10, 994. [Google Scholar] [CrossRef] [Green Version]
- Gao, J.; Zhang, Y.; Li, Z.; Liu, M. Role of Ethylene Response Factors (ERFs) in Fruit Ripening. Food Qual. Saf. 2020, 4, 15–20. [Google Scholar] [CrossRef] [Green Version]
- Li, H.; Dong, Q.; Zhao, Q.; Shi, S.; Ran, K. Isolation, Sequencing, and Expression Analysis of 30 AP2/ERF Transcription Factors in Apple. PeerJ 2020, 8, e8391. [Google Scholar] [CrossRef] [PubMed]
- Lopez, L.; Carbone, F.; Bianco, L.; Giuliano, G.; Facella, P.; Perrotta, G. Tomato Plants Overexpressing Cryptochrome 2 Reveal Altered Expression of Energy and Stress-Related Gene Products in Response to Diurnal Cues. Plant. Cell Environ. 2012, 35, 994–1012. [Google Scholar] [CrossRef] [PubMed]
- Chandler, J.; Werr, W. Dornröschen, Dornröschen-Like, and Puchi Redundantly Control Floral Meristem Identity and Organ Initiation in Arabidopsis. J. Exp. Bot. 2017, 68, 3457–3472. [Google Scholar] [CrossRef] [PubMed]
- Chandler, J.W.; Werr, W. A Phylogenetically Conserved Apetala2/Ethylene Response Factor, ERF12, Regulates Arabidopsis Floral Development. Plant. Mol. Biol. 2020, 102, 39–54. [Google Scholar] [CrossRef] [PubMed] [Green Version]
- Hirota, A.; Kato, T.; Fukaki, H.; Aida, M.; Tasaka, M. The Auxin-Regulated AP2/EREBP Gene PUCHI Is Required for Morphogenesis in the Early Lateral Root Primordium of Arabidopsis. Plant. Cell 2007, 19, 2156–2168. [Google Scholar] [CrossRef] [PubMed] [Green Version]
- Van Mourik, H.; van Dijk, A.D.J.; Stortenbeker, N.; Angenent, G.C.; Bemer, M. Divergent Regulation of Arabidopsis SAUR Genes: A Focus on the SAUR10-Clade. BMC Plant. Biol. 2017, 17, 245. [Google Scholar] [CrossRef] [PubMed] [Green Version]
- Sassaki, F.T.; Bravo, J.P.; González, E.R.; Maia, I.G. Expression Pattern and Promoter Analysis of a Eucalyptus Grandis Germin-like Gene. Plant. Mol. Biol. Rep. 2015, 33, 12–21. [Google Scholar] [CrossRef]
- Membré, N.; Berna, A.; Neutelings, G.; David, A.; David, H.; Staiger, D.; Sáez Vásquez, J.; Raynal, M.; Delseny, M.; Bernier, F. CDNA Sequence, Genomic Organization and Differential Expression of Three Arabidopsis Genes for Germin/Oxalate Oxidase-like Proteins. Plant. Mol. Biol. 1997, 35, 459–469. [Google Scholar] [CrossRef] [PubMed]
- Bernier, G.; Havelange, A.; Houssa, C.; Petitjean, A.; Lejeune, P. Physiological Signals That Induce Flowering. Plant. Cell 1993, 1147–1155. [Google Scholar] [CrossRef] [Green Version]
- Castro Marín, I.; Loef, I.; Bartetzko, L.; Searle, I.; Coupland, G.; Stitt, M.; Osuna, D. Nitrate Regulates Floral Induction in Arabidopsis, Acting Independently of Light, Gibberellin and Autonomous Pathways. Planta 2011, 233, 539–552. [Google Scholar] [CrossRef] [PubMed] [Green Version]
- Miyazaki, Y.; Maruyama, Y.; Chiba, Y.; Kobayashi, M.J.; Joseph, B.; Shimizu, K.K.; Mochida, K.; Hiura, T.; Kon, H.; Satake, A. Nitrogen as a Key Regulator of Flowering in Fagus Crenata: Understanding the Physiological Mechanism of Masting by Gene Expression Analysis. Ecol. Lett 2014, 17, 1299–1309. [Google Scholar] [CrossRef]
- Lin, Y.-L.; Tsay, Y.-F. Influence of Differing Nitrate and Nitrogen Availability on Flowering Control in Arabidopsis. J. Exp. Bot. 2017, 68, 2603–2609. [Google Scholar] [CrossRef] [Green Version]
- Krouk, G.; Crawford, N.M.; Coruzzi, G.M.; Tsay, Y.-F. Nitrate Signaling: Adaptation to Fluctuating Environments. Curr. Opin. Plant. Biol. 2010, 13, 266–273. [Google Scholar] [CrossRef]
- Gras, D.E.; Vidal, E.A.; Undurraga, S.F.; Riveras, E.; Moreno, S.; Dominguez-Figueroa, J.; Alabadi, D.; Blázquez, M.A.; Medina, J.; Gutiérrez, R.A. SMZ/SNZ and Gibberellin Signaling Are Required for Nitrate-Elicited Delay of Flowering Time in Arabidopsis Thaliana. J. Exp. Bot. 2018, 69, 619–631. [Google Scholar] [CrossRef]
- Krouk, G.; Lacombe, B.; Bielach, A.; Perrine-Walker, F.; Malinska, K.; Mounier, E.; Hoyerova, K.; Tillard, P.; Leon, S.; Ljung, K.; et al. Nitrate-Regulated Auxin Transport by NRT1.1 Defines a Mechanism for Nutrient Sensing in Plants. Dev. Cell 2010, 18, 927–937. [Google Scholar] [CrossRef]
- Kanno, Y.; Hanada, A.; Chiba, Y.; Ichikawa, T.; Nakazawa, M.; Matsui, M.; Koshiba, T.; Kamiya, Y.; Seo, M. Identification of an Abscisic Acid Transporter by Functional Screening Using the Receptor Complex as a Sensor. Proc. Natl. Acad. Sci. USA 2012, 109, 9653–9658. [Google Scholar] [CrossRef] [Green Version]
- Chiba, Y.; Shimizu, T.; Miyakawa, S.; Kanno, Y.; Koshiba, T.; Kamiya, Y.; Seo, M. Identification of Arabidopsis Thaliana NRT1/PTR FAMILY (NPF) Proteins Capable of Transporting Plant Hormones. J. Plant. Res. 2015, 128, 679–686. [Google Scholar] [CrossRef]
- Inoue, S.-I.; Takahashi, K.; Okumura-Noda, H.; Kinoshita, T. Auxin Influx Carrier AUX1 Confers Acid Resistance for Arabidopsis Root Elongation Through the Regulation of Plasma Membrane H+-ATPase. Plant. Cell Physiol. 2016, 57, 2194–2201. [Google Scholar] [CrossRef] [PubMed] [Green Version]
- Li, H.; Yu, M.; Du, X.-Q.; Wang, Z.-F.; Wu, W.-H.; Quintero, F.J.; Jin, X.-H.; Li, H.-D.; Wang, Y. NRT1.5/NPF7.3 Functions as a Proton-Coupled H+/K+ Antiporter for K+ Loading into the Xylem in Arabidopsis. Plant. Cell 2017, 29, 2016–2026. [Google Scholar] [CrossRef] [PubMed] [Green Version]
- Satake, A.; Kawatsu, K.; Teshima, K.; Kabeya, D.; Han, Q. Field Transcriptome Revealed a Novel Relationship between Nitrate Transport and Flowering in Japanese Beech. Sci. Rep. 2019, 9, 4325. [Google Scholar] [CrossRef] [PubMed]
- Tiwari, S.B.; Shen, Y.; Chang, H.-C.; Hou, Y.; Harris, A.; Ma, S.F.; McPartland, M.; Hymus, G.J.; Adam, L.; Marion, C.; et al. The Flowering Time Regulator CONSTANS Is Recruited to the FLOWERING LOCUS T Promoter via a Unique Cis-Element. New Phytol. 2010, 187, 57–66. [Google Scholar] [CrossRef]
- Song, Y.H.; Estrada, D.A.; Johnson, R.S.; Kim, S.K.; Lee, S.Y.; MacCoss, M.J.; Imaizumi, T. Distinct Roles of FKF1, Gigantea, and Zeitlupe Proteins in the Regulation of Constans Stability in Arabidopsis Photoperiodic Flowering. Proc. Natl. Acad. Sci. USA 2014, 111, 17672–17677. [Google Scholar] [CrossRef] [Green Version]
- Luccioni, L.; Krzymuski, M.; Sánchez-Lamas, M.; Karayekov, E.; Cerdán, P.D.; Casal, J.J. Constans Delays Arabidopsis Flowering under Short Days. Plant. J. 2019, 97, 923–932. [Google Scholar] [CrossRef] [PubMed]
- Onouchi, H.; Igeño, M.I.; Périlleux, C.; Graves, K.; Coupland, G. Mutagenesis of Plants Overexpressing Constans Demonstrates Novel Interactions among Arabidopsis Flowering-Time Genes. Plant. Cell 2000, 12, 885–900. [Google Scholar] [CrossRef] [Green Version]
- Portolés, S.; Zhang, D.-P. ABA Signaling and Circadian Clock. In Abscisic Acid: Metabolism, Transport and Signaling; Zhang, D.-P., Ed.; Springer: Dordrecht, The Netherlands, 2014; pp. 385–407. ISBN 978-94-017-9423-7. [Google Scholar]
- Riboni, M.; Galbiati, M.; Tonelli, C.; Conti, L. Gigantea Enables Drought Escape Response via Abscisic Acid-Dependent Activation of the Florigens and Suppressor of Overexpression of Constans. Plant. Physiol. 2013, 162, 1706–1719. [Google Scholar] [CrossRef] [Green Version]
- Conti, L.; Galbiati, M.; Tonelli, C. ABA and the Floral Transition. In Abscisic Acid: Metabolism, Transport and Signaling; Zhang, D.-P., Ed.; Springer: Dordrecht, The Netherlands, 2014; pp. 365–384. ISBN 978-94-017-9423-7. [Google Scholar]
- Chen, X. A MicroRNA as a Translational Repressor of APETALA2 in Arabidopsis Flower Development. Science 2004, 303, 2022–2025. [Google Scholar] [CrossRef] [Green Version]
- Aukerman, M.J.; Sakai, H. Regulation of Flowering Time and Floral Organ Identity by a MicroRNA and Its APETALA2-like Target Genes. Plant. Cell 2003, 15, 2730–2741. [Google Scholar] [CrossRef] [PubMed] [Green Version]
- Wu, G.; Poethig, R.S. Temporal Regulation of Shoot Development in Arabidopsis Thaliana by MiR156 and Its Target SPL3. Development 2006, 133, 3539–3547. [Google Scholar] [CrossRef] [PubMed] [Green Version]
- Chuck, G.; Cigan, A.M.; Saeteurn, K.; Hake, S. The Heterochronic Maize Mutant Corngrass1 Results from Overexpression of a Tandem MicroRNA. Nat. Genet. 2007, 39, 544–549. [Google Scholar] [CrossRef] [PubMed]


| Sample | Raw Reads | HQ Filtered Reads | HQ Filtered Reads % | EdgeR Quasi-Likelihood | DEXSeq | ||
|---|---|---|---|---|---|---|---|
| Mapped Reads | Mapped Reads % | Mapped Reads | Mapped Reads % | ||||
| July_ON_I | 40,593,053 | 31,569,903 | 77.77 | 29,714,448 | 94.12 | 25,315,943 | 80.19 |
| July_ON_II | 42,108,562 | 33,459,722 | 79.46 | 31,458,822 | 94.02 | 27,065,303 | 80.89 |
| July_ON_III | 26,150,715 | 20,443,071 | 78.17 | 19,201,031 | 93.92 | 16,352,358 | 79.99 |
| July_OFF_I | 33,840,148 | 25,637,894 | 75.76 | 24,124,474 | 94.10 | 20,388,017 | 79.52 |
| July_OFF_II | 33,269,865 | 25,739,109 | 77.36 | 24,244,597 | 94.19 | 20,809,948 | 80.85 |
| July_OFF_III | 30,811,350 | 24,090,568 | 78.19 | 22,582,687 | 93.74 | 19,165,647 | 79.56 |
| March_ON_I | 33,180,348 | 25,694,796 | 77.44 | 24,725,540 | 96.23 | 20,284,894 | 78.95 |
| March_ON_II | 36,289,476 | 28,672,112 | 79.01 | 27,511,974 | 95.95 | 22,778,612 | 79.45 |
| March_ON_III | 44,132,732 | 34,442,821 | 78.04 | 33,109,833 | 96.13 | 27,411,604 | 79.59 |
| March_OFF_I | 35,659,418 | 27,479,198 | 77.06 | 26,466,879 | 96.32 | 21,998,929 | 80.06 |
| March_OFF_II | 46,213,740 | 36,374,337 | 78.71 | 35,027,996 | 96.30 | 28,777,594 | 79.12 |
| March_OFF_III | 70,730,485 | 53,597,630 | 75.78 | 51,571,178 | 96.22 | 42,877,173 | 80.00 |
| Total | 472,979,892 | 367,201,161 | 77.64 | 349,739,459 | 95.24 | 293,226,022 | 79.85 |
| Gene_ID | Annotation | Gene Ontology Terms | FC | p-Value | FDR | |
|---|---|---|---|---|---|---|
| July | ||||||
| Ethylene transcription factor | OE6A116298 | ethylene-responsive transcription factor ERF086 | DNA binding (GO: 0003677); DNA-binding transcription factor activity (GO: 0003700); transcription regulator complex (GO: 0005667); regulation of transcription, DNA-templated (GO: 0006355); flower development (GO: 0009908) | −2.12 | 6.10 × 10⁻³ | 3.87 × 10⁻² |
| OE6A055915 | AP2-like ethylene-responsive transcription factor AIL6 | DNA binding (GO: 0003677); DNA-binding transcription factor activity (GO: 0003700); transcription regulator complex (GO: 0005667); regulation of transcription, DNA-templated (GO: 0006355) | −5.67 | 2.34 × 10⁻⁵ | 4.37 × 10⁻⁴ | |
| OE6A007177 | AP2-like ethylene-responsive transcription factor AIL6 | DNA binding (GO: 0003677); DNA-binding transcription factor activity (GO: 0003700); transcription regulator complex (GO: 0005667); regulation of transcription, DNA-templated (GO: 0006355) | −4.67 | 1.01 × 10⁻⁴ | 1.48 × 10⁻³ | |
| OE6A096297 | AP2 ERF and B3 domain-containing transcription factor RAV1-like | DNA binding (GO: 0003677); DNA-binding transcription factor activity (GO: 0003700); nucleus (GO: 0005634); transcription regulator complex (GO: 0005667); regulation of transcription, DNA-templated (GO: 0006355) | 2.01 | 6.98 × 10⁻⁵ | 1.08 × 10⁻³ | |
| Auxin binding and transport | OE6A036310 | auxin-binding ABP19a-like | cell wall (GO: 0005618); auxin-activated signaling pathway (GO: 0009734); manganese ion binding (GO: 0030145); nutrient reservoir activity (GO: 0045735); apoplast (GO: 0048046) | −4.83 | 2.48 × 10⁻³ | 1.94 × 10⁻² |
| OE6A020847 | auxin-induced 15A-like | response to auxin (GO: 0009733); integral component of membrane (GO: 0016021) | −25.06 | 1.21 × 10⁻³ | 1.10 × 10⁻² | |
| OE6A102373 | auxin-induced AUX22-like | protein binding (GO: 0005515); regulation of cellular process (GO: 0050794) | −3.09 | 6.34 × 10⁻³ | 3.97 × 10⁻² | |
| OE6A086941 | auxin-responsive SAUR32-like | response to auxin (GO: 0009733) | −4.18 | 9.82 × 10⁻⁶ | 2.10 × 10⁻⁴ | |
| OE6A112705 | PIN-LIKES 7 | integral component of membrane (GO: 0016021); transmembrane transport (GO: 0055085) | −2.77 | 6.58 × 10⁻³ | 4.09 × 10⁻² | |
| Metabolism and transport of carbohydrates | OE6A090116 | β-galactosidase-like | β-galactosidase activity (GO: 0004565); cell wall (GO: 0005618); vacuole (GO: 0005773); galactose metabolic process (GO: 0006012); glycosaminoglycan catabolic process (GO: 0006027); glycosphingolipid metabolic process (GO: 0006687); β-galactosidase complex (GO: 0009341); carbohydrate binding (GO: 0030246); glycerolipid metabolic process (GO: 0046486) | −2.02 | 1.72 × 10⁻³ | 1.46 × 10⁻² |
| OE6A066563 | bidirectional sugar transporter N3-like | carbohydrate transport (GO: 0008643); integral component of membrane (GO: 0016021); sugar transmembrane transporter activity (GO: 0051119) | −22.11 | 5.11 × 10⁻³³ | 1.87 × 10⁻²⁸ | |
| OE6A090057 | stachyose synthase | galactose metabolic process (GO: 0006012); galactinol-raffinose galactosyltransferase activity (GO: 0047268) | −3.03 | 8.25 × 10⁻⁷ | 2.63 × 10⁻⁵ | |
| OE6A012151 | β-D-xylosidase 1-like | starch metabolic process (GO: 0005982); sucrose metabolic process (GO: 0005985); xylan 1,4-β-xylosidase activity (GO: 0009044); nucleotide metabolic process (GO: 0009117); plant-type cell wall (GO: 0009505); arabinan catabolic process (GO: 0031222); xylan catabolic process (GO: 0045493); α-L-arabinofuranosidase activity (GO: 0046556) | −2.50 | 9.08 × 10⁻⁶ | 1.97 × 10⁻⁴ | |
| OE6A077201 | β-fructofuranosidase | sucrose α-glucosidase activity (GO: 0004575); starch metabolic process (GO: 0005982); sucrose metabolic process (GO: 0005985); integral component of membrane (GO: 0016021); glucosidase II complex (GO: 0017177) | −2.36 | 7.86 × 10⁻⁴ | 7.87 × 10⁻³ | |
| Cell wall metabolism | OE6A074261 | expansin A1 | extracellular region (GO: 0005576); cell wall (GO: 0005618); plant-type cell wall organization (GO: 0009664); membrane (GO: 0016020) | −2.86 | 3.20 × 10⁻⁴ | 3.81 × 10⁻³ |
| OE6A056682 | glucan endo-1 | starch metabolic process (GO: 0005982); sucrose metabolic process (GO: 0005985); polysaccharide binding (GO: 0030247); glucan endo-1,3-β-D-glucosidase activity (GO: 0042973); anchored component of plasma membrane (GO: 0046658) | −19.66 | 6.80 × 10⁻⁵ | 1.06 × 10⁻³ | |
| OE6A060375 | expansin-A5-like isoform X2 | extracellular region (GO: 0005576); cell wall (GO: 0005618); plant-type cell wall organization (GO: 0009664); unidimensional cell growth (GO: 0009826); membrane (GO: 0016020); primary root development (GO: 0080022) | −2.56 | 1.59 × 10⁻⁸ | 8.72 × 10⁻⁷ | |
| OE6A105425 | expansin-A10 isoform X1 | extracellular region (GO: 0005576); cell wall (GO: 0005618); plant-type cell wall organization (GO: 0009664); membrane (GO: 0016020) | −4.26 | 2.07 × 10⁻¹⁰ | 2.06 × 10⁻⁸ | |
| OE6A118180 | glucan endo-1 | hydrolase activity, hydrolyzing O-glycosyl compounds (GO: 0004553); carbohydrate metabolic process (GO: 0005975); starch metabolic process (GO: 0005982); sucrose metabolic process (GO: 0005985); polysaccharide binding (GO: 0030247); glucan endo-1,3-β-D-glucosidase activity (GO: 0042973); anchored component of plasma membrane (GO: 0046658) | −2.45 | 6.39 × 10⁻²⁰ | 8.98 × 10⁻¹⁷ | |
| OE6A021910 | xyloglucan glycosyltransferase 4 | starch metabolic process (GO: 0005982); sucrose metabolic process (GO: 0005985); UDP-glucose metabolic process (GO: 0006011); integral component of membrane (GO: 0016021); cellulose synthase (UDP-forming) activity (GO: 0016760); cellulose biosynthetic process (GO: 0030244) | −2.23 | 3.25 × 10⁻⁴ | 3.86 × 10⁻³ | |
| OE6A046955 | expansin-B3-like | extracellular region (GO: 0005576); sexual reproduction (GO: 0019953) | −3.01 | 1.26 × 10⁻³ | 1.14 × 10⁻² | |
| OE6A048399 | wall-associated receptor kinase 3-like | polysaccharide binding (GO: 0030247) | −2.72 | 2.64 × 10⁻³ | 2.04 × 10⁻² | |
| OE6A021910 | xyloglucan glycosyltransferase 4 | starch metabolic process (GO: 0005982); sucrose metabolic process (GO: 0005985); UDP-glucose metabolic process (GO: 0006011); integral component of membrane (GO: 0016021); cellulose synthase (UDP-forming) activity (GO: 0016760); cellulose biosynthetic process (GO: 0030244) | −2.23 | 3.25 × 10⁻⁴ | 3.86 × 10⁻³ | |
| Metabolism and transport of phenylpropanoids | OE6A055711 | pelargonidin 3-O-(6-caffeoylglucoside) 5-O-(6-O-malonylglucoside) 4 -malonyltransferase-like | transferase activity, transferring acyl groups other than amino-acyl groups (GO: 0016747) | −2.16 | 7.52 × 10⁻⁴ | 7.58 × 10⁻³ |
| OE6A120332 | anthocyanidin 3-O-glucosyltransferase 5-like | metabolic process (GO: 0008152); transferase activity, transferring hexosyl groups (GO: 0016758) | −7.17 | 3.01 × 10⁻¹⁰ | 2.84 × 10⁻⁸ | |
| OE6A053282 | anthocyanidin 3-O-glucosyltransferase 2-like | metabolic process (GO: 0008152); integral component of membrane (GO: 0016021); transferase activity, transferring hexosyl groups (GO: 0016758) | −2.15 | 6.11 × 10⁻¹⁵ | 2.63 × 10⁻¹² | |
| OE6A106148 | 2-hydroxyisoflavanone dehydratase-like | metabolic process (GO: 0008152); hydrolase activity (GO: 0016787) | −2.08 | 1.28 × 10⁻⁷ | 5.31 × 10⁻⁶ | |
| OE6A085084 | (-)-isopiperitenol (-)-carveol dehydrogenase | oxidoreductase activity (GO: 0016491) | −2.17 | 8.70 × 10⁻¹² | 1.30 × 10⁻⁹ | |
| OE6A072403 | terpene synthase 10-like | magnesium ion binding (GO: 0000287); metabolic process (GO: 0008152); terpene synthase activity (GO: 0010333) | −3.74 | 1.80 × 10⁻¹² | 3.20 × 10⁻¹⁰ | |
| March | ||||||
| Ethylene signalling | OE6A052171 | ethylene receptor2 | phosphorelay sensor kinase activity (GO: 0000155); protein binding (GO: 0005515); endoplasmic reticulum membrane (GO: 0005789); protein histidine kinase complex (GO: 0009365); negative regulation of ethylene-activated signaling pathway (GO: 0010105); integral component of membrane (GO: 0016021); peptidyl-histidine phosphorylation (GO: 0018106); ethylene receptor activity (GO: 0038199); ethylene binding (GO: 0051740) | 2.66 | 5.85 × 10⁻¹⁷ | 1.13 × 10⁻¹⁴ |
| Photoperception and flowering control | OE6A024312 | LHY like isoform X1 | DNA binding (GO: 0003677); regulation of transcription, DNA-templated (GO: 0006355); negative regulation of biological process (GO: 0048519) | −2.60 | 1.84 × 10⁻²⁹ | 1.20 × 10⁻²⁵ |
| OE6A037580 | LHY-like isoform X1 | DNA binding (GO: 0003677); regulation of transcription, DNA-templated (GO: 0006355) | −5.83 | 2.88 × 10−38 | 1.05 × 10⁻³³ | |
| OE6A001646 | transcription factor myb56 | DNA binding (GO: 0003677) | 2.25 | 7.05 × 10⁻¹² | 3.79 × 10⁻¹⁰ | |
| OE6A020966 | transcription factor myb86 | DNA binding (GO: 0003677) | −2.10 | 1.17 × 10⁻³ | 5.52 × 10⁻³ | |
| OE6A052015 | MYB-like transcription factor REVEILLE 8 | DNA binding (GO: 0003677); nucleus (GO: 0005634); regulation of transcription, DNA-templated (GO: 0006355) | −2.12 | 1.10 × 10⁻²⁰ | 6.37 × 10⁻¹⁸ | |
| OE6A062062 | UV resistance locus 8 | NA | −2.06 | 1.49 × 10⁻²⁴ | 2.48 × 10⁻²¹ | |
| OE6A106023 | UV resistance locus 8 | NA | −2.97 | 1.56 × 10⁻¹⁶ | 2.81 × 10⁻¹⁴ | |
| OE6A036299 | UV resistance locus 8 | NA | −2.61 | 1.97 × 10⁻²⁹ | 1.20 × 10⁻²⁵ | |
| OE6A104771 | cyclic dof factor 1-like | DNA binding (GO: 0003677); regulation of transcription, DNA-templated (GO: 0006355) | −3.98 | 1.79 × 10⁻¹⁷ | 3.89 × 10⁻¹⁵ | |
| OE6A021342 | cyclic dof factor 1-like | DNA binding (GO: 0003677); regulation of transcription, DNA-templated (GO: 0006355) | −2.22 | 4.30 × 10⁻¹³ | 3.18 × 10⁻¹¹ | |
| OE6A085809 | cyclic dof factor 2-like | DNA binding (GO: 0003677); regulation of transcription, DNA-templated (GO: 0006355) | −2.31 | 1.42 × 10⁻¹⁶ | 2.57 × 10⁻¹⁴ | |
| OE6A085809 | cyclic dof factor 2-like | DNA binding (GO: 0003677); regulation of transcription, DNA-templated (GO: 0006355) | −2.31 | 1.42 × 10⁻¹⁶ | 2.57 × 10⁻¹⁴ | |
| OE6A062062 | ultraviolet-B receptor UVR8 | NA | −2.06 | 1.49 × 10⁻²⁴ | 2.48 × 10⁻²¹ | |
| OE6A103537 | flowering locus T | phosphatidylethanolamine binding (GO: 0008429); regulation of flower development (GO: 0009909); photoperiodism, flowering (GO: 0048573) | −1.48 | 3.96 × 10⁻⁴ | 2.26 × 10⁻³ | |
| OE6A043940 | zinc finger CONSTANS-LIKE 6 | protein binding (GO: 0005515) | 3.67 | 4.24 × 10⁻⁶ | 4.52 × 10⁻⁵ | |
| OE6A111642 | zinc finger CONSTANS-LIKE 10-like isoform X1 | protein binding (GO: 0005515); intracellular anatomical structure (GO: 0005622); zinc ion binding (GO: 0008270) | 2.47 | 1.29 × 10⁻¹⁰ | 4.93 × 10⁻⁹ | |
| OE6A061348 | zinc finger CONSTANS-LIKE 9-like | protein binding (GO: 0005515); intracellular anatomical structure (GO: 0005622); zinc ion binding (GO: 0008270) | 3.70 | 5.65 × 10⁻¹⁸ | 1.48 × 10⁻¹⁵ | |
| OE6A061639 | zinc finger CONSTANS-LIKE 16-like | protein binding (GO: 0005515); intracellular anatomical structure (GO: 0005622); zinc ion binding (GO: 0008270) | 2.25 | 1.25 × 10⁻¹⁰ | 4.81 × 10⁻⁹ | |
| OE6A082516 | zinc finger CONSTANS-LIKE 2-like | protein binding (GO: 0005515); intracellular anatomical structure (GO: 0005622); nucleus (GO: 0005634); zinc ion binding (GO: 0008270); response to light stimulus (GO: 0009416); regulation of flower development (GO: 0009909) | −2.37 | 4.09 × 10⁻¹⁹ | 1.47 × 10⁻¹⁶ | |
| Gibberellin metabolism | OE6A120203 | gibberellin 2-β-dioxygenase 2-like | 2-oxoglutarate-dependent dioxygenase activity (GO: 0016706); metal ion binding (GO: 0046872); obsolete oxidation-reduction process (GO: 0055114); organic substance metabolic process (GO: 0071704) | 2.44 | 1.36 × 10⁻⁷ | 2.27 × 10⁻⁶ |
| Abscisic acid metabolism | OE6A091606 | abscisic acid 8-hydroxylase 2 | monooxygenase activity (GO: 0004497); iron ion binding (GO: 0005506);integral component of membrane (GO: 0016021);oxidoreductase activity, acting on paired donors, with incorporation or reduction of molecular oxygen (GO: 0016705);heme binding (GO: 0020037);obsolete oxidation-reduction process (GO: 0055114) | 2.23 | 2.71 × 10⁻⁴ | 1.64 × 10⁻³ |
| Nitrate transporter | OE6A086620 | NRT1-PTR nitrate transporter | transporter activity (GO: 0005215); transport (GO: 0006810); integral component of membrane (GO: 0016021) | −3.44 | 6.27 × 10⁻¹⁵ | 7.91 × 10⁻¹³ |
| OE6A054819 | NRT1-PTR nitrate transporter | transporter activity (GO: 0005215); transport (GO: 0006810); integral component of membrane (GO: 0016021) | −3.73 | 4.08 × 10⁻¹⁵ | 5.41 × 10⁻¹³ | |
| OE6A047446 | NRT1/PTR family-like | transporter activity (GO: 0005215); oligopeptide transport (GO: 0006857); integral component of membrane (GO: 0016021) | −2.69 | 1.44 × 10⁻⁵ | 1.32 × 10⁻⁴ | |
| Metabolism and transport of carbohydrates | OE6A012642 | bidirectional sugar transporter SWEET12-like | plasma membrane (GO: 0005886); carbohydrate transport (GO: 0008643); integral component of membrane (GO: 0016021) | −2.31 | 9.01 × 10⁻³ | 2.94 × 10⁻² |
| OE6A006122 | UDP-galactose UDP-glucose transporter 4 | carbohydrate transport (GO: 0008643); integral component of membrane (GO: 0016021); integral component of Golgi membrane (GO: 0030173); integral component of endoplasmic reticulum membrane (GO: 0030176); 3′-phosphoadenosine 5′-phosphosulfate transmembrane transporter activity (GO: 0046964); transmembrane transport (GO: 0055085); 3′-phospho-5′-adenylyl sulfate transmembrane transport (GO: 1902559) | −2.12 | 4.02 × 10⁻²¹ | 2.82 × 10⁻¹⁸ | |
| OE6A058275 | probable sucrose-phosphate synthase 2 | Golgi apparatus (GO: 0005794); starch metabolic process (GO: 0005982); sucrose metabolic process (GO: 0005985); sucrose biosynthetic process (GO: 0005986); L-phenylalanine metabolic process (GO: 0006558); tyrosine metabolic process (GO: 0006570); sucrose synthase activity (GO: 0016157); sucrose-phosphate synthase activity (GO: 0046524); glutamine N-phenylacetyltransferase activity (GO: 0047947) | −2.16 | 2.96 × 10⁻¹⁴ | 3.09 × 10⁻¹² | |
| OE6A071301 | UDP-glucose 6-dehydrogenase 1-like | UDP-glucose 6-dehydrogenase activity (GO: 0003979); starch metabolic process (GO: 0005982); sucrose metabolic process (GO: 0005985); nucleotide metabolic process (GO: 0009117); NAD binding (GO: 0051287); obsolete oxidation-reduction process (GO: 0055114) | −3.18 | 8.59 × 10⁻⁹ | 1.98 × 10⁻⁷ | |
| OE6A084556 | β-galactosidase 16-like | β-galactosidase activity (GO: 0004565); cell wall (GO: 0005618); vacuole (GO: 0005773); galactose metabolic process (GO: 0006012); glycosaminoglycan catabolic process (GO: 0006027); glycosphingolipid metabolic process (GO: 0006687); β-galactosidase complex (GO: 0009341); carbohydrate binding (GO: 0030246); glycerolipid metabolic process (GO: 0046486) | −2.32 | 9.87 × 10⁻²¹ | 5.92 × 10⁻¹⁸ | |
| OE6A061003 | fructose-1 | fructose catabolic process (GO: 0006001); mannose metabolic process (GO: 0006013);gluconeogenesis (GO: 0006094); glycolytic process (GO: 0006096); pentose-phosphate shunt (GO: 0006098); chloroplast (GO: 0009507); carbon utilization (GO: 0015976); dephosphorylation (GO: 0016311); reductive pentose-phosphate cycle (GO: 0019253); 2-alkenal reductase [NAD(P) + ] activity (GO: 0032440); fructose 1,6-bisphosphate 1-phosphatase activity (GO: 0042132); metal ion binding (GO: 0046872); obsolete oxidation-reduction process (GO: 0055114) | −2.05 | 6.82 × 10⁻⁵ | 5.07 × 10⁻⁴ | |
| OE6A019327 | NDR1 HIN1 26 | membrane (GO: 0016020) | −2.06 | 5.99 × 10⁻³ | 2.12 × 10⁻² | |
| OE6A085951 | stachyose synthase-like | galactose metabolic process (GO: 0006012); galactinol-raffinose galactosyltransferase activity (GO: 0047268) | −3.48 | 4.88 × 10⁻⁶ | 5.12 × 10⁻⁵ | |
| OE6A035536 | NDR1 HIN1 26 | integral component of membrane (GO: 0016021) | −2.04 | 7.25 × 10⁻³ | 2.48 × 10⁻² | |
| OE6A035740 | O-fucosyltransferase 19-like | cytoplasm (GO: 0005737); integral component of membrane (GO: 0016021) | −2.75 | 1.23 × 10⁻⁷ | 2.07 × 10⁻⁶ | |
| OE6A055193 | NADP-dependent D-sorbitol-6-phosphate dehydrogenase | aldose-6-phosphate reductase (NADPH) activity (GO: 0047641); obsolete oxidation-reduction process (GO: 0055114) | −2.76 | 6.69 × 10⁻³¹ | 8.15 × 10⁻²⁷ | |
| Cell wall metabolism | OE6A100291 | xyloglucan endotransglycosylase hydrolase | hydrolase activity, hydrolyzing O-glycosyl compounds (GO: 0004553); cell wall (GO: 0005618); xyloglucan metabolic process (GO: 0010411); xyloglucan:xyloglucosyl transferase activity (GO: 0016762); cell wall biogenesis (GO: 0042546); apoplast (GO: 0048046); cell wall organization (GO: 0071555) | −2.19 | 4.00 × 10⁻²⁰ | 1.93 × 10⁻¹⁷ |
| OE6A117660 | xyloglucan endotransglucosylase hydrolase 2-like | hydrolase activity, hydrolyzing O-glycosyl compounds (GO: 0004553); cell wall (GO: 0005618); xyloglucan metabolic process (GO: 0010411); xyloglucan:xyloglucosyl transferase activity (GO: 0016762); cell wall biogenesis (GO: 0042546); apoplast (GO: 0048046) | −2.45 | 4.33 × 10⁻⁷ | 6.26 × 10⁻⁶ | |
| OE6A112971 | Glucan 1 | hydrolase activity, hydrolyzing O-glycosyl compounds (GO: 0004553); carbohydrate metabolic process (GO: 0005975) | −2.93 | 1.64 × 10⁻²⁵ | 3.34 × 10⁻²² | |
| OE6A053366 | probable pectate lyase 5 | pectate lyase activity (GO: 0030570); pectin catabolic process (GO: 0045490); metal ion binding (GO: 0046872) | −2.19 | 4.88 × 10⁻¹⁹ | 1.72 × 10⁻¹⁶ | |
| OE6A014742 | β-glucosidase-like | hydrolase activity, hydrolyzing O-glycosyl compounds (GO: 0004553); carbohydrate metabolic process (GO: 0005975) | −2.28 | 3.24 × 10⁻⁶ | 3.58 × 10⁻⁵ | |
| OE6A100291 | xyloglucan endotransglycosylase hydrolase | hydrolase activity, hydrolyzing O-glycosyl compounds (GO: 0004553); cell wall (GO: 0005618); xyloglucan metabolic process (GO: 0010411); xyloglucan:xyloglucosyl transferase activity (GO: 0016762); cell wall biogenesis (GO: 0042546); apoplast (GO: 0048046); cell wall organization (GO: 0071555) | −2.19 | 4.00 × 10⁻²⁰ | 1.93 × 10⁻¹⁷ | |
| OE6A117660 | xyloglucan endotransglucosylase hydrolase 2-like | hydrolase activity, hydrolyzing O-glycosyl compounds (GO: 0004553); cell wall (GO: 0005618); xyloglucan metabolic process (GO: 0010411); xyloglucan:xyloglucosyl transferase activity (GO: 0016762); cell wall biogenesis (GO: 0042546); apoplast (GO: 0048046) | −2.45 | 4.33 × 10⁻⁷ | 6.26 × 10⁻⁶ | |
| OE6A024144 | cellulose synthase G3 | starch metabolic process (GO: 0005982); sucrose metabolic process (GO: 0005985); UDP-glucose metabolic process (GO: 0006011); integral component of membrane (GO: 0016021); cellulose synthase (UDP-forming) activity (GO: 0016760); cellulose biosynthetic process (GO: 0030244); cell wall organization (GO: 0071555) | −3.03 | 2.31 × 10⁻⁵ | 1.97 × 10⁻⁴ | |
| OE6A058805 | endoglucanase 12 | starch metabolic process (GO: 0005982); sucrose metabolic process (GO: 0005985); cellulase activity (GO: 0008810); integral component of membrane (GO: 0016021); cellulose catabolic process (GO: 0030245) | −2.15 | 1.92 × 10⁻³ | 8.31 × 10⁻³ | |
| OE6A104762 | probable xyloglucan endotransglucosylase hydrolase 23 | hydrolase activity, hydrolyzing O-glycosyl compounds (GO: 0004553); cell wall (GO: 0005618); xyloglucan metabolic process (GO: 0010411); xyloglucan:xyloglucosyl transferase activity (GO: 0016762); cell wall biogenesis (GO: 0042546); apoplast (GO: 0048046); cell wall organization (GO: 0071555) | −2.00 | 8.11 × 10⁻¹⁰ | 2.51 × 10⁻⁸ | |
| OE6A076685 | phospho-2-dehydro-3-deoxyheptonate aldolase 2 | tryptophan biosynthetic process (GO: 0000162); 3-deoxy-7-phosphoheptulonate synthase activity (GO: 0003849); tyrosine biosynthetic process (GO: 0006571); L-phenylalanine biosynthetic process (GO: 0009094); chloroplast thylakoid (GO: 0009534) | −2.46 | 2.56 × 10⁻⁵ | 2.16 × 10⁻⁴ | |
| Metabolism and transport of phenylpropanoids | OE6A074244 | cannabidiolic acid synthase-like | oxidoreductase activity, acting on CH-OH group of donors (GO: 0016614); flavin adenine dinucleotide binding (GO: 0050660); obsolete oxidation-reduction process (GO: 0055114) | −2.14 | 1.90 × 10⁻¹⁰ | 6.93 × 10⁻⁹ |
| OE6A080485 | α-farnesene synthase | magnesium ion binding (GO: 0000287); metabolic process (GO: 0008152); terpene synthase activity (GO: 0010333) | −2.02 | 1.24 × 10⁻¹⁹ | 5.14 × 10⁻¹⁷ | |
| OE6A038167 | secoisolariciresinol dehydrogenase-like | oxidoreductase activity (GO: 0016491) | −2.19 | 3.09 × 10⁻²⁰ | 1.57 × 10⁻¹⁷ | |
| OE6A025381 | zeaxanthin epoxidase | protein binding (GO: 0005515); response to heat (GO: 0009408); response to water deprivation (GO: 0009414); chloroplast thylakoid membrane (GO: 0009535); zeaxanthin epoxidase [overall] activity (GO: 0009540); abscisic acid biosynthetic process (GO: 0009688); xanthophyll biosynthetic process (GO: 0016123); chloroplast membrane (GO: 0031969); secondary metabolite biosynthetic process (GO: 0044550); zeaxanthin epoxidase activity (GO: 0052662); antheraxanthin epoxidase activity (GO: 0052663); obsolete oxidation-reduction process (GO: 0055114) | −2.03 | 3.39 × 10⁻⁸ | 6.73 × 10⁻⁷ | |
| OE6A057061 | secoisolariciresinol dehydrogenase-like | oxidoreductase activity (GO: 0016491) | −2.16 | 4.25 × 10⁻¹⁹ | 1.51 × 10⁻¹⁶ | |
| OE6A097656 | (-)-germacrene D synthase | magnesium ion binding (GO: 0000287); metabolic process (GO: 0008152); terpene synthase activity (GO: 0010333) | −2.12 | 3.86 × 10⁻²⁰ | 1.89 × 10⁻¹⁷ | |
| OE6A015761 | secoisolariciresinol dehydrogenase-like | oxidoreductase activity (GO: 0016491) | −2.39 | 5.77 × 10⁻¹⁴ | 5.54 × 10⁻¹² | |
| OE6A104708 | myrcene synthase | magnesium ion binding (GO: 0000287); metabolic process (GO: 0008152); terpene synthase activity (GO: 0010333) | −2.51 | 5.87 × 10⁻³ | 2.08 × 10⁻² | |
| OE6A081156 | flavone synthase II | iron ion binding (GO: 0005506); integral component of membrane (GO: 0016021); oxidoreductase activity, acting on paired donors, with incorporation or reduction of molecular oxygen, NAD(P)H as one donor, and incorporation of one atom of oxygen (GO: 0016709); heme binding (GO: 0020037); secondary metabolite biosynthetic process (GO: 0044550); obsolete oxidation-reduction process (GO: 0055114) | −2.03 | 3.54 × 10⁻¹⁷ | 7.14 × 10⁻¹⁵ | |
| OE6A093474 | 2-hydroxyisoflavanone dehydratase-like | metabolic process (GO: 0008152); hydrolase activity (GO: 0016787) | −2.38 | 8.61 × 10⁻¹⁷ | 1.59 × 10⁻¹⁴ | |
| OE6A063869 | diihydroflavonol 4-reductase | anthocyanin-containing compound biosynthetic process (GO: 0009718); integral component of membrane (GO: 0016021); dihydrokaempferol 4-reductase activity (GO: 0045552); obsolete coenzyme binding (GO: 0050662); obsolete oxidation-reduction process (GO: 0055114) | −2.21 | 3.38 × 10⁻³ | 1.32 × 10⁻² | |
| OE6A096251 | pelargonidin 3-O-(6-caffeoylglucoside) 5-O-(6-O-malonylglucoside) 4 -malonyltransferase-like | transferase activity, transferring acyl groups other than amino-acyl groups (GO: 0016747) | −2.35 | 9.44 × 10⁻⁹ | 2.15 × 10⁻⁷ | |
| OE6A022660 | α-farnesene synthase | magnesium ion binding (GO: 0000287); metabolic process (GO: 0008152); terpene synthase activity (GO: 0010333) | −2.19 | 1.58 × 10⁻¹⁹ | 6.41 × 10⁻¹⁷ |
Publisher’s Note: MDPI stays neutral with regard to jurisdictional claims in published maps and institutional affiliations. |
© 2021 by the authors. Licensee MDPI, Basel, Switzerland. This article is an open access article distributed under the terms and conditions of the Creative Commons Attribution (CC BY) license (https://creativecommons.org/licenses/by/4.0/).
Share and Cite
Salimonti, A.; Forgione, I.; Sirangelo, T.M.; Puccio, G.; Mauceri, A.; Mercati, F.; Sunseri, F.; Carbone, F. A Complex Gene Network Mediated by Ethylene Signal Transduction TFs Defines the Flower Induction and Differentiation in Olea europaea L. Genes 2021, 12, 545. https://doi.org/10.3390/genes12040545
Salimonti A, Forgione I, Sirangelo TM, Puccio G, Mauceri A, Mercati F, Sunseri F, Carbone F. A Complex Gene Network Mediated by Ethylene Signal Transduction TFs Defines the Flower Induction and Differentiation in Olea europaea L. Genes. 2021; 12(4):545. https://doi.org/10.3390/genes12040545
Chicago/Turabian StyleSalimonti, Amelia, Ivano Forgione, Tiziana Maria Sirangelo, Guglielmo Puccio, Antonio Mauceri, Francesco Mercati, Francesco Sunseri, and Fabrizio Carbone. 2021. "A Complex Gene Network Mediated by Ethylene Signal Transduction TFs Defines the Flower Induction and Differentiation in Olea europaea L." Genes 12, no. 4: 545. https://doi.org/10.3390/genes12040545
APA StyleSalimonti, A., Forgione, I., Sirangelo, T. M., Puccio, G., Mauceri, A., Mercati, F., Sunseri, F., & Carbone, F. (2021). A Complex Gene Network Mediated by Ethylene Signal Transduction TFs Defines the Flower Induction and Differentiation in Olea europaea L. Genes, 12(4), 545. https://doi.org/10.3390/genes12040545