Abstract
Pseudocaranx dentex (white trevally) which belongs to the Carangidae family, is an important commercial fishery and aquaculture resource in Asia. However, its evolution and population genetics have received little attention which was limited by the mitogenome information absence. Here, we sequenced and annotated the complete mitochondrial genome of P. dentex which was 16,569 bp in length, containing twenty-two tRNAs (transfer RNAs), thirteen PCGs (protein-coding genes), two rRNAs (ribosomal RNAs), and one non-coding region with conservative gene arrangement. The Ka/Ks ratio analysis among Carangidae fishes indicated the PCGs were suffering purify selection and the values were related to the taxonomic status and further influenced by their living habits. Phylogenetic analysis based on the PCGs sequences of mitogenomes among 36 species presented three major clades in Carangidae. According to the phylogenetic tree, we further analyzed the taxonomic confusion of Carangoides equula which was on the same branch with P. dentex but a different branch with Carangoides spp. We inferred Kaiwarinus equula should be the accepted name and belong to the independent Kaiwarinus genus which was the sister genus of Pseudocaranx. This work provides mitochondrial genetic information and verifies the taxonomic status of P. dentex, and further helps to recognize the phylogenetic relationship and evolutionary history of Carangidae.
1. Introduction
Mitochondria, the main place that accounts for the energy support of various life activities [1], contains their own store of genetic information, which is the mitochondrial genome. The mitochondrial genome is typically circular in teleost which contains 13 protein-coding genes (PCGs), 22 transfer RNAs, 2 ribosomal RNAs, and one non-coding sequence. The mitochondrial species-specific DNA fragments, such as cytochrome c oxidase I (COI), cytochrome b (CYTB), and ribosomal RNA (12S and 16S) are molecular markers usually used for species identification and phylogenetic analysis in fishes [2,3,4]. However, single genes are too short to accurately reflect the real phylogenetic relationships among species and distinguish certain congeneric species. In contrast, the mitochondrial genome which contains greater sequence and additional informative sites has been regarded as a powerful molecular marker to identify phylogenetic relationships and explore population genetics and taxonomic diagnosis because of its high conservation, maternal inheritance, compact gene arrangement, and easy detection [5].
The Carangidae family belongs to Perciformes, suborder Percoidei, comprises 30 genera and approximately 147 species worldwide [6], and it is a diverse and economically important group distributed in all tropical, sub-tropical, and temperature marine water of the world [7,8]. Four subfamilies were recognized following Gushiken [9] published the phylogenetic tree. The properties of Carangidae’s meat, which is tasty with a high nutritional value, make them highly valuable for consumption, which further positions it as an essential pelagic resource in capture fisheries around the world. According to FAO (Fisheries and Aquaculture Department of Food and Agriculture Organization) statistics, the annual global capture production quantity of Carangidae fishes reached 5.13 million tons in 2018 (http://www.fao.org/fishery/statistics/, accessed on 25 March 2021), of which Asia accounted for 65%. Among Carangidae fishes, the aquaculture production of white trevally (P. dentex) (Bloch and Schneider, 1801) is the fourth largest in 2018, based on the FAO statistical data. P. dentex is a commercially important shallow reef fish that occurs on continental and island shelves across the anti-tropical regions of the Indo-Pacific, the Atlantic, and the Mediterranean [10]. Previous studies have examined the learning behavior [11] and physiological features [12] of P. dentex, but not its genetic characteristics and evolutionary patterns which are limited by the absence of mitogenome information. Furthermore, the nomenclature and taxonomy of some Carangidae fishes are disputed. As an example of the taxonomic confusion in the family, Gushiken considered Kaiwarinus as a sister genus to Pseudocaranx [9], whereas Eschmeyer listed Kaiwarinus as a synonym of Carangoides [13]. From the above, the mitogenome character identification of P. dentex is the foundation of population genetics research of P. dentex and will further help to recognize the evolutionary relationships of the Carangidae family and provide evidence for taxonomic classification of controversial species.
In the present study, we sequenced and annotated the complete mitochondrial genome of P. dentex. The genome composition and characteristics were described and the relative synonymous codon usage (RSCU) and AT-skew values of the PCGs were calculated. Furthermore, we analyzed phylogenetic relationships, taxonomic status, and selective pressures among the Carangidae species. The mitochondrial genetic information of P. dentex will help to enhance the limited molecular data available for the Carangidae species and further recognize the phylogenetic relationship of Carangidae.
2. Materials and Methods
2.1. Sample Collection and DNA Extraction
One P. dentex was collected from Dalian Tianzheng Industrial Co., Ltd. (Dalian, China). One-year P. dentex dorsal muscles were sampled and stored in anhydrous alcohol for subsequent DNA extraction. Genomic DNA was isolated from muscles using the TIANamp Marine Animals DNA Kit (DP324, Tiangen, Beijing, China), following the manufacturer’s protocol. DNA integrity and quality were assessed by 1% agarose gel electrophoresis, and their concentration was detected by a Nanodrop spectrophotometer. All experiments were conducted with approval by the Institutional Animal Care and Use Committee (IACUC) of the Yellow Sea Fisheries Research Institute (YSFRI), Chinese Academy of Fishery Sciences.
2.2. Library Construction and DNA Sequencing
High-quality DNA was randomly fragmented to about 350 bp. After terminal repair, adapters were ligated to both ends of the fragment. The libraries were generated for sequencing in the Illumina Hiseq2500 instrument (Illumina, San Diego, CA, USA), followed by amplification, size selection, and purification. Library construction and sequencing were performed by the Novogene Corporation (Beijing, China).
2.3. Sequence Assembly, Annotation, and Analysis
MitoZ [14] was used for the complete mitochondrial genome de novo assembly using the Kmer mode. The mitogenome was annotated with the MITOS Web server [15] using the vertebrate mitochondrial genetic code. The complete mitogenomes of P. dentex were uploaded to GenBank with the accession number MZ359280. The circular mitogenome map was visualized using the Circular Genome View Server [16]. Base composition and amino acid distributions were calculated with MEGA X [17]. The mitochondrial strand asymmetry was measured using the following formulas: GC-skew = (G − C)/(G + C) and AT-skew = (A − T)/(A + T). Codon usage was displayed as the codon frequency, and relative synonymous codon usage (RSCU) values were determined using CodonW.
2.4. Molecular Phylogenetic Analysis
The phylogenetic status of P. dentex in the family Carangidae was assessed by comparing concatenated sequences of 13 PCGs (without stop codon) of 36 Carangidae species across 18 genera, including the P. dentex mitogenome generated from the present study and others downloaded from NCBI (Table 1). Larimichthys crocea (Richardson, 1846) was chosen as an outgroup. We performed sequence alignment using the MAFFT program on the EMBL-EBI analysis tool [18] with default parameters chosen according to the instructions. After deleting total gaps, the automatic model test and Maximum likelihood (ML) tree construction were performed by IQtree [19]. The optimal evolution model was GTR + I + G based on the AIC (Akaike Information Criterion) in IQtree model analysis. The ML analysis was run with 1000 bootstrap replicates by IQtree. The final trees were visualized by Figtree.

Table 1.
Taxonomic information and GenBank accession numbers of all species cited in the mitogenome PCGs phylogenetic analysis.
2.5. Ka/Ks Analysis
The selective pressure magnitude and direction were displayed as the ratio of nonsynonymous substitutions number per nonsynonymous site (Ka) to the synonymous substitutions number per synonymous site (Ks), which was represented as w (w = Ka/KS). The positive, neutral, and purify selection corresponded to w values >1, =1, and <1, respectively [20]. The Ka/Ks ratio values of the Carangidae species were calculated in DNAsp [21] with mitochondrial PCGs after alignment with ClustalW.
3. Results
3.1. General Characteristics of the Pseudocaranx Dentex Mitogenome
The circular mitogenome of P. dentex was 16,569 bp in length consists of thirteen protein-coding genes (PCGs), twenty-two transfer RNAs, two ribosomal RNAs, and one non-coding region (Figure 1 and Table 2). The total length of the PCGs was 11,430 bp, which accounts for 68.98% of the entire mitogenome. The 16 s rRNA and 12s rRNA genes were 1689 bp and 951 bp in length, respectively. The AT- and GC-skew of rRNAs were 0.1801 and −0.0897, respectively (Table 3). The total length of 22 tRNAs was 1556 bp with 0.0455 GC skewness and 0.0211 AT skewness. Their size ranged from 67 bp (tRNA-Cys) to 75 bp (tRNA-Lys).
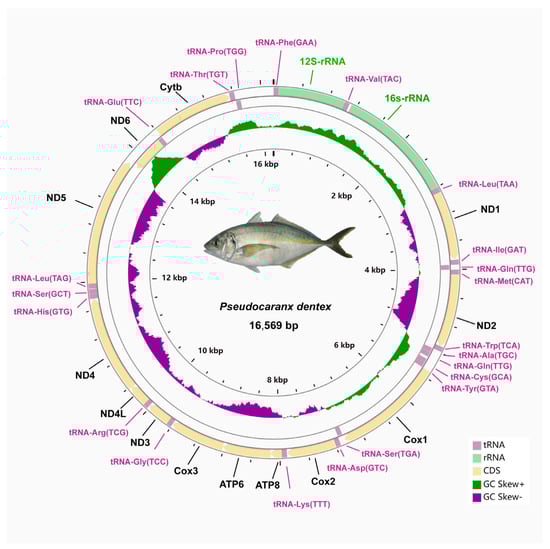
Figure 1.
Circular mitochondrial genome map of P. dentex. The larger circle indicated the gene arrangement and distribution. Genes encoded by the H-strand and L-strand were displayed in outside and inner rings, respectively. The smaller circle indicated GC- and AT-skew distribution.
Table 2.
Genome features of P. dentex.
Table 3.
Nucleotide composition and strand asymmetry of the P. dentex mitochondrial genome.
Among these 37 genes, eight tRNA genes (trnQ, trnA, trnN, trnC, trnY, trnS2, trnE, trnP) and the ND6 gene were located in the light strand and the others were encoded by heavy strand (Figure 1 and Table 2). The structure and arrangement were in good agreement with other Carangidae fishes [22]. The base composition of the complete mitogenomes was listed as follows: A% = 25.40, T% = 27.21, C% = 17.18, G% = 30.21 (Table 3). The proportion of A+T (52.61%) was slightly higher than that of G+C (47.39%). The gene with the highest GC content was identified in ND4 (53.16%). Consistent with other Carangidae fishes, the P. dentex mitogenome had a positive GC-skew (0.02751) and negative AT-skew (−0.0343) (Table 3).
3.2. PCGs and Codon Usages
The nucleotide composition of the PCGs was: T% (27.07%), C% (30.99%), A% (24.74%), and G% (17.20%), with an AT content of 51.81%. ATG was the most frequently used start codon in 12 PCGs, except for COX1 initiating with codon GTG. TAA and TAG were the most frequent stop codon, while COX2, ND4, and CYTB genes had incomplete stop codon T. The AT-skew and GC-skew in PCGs of P. dentex were both negative, −0.0450 and −0.2859, respectively.
The 13 protein-coding genes have 3809 codons. Leu, Ala, Thr, and Ile were the most abundant amino acids in mitogenome PCGs (Figure 2). Codon frequencies were calculated by the occurrence frequency of codons in all PCGs. Leu (CUC, CUA, CUU), Ala (GCC), Phe (UUC), and Thr (ACC) were the most abundant codons, while stop codon (UAG) and Cys (UGU) were the least frequent (Figure 3A). The RSCU is a widely used measurement for each codon usage bias of each amino acid. The RSCU value for a codon close to 1 means that there is no preference for that codon, and an RSCU value >1 indicates that there is a strong bias for that codon [23]. The RSCU values of the P. dentex genome are displayed in Figure 3B. Pro (CCC), Arg (CGA), Ala (GCC), Thr (ACC), Ser (UCC), and Leu (CUC and CUA) were the most frequently used codons, while Ser (UCG and AGU), Pro (CCG), Ala (GCG), Thr (ACG), Leu (UUG) were the least.
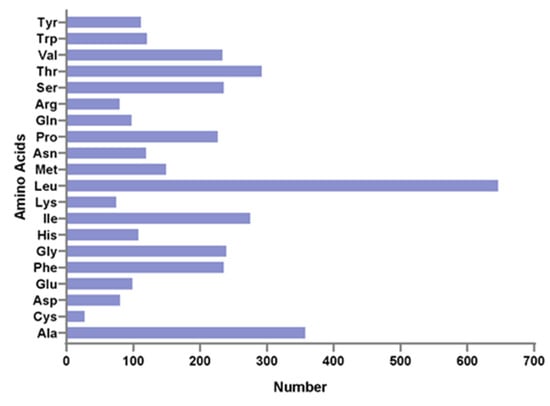
Figure 2.
Amino acid distribution of the P. dentex mitochondrial genome. The horizontal axis and vertical axis are the number and types of amino acids, respectively.
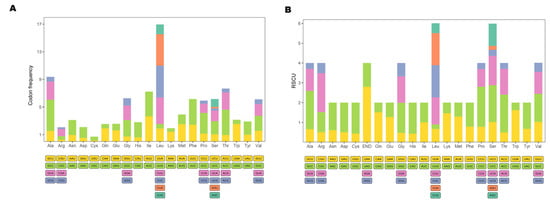
Figure 3.
Codon usage frequency (A) and relative synonymous codon usage (B) in the P. dentex mitogenome. Amino acids are labelled on the x-axis and the codon families are displayed bellow.
3.3. Ka/Ks Analysis
The Ka/Ks ratio values were calculated to describe the selective pressure magnitude and direction of the PCGs. The Ks, Ka, and Ka/Ks ratio values of the PCGs are displayed in Table 4. The average Ka/Ks values of all Carangidae fishes were <1, which suggested the purifying selection of functional genes. Among these species, the Ka/Ks ratio values of the Trachinotiae subfamily were significantly larger than the Caranginae and Naucratinae subfamilies (Figure 4).
Table 4.
The mean values of the Ka/Ks ratio for the PCGs in the pairwise mitochondrial genome among the Carangidae fishes.
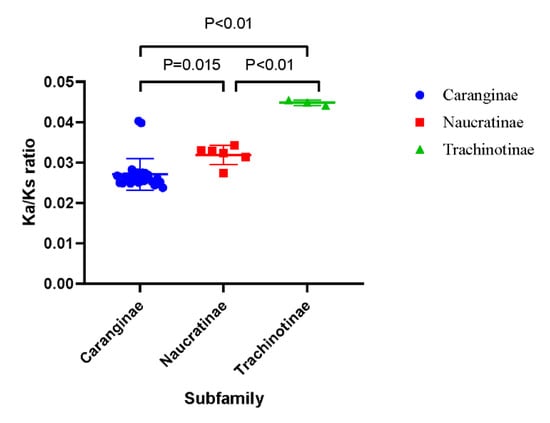
Figure 4.
Plot of the individual Ka/Ks ratio values of three subfamilies.
3.4. Phylogenetic Analysis
Based on the concatenated sequences of the mitochondrial PCGs, the phylogenetic relationship among 36 Carangidae fishes was analyzed. According to the phylogenetic tree, 36 Carangidae fishes showed a clear separation into three subfamilies: Trachinotiae, Naucratinae, and Caranginae. The Caranginae and Naucratinae subfamilies were clustered together and then clustered with the Trachinotiae subfamily (Figure 5). P. dentex is a species of the Caranginae subfamily.
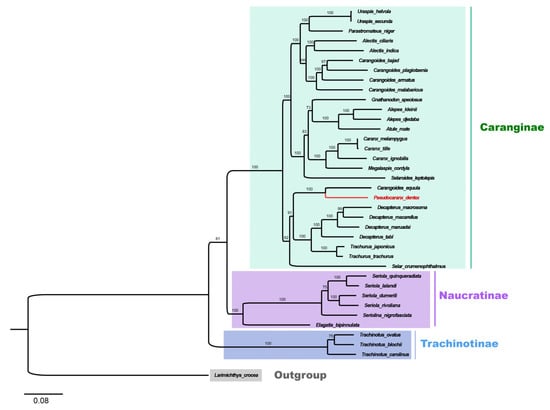
Figure 5.
Phylogenetic tree of 36 species from the Carangidae family constructed by the maximum Likelihood method based on the concatenated sequences of 13 PCGs. L. crocea was set as an outgroup. The bootstrap support values were displayed on the branches. The species in red (P. dentex) was generated in the present study. Trachinotiae, Naucratinae, and Caranginae subfamilies were labeled in blue, purple, and green, respectively.
In the Caranginae subfamily, the naming and classification of Carangoides equula remains controversial. C. equula was once thought to belong to an independent Kaiwarinus genus, whereas, in the present taxonomic system of FishBase and WoRMS, Kaiwarinus equula is considered a synonym of Carangoides equula [9,24,25]. According to our phylogenetic tree, based on the mitochondrial PCGs sequences in 36 Carangidae fishes, C. equula was on the same branch with P. dentex but on a different branch with the Carangoides spp. Considering only a few species of mitochondrial genome information were available in the Pseudocaranx and Carangoides genus, we constructed Neighbor-Joining phylogenetic trees with COI and CYTB sequences of Carangoides and Pseudocaranx genera together with C. equula to further analyze its classification status. Eighteen COI sequences (14 in Carangoides and 4 in Pseudocaranx) and thirteen CYTB sequences (12 in Carangoides and 1 in Pseudocaranx) were downloaded from GenBank or extracted from mitochondrial genome sequences to construct the NJ phylogenetic trees. The sequence information of COI and CYTB are shown in Tables S1 and S2, respectively. Similar to the phylogenetic relation analysis based on the mitochondrial PCGs sequences, Carangoides equula was on a different branch with the Carangoides spp., but in the same subgroup with the Pseudocaranx spp. (Figure 6A,B). According to the above three phylogenetic trees, we inferred Kaiwarinus equula was the accepted name and should belong to the independent Kaiwarinus genus which is the sister genus of Pseudocaranx.
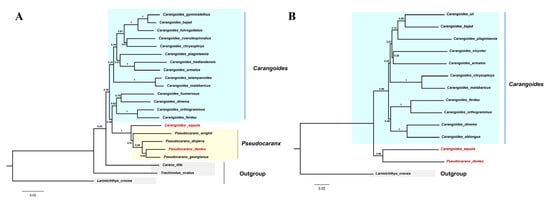
Figure 6.
Neighbor-Joining trees based on COI (A) and CYTB (B) sequences from the Carangoides and Pseudocaranx genera together with C. equula. The numbers at the nodes were the bootstrap support values. P. dentex and C. equula were labeled in red. (A) C. tille, T. ovatus, and L. crocea COI sequences were set as outgroups. (B). L. crocea was an outgroup.
4. Discussion
We sequenced the complete mitochondrial genome of P. dentex and summarized the mitogenome information of 36 species in 19 genera of the Carangidae family. The total mitochondrial genome length of the Carangidae family ranged from 16,530 bp (S. dumerili) [26] to 16,610 bp (S.crumenophthalmus) [27] with minor differences (Figure 7 and Table 1), wherein, the length of P. dentex is 16,569 bp. The mitogenomic structure of P. dentex was conserved in the Carangidae family without gene rearrangement, which is consistent with most vertebrates.
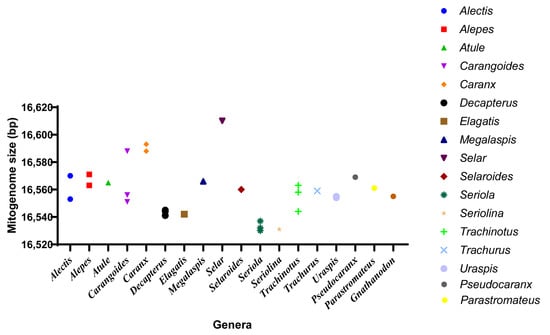
Figure 7.
Mitogenome size distribution of Carangidae fishes. Thirty-six species from eighteen genera obtained from GenBank were displayed.
4.1. Mitochondrial Genetic Code Differed from Nuclear Universal Code
The mitochondrial genetic codes differ from nuclear universal codes; also, the mitochondrial codes are various among vertebrates, yeast, invertebrates, algae, bacteria, fungi, and metazoan [28]. In P. dentex, most genes were initiated by the ATG codon and terminated with TAA and TAG codons, while COX1 had the GTG start codon and COX2, ND4, CYTB genes had incomplete stop codons, T--. The incomplete termination codon was a common genetic codon in the mitochondrial genome. The model to explain the incomplete stop codons was that the addition of a Poly(A) to the 3′-terminal of reading frames with U-- or UA- could create the UAA stop codons post-transcriptionally [29,30].
4.2. Usage of Mitogenome Codon
Leu, Ala, Thr, and Ile were the most abundant amino acids in mitogenome PCGs, which were also the most frequent amino acids in other teleost mitogenomes [22,31,32]. The RSCU is a parameter to assess the synonymous codon usage bias. Pro (CCC), Arg (CGA), Ala (GCC), Thr (ACC), Ser (UCC), and Leu (CUC and CUA) were the most frequently used codons, while Ser (UCG and AGU), Pro (CCG), Ala (GCG), Thr (ACG), and Leu (UUG) were the least in the P. dentex mitochondrial genome, which was not exactly the same as other Carangidae species [22]. In multiple species, codon usage was related to the gene expression level, gene length, tissues [33], and even influenced protein sequences [34]. Differences in codon usage frequency in Carangidae might be related to natural (translation) selection [35] and mutation pressure processes [33] among various species.
4.3. Selective Pressure in Carangidae Family
The Ka/Ks ratio of mitochondrial PCGs is the representative parameter of selective pressure magnitude and direction. There is growing evidence that the accumulation of mtDNA mutation is influenced by life history, effective population size, and even cellular energy requirements [36]. It has been found that species in high-performance groups displayed lower Ka/Ks ratios compared to weakly locomotive species in birds [37], mammals [38], and teleost [39]. Among the Carangidae family, the Ka/Ks ratio of PCGs in Trachinotiae was significantly higher than the other two subfamilies. In these three subfamilies, most species of Caranginae and Naucratinae exhibited migratory behavior with high performance [7,40]. For instance, P. dentex in the present study, which belongs to the Caranginae subfamily, was a highly vagile fish species and performed seasonal migration [41]. While T. carolinus, T. ovatus, and T. blochii were reported to occur in coastal or offshore environments [42] with weaker swimming ability and limited living range relative to the other two subfamilies, leading to a small effective population subjected to weaker purification selection, which further accumulated more nonsynonymous mutations in the Trachinotinae subfamily [36]. The Caranginae and Naucratinae subfamilies with higher performance showed a lower Ka/Ks ratio compared with the weakly locomotive Trachinotiae subfamily, which suggested that the Ka/Ks ratio of Carangidae fishes may be related to their taxonomic status, and further influenced by their living habits and swimming abilities.
4.4. Molecular Phylogeny of Carangidae Fishes
The Mitochondrial genome has become a powerful molecular marker for genetic analysis which can provide additional genetic informative sites and has high conservation and simple structural features [43,44]. Together with the sequences of P. dentex obtained in the present study, the mitochondrial genomes of a total of 36 Carangidae fishes were available. These 36 Carangidae fishes were from 18 genera and 3 subfamilies, except for the Scomberoidinae subfamily—the complete genome of which was absent. The dendrogram of the Carangidae family was drawn according to the concatenated mitochondrial PCGs sequences of 36 Carangidae fishes. Our phylogenetic analysis showed a clear separation of these 36 Carangidae fishes into three subgroups. Compared with a previous phylogenetic study based on mitochondrial genome information [22], we discussed phylogenetic relationships of five more species that belong to three genera in the Carangidae family. Our results supported Gushiken’s phylogenetic relationship analysis of 46 species in 32 genera of the Carangidae family, which was based on twenty-five morphological and osteological characters in 1988 [9]. Among Carangidae fishes, the naming and classification of C. equula, which belong to the Caranginae subfamily, still remains controversial [9,24,25]. It was once thought that C. equula should belong to the Kaiwarinus genus which was an independent genus and in the same branch as the Pseudocaranx genus based on morphological and osteological characteristics [9]. While, in the current taxonomic system of FishBase (https://fishbase.se/search.php, accessed on 8 June 2021) and WoRMS (https://www.marinespecies.org/, accessed on 8 June 2021), Kaiwarinus equula (Temminck and Schlegel, 1844) is listed as a synonym of Carangoides equula (Temminck and Schlegel, 1844). The generation of the P. dentex mitogenome in the present study was helpful to clarify the nomenclature and taxonomy of C. equula. By applying the whole mitochondrial genome, COI, and CYTB genes of available Carangidae fishes, our results confirmed C. equula should belong to the Kaiwarinus genus, in line with results from other scholars [9,12,45,46]. Combining the results discussed above, we inferred that Kaiwarinus equula should be the accepted name instead of Carangoides equula and belong to an independent genus which is the sister genus of Pseudocaranx.
5. Conclusions
In summary, we sequenced and annotated the complete mitochondrial genome of P. dentex which was 16,569 bp with conservative gene arrangement. The evolutionary relationship analysis revealed that the Trachinotiae subfamily showed a significantly higher Ka/Ks ratio relative to the Naucratinae and Caranginae subfamilies, which indicated that the Ka/Ks ratio values were correlated with the taxonomic status and their living habits. Phylogenetic analysis provided a further supplement to the scientific classification of Carangidae fishes. Based on the phylogenetic tree topology, we inferred Kaiwarinus equula was the accepted name of Carangoides equula and belongs to an independent Kaiwarinus genus which is the sister genus of Pseudocaranx. This work enriched mitochondrial genome information of the Carangidae family and will greatly improve our understanding of the evolution profile and phylogenetic position of the Carangidae family.
Supplementary Materials
The following are available online at https://www.mdpi.com/article/10.3390/genes12081234/s1, Table S1: Information of the COI gene sequences used in the phylogenetic analysis, Table S2. Information of the Cytb gene sequences used in the phylogenetic analysis.
Author Contributions
B.L. Conceptualization, B.L., S.L. and Z.Z.; data curation, B.L.; formal analysis, B.L. and L.Y.; funding acquisition, S.L.; investigation, B.L.; methodology, B.L.; project administration, S.L. and Z.Z.; software, B.L.; validation, B.L., H.W. and S.L.; visualization, B.L.; writing—original draft, B.L.; writing—review and editing, B.L., H.W. and S.L. All authors have read and agreed to the published version of the manuscript.
Funding
This research was funded by the Major Science and Technology Innovation Project of Shandong Province (2018SDKJ0302), the National Natural Science Foundation of China (42076132), and the Pilot National Laboratory for Marine Science and Technology (Qingdao) (JCZX202023).
Institutional Review Board Statement
The study was approved by the Institutional Animal Care and Use Committee of the Yellow Sea Fisheries Research Institute (YSFRI), Chinese Academy of Fishery Sciences (Approval code: YSFRI-2021012 in Oct 12th 2020).
Informed Consent Statement
Not applicable.
Data Availability Statement
The complete mitogenome of P. dentex was available in GenBank with accession number MZ359280.
Conflicts of Interest
The authors declare no conflict of interest.
References
- Hampl, V.; Čepička, I.; Eliáš, M. Was the Mitochondrion Necessary to Start Eukaryogenesis? Trends Microbiol. 2019, 27, 96–104. [Google Scholar] [CrossRef]
- Damerau, M.; Freese, M.; Hanel, R. Multi-gene phylogeny of jacks and pompanos (Carangidae), including placement of monotypic vadigo Campogramma glaycos. J. Fish Biol. 2018, 92, 190–202. [Google Scholar] [CrossRef]
- Zeng, L.; Wen, J.; Fan, S.; Chen, Z.; Xu, Y.; Sun, Y.; Chen, D.; Zhao, J. Species identification of fish maw (Porcupinefish) products sold on the market using DNA sequencing of 16S rRNA and COI genes. Food Control. 2018, 86, 159–162. [Google Scholar] [CrossRef]
- Cutarelli, A.; Galiero, G.; Capuano, F.; Corrado, F. Species Identification by Means of Mitochondrial Cytochrome b DNA Sequencing in Processed Anchovy, Sardine and Tuna Products. Food Nutr. Sci. 2018, 9, 369–375. [Google Scholar]
- Curole, J.P.; Kocher, T.D. Mitogenomics: Digging deeper with complete mitochondrial genomes. Trends Ecol. Evol. 1999, 14, 394–398. [Google Scholar] [CrossRef]
- Nelson, J.S.; Grande, T.C.; Wilson, M.V.H. Fishes of the World, 5th ed.; John Wiley and Sons: Hoboken, NJ, USA, 2016. [Google Scholar]
- Cayetano, B.J. A Review of the Biology of the Family Carangidae, with Emphasis on Species Found in Hawaiian Waters; Division of Aquatic Resources, Department of Land and Natural Resources: Honolulu, HI, USA, 2000. [Google Scholar]
- Laroche, W.A.; Smith-Vaniz, W.F.; Richardson, S.L. Carangidae: Development. In Ontogeny and Systematics of Fishes; Moser, H.G., Richards, W.J., Cohen, D.M., Fahay, M.P., Kendall, A.W., Richardson, S.L., Eds.; Allen Press: Lawrence, KS, USA, 1984. [Google Scholar]
- Gushiken, S. Phylogenetic Relationships of the Perciform Genera of the Family Carangidae. Ichthyol. Res. 1988, 34, 443–461. [Google Scholar] [CrossRef]
- Smith-Vaniz, W.F. Carangidae. Jacks and Scads (also Trevallies, Queenfishes, Runners, Amberjacks, Pilotfishes, Pampanos, etc.); Bony Fishes Part 2 (Mugilidae to Carangidae); FAO: Rome, Italy, 1999. [Google Scholar]
- Takahashi, K.; Masuda, R.; Yamashita, Y. What to copy: The key factor of observational learning in striped jack (Pseudocaranx dentex) juveniles. Anim. Cogn. 2014, 17, 495–501. [Google Scholar] [CrossRef][Green Version]
- Takei, S.; Somiya, H. Guanine-type retinal tapetum and ganglion cell topography in the retina of a carangid fish, Kaiwarinus equula. Proc. R. Soc. B Biol. Sci. 2002, 269, 75–82. [Google Scholar] [CrossRef]
- Greenwood, P.H. Catalog of the genera of recent fishes. Rev. Fish Biol. Fish. 1993, 3, 187–188. [Google Scholar] [CrossRef]
- Meng, G.; Li, Y.; Yang, C.; Liu, S. MitoZ: A toolkit for animal mitochondrial genome assembly, annotation and visualization. Nucleic Acids Res. 2019, 47, e63. [Google Scholar] [CrossRef]
- Bernt, M.; Donath, A.; Jühling, F.; Externbrink, F.; Florentz, C.; Fritzsch, G.; Pütz, J.; Middendorf, M.; Stadler, P.F. MITOS: Improved de novo metazoan mitochondrial genome annotation. Mol. Phylogenet. Evol. 2013, 69, 313–319. [Google Scholar] [CrossRef]
- Stothard, P.; Wishart, D.S. Circular genome visualization and exploration using CGView. Bioinformatics 2005, 21, 537–539. [Google Scholar] [CrossRef] [PubMed]
- Kumar, S.; Stecher, G.; Li, M.; Knyaz, C.; Tamura, K. MEGA X: Molecular Evolutionary Genetics Analysis across Computing Platforms. Mol. Biol. Evol. 2018, 35, 1547–1549. [Google Scholar] [CrossRef]
- Madeira, F.; Park, Y.M.; Lee, J.; Buso, N.; Gur, T.; Madhusoodanan, N.; Basutkar, P.; Tivey, A.R.N.; Potter, S.C.; Finn, R.D.; et al. The EMBL-EBI search and sequence analysis tools APIs in 2019. Nucleic Acids Res. 2019, 47, W636–W641. [Google Scholar] [CrossRef] [PubMed]
- Minh, B.Q.; Schmidt, H.A.; Chernomor, O.; Schrempf, D.; Woodhams, M.D.; von Haeseler, A.; Lanfear, R. IQ-TREE 2: New Models and Efficient Methods for Phylogenetic Inference in the Genomic Era. Mol. Biol. Evol. 2020, 37, 1530–1534. [Google Scholar] [CrossRef] [PubMed]
- Hurst, L.D. The Ka/Ks ratio: Diagnosing the form of sequence evolution. Trends Genet. 2002, 18, 486–487. [Google Scholar] [CrossRef]
- Rozas, J.; Ferrer-Mata, A.; Sánchez-DelBarrio, J.C.; Guirao-Rico, S.; Librado, P.; Ramos-Onsins, S.; Sánchez-Gracia, A. DnaSP 6: DNA Sequence Polymorphism Analysis of Large Data Sets. Mol. Biol. Evol. 2017, 34, 3299–3302. [Google Scholar] [CrossRef] [PubMed]
- Li, Z.; Li, M.; Xu, S.; Liu, L.; Chen, Z.; Zou, K. Complete Mitogenomes of Three Carangidae (Perciformes) Fishes: Genome Description and Phylogenetic Considerations. Int. J. Mol. Sci. 2020, 21, 4685. [Google Scholar] [CrossRef] [PubMed]
- Sharp, P.; Li, W.-H. An evolutionary perspective on synonymous codon usage in unicellular organisms. J. Mol. Evol. 1986, 24, 28–38. [Google Scholar] [CrossRef]
- Gunn, J.S. A revision of selected genera of the family Carangidae (Pisces) from Australian waters. Rec. Aust. Mus. Suppl. 1990, 12, 1–77. [Google Scholar] [CrossRef][Green Version]
- Zou, K.; Li, M. Characterization of the mitochondrial genome of the Whitefin trevally Carangoides equula (Perciformes: Carangidae): A novel initiation codon for ATP6 gene. Mitochondrial DNA 2014, 27, 1779–1780. [Google Scholar] [CrossRef]
- Araki, K.; Aokic, J.-Y.; Kawase, J.; Hamada, K.; Ozaki, A.; Fujimoto, H.; Yamamoto, I.; Usuki, H. Whole Genome Sequencing of Greater Amberjack (Seriola dumerili) for SNP Identification on Aligned Scaffolds and Genome Structural Variation Analysis Using Parallel Resequencing. Int. J. Genom. 2018, 2018, 7984292. [Google Scholar] [CrossRef]
- Li, M.; Chen, Z.; Zou, K. Complete mitochondrial genome of the bigeye scad Selar crumenophthalmus (Perciformes: Carangidae). Mitochondrial DNA 2014, 27, 308–309. [Google Scholar] [CrossRef]
- Jukes, T.; Osawa, S. Evolutionary changes in the genetic code. Comp. Biochem. Physiol. Part B Comp. Biochem. 1993, 106, 489–494. [Google Scholar] [CrossRef]
- Ojala, D.; Montoya, J.; Attardi, G. tRNA punctuation model of RNA processing in human mitochondria. Nature 1981, 290, 470–474. [Google Scholar] [CrossRef] [PubMed]
- Anderson, S.; Bankier, A.T.; Barrell, B.G.; De Bruijn, M.H.L.; Coulson, A.R.; Drouin, J.; Eperon, I.C.; Nierlich, D.P.; Roe, B.A.; Sanger, F.; et al. Sequence and organization of the human mitochondrial genome. Nature 1981, 290, 457–465. [Google Scholar] [CrossRef] [PubMed]
- Li, N.; Song, N.; Gao, T. The complete mitochondrial genome of Japanese Ammodytes personatus (Perciformes, Ammodytidae). Mitochondrial DNA 2014, 26, 781–782. [Google Scholar] [CrossRef] [PubMed]
- Xiao, J.; Song, N.; Gao, T.; McKay, R.J. The complete mitochondrial genome of Sillago indica (Perciformes: Sillaginidae). Mitochondrial DNA 2014, 27, 1445–1446. [Google Scholar] [CrossRef] [PubMed]
- Sharp, P.M.; Matassi, G. Codon usage and genome evolution. Curr. Opin. Genet. Dev. 1994, 4, 851–860. [Google Scholar] [CrossRef]
- Gustafsson, C.; Govindarajan, S.; Minshull, J. Codon bias and heterologous protein expression. Trends Biotechnol. 2004, 22, 346–353. [Google Scholar] [CrossRef]
- Stenico, M.; Lloyd, A.T.; Sharp, P. Codon usage inCaenorhabditis elegans: Delineation of translational selection and mutational biases. Nucleic Acids Res. 1994, 22, 2437–2446. [Google Scholar] [CrossRef]
- Strohm, J.H.; Gwiazdowski, R.A.; Hanner, R. Fast fish face fewer mitochondrial mutations: Patterns of dN/dS across fish mitogenomes. Gene 2015, 572, 27–34. [Google Scholar] [CrossRef]
- Shen, Y.; Shi, P.; Sun, Y.-B.; Zhang, Y.-P. Relaxation of selective constraints on avian mitochondrial DNA following the degeneration of flight ability. Genome Res. 2009, 19, 1760–1765. [Google Scholar] [CrossRef]
- Shen, Y.; Liang, L.; Zhu, Z.-H.; Zhou, W.-P.; Irwin, D.; Zhang, Y.-P. Adaptive evolution of energy metabolism genes and the origin of flight in bats. Proc. Natl. Acad. Sci. USA 2010, 107, 8666–8671. [Google Scholar] [CrossRef]
- Sun, Y.-B.; Shen, Y.; Irwin, D.; Zhang, Y.-P. Evaluating the Roles of Energetic Functional Constraints on Teleost Mitochondrial-Encoded Protein Evolution. Mol. Biol. Evol. 2011, 28, 39–44. [Google Scholar] [CrossRef]
- Jaafar, T.N.M.; Taylor, M.I.; Nor, S.A.M.; De Bruyn, M.; Carvalho, G.R. Comparative genetic stock structure in three species of commercially exploited Indo-Malay Carangidae (Teleosteii, Perciformes). J. Fish Biol. 2019, 96, 337–349. [Google Scholar] [CrossRef] [PubMed]
- Afonso, P.; Fontes, J.; Holland, K.; Santos, R.S. Multi-scale patterns of habitat use in a highly mobile reef fish, the white trevally Pseudocaranx dentex, and their implications for marine reserve design. Mar. Ecol. Prog. Ser. 2009, 381, 273–286. [Google Scholar] [CrossRef]
- McMaster, M.F.; Gopakumar, G. Cultured Aquatic Species Information Programme. Trachinotus carolinus. FAO Fisheries Division. 2016. Available online: http://www.fao.org/fishery/culturedspecies/Trachinotus_spp/en (accessed on 8 June 2021).
- Miya, M.; Nishida, M. Use of Mitogenomic Information in Teleostean Molecular Phylogenetics: A Tree-Based Exploration under the Maximum-Parsimony Optimality Criterion. Mol. Phylogenet. Evol. 2000, 17, 437–455. [Google Scholar] [CrossRef] [PubMed]
- Jia, C.-H.; Zhang, X.-M.; Xu, S.-Y.; Yang, T.-Y.; Yanagimoto, T.; Gao, T.-X. Comparative analysis of the complete mitochondrial genomes of three rockfishes (Scorpaeniformes, Sebastiscus) and insights into the phylogenetic relationships of Sebastidae. Biosci. Rep. 2020, 40, BSR20203379. [Google Scholar] [CrossRef]
- Yoneda, M.; Futagawa, K.; Tokimura, M.; Horikawa, H.; Matsuura, S.; Matsuyama, M. Reproductive cycle, spawning frequency and batch fecundity of the female whitefin jack Kaiwarinus equula in the East China Sea. Fish. Res. 2002, 57, 297–309. [Google Scholar] [CrossRef]
- Mahjoub, M.S.; Takeda, S.; Hayashi, T.; Shiode, D.; Arimoto, T.; Tokai, T. Codend selectivity for jack mackerel and whitefin jack and unequal split parameter estimates observed in trouser trawl experiments. Fish. Sci. 2011, 77, 169–181. [Google Scholar] [CrossRef]


Publisher’s Note: MDPI stays neutral with regard to jurisdictional claims in published maps and institutional affiliations. |
© 2021 by the authors. Licensee MDPI, Basel, Switzerland. This article is an open access article distributed under the terms and conditions of the Creative Commons Attribution (CC BY) license (https://creativecommons.org/licenses/by/4.0/).