Article

Glutamine Metabolism Regulators Associated with Cancer Development and the Tumor Microenvironment: A Pan-Cancer Multi-Omics Analysis

1
Department of Liver Surgery, Sun Yat-sen University Cancer Center, Guangzhou 510060, China
2
State Key Laboratory of Oncology in South China, Collaborative Innovation Center for Cancer Medicine, Guangzhou 510060, China
3
Department of Radiation Oncology, Affiliated Cancer Hospital & Institute of Guangzhou Medical University, Guangzhou 510095, China
*
Author to whom correspondence should be addressed.
These authors contributed equally to this work.
Genes 2021, 12(9), 1305; https://doi.org/10.3390/genes12091305
Submission received: 24 June 2021 / Revised: 12 August 2021 / Accepted: 17 August 2021 / Published: 25 August 2021
(This article belongs to the Section Molecular Genetics and Genomics)

Abstract

:
Background: In recent years, metabolic reprogramming has been identified as a hallmark of cancer. Accumulating evidence suggests that glutamine metabolism plays a crucial role in oncogenesis and the tumor microenvironment. In this study, we aimed to perform a systematic and comprehensive analysis of six key metabolic node genes involved in the dynamic regulation of glutamine metabolism (referred to as GLNM regulators) across 33 types of cancer. Methods: We analyzed the gene expression, epigenetic regulation, and genomic alterations of six key GLNM regulators, including SLC1A5, SLC7A5, SLC3A2, SLC7A11, GLS, and GLS2, in pan-cancer using several open-source platforms and databases. Additionally, we investigated the impacts of these gene expression changes on clinical outcomes, drug sensitivity, and the tumor microenvironment. We also attempted to investigate the upstream microRNA–mRNA molecular networks and the downstream signaling pathways involved in order to uncover the potential molecular mechanisms behind metabolic reprogramming. Results: We found that the expression levels of GLNM regulators varied across cancer types and were related to several genomic and immunological characteristics. While the immune scores were generally lower in the tumors with higher gene expression, the types of immune cell infiltration showed significantly different correlations among cancer types, dividing them into two clusters. Furthermore, we showed that elevated GLNM regulators expression was associated with poor overall survival in the majority of cancer types. Lastly, the expression of GLNM regulators was significantly associated with PD-L1 expression and drug sensitivity. Conclusions: The elevated expression of GLNM regulators was associated with poorer cancer prognoses and a cold tumor microenvironment, providing novel insights into cancer treatment and possibly offering alternative options for the treatment of clinically refractory cancers.

1. Introduction

Metabolic reprogramming has been recognized as a hallmark of cancer in recent years [1]. The altered cell metabolism allows tumors to fulfill their increased energetic and biosynthetic requirements. Glutamine metabolism has been shown to be involved in the maintenance and survival of tumor cells and is associated with the control of oxidative stress through glutathione synthesis [2]. Recent studies have shown that the activation of tumor-specific signaling pathways, such as the upregulation of the oncogene Myc, can regulate glutamine uptake and metabolism through glutaminolysis, providing an alternative energy source for cancer cells [3]. Glutamine and its metabolites are involved in several key cellular processes, including the tricarboxylic acid (TCA) cycle, redox balance, and mTOR activation, as well as the biosynthesis of nucleotides, amino acids, fatty acids, and amino sugars [4,5]. Increasing evidence suggests that metabolic reprogramming plays a vital role not only in tumorigenesis and tumor progression but also in regulating the immune microenvironment. Additionally, blocking the glutamine metabolism in tumor cells, which results in an elevated level of amino acids in the tumor microenvironment (TME), can enhance the antitumor effects of immune cells; therefore, an in-depth exploration of the genetic alteration of glutamine metabolism in tumor development and immune escape may provide an important theoretical basis for developing novel cancer treatments.
Glutamine uptake and the rate of glutaminolysis are known to be associated with tumor growth [6]. Two key transporters for glutamine uptake into cells are solute carrier family 1 member 5 (SLC1A5) and solute carrier family 7 member 5 (SLC7A5). SLC1A5 mediates the sodium (Na+)-coupled influx of glutamine, whereas SLC7A5 maintains the efflux of glutamine alongside the influx of leucine, an essential amino acid and effective activator of mTORC1 [7,8]. SLC7A5 requires covalent binding with the solute carrier family 3 member 2 (SLC3A2) heavy chain in order to be functionally expressed in the plasma membrane [9]. Solute carrier family 7 member 11 (SLC7A11), also called xCT, is responsible for the counter-transport of glutamate and cysteine. This exchange is favorable for cancer cells because cysteine is a major component of the antioxidant glutathione, which in turn is an antagonist of reactive oxygen species (ROS) [10,11,12]. Mitochondrial glutaminase (GLS) is the primary enzyme of glutaminolysis, serving as a gatekeeper. Two isozymes of GLS have been identified: a kidney-type enzyme (GLS) and a liver-type enzyme (GLS2) [13]. Abnormal expression patterns for the above glutamine metabolism (GLNM) regulators have been observed in some cancers and are correlated with patient survival. To date, previous studies have focused on either a single cancer type or a single gene [8,14]. There has been no comprehensive analysis of the genomic changes of the GLNM regulators and their effects on the TME and patient prognosis across different cancer types.
Drug resistance remains a major clinical issue that impairs the efficacy of cancer therapy. Currently, several mechanisms of drug resistance have been identified, including changes in drug transport, DNA repair, apoptosis, autophagy, pyroptosis, and redox balance, which was mainly mediated by reduced glutathione [15]; thus, glutamine metabolism may play an important role in drug response by maintaining redox balance. It has been reported that the upregulation of SLC7A11 has been identified as a mechanism of cisplatin resistance in ovarian and bladder cancer, as well as gemcitabine resistance in pancreatic cancer [16,17]. This affords the opportunity to provide a fruitful theoretical basis for the implementation of individualized therapy based on the gene expression profile; therefore, comprehensive analysis of the relationships between GLNM regulators and drug sensitivity are indispensable.
In this study, we systematically analyzed the gene expression, epigenetic regulation, and genomic alterations of six key GLNM regulators (including SLC1A5, SLC7A5, SLC3A2, SLC7A11, GLS, and GLS2) across 33 different cancer types. Additionally, the impacts of these gene expression changes on clinical outcomes, drug sensitivity, and immune cell infiltration were investigated. We also explored the upstream microRNA–mRNA molecular networks and the possible downstream signaling pathways, which might be mediated through these GLNM regulators.

2. Materials and Methods

2.1. Data Acquisition

All the datasets analyzed in the present study are publicly available. The RNA-seq, single-nucleotide variation (SNV), copy number variation (CNV), methylation, and clinical data for adrenocortical carcinoma (ACC), bladder urothelial carcinoma (BLCA), breast cancer (BRCA), cervical squamous cell carcinoma and endocervical adenocarcinoma (CESC), cholangiocarcinoma (CHOL), colon adenocarcinoma (COAD), lymphoid neoplasm diffuse large b-cell lymphoma (DLBC), esophageal carcinoma (ESCA), glioblastoma multiforme (GBM), head and neck squamous carcinoma (HNSC), kidney chromophobe (KICH), kidney renal clear cell carcinoma (KIRC), kidney renal papillary cell carcinoma (KIRP), acute myeloid leukemia (LAML), brain lower-grade glioma (LGG), liver hepatocellular carcinoma (LIHC), lung adenocarcinoma (LUAD), lung squamous cell carcinoma (LUSC), mesothelioma (MESO), ovarian serous cystadenocarcinoma (OV), pancreatic adenocarcinoma (PAAD), pheochromocytoma and paraganglioma (PCPG), prostate adenocarcinoma (PRAD), rectum adenocarcinoma (READ), sarcoma (SARC), skin cutaneous melanoma (SKCM), stomach adenocarcinoma (STAD), testicular germ cell tumors (TGCT), thyroid carcinoma (THCA), thymoma (THYM), uterine corpus endometrial carcinoma (UCEC), uterine carcinosarcoma (UCS), and uveal melanoma (UVM) were obtained from the Cancer Genome Atlas (TCGA) data portal (https://gdc.cancer.gov/, accessed on 1 May 2021). These datasets included 10,995 level 3 RNA-seq samples, while clinical data were available for analysis for 11,160 samples. The Genotype-Tissue Expression (GTEx) dataset (V7.0) consists of 11,688 samples and contains 56,202 genes representing the expression profiles of 30 different organs (53 tissues), including adipose tissue, adrenal gland, bladder, blood, blood vessel, brain, breast, cervix uteri, colon, esophagus, fallopian tube, heart, kidney, liver, lung, muscle, nerve, ovary, pancreas, pituitary, prostate, salivary gland, skin, small intestine, spleen, stomach, testis, thyroid, uterus, and vagina profiles.

2.2. Genome-Wide Analysis

A genome-wide analysis of the GLNM genes was performed using the GSCALite platform [18]. The expression profiles of the GLNM genes in selected normal GTEx tissues were displayed in the form of a heatmap. RSEM-normalized RNA-seq data were used for differentially expressed gene (DEG) analysis. The genes with fold change values (FC) > 2 and false discovery rates (FDR) < 0.05 were identified as DEGs. The SNV frequency and variant types of the six GLNM genes were visualized in a heatmap and a waterfall plot. The CNV statistics were based on processed data from GISTIC2.0 [19], while the correlation between the CNV and mRNA expression was determined from raw data. The percentages of heterozygous and homozygous CNVs for each cancer type were compiled into a pie chat and the Pearson coefficient of the correlation between gene expression and the CNV was calculated. The methylation analysis explored the differential methylation levels and the correlation between methylation and gene expression.

2.3. Survival Analysis

RSEM-normalized expression values and the methylation levels of genes were used to divide the cancer samples into high and low groups based on the medians. Then, an R package, “survival”, was performed to evaluate the survival differences between the two groups. In addition, the integrative effect of the six GLNM genes on survival was investigated in the form of gene signatures using the Gene Expression Profiling Interactive Analysis (GEPIA) database [20]. The Cox proportional hazards model was used to calculate the hazards of the high-expression group [21]. The survival curves were plotted using the Kaplan–Meier method and compared between groups using log-rank tests [22]. A p-value less than 0.05 was considered to indicate a significant difference.

2.4. Analysis of Immune Cell Infiltration

We used immuneeconv, an R software package, to calculate the immune score, stroma score, and microenvironment score for each of the GLNM regulators based on xCell algorithms [23]. GEPIA2 was used to evaluate the association between PD-L1 and the gene set expression level. The association between tumor-infiltrating immune cells (TIICs) across 33 cancer types and the gene set expression level was estimated via ImmuCellAI [24]. The Spearman correlation test was applied to analyze the correlation between the expression of GLNM regulators and the abundance of different immune cells.

2.5. Drug Sensitivity Analysis

The gene expression data and IC50 values for different drugs for 1018 cancer cell lines in the GDSC database were integrated for investigation. The area under the dose–response curve (AUC) values for the drug and gene expression profiles were downloaded to analyze the correlation of gene expression and drug sensitivity. The Pearson correlation coefficients of annotated drug–target pairs were used for comparisons, with the same number of correlation pairs generated by randomly sampling the correlations.

2.6. Analysis of Molecular Mechanisms

The upstream microRNA–mRNA molecular networks and the downstream pathways activity were explored. The miRNA transcript expression data were derived from TCGA, including 9105 samples and 33 cancer types. The microRNA regulation data were obtained from databases, including experimental validation (papers, TarBase, miRTarBase, and mir2disease), as well as TargetScan and miRNADA prediction. The downstream signaling pathways activity were analyzed based on reverse-phase protein array (RPPA) data from the TCPA database. The pathway activity score (PAS) was the sum of the relative protein levels of all positive regulatory components minus the relative protein levels of the negative regulatory components in a particular pathway [25]. The cancer samples were stratified into two groups based on the median gene expression, and Student’s t-test was used to determine the difference in the PAS between the two groups. When a gene in the high expression group has a higher PAS than the low expression group, the gene may have an activating effect on a certain pathway or may otherwise have an inhibitory effect on the pathway [26].

2.7. Statistical Analysis

Student’s t-test was performed to compare the GLNM gene expressions differences, as well as the methylation differences between tumors and corresponding normal tissue. The percentage of the SNV in the coding region of each gene was calculated with the following formula: [number of mutated sample]/[number of cancer sample]. The log-rank test was used to compare the survival curves. The correlations were evaluated by Pearson or Spearman tests. A p-value less than 0.05 was considered statistically significant.

3. Results

3.1. Aberrant Expression of GLNM Regulators in a Variety of Cancers

Based on the published data, a total of six key GLNM regulators, including four transporters (SLC1A5, SLC7A5, SLC3A2, and SLC7A11) and two gatekeeper enzymes (GLS and GLS2), were employed in the current study (Figure 1). The expression profiles of normal tissues were assessed based on the GTEx dataset, as shown in Figure 2A. SLC3A2 and SLC1A5 were highly expressed in a variety of tissues, while SLC7A11 displayed lower expression. The expression levels of SLC7A5 in the testis, GLS2 in the liver, and GLS in blood vessel were relatively high. The differential expression analysis was based on paired samples for each cancer type. Across the 33 cancer types, only THCA, KIRP, BLCA, LIHC, HNSC, BRCA, LUAD, PRAD, ESCA, KICH, LUSC, KIRC, STAD, and COAD had paired samples (Figure 2B). Upregulated expression of SLC7A11 (10/14), SLC1A5 (7/14), SLC7A5 (6/14), and SLC3A2 (5/14) was observed in most of the tumor tissues; however, GLS in LUSC, KIRC, and KICH and GLS2 in KIRC and LIHC, were significantly downregulated. Next, a gene set variation analysis (GSVA) was performed to calculate a GSVA score to represent the integrated level of the expression of the gene set, which was positively correlated with the expression of the gene set; therefore, if the GSVA score in the tumor group was higher than that in adjacent group, this indicated that the overall expression of the gene set in the tumor group was higher. In the present study, we observed that the GSVA scores were significantly higher in BRCA, COAD, ESCA, HNSC, LIHC, LUAD, LUSC, STAD, and THCA than in the adjacent normal tissues (Figure 2C). This revealed that the aberrant expression of the GLNM regulators might be involved in tumorigenesis in multiple cancer types.

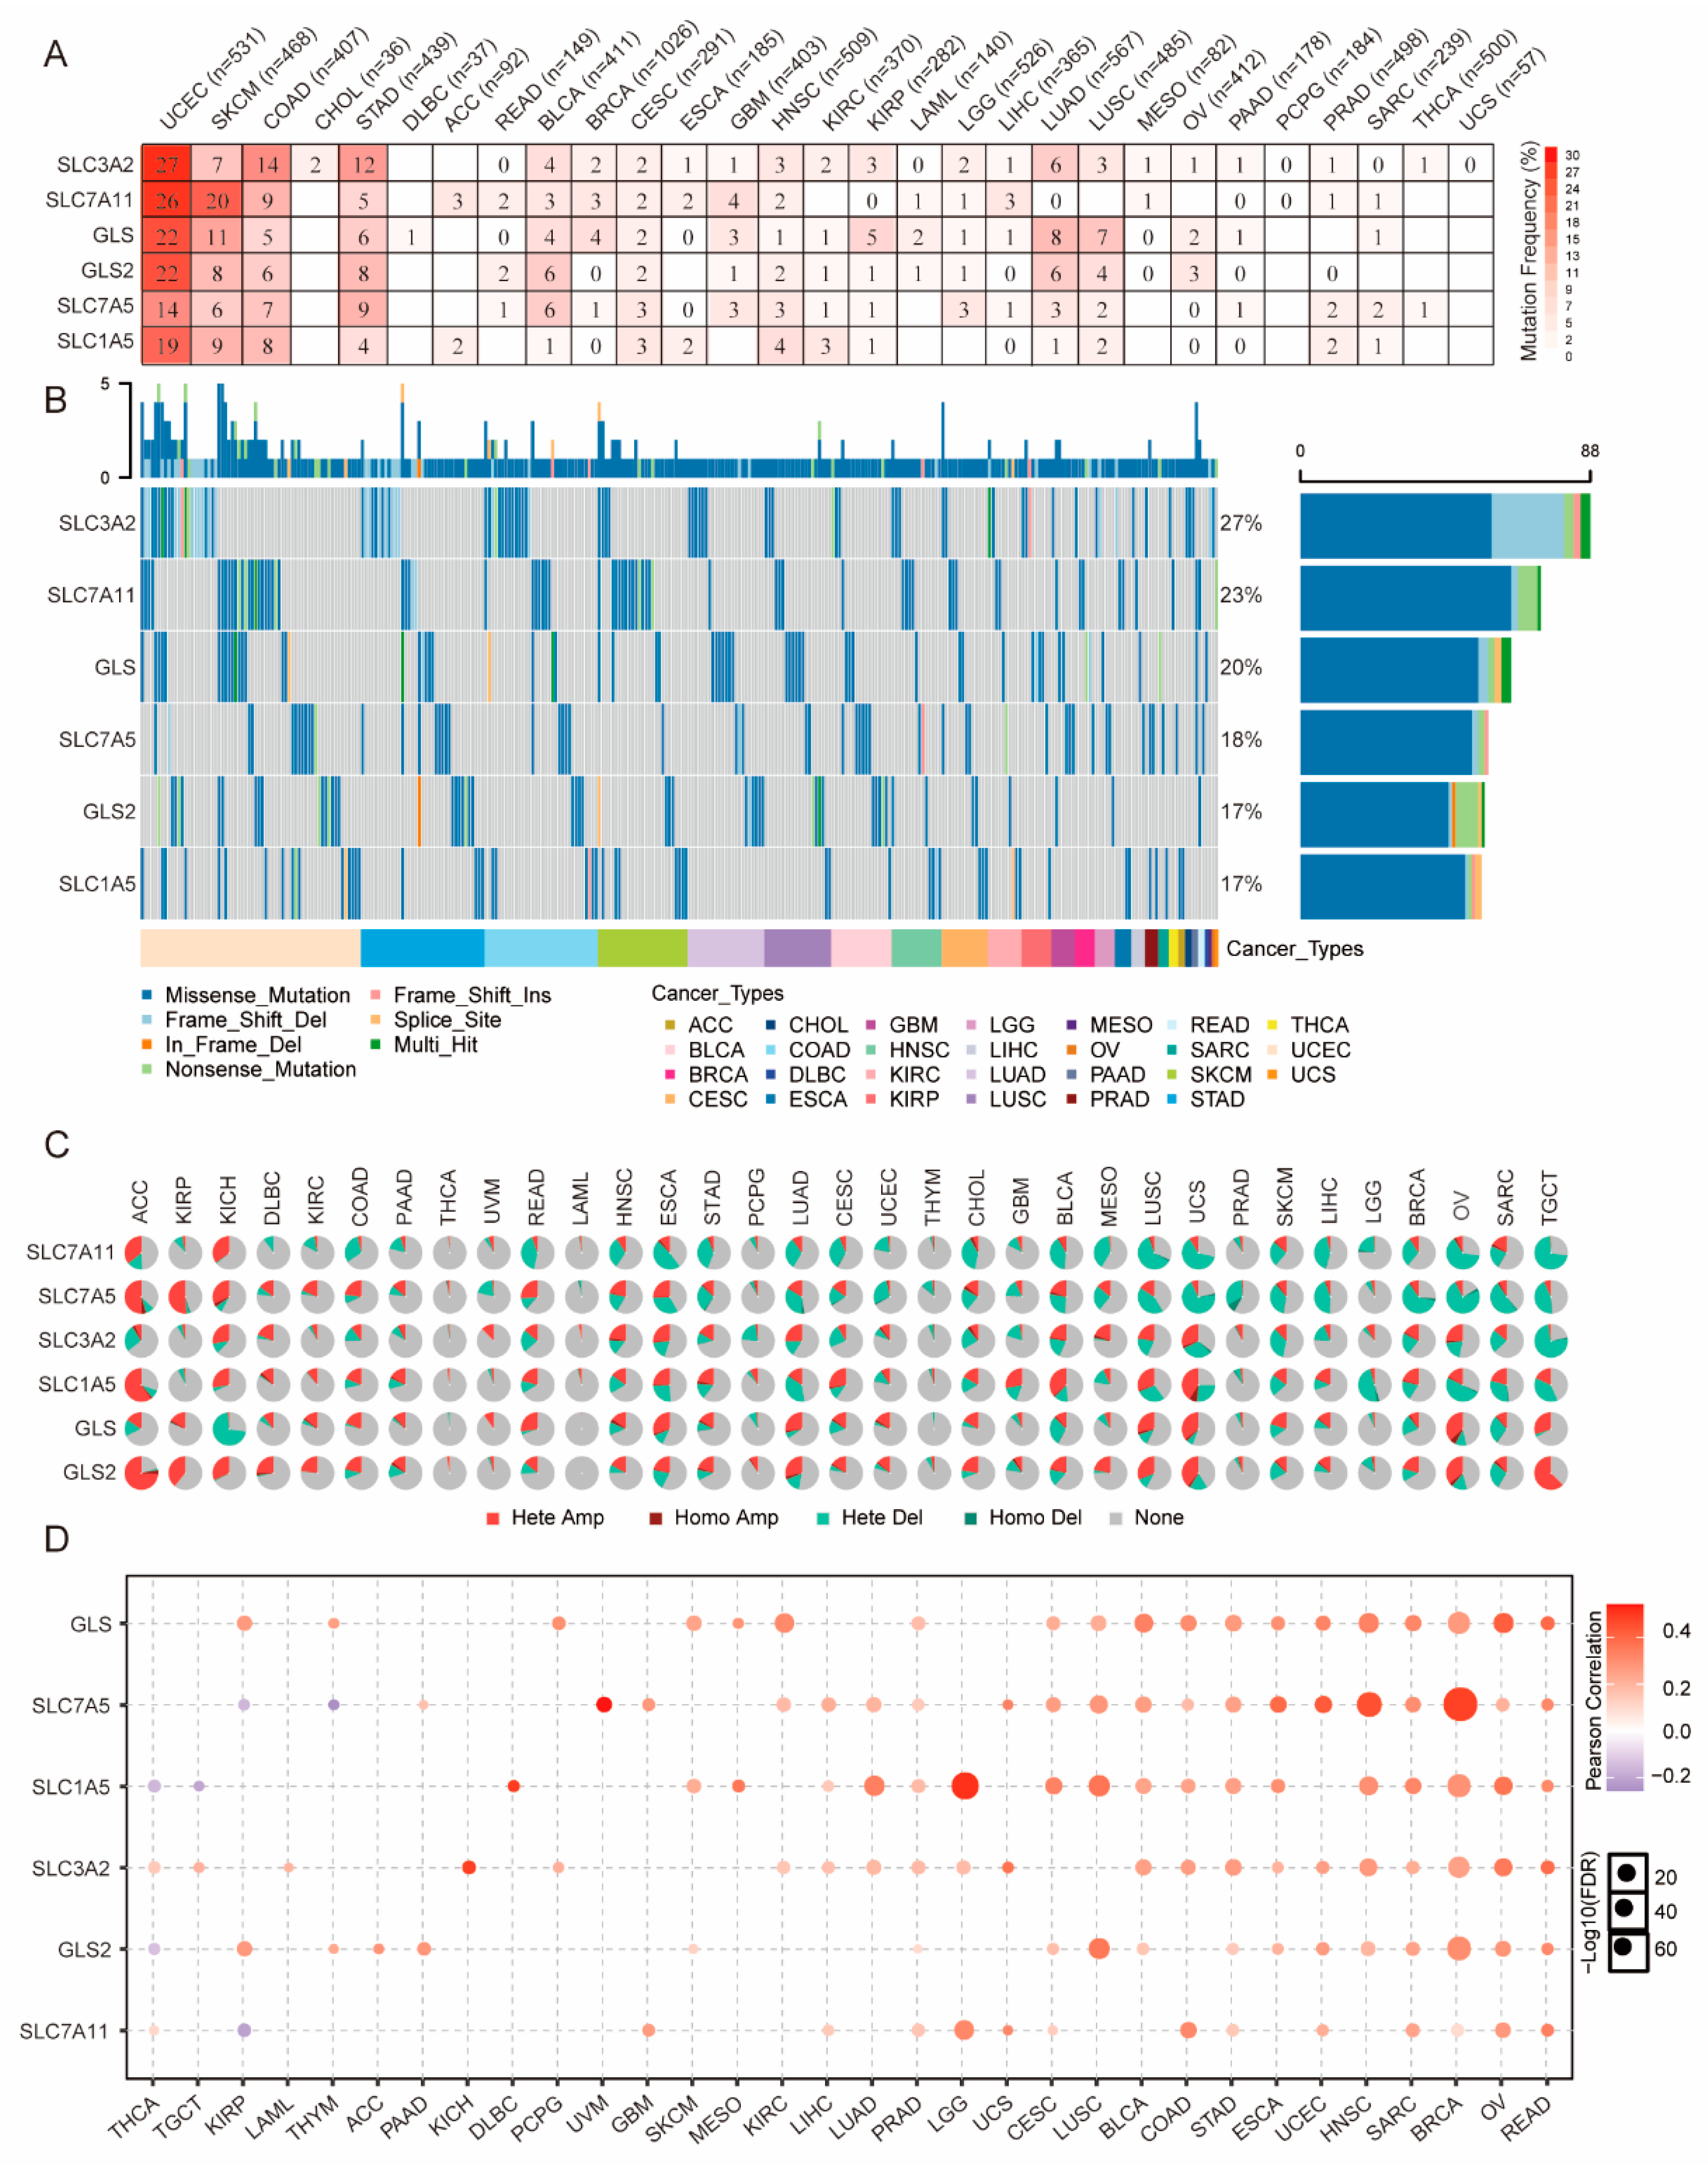
3.2. Genetic Alterations of GLNM Regulators in Various Cancers

To identify the genetic alternations of the GLNM regulators, we assessed the SNV frequency and variant types across 33 types of cancer. The cancer types ranked from high to low by SNV frequency were UCEC (130%), SKCM (61%), COAD (49%), STAD (44%), BLCA (24%), LUAD (24%), LUSC (18%), HNSC (15%), CESC (14%), GBM (12%), KIRP (11%), and BRCA (10%). The SNV frequency was less than 10% in the remaining 15 cancer types. There were no mutations of six GLNM regulators in PCPG and UCS (Figure 3A). The genes ranked from high to low by SNV frequency were SLC3A2 (27%), SLC7A11 (23%), GLS (20%), SLC7A5 (18%), GLS2 (17%), and SLC1A5 (17%) (Figure 3B). The mutation types included missense mutation, in-frame deletion, nonsense mutation, splice site, frame-shift deletion, frame-shift insertion, multi-hits, and missense mutation, which was the most abundant type. In general, the mutation frequencies of SLC3A2 (27%) and SLC7A11 (23%) were the highest and the main mutation type observed was the missense mutation.
We then explored the proportions of the different CNV types of the GLNM regulators, as well as the correlation between the CNV and the mRNA expression. The pie chart shows that the main variation types were heterozygous amplification and heterozygous deletion (Figure 3C). Heterozygous amplifications with percentages >25% were found for SLC7A11 in ACC and KICH; SLC7A5 in ACC, KIRP, KICH, and READ; SLC3A2 in KICH, ESCA, UCS, and OV; SLC1A5 in ACC, KICH, CESC, GBM, BLCA, LUSC, and UCS; GLS in READ, ESCA, LUAD, LUSC, UCS, OV, and TGCT; and GLS2 in ACC, KIRP, KICH, LUAD, LUSC, UCS, OV, and TGCT. Heterozygous deletions with percentages >25% were found for SLC7A11 in COAD, READ, HNSC, ESCA, STAD, CESC, CHOL, BLCA, MESO, LUSC, UCS, LIHC, OV, and TGCT; SLC7A5 in ESCA, LUAD, BLCA, LUSC, UCS, PRAD, SKCM, LIHC, BRCA, OV, SARC, and TGCT; SLC3A2 in UCS, SKCM and TGCT, SLC1A5 in LUAD, LGG, OV, SARC, and TGCT; and GLS in KICH, BLCA, and SARC. The correlation analysis indicated that the mRNA expression of these regulators was significantly positively correlated with the CNV in the majority of cancer types (p < 0.05, Figure 3D). These results suggested that heterozygous amplification and heterozygous deletion were common among these regulators, mediating their abnormal expression and possibly playing an essential role in cancer development.

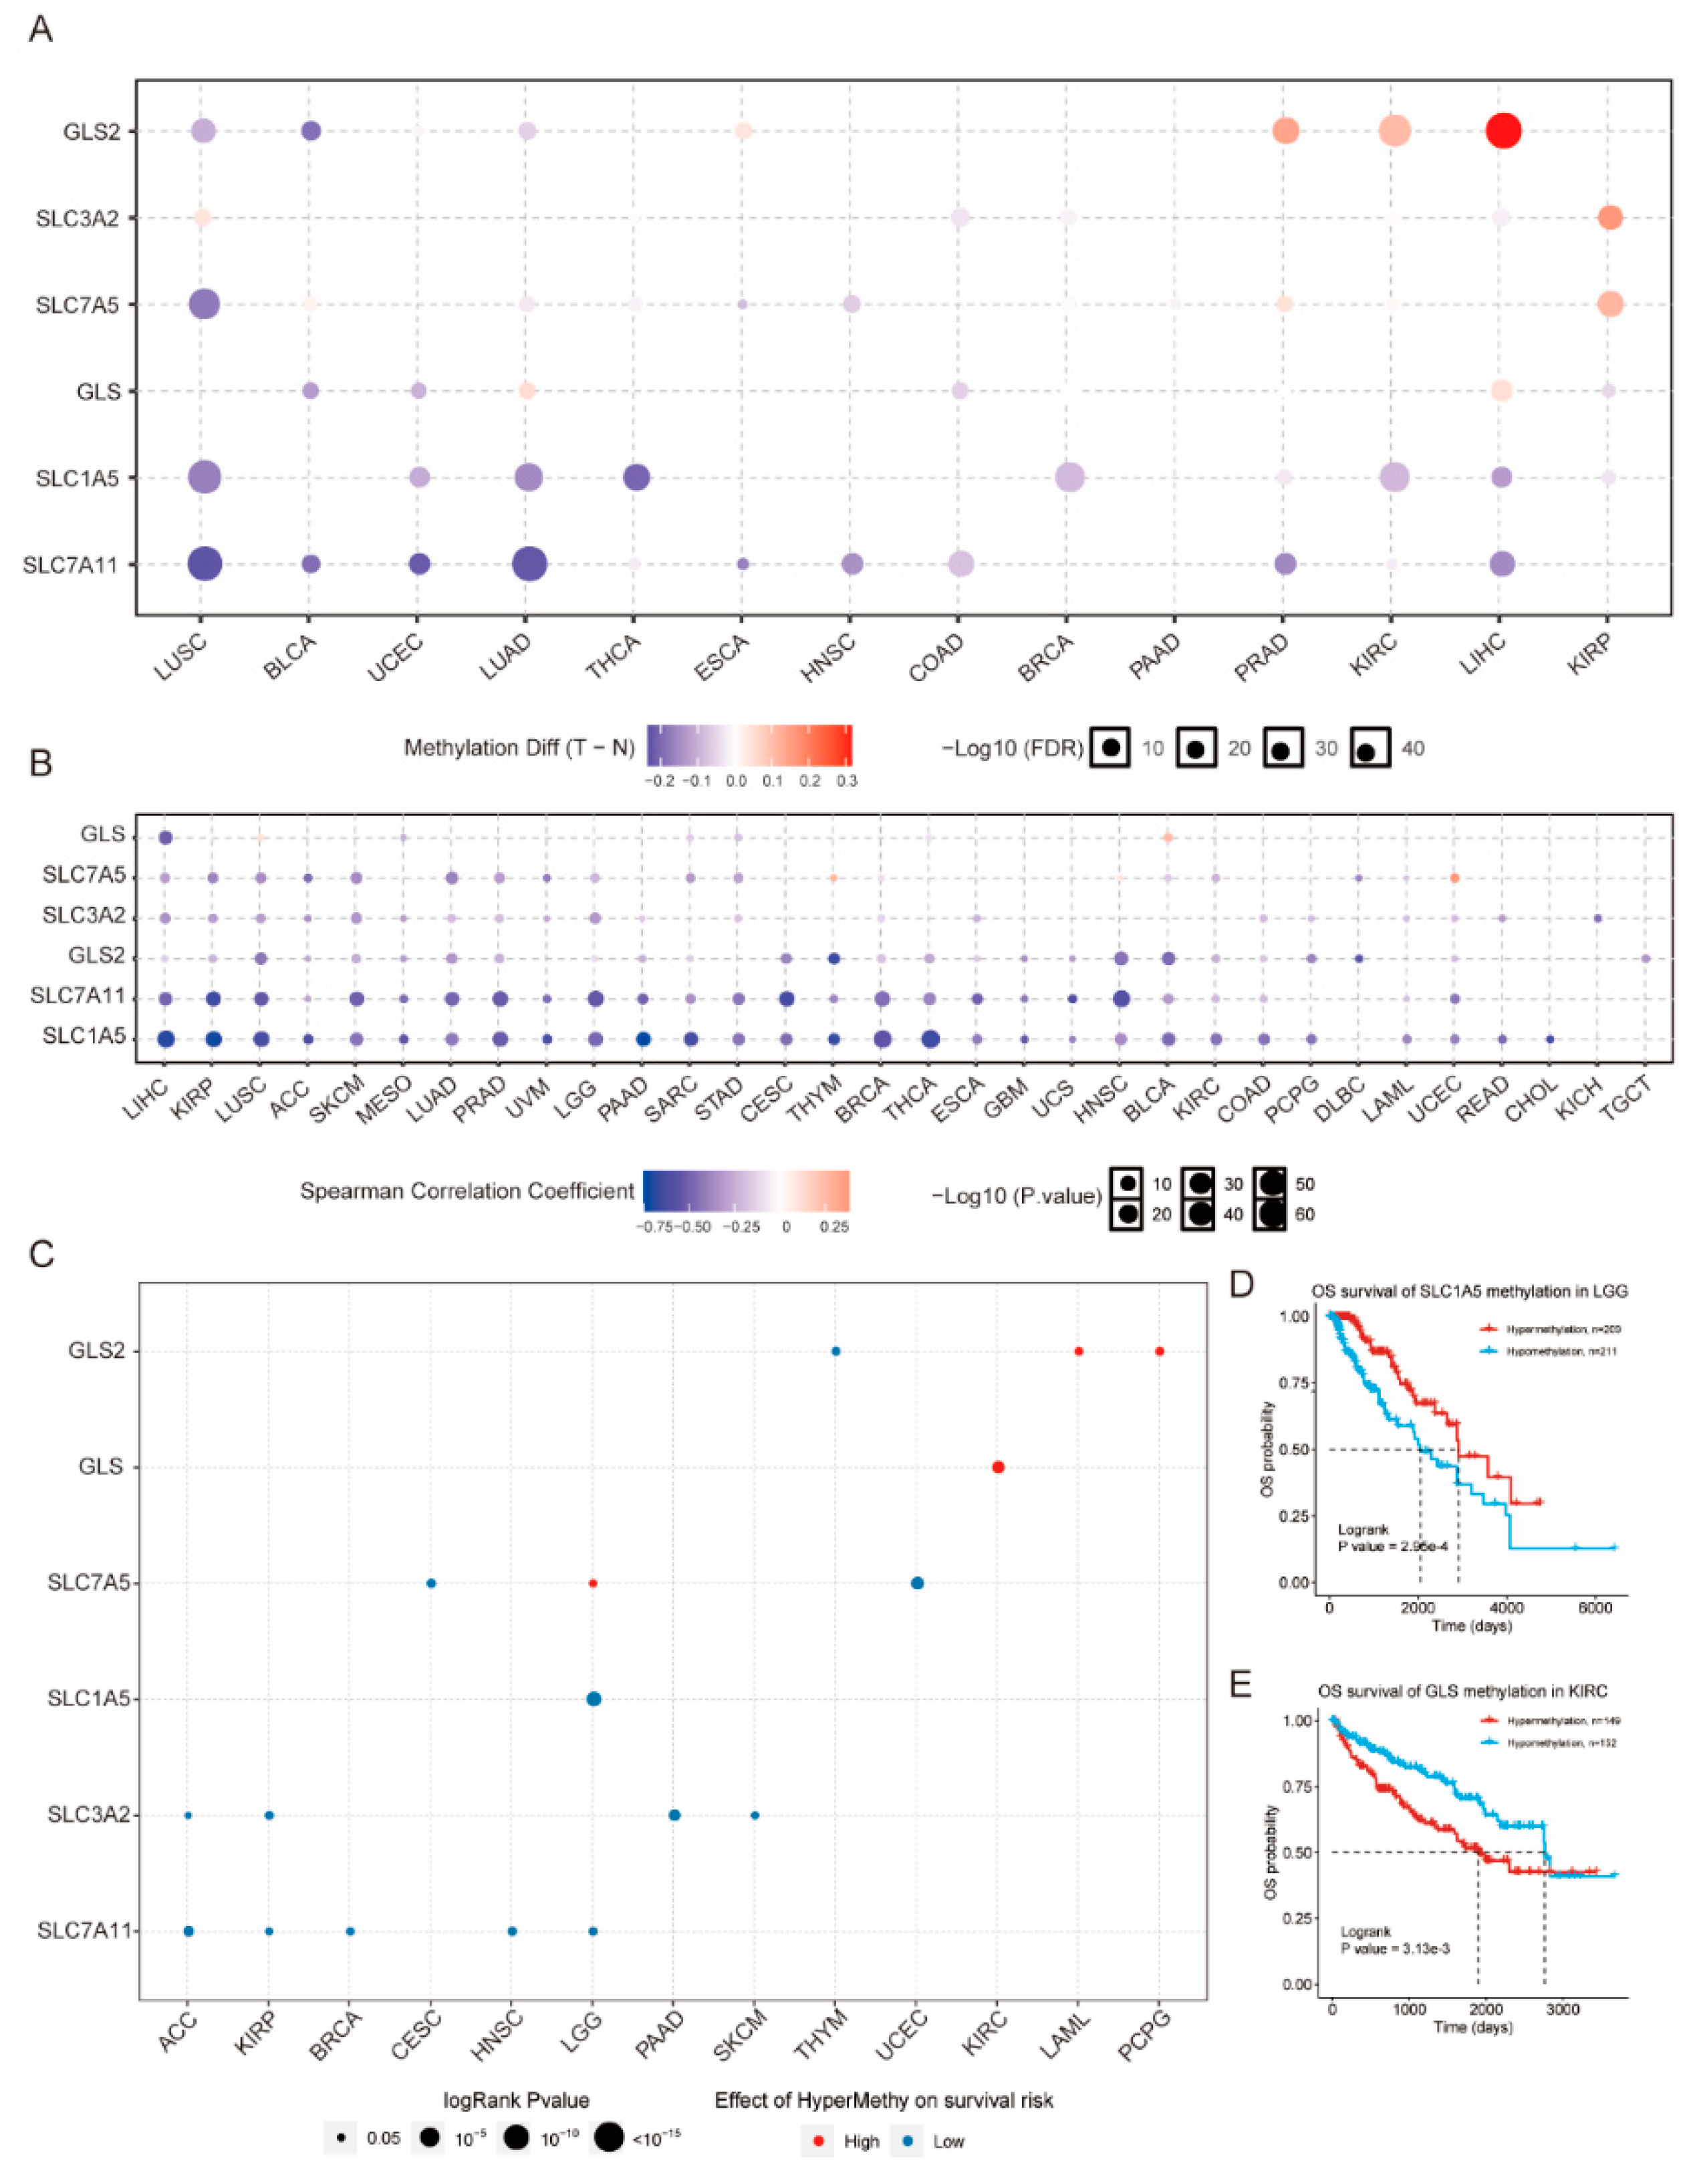
3.3. Epigenetic Alteration of GLNM Regulators in Various Cancers

Differential methylation analysis showed that the methylation levels were significantly lower than those of normal tissues for the following: SLC7A11 in LUSC, BLCA, UCEC, LUAD, ESCA, HNSC, COAD, PRAD, and LIHC; SLC1A5 in LUSC, UCEC, LUAD, THCA, BRCA, KIRC, and LIHC; GLS in BLCA, UCEC, COAD, and KIRP; SLC7A5 in LUSC, ESCA, and HNSC; SLC3A2 in COAD; and GLS2 in LUSC, BLCA, and LUAD; however, the methylation levels were significantly higher in tumor tissues compared to normal tissues for GLS in LUAD and LIHC; SLC7A5 in PRAD and KIRP; SLC3A2 in LUSC and KIRP; and GLS2 in ESCA, PRAD, KIRC, and LIHC (Figure 4A). The analysis of the correlation between methylation and mRNA expression indicated that the methylation of the GLNM regulators was significantly negatively correlated with their expression, except for GLS in BLCA and for SLC7A5 in THYM and UCEC (Figure 4B). The overall survival rates in the hypermethylation and the hypomethylation groups showed that the hypermethylation of SLC1A5, SLC3A2, and SLC7A11 was a low-risk factor for survival in most of the cancer types; however, hypermethylation was identified as a high-risk factor for survival for SLC7A5 in LGG, GLS in KIRC, and GLS2 in LAML and PCPG (Figure 4C,D). These results indicated that the abnormal expression of the GLNM regulators could be regulated by aberrant DNA methylation, which could ultimately influence the prognosis of cancer patients.

3.4. Significant Correlation of GLNM Regulators with Survival

The survival analysis showed that patients with high expression levels of SLC7A5, SLC7A11, GLS, SLC1A5, and SLC3A2 had significantly poorer prognoses for most of the cancer types, while those with high expression of GLS2 exhibited significantly better prognoses for KIRC, CESC, LUAD, KICH, LGG, and MESO (Figure 5A). To further assess the integrated effects of the GLNM regulators on survival, we performed a survival analysis through the GEPIA2 platform based on a six-gene signature (the GLNMR signature). The results showed that patients in the low-GLNMR signature group had a better overall survival rate than those in the high-GLNMR group in terms of ACC, HNSC, KICH, KIRC, LGG, LIHC, MESO, and SARC (all p < 0.05, Figure 5B–I); however, there were no significant differences between the two groups in terms of CESC, ESCA, GBM, KIRP, LUAD, THYM, and UCEC (Figure S1). These results demonstrate that the dysregulated expression patterns of the GLNM regulators were closely associated with the prognoses of patients with ACC, HNSC, KICH, KIRC, LGG, LIHC, MESO, and SARC.

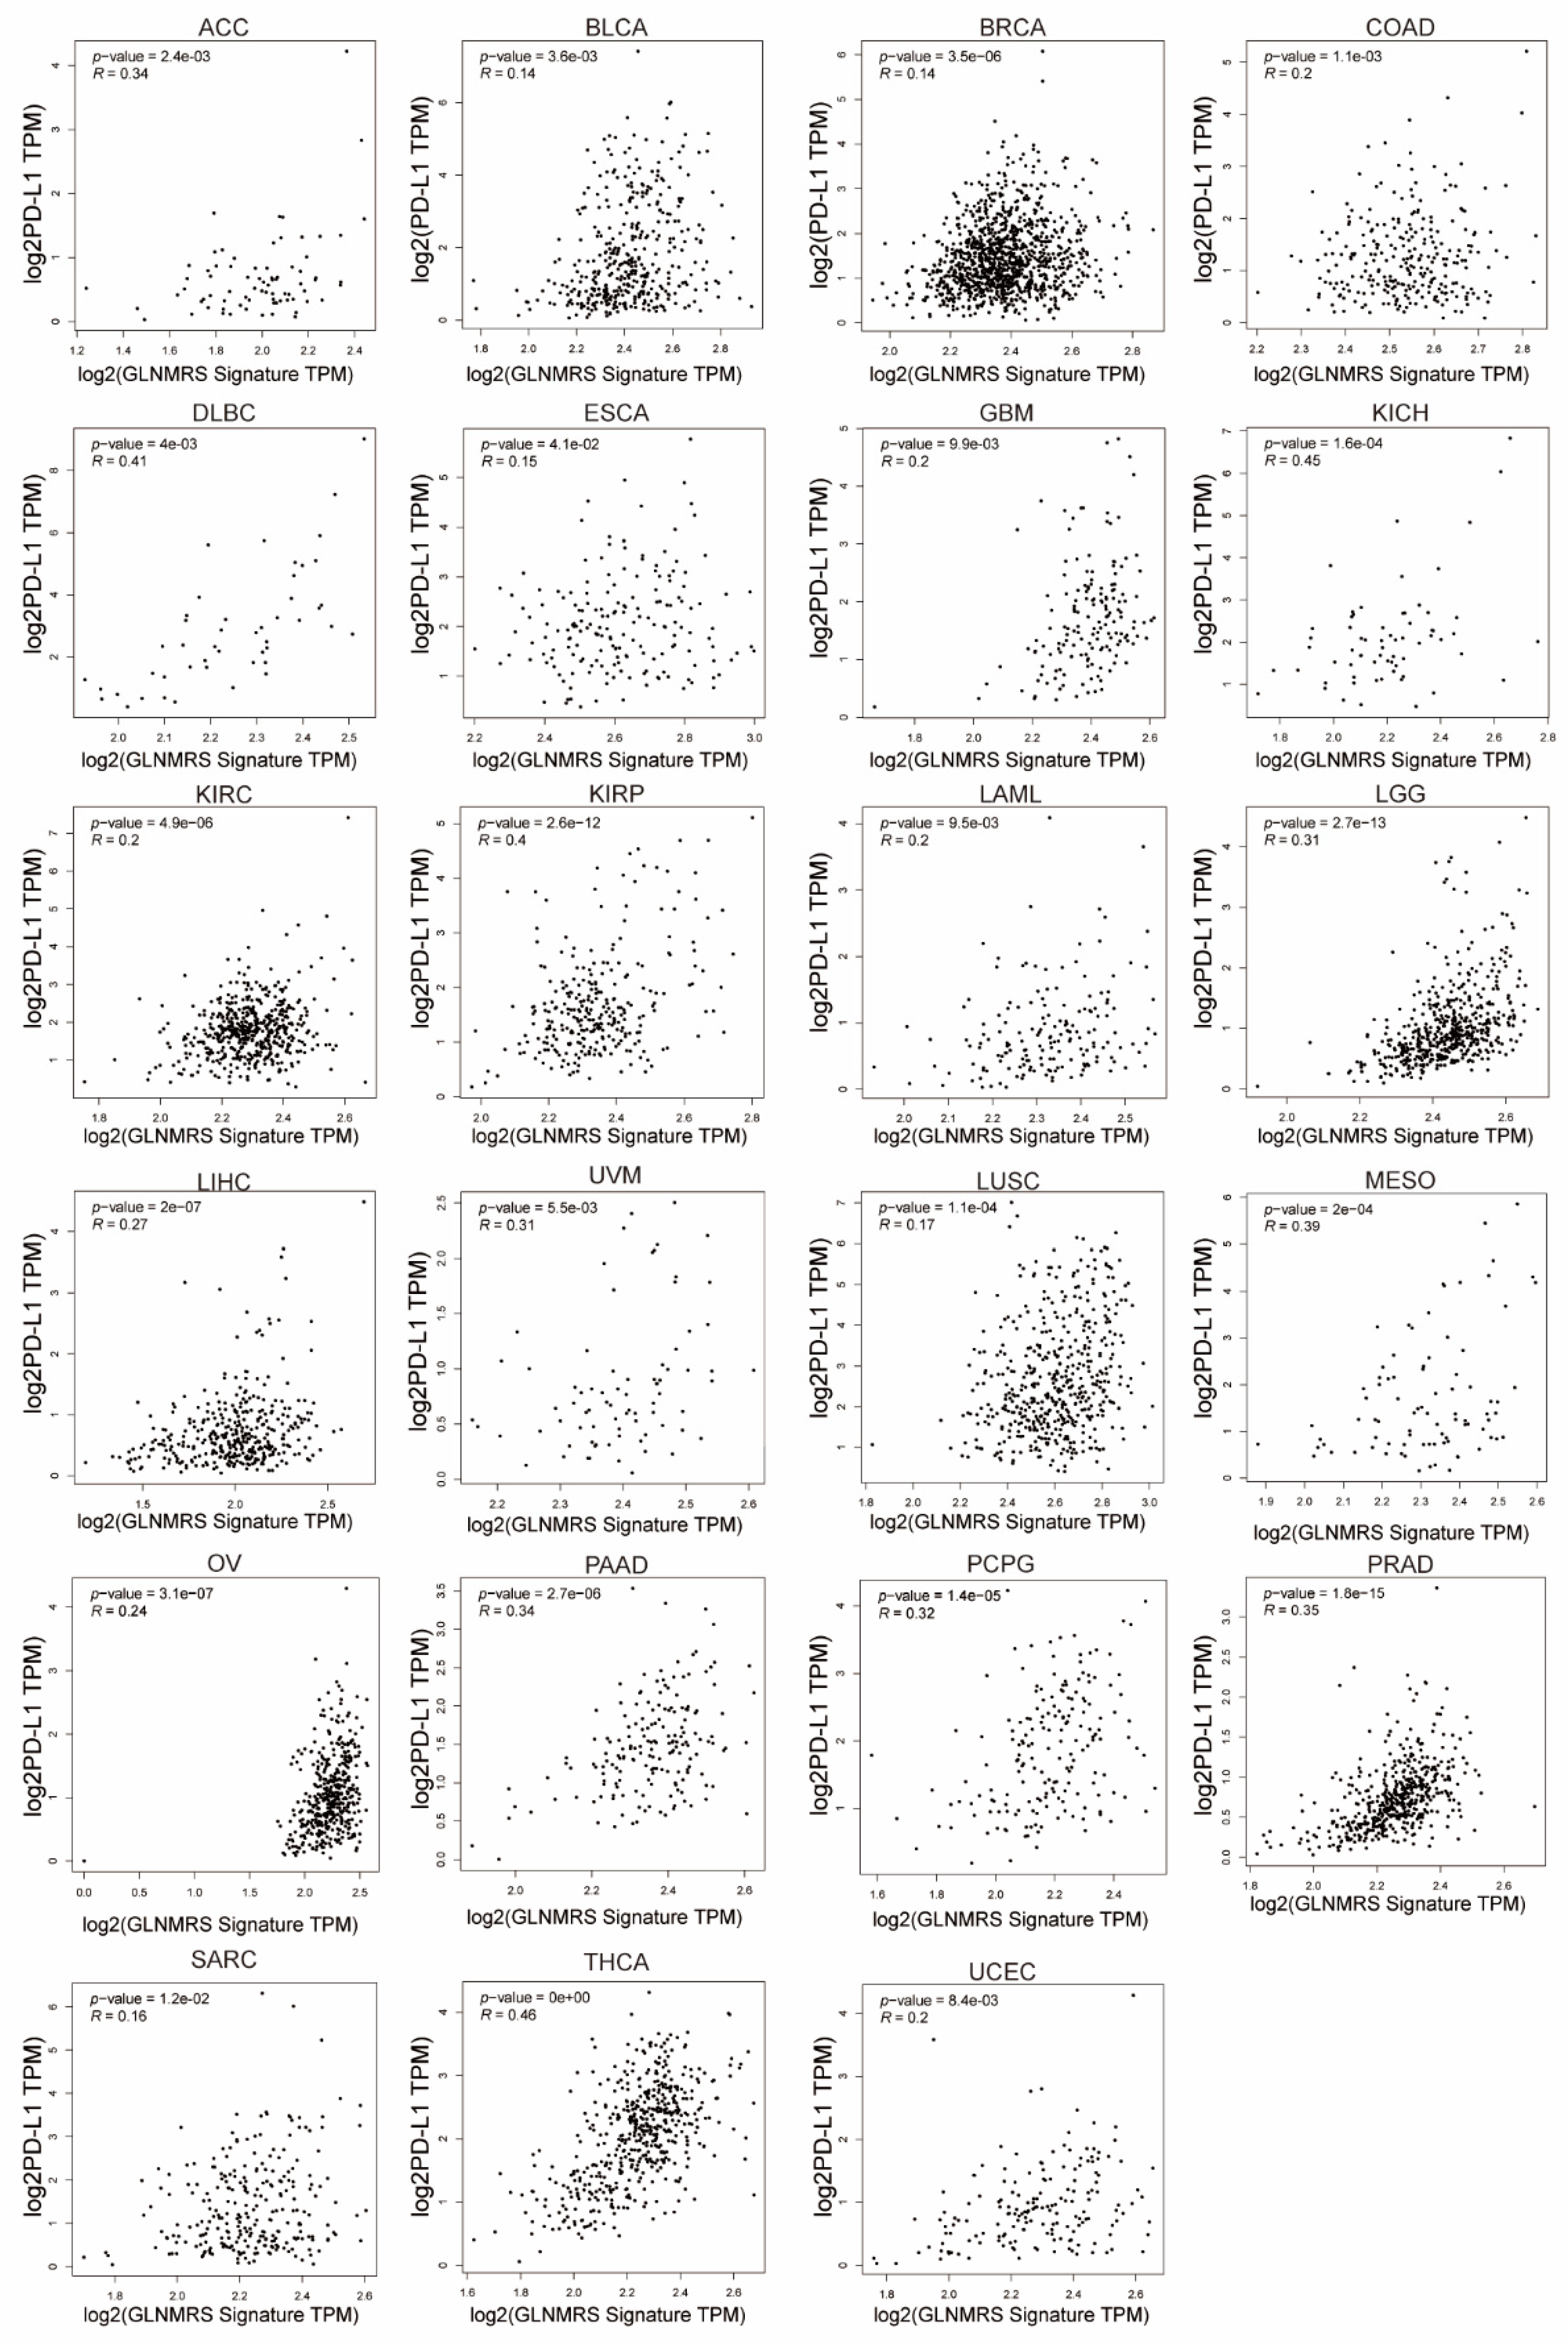
3.5. Association of Immune Cell Infiltration and PD-L1 with GLNM Regulators

To explore the involvement of glutamine metabolism in TME, we assessed the correlation of immune cell infiltration and PD-L1 with the GLNM regulators. We found that the immune score, stroma score, and microenvironment score were significantly related to the expression of the GLNM regulators (Figure 6A). There were significantly negative relationships between the immune scores and the GLNM regulators for ESCA, HNSC, KIRP, LAML, OV, READ, SKCM, STAD, TGCT, and UCEC. Next, we further assessed the correlations between the infiltration of 24 immune cells and gene set expression scores (GSVA scores). Based on the correlation patterns between the immune cell infiltrations and the GSVA scores of GLNM regulators, we observed two clusters of cancer types (Figure 6B). These two clusters displayed distinct patterns of immune cell infiltration. Significantly positive correlations were found between the expression of GLNM regulators and the infiltration of immunosuppressive cells (including nTreg, iTreg, exhausted, DC and macrophage cells) in THCA, PCPG, LIHC, GBM, SARC, KICH, PRAD, BRCA, MESO, and UVM. Significantly negative associations were found between the expression of GLNM regulators and the infiltration of the following immune effector cells: NK, CD8+ T, Tfh and CD4+ T cells in TGCT, CESC, LUAD, LUSC, SKCM, ESCA, STAD, COAD, PAAD, and HNSC. We then explored the relationship between the expression level of PD-L1 and the GLNM regulators. We observed that the expression of PD-L1 had significantly positive associations with the expression of GLNM regulators in 23 types of cancers, including ACC, BLCA, BRCA, COAD, DLBC, ESCA, GBM, KICH, KIRC, KIRP, LAML, LGG, LIHC, LUSC, MESO, OV, PAAD, PCPG, PRAD, SARC, THCA, UCEC, and UVM (Figure 7); however, there were no significant associations between PD-L1 expression and the expression of GLNM regulators in the remaining ten cancer types (Figure S2). In general, we demonstrated that increased expression of GLNM regulators was associated with a cold tumor immune microenvironment in almost all cancer types and upregulated PD-L1 expression in ACC, KICH, KIRC, LGG, LIHC, MESO, and SARC, which implied a positive association with immunotherapeutic responsiveness.

3.6. Effects of Aberrant GLNM Regulator Expression on Drug Sensitivity

To elucidate the influence of the GLNM regulators on the effects of drug treatment, we used the GDSC data to investigate the relationship between gene expression and drug sensitivity. We found that GLS2 expression was positively correlated with resistance to CHIR-99021, piperlongumine, A-770041, AZD6482, AZD7762, BEZ235, bortezomib, CGP-60474, dasatinib, HG-6-64-1, MG-132, midostaurin, SB216763, TGX221, temsirolimus, WH-4-023, XMD8-85, and Z-LLNle-CHO. In contrast, GLS expression was negatively associated with the resistance to the drugs stated above. The expression of SLC7A11, SLC3A2, and SLC1A5 showed a significantly positive correlation with drug resistance (Figure 8). These results indicated that changes in the expression of GLNM regulators may be an effective indicator for predicting drug responses and could serve as a potential treatment target.

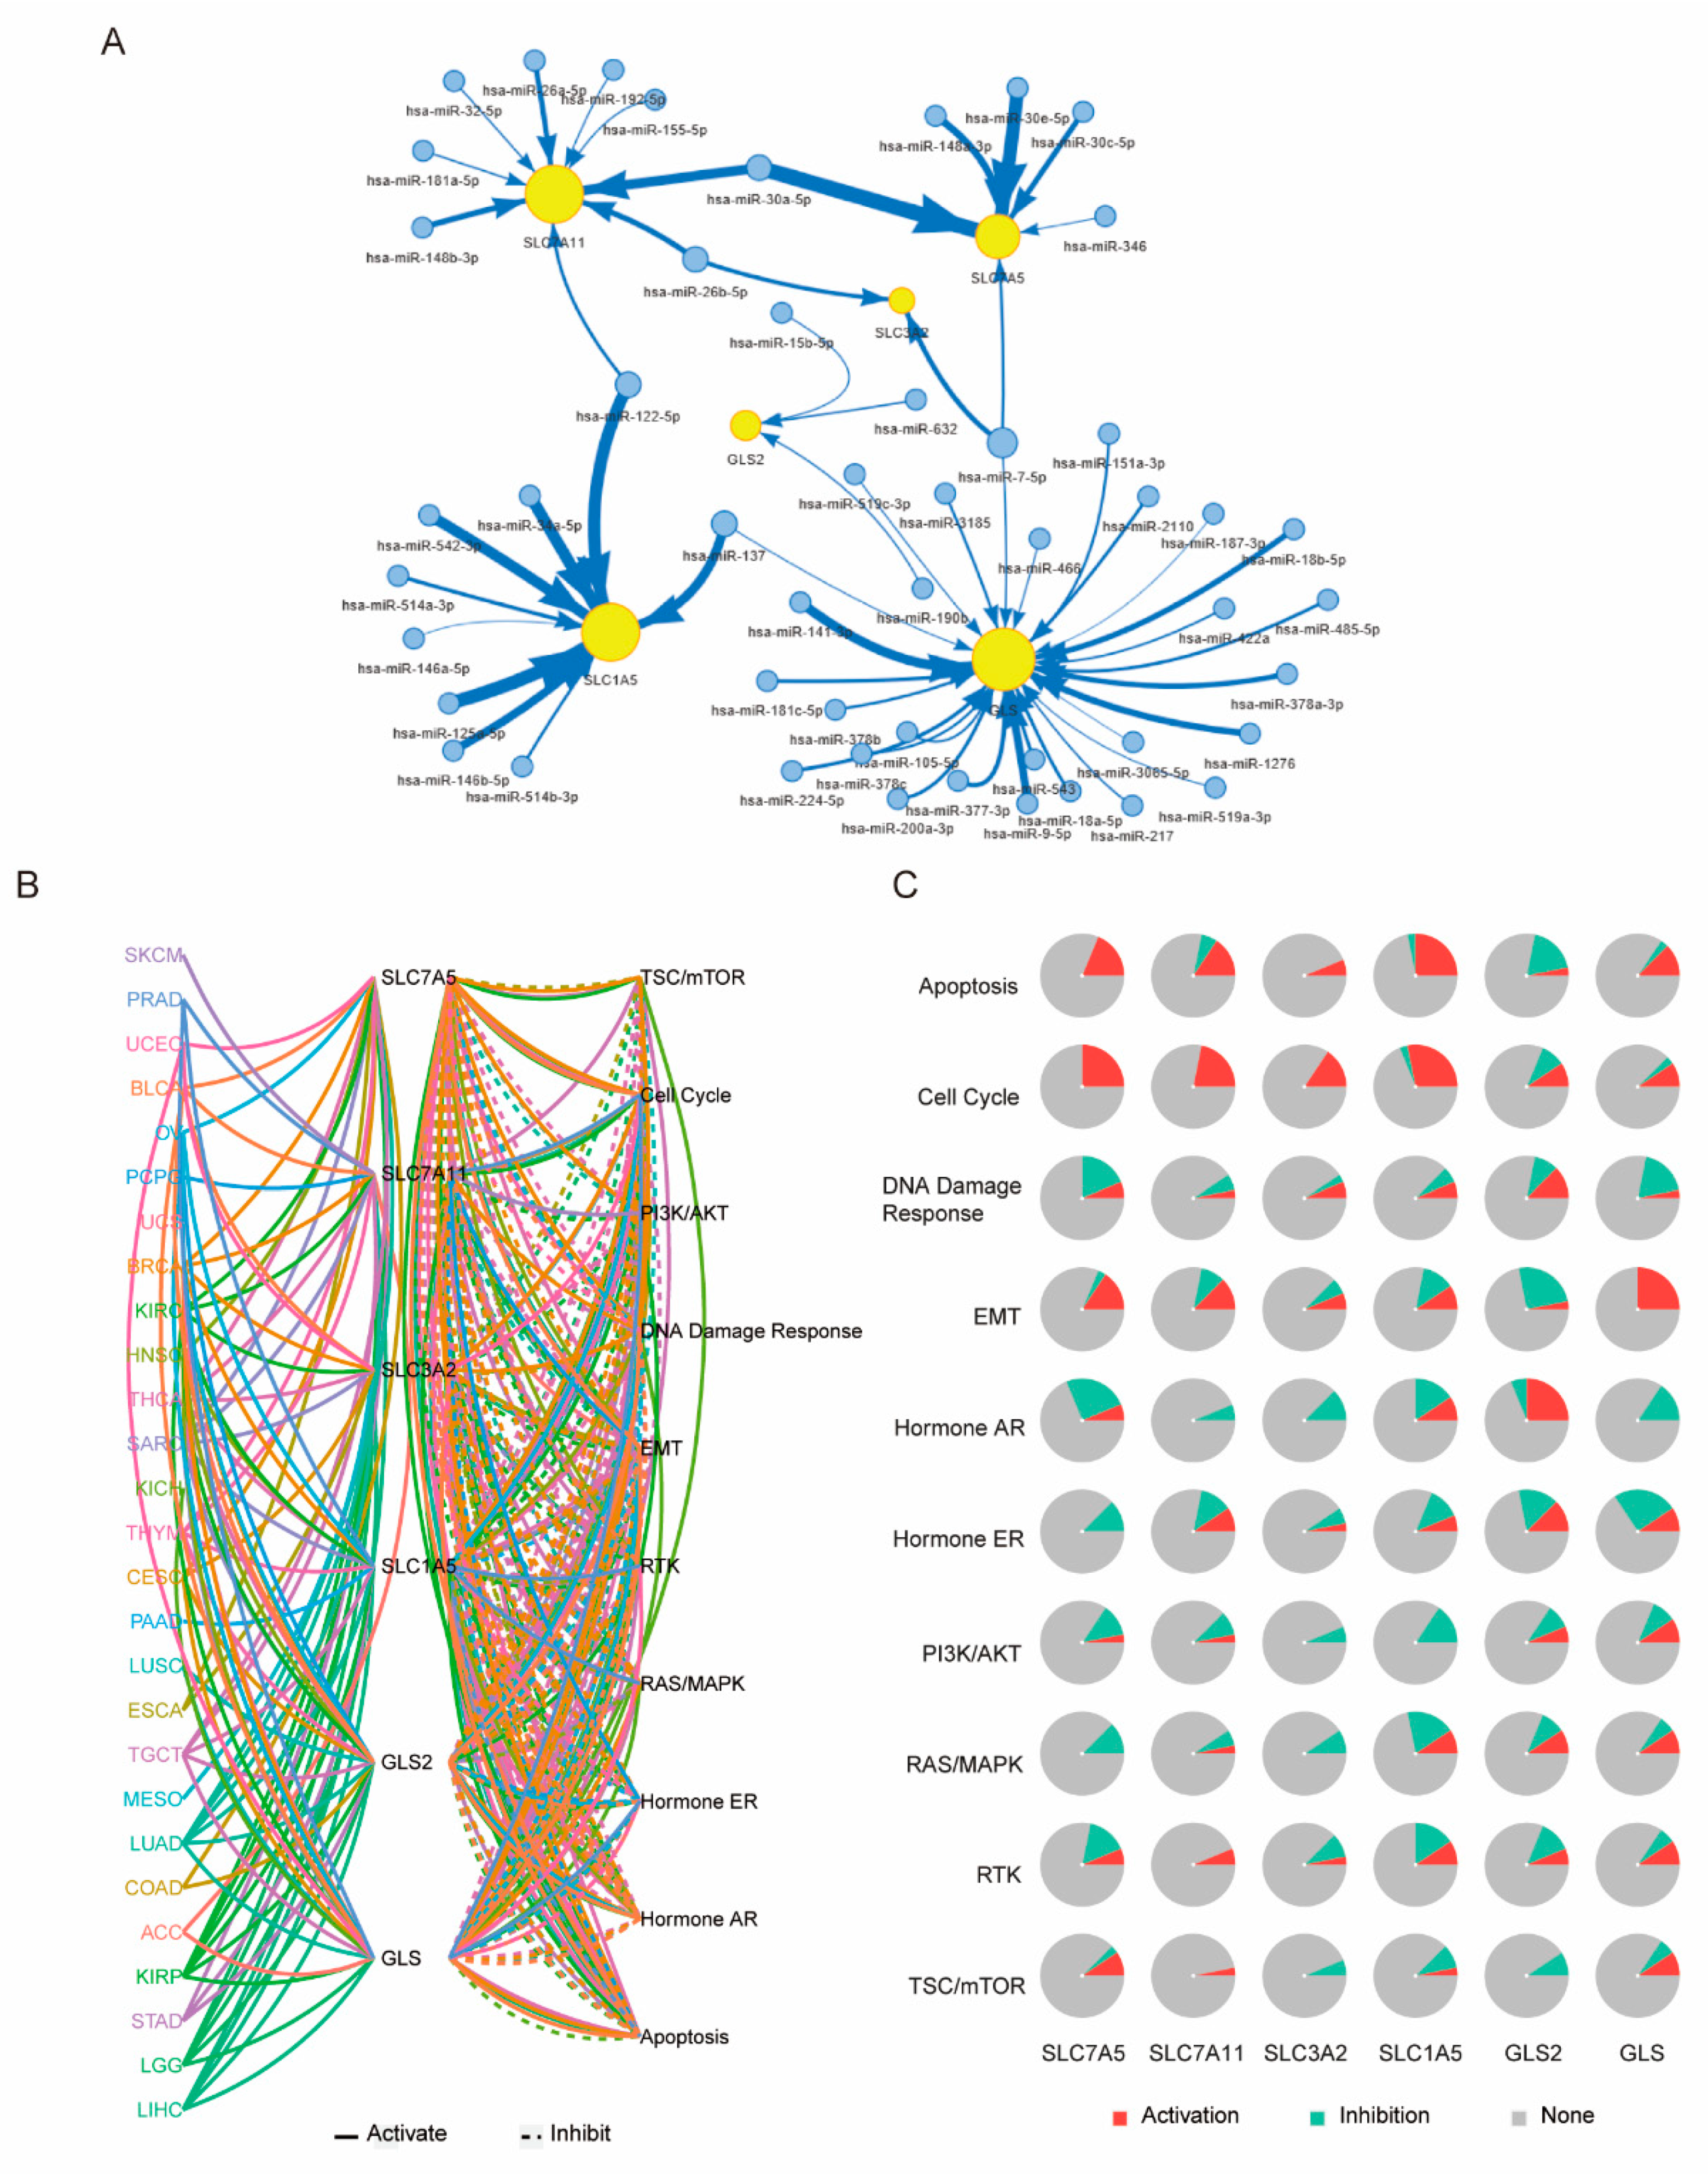
3.7. Underlying Molecular Mechanism of GLNM Regulator Alteration

The miRNA-to-gene network analysis showed that all six of the GLNM regulators were regulated by more than one miRNA. SLC3A2 is regulated by only two miRNAs, while GLS is regulated by 27 miRNAs. In addition, the same miRNA could regulate multiple genes, such as hsa-miR-7-5p, which regulated SLC3A2, SLC7A5, and GLS (Figure 9A). This indicated that a complex miRNA regulatory network finely regulated the expression of the target GLNM regulators and was involved in tumor development and progression. The pathway analysis showed that the GLNM regulators were involved in TSC/mTOR, the cell cycle, PI3K/AKT, the DNA damage response, EMT, RTK, RAS/MAPK, hormone ER, hormone AR, and apoptosis pathways. The percentage of cancers in which a GLNM regulator had an effect on a certain pathway showed that the transporters, including SLC7A5, SLC7A11, SLC3A2, and SLC1A5, were involved in the activation of apoptosis and the cell cycle in most cancer types, while GLS2 was mainly involved in the activation of hormone AR and GLS was mainly involved in the activation of EMT (Figure 9B). These data suggested that the GLNM regulators might play vital roles in regulating cancer-related pathways.

4. Discussion

Proper expression of the GLNM regulators is essential for maintaining the balance between glutamine metabolism and cell survival. In the present study, we systemically investigated the relationships between the expression of GLNM regulators and genomic alterations, TME characteristics, prognosis, drug sensitivity, and the underlying molecular mechanisms. Our study demonstrated that in most cancer types, SLC1A5, SLC7A5, SLC7A11, and SLC3A2 were highly expressed and indicative of poorer survival outcomes, while the effects of changes in the expression of GLS2 and GLS depended on the type of cancer under consideration. High GLS2 expression was associated with a better prognosis, while high GLS expression was associated with a poorer prognosis. In previous studies, the glutamine transporters SLC1A5, SLC7A5, SLC7A11, and SLC3A2 were found to be highly expressed in a variety of cancers [27,28,29,30]. These transporters mediate glutamine transport, playing a vital role in tumor cell metabolism, proliferation, and cancer prognosis. GLS and GLS2 appeared to exhibit different expression patterns and functions in different types of tumors. In addition, the two glutaminases exhibited diverse roles in tumorigenesis and were shown to suppress or promote tumor development, depending on the specific tumor type. GLS2 expression was scarce in hepatocellular carcinomas and glioblastomas, which showed high levels of GLS [31]. Based on cell line analysis, it was found that the expression of GLS2 was inversely correlated with GLS in 52% of the 33 cancer types. Moreover, it has been reported that GLS is frequently upregulated in most cancers, which is somewhat different from our results [31,32]. In the present study, GLS2 expression and overall survival were positively correlated in most of cancers, with GLS2 presenting as a suppressor gene. The normal tissue samples in the TCGA dataset were taken from tissues near tumors and may be similar to, but not representative of, true normal tissue. The comparison of tumor tissues with relatively distant normal tissues might have allowed for a more accurate evaluation of differentially expressed genes. This issue may have been responsible for some of the contradictions between the identified upregulation of GLNM regulators in previous studies and our own observation of no significant upregulation in certain cancer types. In general, these regulators could serve as good predictors of the prognosis of different cancer types.
Our results reveal that complex genomic and epigenomic modulations of the GLNM regulators affected their expression, resulting in the metabolic reprogramming of cancer. A previous study had demonstrated that the epigenetic silencing of GLS2 by promoter hypermethylation was common in human liver cancer, in accordance with the results observed in our study [33]. Additionally, the upregulation of GLNM regulators through miRNAs appears to be another important mechanism. For example, miR-122 has been reported to modulate the expression of SLC1A5 in hepatocellular carcinoma [34]. In addition, miR-26b has been shown to target SLC7A11 [17]. We confirmed some of the results shown in previous studies, further supporting the reliability of our findings. We also identified new miRNAs that had not been previously studied. These results can provide theoretical and experimental evidence of the development of safe and effective tumor-targeted drugs. Mechanically, these GLNM regulators are tightly correlated with the activation and inhibition of cancer-related pathways. It was demonstrated that in multiple cancer types, higher GLS2 expression was negatively correlated with an EMT signature, which may shed light on the mechanism of tumor suppression by GLS2. GLS2 has been identified as a p53 target gene, which may contribute to its tumor suppressor function [35]. In the liver orthotopic model, intrahepatic metastasis and lung metastasis were inhibited by overexpression of GLS2 [36]. Knockdown of endogenous GLS2 by shRNA promoted lung metastasis of liver cells in nude mice [37] Mechanistically, GLS2 negatively regulates the activity of the PI3K-AKT signaling pathway and Rac1 by mediating p53 function [37]. Although GLS2 tends to exhibit tumor-suppressing activity, it was reported as a pro-tumorigenic gene in luminal-subtype breast tumors [38]. Actually, the expression of GLS2 is also regulated by oncoproteins including N-myc; therefore, GLS2 may display complex and diverse modulatory functions in cancer cells. These regulators are functionally coupled, and the whole dynamic process of glutamine metabolism cannot be successfully evaluated in terms of single regulators; thus, we comprehensively evaluated the differences in gene expression between tumors and normal tissues, as well as the prognostic differences between the high-expression and low-expression groups. Comprehensive gene expression profiles can better reflect dynamic metabolic processes, such as glutamine uptake and glutaminolysis.
Although there has been a rapid increase in immunotherapy, the limited beneficiary population and drug resistance are hindering its further development. Metabolically reprogrammed tumor cells compete with immune cells for nutrients and release metabolites into the microenvironment, which inhibit the function of antitumor immune cells; thus, blocking the abnormal metabolism of tumor cells may be a potential way to improve the efficacy of immunotherapy. Previous studies have reported that in breast cancer, glutamine metabolism alterations increased the secretion of G-CSF and GM-CSF, then recruited MDSC to promote tumor progression [39]. The enhanced glutamine uptake influenced the composition of the immune cell infiltrates and was significantly associated with upregulated PDL1 expression as well as poor survival outcomes in breast cancer [40]. In this study, we found that the alteration of the GLNM regulators led to a cold TME, which was negatively correlated with the immune score and immunoeffector cells and positively correlated with immunosuppressive cells. Interestingly, in different tumors, the cold immune microenvironment had distinct phenotypes. Some tumors presented with substantial immunosuppressive cell infiltration, while others presented with decreased infiltration of immunoeffector cells. In addition, the high expression of the GLNM regulators was significantly positively correlated with PD-L1 expression, as was the case in previous studies. Previous studies have demonstrated that the expression of PD-L1 was upregulated in renal cancer cells in glutamine deprivation culture medium via the EGFR/ERK/C-Jun pathway [41]. The expression of PD-L1 was mediated via the nuclear factor-kappa B (NF-kB) signaling pathway, which was activated by the reduction in GSH levels [42]. Upregulated SLC7A11 promoted the expression of PD-L1 and CSF1 through the αKG/HIF1α axis, which further recruited TAMs and MDSCs infiltration [43]. These results suggested that targeting these regulators may provide a way in which to reverse the cold immune microenvironment and enhance the antitumor effects. For tumors with high expression levels of the regulators and PD-L1, a combination of targeted therapy and immunotherapy may yield better results. Our analysis is the first to identify the two distinct TME patterns affected by the alterations of GLNM regulators across 33 cancer types; however, the underlying mechanism of the effects of these GLNM regulators on the immune microenvironment requires further research.
Due to the rapid proliferation of tumor cells, there is an increased need for glutamine and the GLNM regulators are frequently overexpressed to meet this demand. Regulators that specifically maintained this biological process in tumor cells can be used to develop a novel class of anticancer drugs; the logical basis for this strategy is depriving tumor cells of an important nutrient. Several inhibitors and blockers have been proposed to selectively target the regulators that are abnormally expressed in cancer [8]; however, all of these agents remain in the preclinical stage. SLC7A11 has been reported to induce selective drug resistance [15,16,17,44]. Recently, SLC7A11 was also reported to be involved in the sensitivity to the histone deacetylase inhibitors [45]; thus, the pharmacological blockade of SLC7A11 not only inhibits tumor growth, but also reverses resistance to certain drugs. In the present study, we observed that the high expression of GLS was positively or negatively correlated with resistance to specific drugs. We found that GLS expression was negatively associated with the sensitivity of temsirolimus, an mTOR inhibitor. Interestingly, combining the GLS inhibitor with an mTOR inhibitor is reported to result in a combinatorial effect [46,47,48]. The upregulation of GLS was reported to be induced following mTOR inhibition, providing a theoretical basis for the combination of GLS inhibitors and mTOR inhibitors. Moreover, GLS was identified as an activator of the mTOR pathway to promote colorectal carcinogenesis; therefore, we speculated that the increased expression of GLS would activate the mTOR signaling pathway, as the expression of GLS was negatively correlated with the sensitivity of mTOR inhibitors. On the other hand, we speculated that the use of mTOR inhibitors would upregulate the expression of GLS through a feedback mechanism, leading to drug resistance of mTOR inhibitors, meaning combined use would increase the efficacy. These correlations warrant further in-depth studies in a certain type of tumors. The relationship of GLNM regulator expression and drug sensitivity might provide an important theoretical basis for developing novel cancer treatments. Additionally, these findings provide a rationale for combination therapies to reverse resistance to certain drugs [49].
Despite the new insights into the alternations of GLNM regulators provided by our study, we note that there are some limitations. First, based on information from the TCGA, we could only assess the genetic changes in the tumor tissue as a whole, and it was not feasible for us to analyze the genetic changes in tumor cells and stromal cells separately. Second, we explored only a few potential alterations that can affect the expression and function of the GLNM regulators. Other related alterations that should be considered are post-transcriptional and post-translational modifications, such as mRNA splicing, m6A methylation, and altered protein stability. Third, since our study was mainly based on gene expression, we could not gain insights into the impacts of the CNV and SNV alternations on tumors. Finally, we did not perform any analyses that correlated the expression levels of GLNM regulators with those of demographic factors or pathologic factors other than overall survival.

5. Conclusions

In this study, we focused on the expression and function of six key GLNM regulators in tumors and the TME. Exploring the genomic alterations and miRNA network revealed additional mechanisms of the cancer-associated dysregulation of these regulators. Our results were in accordance with those of most previous studies and provided new information for subsequent studies. In addition, the significant effects of these regulators on the TME and drug resistance were identified, which provides a novel insight into cancer treatment and may offer alternative options for the treatment of clinically refractory cancers.

Supplementary Materials

The following are available online at https://www.mdpi.com/article/10.3390/genes12091305/s1, Figure S1: KM plot showing the differences in overall survival between patients in low- and high-GLNMR signature group in (A) CESC, (B) ESCA, (C) GBM, (D) KIRP, (E) LUAD, (F) THYM, and (G) UCEC. (All p > 0.05). Figure S2: Scatter plot showing relationships between glutamine metabolism (GLNM) regulator expression and PD-L1 expression in CESC, CHOL, HNSC, READ, SKCM, STAD, TGCT, THYM, and UCS. (All p > 0.05)

Author Contributions

Conceptualization, R.G., W.W., K.D., J.Z.; methodology, J.Z., K.D., W.L.; software, J.M., L.L., M.D.; validation, J.Z., K.D., S.L.; formal analysis, J.Z., K.D.; data curation, R.G., W.W.; writing—original draft preparation, J.Z., K.D., S.L.; writing—review and editing, J.M., L.L., M.D.; visualization, K.D., W.L. All authors have read and agreed to the published version of the manuscript.

Funding

This research received no external funding.

Institutional Review Board Statement

Not applicable.

Informed Consent Statement

Not applicable.

Data Availability Statement

The datasets analyzed during the current study are available in The Cancer Genome Atlas (https://portal.gdc.cancer.gov/) and GTEx expression dataset (V7.0).

Conflicts of Interest

No conflict of interest relevant to this article were reported.

References

  1. Hanahan, D.; Weinberg, R.A. Hallmarks of cancer: The next generation. Cell 2011, 144, 646–674. [Google Scholar] [CrossRef] [PubMed] [Green Version]
  2. Franco, Y.E.M.; Alves, M.J.; Uno, M.; Moretti, I.F.; Trombetta-Lima, M.; de Siqueira Santos, S.; Dos Santos, A.F.; Arini, G.S.; Baptista, M.S.; Lerario, A.M.; et al. Glutaminolysis dynamics during astrocytoma progression correlates with tumor aggressiveness. Cancer Metab. 2021, 9, 18. [Google Scholar] [CrossRef]
  3. Bott, A.; Peng, I.-C.; Fan, Y.; Faubert, B.; Zhao, L.; Li, J.; Neidler, S.; Sun, Y.; Jaber, N.; Krokowski, D.; et al. Oncogenic Myc Induces Expression of Glutamine Synthetase through Promoter Demethylation. Cell Metab. 2015, 22, 1068–1077. [Google Scholar] [CrossRef] [PubMed] [Green Version]
  4. Still, E.R.; Yuneva, M. Hopefully devoted to Q: Targeting glutamine addiction in cancer. Br. J. Cancer 2017, 116, 1375–1381. [Google Scholar] [CrossRef] [PubMed]
  5. Altman, B.J.; Stine, Z.E.; Dang, C.V. From Krebs to clinic: Glutamine metabolism to cancer therapy. Nat. Rev. Cancer 2016, 16, 619–634. [Google Scholar] [CrossRef]
  6. Xia, L.; Oyang, L.; Lin, J.; Tan, S.; Han, Y.; Wu, N.; Yi, P.; Tang, L.; Pan, Q.; Rao, S.; et al. The cancer metabolic reprogramming and immune response. Mol. Cancer 2021, 20, 28. [Google Scholar] [CrossRef] [PubMed]
  7. DeBerardinis, R.J.; Sayed, N.; Ditsworth, D.; Thompson, C.B. Brick by brick: Metabolism and tumor cell growth. Curr. Opin. Genet. Dev. 2008, 18, 54–61. [Google Scholar] [CrossRef] [Green Version]
  8. Bhutia, Y.D.; Babu, E.; Ramachandran, S.; Ganapathy, V. Amino Acid transporters in cancer and their relevance to “glutamine addiction”: Novel targets for the design of a new class of anticancer drugs. Cancer Res. 2015, 75, 1782–1788. [Google Scholar] [CrossRef] [Green Version]
  9. Yanagida, O.; Kanai, Y.; Chairoungdua, A.; Kim, D.K.; Segawa, H.; Nii, T.; Cha, S.H.; Matsuo, H.; Fukushima, J.-I.; Fukasawa, Y.; et al. Human L-type amino acid transporter 1 (LAT1): Characterization of function and expression in tumor cell lines. Biochim. Biophys. Acta (BBA) Biomembr. 2001, 1514, 291–302. [Google Scholar] [CrossRef] [Green Version]
  10. Timmerman, L.A.; Holton, T.; Yuneva, M.; Louie, R.J.; Padró, M.; Daemen, A.; Hu, M.; Chan, D.A.; Ethier, S.P.; van’t Veer, L.J.; et al. Glutamine sensitivity analysis identifies the xCT antiporter as a common triple-negative breast tumor therapeutic target. Cancer Cell 2013, 24, 450–465. [Google Scholar] [CrossRef] [Green Version]
  11. Lv, H.; Zhen, C.; Liu, J.; Yang, P.; Hu, L.; Shang, P. Unraveling the Potential Role of Glutathione in Multiple Forms of Cell Death in Cancer Therapy. Oxidative Med. Cell. Longev. 2019, 2019, 3150145. [Google Scholar] [CrossRef] [PubMed] [Green Version]
  12. Wang, Z.; Ding, Y.; Wang, X.; Lu, S.; Wang, C.; He, C.; Wang, L.; Piao, M.; Chi, G.; Luo, Y.; et al. Pseudolaric acid B triggers ferroptosis in glioma cells via activation of Nox4 and inhibition of xCT. Cancer Lett. 2018, 428, 21–33. [Google Scholar] [CrossRef] [PubMed]
  13. Katt, W.; Lukey, M.; Cerione, R. A tale of two glutaminases: Homologous enzymes with distinct roles in tumorigenesis. Future Med. Chem. 2017, 9, 223–243. [Google Scholar] [CrossRef] [PubMed] [Green Version]
  14. Ramirez-Peña, E.; Arnold, J.; Shivakumar, V.; Joseph, R.; Vijay, G.V.; den Hollander, P.; Bhangre, N.; Allegakoen, P.; Prasad, R.; Conley, Z.; et al. The Epithelial to Mesenchymal Transition Promotes Glutamine Independence by Suppressing GLS2 Expression. Cancers 2019, 11, 1610. [Google Scholar] [CrossRef] [Green Version]
  15. Huang, Y.; Dai, Z.; Barbacioru, C.; Sadée, W. Cystine-glutamate transporter SLC7A11 in cancer chemosensitivity and chemoresistance. Cancer Res. 2005, 65, 7446–7454. [Google Scholar] [CrossRef] [Green Version]
  16. Lo, M.; Ling, V.; Wang, Y.; Gout, P.W. The xc-cystine/glutamate antiporter: A mediator of pancreatic cancer growth with a role in drug resistance. Br. J. Cancer 2008, 99, 464–472. [Google Scholar] [CrossRef] [Green Version]
  17. Drayton, R.M.; Dudziec, E.; Peter, S.; Bertz, S.; Hartmann, A.; Bryant, H.E.; Catto, J.W. Reduced expression of miRNA-27a modulates cisplatin resistance in bladder cancer by targeting the cystine/glutamate exchanger SLC7A11. Clin. Cancer Res. 2014, 20, 1990–2000. [Google Scholar] [CrossRef] [Green Version]
  18. Liu, C.-J.; Hu, F.-F.; Xia, M.-X.; Han, L.; Zhang, Q.; Guo, A.-Y. GSCALite: A web server for gene set cancer analysis. Bioinformatics 2018, 34, 3771–3772. [Google Scholar] [CrossRef]
  19. Mermel, C.H.; Schumacher, S.E.; Hill, B.; Meyerson, M.L.; Beroukhim, R.; Getz, G. GISTIC2.0 facilitates sensitive and confident localization of the targets of focal somatic copy-number alteration in human cancers. Genome Biol. 2011, 12, R41. [Google Scholar] [CrossRef] [PubMed] [Green Version]
  20. Tang, Z.; Li, C.; Kang, B.; Gao, G.; Li, C.; Zhang, Z. GEPIA: A web server for cancer and normal gene expression profiling and interactive analyses. Nucleic Acids Res. 2017, 45, W98–W102. [Google Scholar] [CrossRef] [Green Version]
  21. Andersen, P.K.; Gill, R.D. Cox’s Regression Model for Counting Processes: A Large Sample Study. Ann. Stat. 1982, 10, 1100–1120. [Google Scholar] [CrossRef]
  22. Harrington, D.P.; Fleming, T.R. A class of rank test procedures for censored survival data. Biometrika 1982, 69, 553–566. [Google Scholar] [CrossRef]
  23. Aran, D.; Hu, Z.; Butte, A.J. xCell: Digitally portraying the tissue cellular heterogeneity landscape. Genome Biol. 2017, 18, 220. [Google Scholar] [CrossRef] [Green Version]
  24. Miao, Y.R.; Zhang, Q.; Lei, Q.; Luo, M.; Xie, G.Y.; Wang, H.; Guo, A.Y. ImmuCellAI: A Unique Method for Comprehensive T-Cell Subsets Abundance Prediction and its Application in Cancer Immunotherapy. Adv. Sci. 2020, 7, 1902880. [Google Scholar] [CrossRef] [Green Version]
  25. Akbani, R.; Ng, P.K.S.; Werner, H.M.J.; Shahmoradgoli, M.; Zhang, F.; Ju, Z.; Liu, W.; Yang, J.-Y.; Yoshihara, K.; Li, J.; et al. A pan-cancer proteomic perspective on The Cancer Genome Atlas. Nat. Commun. 2014, 5, 3887. [Google Scholar] [CrossRef]
  26. Ye, Y.; Xiang, Y.; Ozguc, F.M.; Kim, Y.; Liu, C.-J.; Park, P.K.; Hu, Q.; Diao, L.; Lou, Y.; Lin, C.; et al. The Genomic Landscape and Pharmacogenomic Interactions of Clock Genes in Cancer Chronotherapy. Cell Syst. 2018, 6, 314–328.e312. [Google Scholar] [CrossRef] [PubMed] [Green Version]
  27. Kaira, K.; Oriuchi, N.; Imai, H.; Shimizu, K.; Yanagitani, N.; Sunaga, N.; Hisada, T.; Tanaka, S.; Ishizuka, T.; Kanai, Y.; et al. l-type amino acid transporter 1 and CD98 expression in primary and metastatic sites of human neoplasms. Cancer Sci. 2008, 99, 2380–2386. [Google Scholar] [CrossRef]
  28. Reynolds, M.R.; Lane, A.N.; Robertson, B.; Kemp, S.R.M.; Liu, Y.; Hill, B.; Dean, D.C.; Clem, B.F. Control of glutamine metabolism by the tumor suppressor Rb. Oncogene 2014, 33, 556–566. [Google Scholar] [CrossRef] [PubMed] [Green Version]
  29. Lewerenz, J.; Hewett, S.J.; Huang, Y.; Lambros, M.; Gout, P.W.; Kalivas, P.W.; Massie, A.; Smolders, I.; Methner, A.; Pergande, M. The cystine/glutamate antiporter system x(c)(-) in health and disease: From molecular mechanisms to novel therapeutic opportunities. Antioxid. Redox Signal. 2013, 18, 522–555. [Google Scholar] [CrossRef] [Green Version]
  30. Deuschle, F.-C.; Morath, V.; Schiefner, A.; Brandt, C.; Ballke, S.; Reder, S.; Steiger, K.; Schwaiger, M.; Weber, W.; Skerra, A. Development of a high affinity Anticalin® directed against human CD98hc for theranostic applications. Theranostics 2020, 10, 2172–2187. [Google Scholar] [CrossRef]
  31. Matés, J.M.; Campos-Sandoval, J.A.; Márquez, J. Glutaminase isoenzymes in the metabolic therapy of cancer. Biochim. Biophys. Acta Rev. Cancer 2018, 1870, 158–164. [Google Scholar] [CrossRef]
  32. Hensley, C.T.; Wasti, A.T.; DeBerardinis, R.J. Glutamine and cancer: Cell biology, physiology, and clinical opportunities. J. Clin. Investig. 2013, 123, 3678–3684. [Google Scholar] [CrossRef] [PubMed] [Green Version]
  33. Zhang, J.; Wang, C.; Chen, M.; Cao, J.; Zhong, Y.; Chen, L.; Shen, H.-M.; Xia, D. Epigenetic silencing of glutaminase 2 in human liver and colon cancers. BMC Cancer 2013, 13, 601. [Google Scholar] [CrossRef] [PubMed] [Green Version]
  34. Sengupta, D.; Cassel, T.; Teng, K.-Y.; Aljuhani, M.; Chowdhary, V.K.; Hu, P.; Zhang, X.; Fan, T.W.-M.; Ghoshal, K. Regulation of hepatic glutamine metabolism by miR-122. Mol. Metab. 2020, 34, 174–186. [Google Scholar] [CrossRef] [PubMed]
  35. Suzuki, S.; Tanaka, T.; Poyurovsky, M.V.; Nagano, H.; Mayama, T.; Ohkubo, S.; Lokshin, M.; Hosokawa, H.; Nakayama, T.; Suzuki, Y.; et al. Phosphate-activated glutaminase (GLS2), a p53-inducible regulator of glutamine metabolism and reactive oxygen species. Proc. Natl. Acad. Sci. USA 2010, 107, 7461–7466. [Google Scholar] [CrossRef] [PubMed] [Green Version]
  36. Kuo, T.-C.; Chen, C.-K.; Hua, K.-T.; Yu, P.; Lee, W.-J.; Chen, M.-W.; Jeng, Y.-M.; Chien, M.-H.; Kuo, K.-T.; Hsiao, M.; et al. Glutaminase 2 stabilizes Dicer to repress Snail and metastasis in hepatocellular carcinoma cells. Cancer Lett. 2016, 383, 282–294. [Google Scholar] [CrossRef]
  37. Zhang, C.; Liu, J.; Zhao, Y.; Yue, X.; Zhu, Y.; Wang, X.; Wu, H.; Blanco, F.; Li, S.; Bhanot, G.; et al. Author response: Glutaminase 2 is a novel negative regulator of small GTPase Rac1 and mediates p53 function in suppressing metastasis. eLife 2015, 5, e10727. [Google Scholar] [CrossRef] [PubMed]
  38. Lukey, M.; Cluntun, A.; Katt, W.P.; Lin, M.-C.J.; Druso, J.E.; Ramachandran, S.; Erickson, J.W.; Le, H.; Wang, Z.-E.; Blank, B.; et al. Liver-Type Glutaminase GLS2 Is a Druggable Metabolic Node in Luminal-Subtype Breast Cancer. Cell Rep. 2019, 29, 76–88.e77. [Google Scholar] [CrossRef] [Green Version]
  39. Sun, H.-W.; Wu, W.-C.; Chen, H.-T.; Xu, Y.-T.; Yang, Y.-Y.; Chen, J.; Yu, X.-J.; Wang, Z.; Shuang, Z.-Y.; Zheng, L. Glutamine Deprivation Promotes the Generation and Mobilization of MDSCs by Enhancing Expression of G-CSF and GM-CSF. Front. Immunol. 2021, 11, 616367. [Google Scholar] [CrossRef] [PubMed]
  40. El Ansari, R.; Craze, M.L.; Althobiti, M.; Alfarsi, L.; Ellis, I.O.; Rakha, E.A.; Green, A.R. Enhanced glutamine uptake influences composition of immune cell infiltrates in breast cancer. Br. J. Cancer 2020, 122, 94–101. [Google Scholar] [CrossRef] [PubMed]
  41. Ma, G.; Li, C.; Zhang, Z.; Liang, Y.; Liang, Z.; Chen, Y.; Wang, L.; Li, D.; Zeng, M.; Shan, W.; et al. Targeted Glucose or Glutamine Metabolic Therapy Combined With PD-1/PD-L1 Checkpoint Blockade Immunotherapy for the Treatment of Tumors—Mechanisms and Strategies. Front. Oncol. 2021, 11, 697894. [Google Scholar] [CrossRef] [PubMed]
  42. Byun, J.-K.; Park, M.; Lee, S.; Yun, J.W.; Lee, J.; Kim, J.S.; Cho, S.J.; Jeon, H.-J.; Lee, I.-K.; Choi, Y.-K.; et al. Inhibition of Glutamine Utilization Synergizes with Immune Checkpoint Inhibitor to Promote Antitumor Immunity. Mol. Cell 2020, 80, 592–606.e598. [Google Scholar] [CrossRef] [PubMed]
  43. He, Q.; Liu, M.; Huang, W.; Chen, X.; Zhang, B.; Zhang, T.; Wang, Y.; Liu, D.; Xie, M.; Ji, X.; et al. IL-1β-induced Elevation of SLC7A11 Promotes Hepatocellular Carcinoma Metastasis through Upregulating PD-L1 and CSF1. Hepatology 2021. epub ahead of print. [Google Scholar] [CrossRef]
  44. Pham, A.N.; Blower, P.E.; Alvarado, O.; Ravula, R.; Gout, P.W.; Huang, Y. Pharmacogenomic approach reveals a role for the x(c)-cystine/glutamate antiporter in growth and celastrol resistance of glioma cell lines. J. Pharmacol. Exp. Ther. 2010, 332, 949–958. [Google Scholar] [CrossRef] [Green Version]
  45. Miyamoto, K.; Watanabe, M.; Boku, S.; Sukeno, M.; Morita, M.; Kondo, H.; Sakaguchi, K.; Taguchi, T.; Sakai, A.T. xCT Inhibition Increases Sensitivity to Vorinostat in a ROS-Dependent Manner. Cancers 2020, 12, 827. [Google Scholar] [CrossRef] [Green Version]
  46. Tanaka, K.; Sasayama, T.; Irino, Y.; Takata, K.; Nagashima, H.; Satoh, N.; Kyotani, K.; Mizowaki, T.; Imahori, T.; Ejima, Y.; et al. Compensatory glutamine metabolism promotes glioblastoma resistance to mTOR inhibitor treatment. J. Clin. Investig. 2015, 125, 1591–1602. [Google Scholar] [CrossRef]
  47. Momcilovic, M.; Bailey, S.T.; Lee, J.T.; Fishbein, M.C.; Braas, D.; Go, J.; Graeber, T.G.; Parlati, F.; Demo, S.; Li, R.; et al. The GSK3 Signaling Axis Regulates Adaptive Glutamine Metabolism in Lung Squamous Cell Carcinoma. Cancer Cell 2018, 33, 905–921.e905. [Google Scholar] [CrossRef] [Green Version]
  48. Boku, S.; Watanabe, M.; Sukeno, M.; Yaoi, T.; Hirota, K.; Iizuka-Ohashi, M.; Itoh, K.; Sakai, T. Deactivation of Glutaminolysis Sensitizes PIK3CA-Mutated Colorectal Cancer Cells to Aspirin-Induced Growth Inhibition. Cancers 2020, 12, 1097. [Google Scholar] [CrossRef]
  49. Li, Y.; Umbach, D.M.; Krahn, J.M.; Shats, I.; Li, X.; Li, L. Predicting tumor response to drugs based on gene-expression biomarkers of sensitivity learned from cancer cell lines. BMC Genom. 2021, 22, 272. [Google Scholar] [CrossRef] [PubMed]
Figure 1. The main pathways of glutamine uptake and catabolism.
Genes 12 01305 g001
Figure 2. An mRNA expression comparison of glutamine metabolism (GLNM) regulators: (A) expression profiles of six GLNM regulators in 30 normal tissues; (B) differential expression levels of GLNM regulators between 14 paired normal and tumor tissues. The colors from purple to red represent the fold changes between tumor and normal tissues. Red dots represent higher expression levels of genes in tumor tissues than in normal tissues, while blue dots indicate the opposite expression pattern. The size of a dot indicates the FDR significance, while the value of each dot size is presented on the right side; (C) Gene Set Variation Analysis (GSVA) score based on GLNM regulators between 14 paired normal and tumor tissues. * p < 0.05 and ** p < 0.01.
Genes 12 01305 g002
Figure 3. Associations between glutamine metabolism (GLNM) regulators, genomic features, and expression: (A) heatmap showing the single-nucleotide variation (SNV) frequencies of six GLNM regulators across different cancer types; (B) waterfall plot showing the mutation distribution and classification of SNV types; (C) copy number variation (CNV) pie plot showing the proportions of different types of CNVs in each gene across different cancer types; (D) correlation between CNV and mRNA expression. Blue dots represent negative correlations and red dots represent positive correlations. The sizes of dots represent significance. Hete Amp: heterozygous amplification; Hete Del: heterozygous deletion; Homo Amp: homozygous amplification; Homo Del: homozygous deletion; None: no CNV.
Genes 12 01305 g003
Figure 4. Alterations of glutamine metabolism (GLNM) regulators in terms of methylation in relation to gene expression and overall survival (OS): (A) Differential methylation of GLNM regulators between 14 paired normal and tumor tissues; (B) Correlation between mRNA expression and methylation. (C) Effects of hypermethylation of GLNM regulators on survival risk. Blue dots represent low risk and red dots represent high risk. The sizes of the dots represent significance. (D,E) KM plots showing the differences in overall survival between patients in low and high hypermethylation groups for SLC1A5 in LGG (D) and GLS in KIRC (E).
Genes 12 01305 g004
Figure 5. Glutamine metabolism (GLNM) regulator expression associated with prognosis in pan-cancer: (A) Heatmap displaying the −log10(p-value) of univariate Cox proportional hazards regression between GLNM regulator expression and overall survival (OS). Blue dots represent low-risk genes and red dots represent high-risk genes. The sizes of the dots represent significance. (BI) KM plot showing the differences in overall survival between patients in low- and high-GLNMR signature group for (B) ACC, (C) HNSC, (D) KICH, (E) KIRC, (F) LGG, (G) LIHC, (H) MESO and (I) SARC (all p < 0.05). Significance indicated by log-rank tests.
Genes 12 01305 g005
Figure 6. Associations between glutamine metabolism (GLNM) regulator expression and the tumor microenvironment: (A) heatmap displaying the correlations between GLNM regulator expression and immune scores, stroma scores, and microenvironment scores; (B) the relationship between GLNM regulators expression and immune cell infiltration. Blue represents negative correlations and red represents positive correlations. Note: * p < 0.05, ** p < 0.01, *** p < 0.001, # FDR < 0.05.
Genes 12 01305 g006
Figure 7. Glutamine metabolism (GLNM) regulator expression is significantly positive correlated with PD-L1 expression in ACC, BLCA, BRCA, COAD, DLBC, ESCA, GBM, KICH, KIRC, KIRP, LAML, LGG, LIHC, LUSC, MESO, OV, PAAD, PCPG, PRAD, SARC, THCA, UCEC, and UVM (all p < 0.05).
Genes 12 01305 g007
Figure 8. Effects of glutamine metabolism (GLNM) regulator expression on drug sensitivity based on the GDSC database. The horizontal axis represents different drugs, with the paired drug targets displayed above. Blue represents negative correlations and red represents positive correlations. Black circles indicate FDR < 0.05 and gray circles indicate FDR > 0.05.
Genes 12 01305 g008
Figure 9. Underlying molecular mechanism of glutamine metabolism (GLNM) regulator expression alterations: (A) The miRNA regulation network. Nodes represents miRNAs or target genes, edges represent regulation of miRNA-to-gene transition, and edge widths represent absolute correlation coefficient values. (B) A network displaying the relationship between genes and pathways via line connections. Solid lines indicate activation, dashed lines indicate inhibition. Line colors represent different cancer types. (C) Pie plots showing the global percentages of cancers in which a gene has an effect on the pathways among 32 cancers types.
Genes 12 01305 g009
Publisher’s Note: MDPI stays neutral with regard to jurisdictional claims in published maps and institutional affiliations.

