
Validation and Selection of New Reference Genes for RT-qPCR Analysis in Pediatric Glioma of Different Grades

 , ,
, ,  , , , , ,
Abstract
:1. Introduction
2. Materials and Methods
2.1. Reference Gene Selection
2.2. Primer Design
2.3. Cell Culture
2.4. Tumor Samples
2.5. Extraction of Total RNA and cDNA Synthesis
2.6. Quantitative RT-qPCR Analysis
2.7. Analysis of Gene Expression Stability
2.8. Analysis of Relative Gene Expression in Human Glioma Samples
3. Results
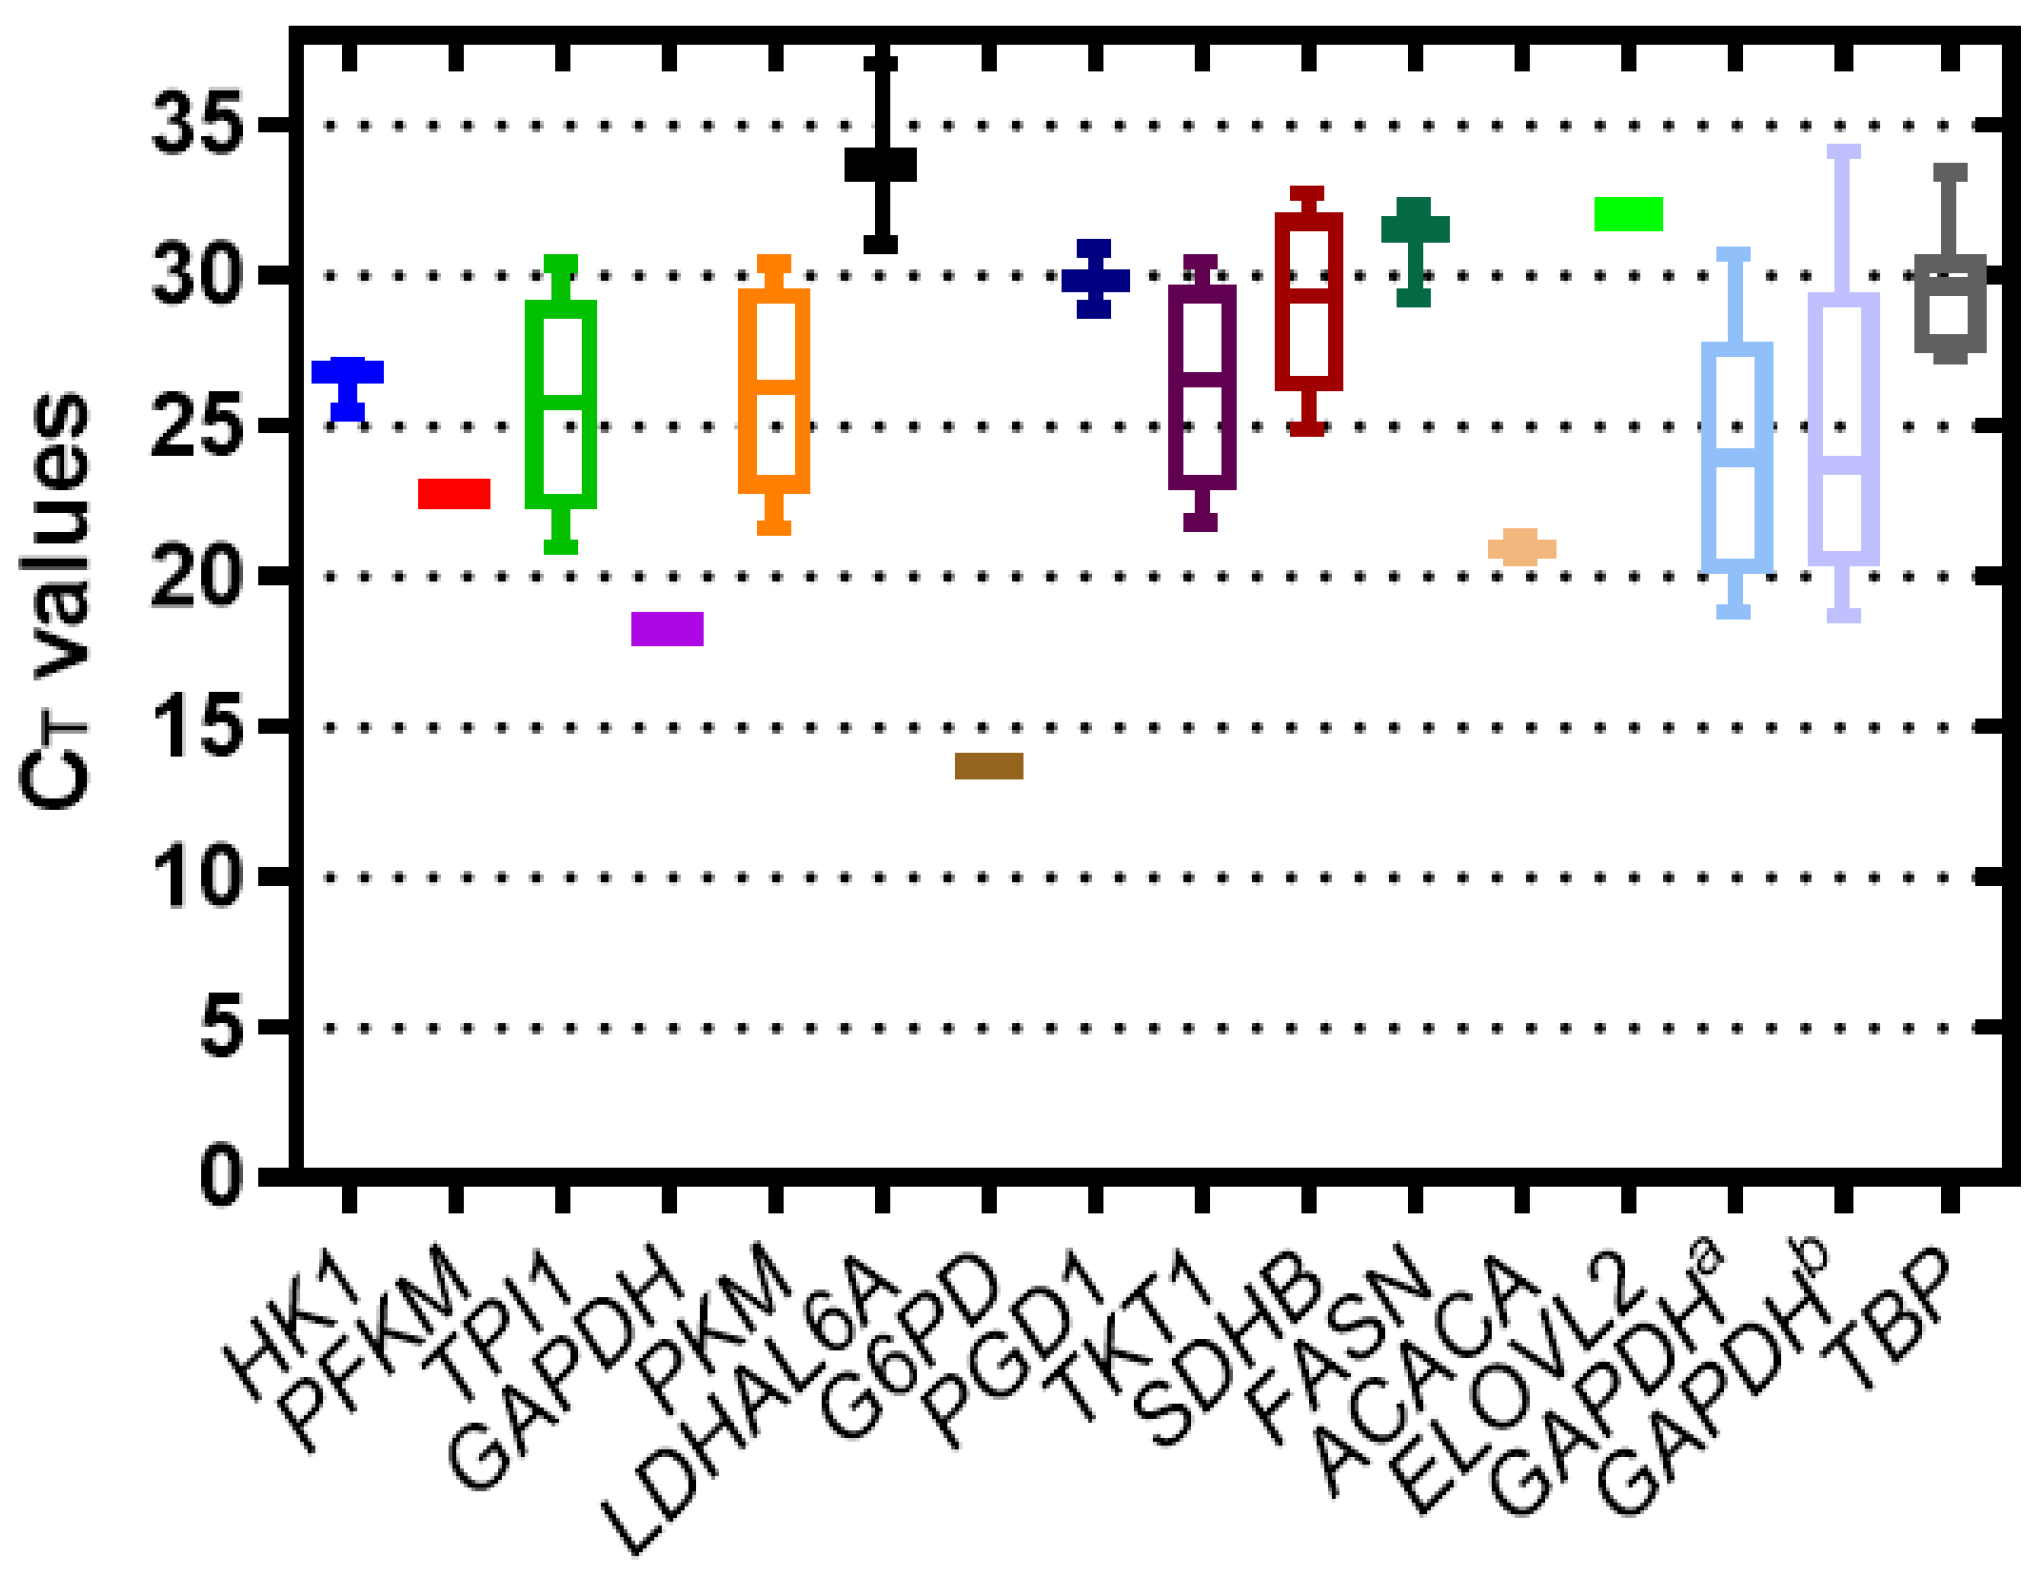
3.1. Determination of the Specificity and Efficiency of Primer Pairs
3.2. Stability of Candidate Reference Genes
3.3. Evaluation of Gene Expression Levels in Brain Glioma Biopsies
4. Discussion
5. Conclusions
Supplementary Materials
Author Contributions
Funding
Institutional Review Board Statement
Informed Consent Statement
Data Availability Statement
Acknowledgments
Conflicts of Interest
References
- Ostrom, Q.T.; Cioffi, G.; Gittleman, H.; Patil, N.; Waite, K.; Kruchko, C.; Barnholtz-Sloan, J.S. CBTRUS Statistical Report: Primary Brain and Other Central Nervous System Tumors Diagnosed in the United States in 2012–2016. Neuro Oncol. 2019, 21 (Suppl. 5), v1–v100. [Google Scholar] [CrossRef] [PubMed]
- Louis, D.N.; Perry, A.; Wesseling, P.; Brat, D.J.; Cree, I.A.; Figarella-Branger, D.; Hawkins, C.; Ng, H.K.; Pfister, S.M.; Reifenberger, G.; et al. The 2021 WHO Classification of Tumors of the Central Nervous System: A summary. Neuro Oncol. 2021, 23, 1231–1251. [Google Scholar] [CrossRef]
- McNeill, K.A. Epidemiology of brain tumors. Neurol. Clin. 2016, 34, 981–998. [Google Scholar] [CrossRef]
- Wen, P.Y.; Reardon, D.A. Neuro-oncology in 2015: Progress in glioma diagnosis, classification and treatment. Nat. Rev. Neurol. 2016, 2, 69–70. [Google Scholar] [CrossRef]
- Lee, S.Y. Temozolomide resistance in glioblastoma multiforme. Genes Dis. 2016, 3, 198–210. [Google Scholar] [CrossRef] [PubMed] [Green Version]
- Qian, Z.; Liu, H.; Li, M.; Shi, J.; Li, N.; Zhang, Y.; Zhang, X.; Lv, J.; Xie, X.; Bai, Y.; et al. Potential diagnostic power of blood circular RNA expression in active pulmonary tuberculosis. EBioMedicine 2018, 27, 18–26. [Google Scholar] [CrossRef] [Green Version]
- Zhao, G.; Jiang, T.; Liu, Y.; Huai, G.; Lan, C.; Li, G.; Jia, G.; Wang, K.; Yang, M. Droplet digital PCR-based circulating microRNA detection serve as a promising diagnostic method for gastric cancer. BMC Cancer 2018, 18, 676. [Google Scholar] [CrossRef] [PubMed]
- Villegas-Ruiz, V.; Juarez-Mendez, S. Data mining for identification of molecular targets in ovarian cancer. Asian Pac. J. Cancer Prev. 2016, 17, 1691–1699. [Google Scholar] [CrossRef] [Green Version]
- Chen, L.; Lu, D.; Sun, K.; Xu, Y.; Hu, P.; Li, X.; Xu, F. Identification of biomarkers associated with diagnosis and prognosis of colorectal cancer patients based on integrated bioinformatics analysis. Gene 2019, 692, 119–125. [Google Scholar] [CrossRef]
- Guenin, S.; Mauriat, M.; Pelloux, J.; Van Wuytswinkel, O.; Bellini, C.; Gutierrez, L. Normalization of qRT-PCR data: The necessity of adopting a systematic, experimental conditions-specific, validation of references. J. Exp. Bot. 2009, 60, 487–493. [Google Scholar] [CrossRef] [Green Version]
- Dheda, K.; Huggett, J.F.; Bustin, S.A.; Johnson, M.A.; Rook, G.; Zumla, A. Validation of housekeeping genes for normalizing RNA expression in real-time PCR. Biotechniques 2004, 37, 112–114. [Google Scholar] [CrossRef] [Green Version]
- Hendriks-Balk, M.C.; Michel, M.C.; Alewijnse, A.E. Pitfalls in the normalization of real-time polymerase chain reaction data. Basic Res. Cardiol. 2007, 102, 195–197. [Google Scholar] [CrossRef] [Green Version]
- Nolan, T.; Hands, R.E.; Bustin, S.A. Quantification of mRNA using real-time RT-PCR. Nat. Protoc. 2006, 3, 1559–1582. [Google Scholar] [CrossRef] [PubMed]
- Bustin, S.A. Quantification of mRNA using real-time reverse transcription PCR (RT-PCR): Trends and problems. J. Mol. Endocrinol. 2002, 29, 23–39. [Google Scholar] [CrossRef] [PubMed]
- Barber, R.D.; Harmer, D.W.; Coleman, R.A.; Clark, B.J. GAPDH as a housekeeping gene: Analysis of GAPDH mRNA expression in a panel of 72 human tissues. Physiol. Genom. 2005, 21, 389–395. [Google Scholar] [CrossRef] [Green Version]
- Bas, A.; Forsberg, G.; Hammarstrom, S.; Hammarstrom, M.L. Utility of the housekeeping genes 18S rRNA, β-actin and glyceraldehyde-3-phosphate-dehydrogenase for normalization in real-time quantitative reverse transcriptase-polymerase chain reaction analysis of gene expression in human T lymphocytes. Scand. J. Immunol. 2004, 59, 566–573. [Google Scholar] [CrossRef]
- Valente, V.; Teixeira, S.A.; Neder, L.; Okamoto, O.K.; Oba-Shinjo, S.M.; Marie, S.K.; Scrideli, C.A.; Paçó-Larson, M.L.; Carlotti, C.G. Selection of suitable housekeeping genes for expression analysis in glioblastoma using quantitative RT-PCR. BMC Mol. Biol. 2009, 10, 17. [Google Scholar] [CrossRef]
- Kreth, S.; Heyn, J.; Grau, S.; Kretzschmar, H.A.; Egensperger, R.; Kreth, F.W. Identification of valid endogenous control genes for determining gene expression in human glioma. Neuro-Oncology 2010, 6, 570–579. [Google Scholar] [CrossRef]
- Aithal, M.G.; Rajeswari, N. Validation of housekeeping genes for gene expression analysis in glioblastoma using quantitative real-time polymerase chain reaction. Brain Tumor Res. Treat. 2015, 1, 24–29. [Google Scholar] [CrossRef] [Green Version]
- Gravendeel, L.A.; Kouwenhoven, M.C.; Gevaert, O.; de Rooi, J.J.; Stubbs, A.P.; Duijm, J.E.; Daemen, A.; Bleeker, F.E.; Bralten, L.B.; Kloosterhof, N.K.; et al. Intrinsic gene expression profiles of gliomas are a better predictor of survival than histology. Cancer Res. 2009, 23, 9065–9072. [Google Scholar] [CrossRef] [Green Version]
- Barrett, T.; Wilhite, S.E.; Ledoux, P.; Evangelista, C.; Kim, I.F.; Tomashevsky, M.; Marshall, K.A.; Phillippy, K.H.; Sherman, P.M.; Holko, M.; et al. NCBI GEO: Archive for functional genomics data sets—Update. Nucleic Acids Res. 2013, D991–D995. [Google Scholar] [CrossRef] [Green Version]
- Benjamini, Y.; Drai, D.; Elmer, G.; Kafkafi, N.; Golani, I. Controlling the false discovery rate in behavior genetics research. Behav. Brain Res. 2001, 125, 279–284. [Google Scholar] [CrossRef] [Green Version]
- Pfaffl, M.W.; Tichopad, A.; Prgomet, C.; Neuvians, T.P. Determination of stable housekeeping genes, differentially regulated target genes and sample integrity: BestKeeper–Excel-based tool using pair-wise correlations. Biotech. Lett. 2004, 26, 509–515. [Google Scholar] [CrossRef]
- Silver, N.; Best, S.; Jiang, J.; Thein, S.L. Selection of housekeeping genes for gene expression studies in human reticulocytes using real-time PCR. BMC Mol. Biol. 2009, 7, 33. [Google Scholar]
- Vandesompele, J.; De Preter, K.; Pattyn, F.; Poppe, B.; Van Roy, N.; De Paepe, A.; Speleman, F. Accurate normalization of real-time quantitative RT-PCR data by geometric averaging of multiple internal control genes. Genome Biol. 2002, 3, RESEARCH0034. [Google Scholar]
- Andersen, C.L.; Jensen, J.L.; Orntoft, T.F. Normalization of real-time quantitative reverse transcription-PCR data: A model-based variance estimation approach to identify genes suited for normalization, applied to bladder and colon cancer data sets. Cancer Res. 2004, 64, 5245–5250. [Google Scholar] [CrossRef] [Green Version]
- Xie, F.; Xiao, P.; Chen, D.; Xu, L.; Zhang, B. miRDeepFinder: A miRNA analysis tool for deep sequencing of plant small RNAs. Plant Mol. Biol. 2012, 80, 75–84. [Google Scholar] [CrossRef] [PubMed]
- Thellin, O.; Zorzi, W.; Lakaye, B.; De Borman, B.; Coumans, B.; Hennen, G.; Grisar, T.; Igout, A.; Heinen, E. Housekeeping genes as internal standards: Use and limits. J. Biotechnol. 1999, 75, 291–295. [Google Scholar] [CrossRef] [Green Version]
- Kozera, B.; Rapacz, M. Reference genes in real-time PCR. J. Appl. Genet. 2013, 54, 391–406. [Google Scholar] [CrossRef] [PubMed] [Green Version]
- Dang, W.; Zhang, X.; Ma, Q.; Chen, L.; Cao, M.; Miao, J.; Cui, Y.; Zhang, X. Selection of reference genes suitable for normalization of RT-qPCR data in glioma stem cells. Biotechniques 2020, 3, 130–137. [Google Scholar] [CrossRef] [PubMed]
- Derveaux, S.; Vandesompele, J.; Hellemans, J. How to do successful gene expression analysis using real-time PCR. Methods 2010, 50, 227–230. [Google Scholar] [CrossRef]
- Hanahan, D.; Weinberg, R.A. Hallmarks of cancer: The next generation. Cell 2011, 144, 646–674. [Google Scholar] [CrossRef] [Green Version]
- Khurshed, M.; Molenaar, R.J.; Lenting, K.; Leenders, W.P.; van Noorden, C.J.F. In silico gene expression analysis reveals glycolysis and acetate anaplerosis in IDH1 wild-type glioma and lactate and glutamate anaplerosis in IDH1-mutated glioma. Oncotarget 2017, 30, 49165–49177. [Google Scholar] [CrossRef] [Green Version]
- Oudard, S.; Arvelo, F.; Miccoli, L.; Apiou, F.; Dutrillaux, A.M.; Poisson, M.; Dutrillaux, B.; Poupon, M.F. High glycolysis in gliomas despite low hexokinase transcription and activity correlated to chromosome 10 loss. Br. J. Cancer 1996, 74, 839–845. [Google Scholar] [CrossRef] [Green Version]
- Fack, F.; Espedal, H.; Keunen, O.; Golebiewska, A.; Obad, N.; Harter, P.N.; Mittelbronn, M.; Bahr, O.; Weyerbrock, A.; Stuhr, L.; et al. Bevacizumab treatment induces metabolic adaptation toward anaerobic metabolism in glioblastomas. Acta Neuropathol. 2015, 129, 115–131. [Google Scholar] [CrossRef] [Green Version]
- Blacklow, S.C.; Raines, R.T.; Lim, W.A.; Zamore, P.D.; Knowles, J.R. Triosephosphate isomerase catalysis is diffusion controlled. Appendix: Analysis of triose phosphate equilibria in aqueous solution by 31P NMR. Biochemistry 1988, 27, 158–167. [Google Scholar] [CrossRef]
- Davis, M.E. Epidemiology and Overview of Gliomas. Semin. Oncol. Nurs. 2018, 34, 420–429. [Google Scholar] [CrossRef]
- Patra, K.C.; Hay, N. The pentose phosphate pathway and cancer. Trends. Biochem. Sci. 2014, 8, 347–354. [Google Scholar] [CrossRef] [Green Version]
- Riganti, C.; Gazzano, E.; Polimeni, M.; Aldieri, E.; Ghigo, D. The pentose phosphate pathway: An antioxidant defense and a crossroad in tumor cell fate. Free Radic. Biol. Med. 2012, 53, 421–436. [Google Scholar] [CrossRef]
- Zhang, C.; Zhang, Z.; Zhu, Y.; Qin, S. Glucose-6-phosphate dehydrogenase: A biomarker and potential therapeutic target for cancer. Anticancer Agents Med. Chem. 2014, 14, 280–289. [Google Scholar] [CrossRef]
- Lucarelli, G.; Galleggiante, V.; Rutigliano, M.; Sanguedolce, F.; Cagiano, S.; Bufo, P.; Lastilla, G.; Maiorano, E.; Ribatti, D.; Giglio, A.; et al. Metabolomic profile of glycolysis and the pentose phosphate pathway identifies the central role of glucose-6-phosphate dehydrogenase in clear cell-renal cell carcinoma. Oncotarget 2015, 30, 13371–13386. [Google Scholar] [CrossRef] [Green Version]
- Laurenti, G.; Tennant, D.A. Isocitrate dehydrogenase (IDH), succinate dehydrogenase (SDH), fumarate hydratase (FH): Three players for one phenotype in cancer? Biochem. Soc. Trans. 2016, 44, 1111–1116. [Google Scholar] [CrossRef]
- Pelicano, H.; Carney, D.; Huang, P. ROS stress in cancer cells and therapeutic implications. Drug Resist. Updates 2004, 7, 97–110. [Google Scholar] [CrossRef]
- Dalla, P.E.; Dando, I.; Pacchiana, R.; Liboi, E.; Scupoli, M.T.; Donadelli, M.; Palmieri, M. Regulation of succinate dehydrogenase and role of succinate in cancer. Semin. Cell Dev. Biol. 2020, 98, 4–14. [Google Scholar] [CrossRef]
- Pollard, P.J.; Brière, J.J.; Alam, N.A.; Barwell, J.; Barclay, E.; Wortham, N.C.; Hunt, T.; Mitchell, M.; Olpin, S.; Moat, S.J.; et al. Accumulation of Krebs cycle intermediates and over-expression of HIF1alpha in tumours which result from germline FH and SDH mutations. Hum. Mol. Genet. 2005, 14, 2231–2239. [Google Scholar] [CrossRef]
- Sulkowski, P.L.; Sundaram, R.K.; Oeck, S.; Corso, C.D.; Liu, Y.; Noorbakhsh, S.; Niger, M.; Boeke, M.; Ueno, D.; Kalathil, A.N.; et al. Krebs-cycle-deficient hereditary cancer syndromes are defined by defects in homologous-recombination DNA repair. Nat. Genet. 2018, 50, 1086–1092. [Google Scholar] [CrossRef]
- Lee, M.R.; Mantel, C.; Lee, S.A.; Moon, S.H.; Broxmeyer, H.E. MiR-31/SDHA Axis Regulates Reprogramming Efficiency through Mitochondrial Metabolism. Stem Cell Rep. 2016, 12, 1–10. [Google Scholar] [CrossRef] [Green Version]
- Tseng, P.L.; Wu, W.H.; Hu, T.H.; Chen, C.W.; Cheng, H.C.; Li, C.F.; Tsai, W.H.; Tsai, H.J.; Hsieh, M.C.; Chuang, J.H.; et al. Decreased succinate dehydrogenase B in human hepatocellular carcinoma accelerates tumor malignancy by inducing the Warburg effect. Sci. Rep. 2018, 8, 3081. [Google Scholar] [CrossRef]
- Tao, B.B.; He, H.; Shi, X.H.; Wang, C.L.; Li, W.Q.; Li, B.; Dong, Y.; Hu, G.H.; Hou, L.J.; Luo, C.; et al. Up-regulation of USP2a and FASN in gliomas correlates strongly with glioma grade. J. Clin. Neurosci. 2013, 20, 717–720. [Google Scholar] [CrossRef]
- Epstein, J.I.; Carmichael, M.; Partin, A.W. OA-519 (fatty acid synthase) as an independent predictor of pathologic state in adenocarcinoma of the prostate. Urology 1995, 45, 81–86. [Google Scholar] [CrossRef]
- Gansler, T.S.; Hardman, W.; Hunt, D.A. Increased expression of fatty acid synthase (OA-519) inovarian neoplasms predicts shorter survival. Hum. Pathol. 1997, 28, 686–692. [Google Scholar] [CrossRef]
- Vlad, L.D.; Axiotis, C.; Merino, M.J. Fatty acid synthase is highly expressed in aggressive thyroid tumors. Mod. Pathol. 1999, 12, 70A. [Google Scholar]
- Swinnen, J.V.; Roskams, T.; Joniau, S.; Van Poppel, H.; Oyen, R.; Baert, L.; Heyns, W.; Verhoeven, G. Overexpression of fatty acid synthase is an early and common event in the development of prostate cancer. Int. J. Cancer 2002, 98, 19–22. [Google Scholar] [CrossRef]
 HMC3,
HMC3,  CNS WHO 1 (T1),
  CNS WHO 1 (T12),
  CNS WHO 2 (T4),
  CNS WHO 2 (T18),
  CNS WHO 3 (T7),
  CNS WHO 3 (T10),
  CNS WHO 4 (T9).
HMC3, CNS WHO 1 (T1), CNS WHO 1 (T12), CNS WHO 2 (T4), CNS WHO 2 (T18), CNS WHO 3 (T7), CNS WHO 3 (T10), CNS WHO 4 (T9).
CNS WHO 4 (T9).
HMC3, CNS WHO 1 (T1), CNS WHO 1 (T12), CNS WHO 2 (T4), CNS WHO 2 (T18), CNS WHO 3 (T7), CNS WHO 3 (T10), CNS WHO 4 (T9).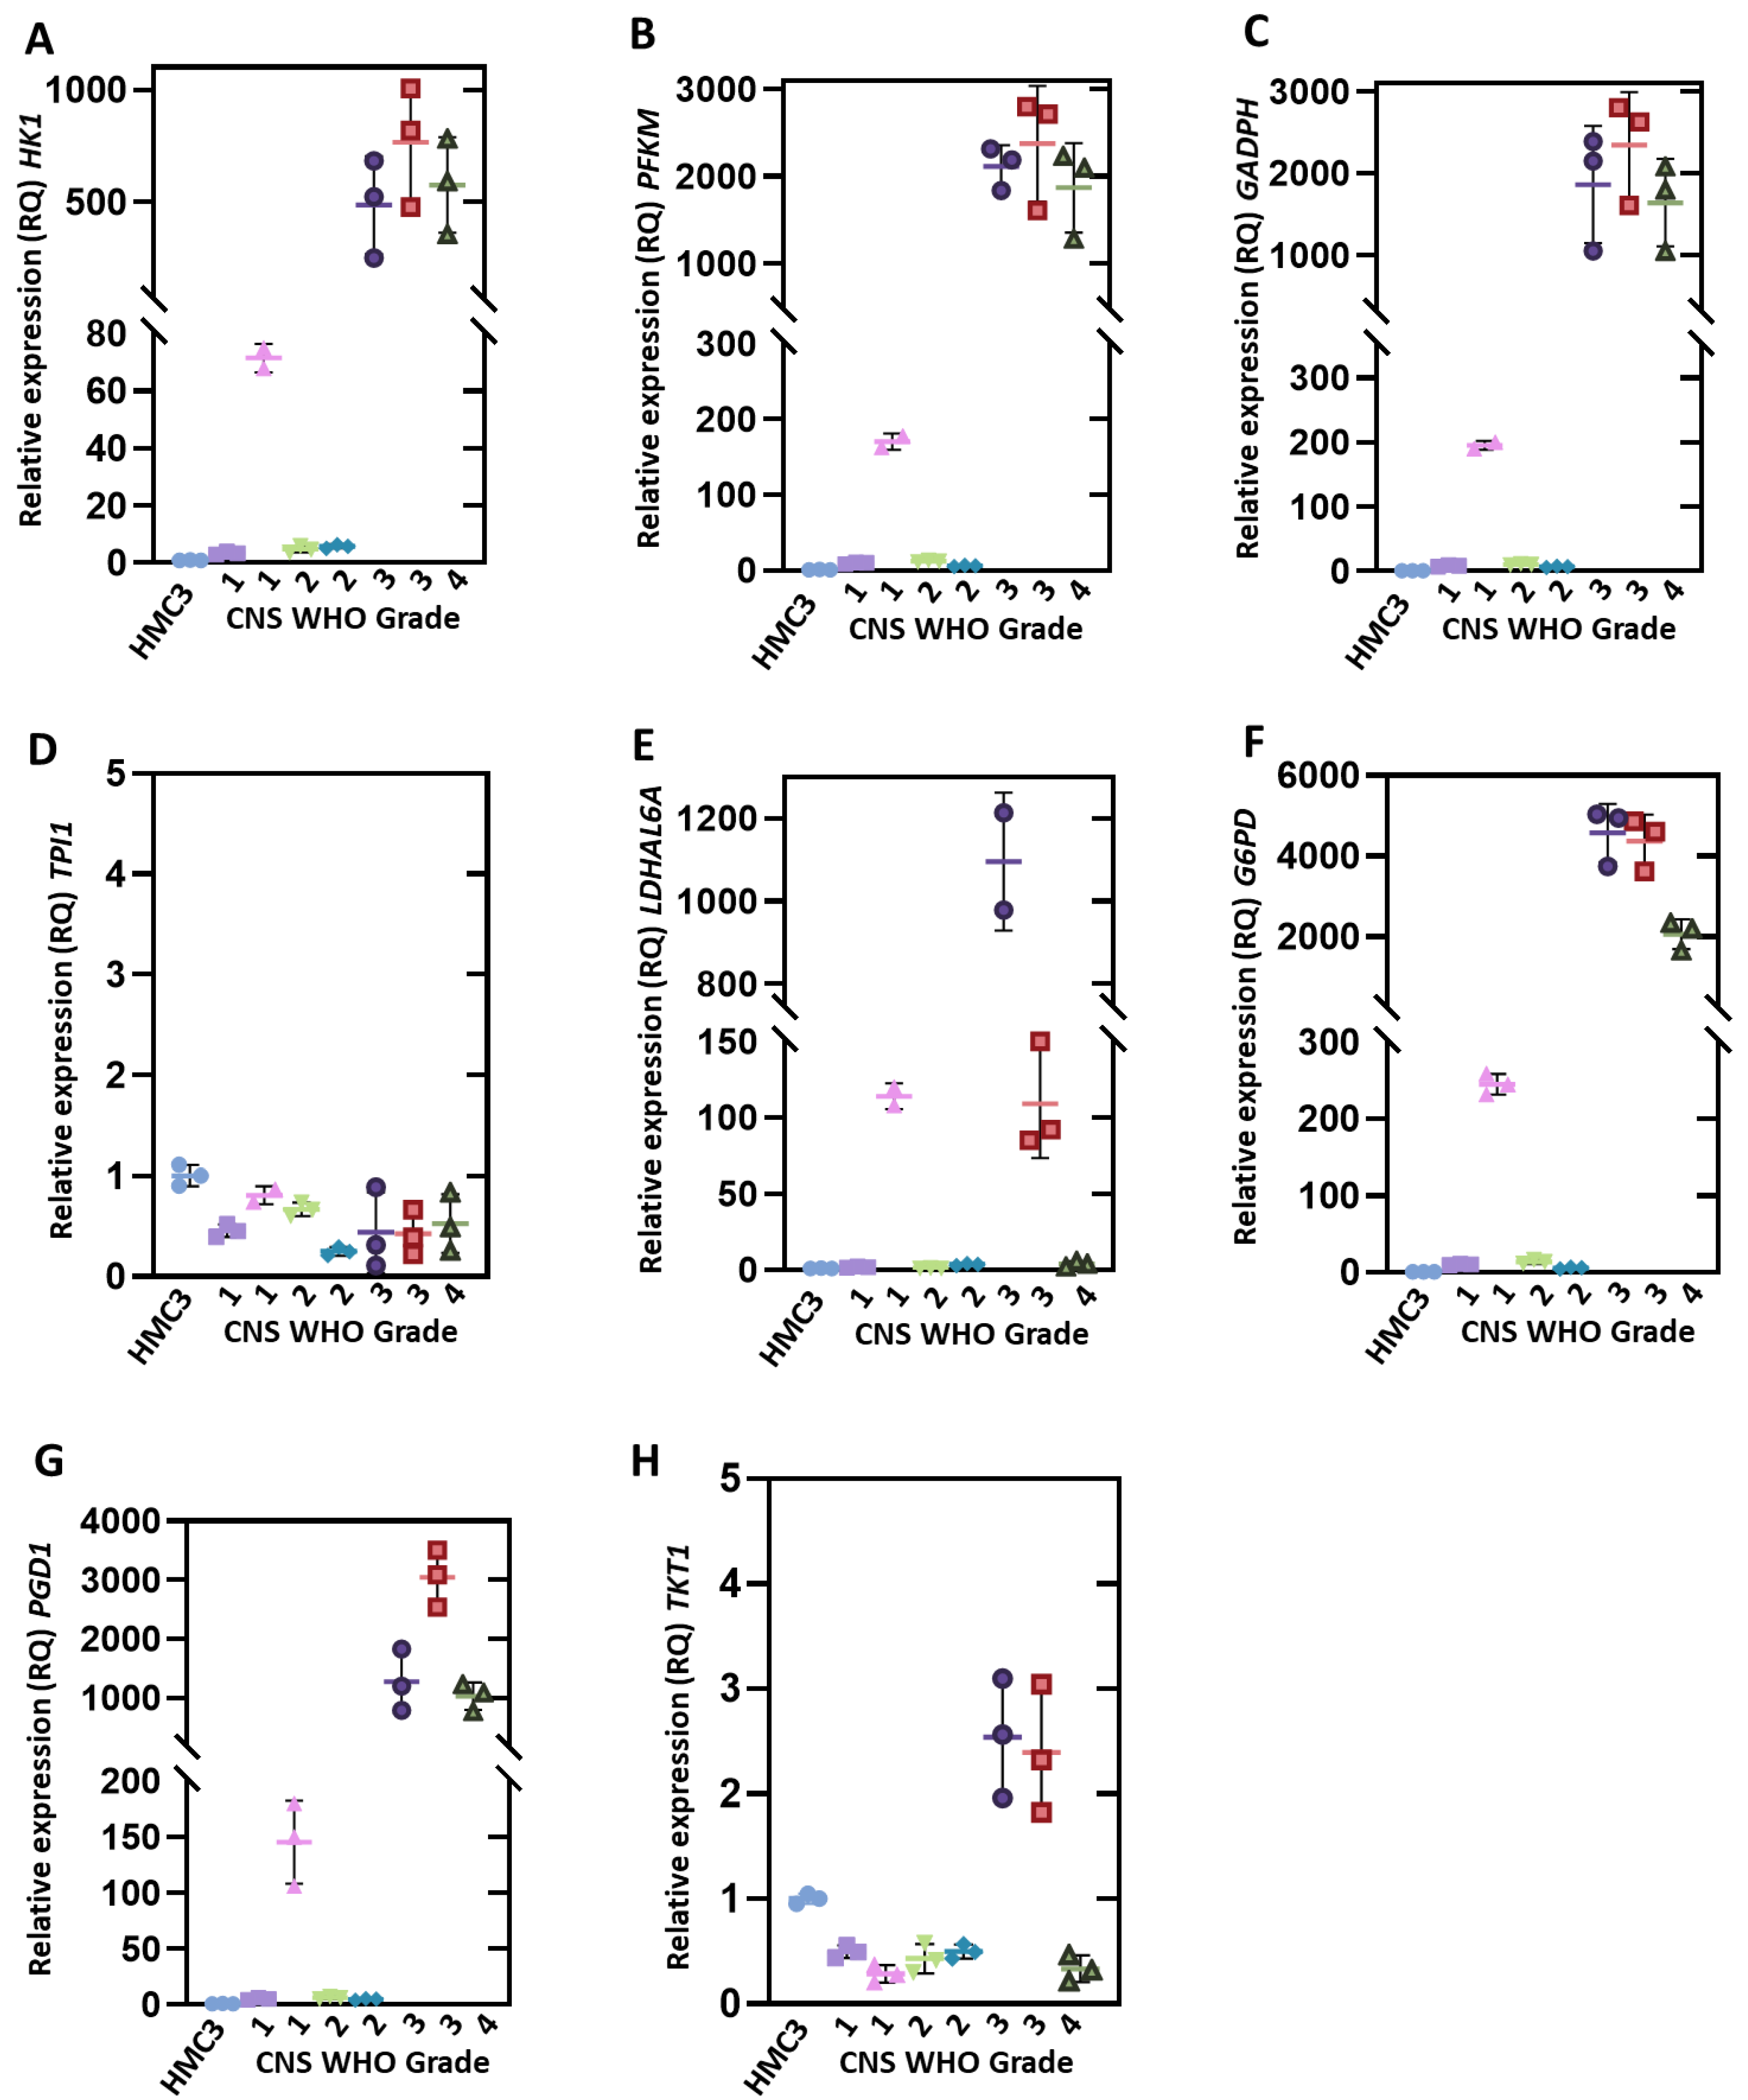


| Gen ID | GenBank | Gene Symbol | Gene Full Name | Function |
|---|---|---|---|---|
| 3098 | NM_000188.2 | HK1 | Hexokinase 1, variant 1 | Transferase in glycolysis |
| 5213 | NM_000289.6 | PFKM | Phosphofructokinase, muscle, variant 4 | Transferase in glycolysis |
| 7167 | NM_000365.5 | TPI1 | Triose phosphate isomerase 1, variant 1 | Isomerase in glycolysis |
| 2597 | NM_001256799.2 | GAPDH | Glyceraldehyde-3-phosphate dehydrogenase, variant 2 | Oxidoreductase in glycolysis |
| 5315 | NM_002654.6 | PKM | Pyruvate kinase M1/2, variant 1 | Transferase in glycolysis |
| 160287 | NM_001144071.1 | LDHAL6A | Lactate dehydrogenase A like 6A, transcript variant 2 | Oxidoreductase in glycolysis |
| 2539 | NM_001360016.2 | G6PD | Glucose-6-phosphate dehydrogenase, variant 1 | Oxidoreductase in pentose phosphate |
| 5226 | NM_002631.4 | PGD1 | phosphogluconate dehydrogenase, variant 1 | Oxidoreductase in pentose phosphate |
| 7086 | NM_001064.4 | TKT1 | Transketolase, variant 1 | Transferase in pentose phosphate |
| 6390 | NM_003000.2 | SDHB | Succinate dehydrogenase complex iron sulfur subunit B | Oxidoreductase in Krebs’s cycle |
| 2194 | NM_004104.5 | FASN | Fatty acid synthase | Transferase in fatty acid synthesis |
| 31 | NM_198834.3 | ACACA | Acetyl-CoA carboxylase α, variant 1 | Ligase in fatty acid synthesis |
| 54898 | NM_017770.4 | ELOVL2 | Fatty acid elongase 2 | Transferase in fatty acid synthesis |
| 6908 | NM_003194 | TBP | TATA-binding protein | General transcription factor |
| Gene | Sequence 5′ → 3′ | Amplicon Size (pb) | Tm (°C) |
|---|---|---|---|
| HK1 | Fw 5′-AAAGCGAGGGGACTATGA-3′ Rv 5′-ATCAATGTGCCTCAGTTCC-3′ | 157 | 60 |
| PFKM | Fw 5′-AGAATCTGGTGGTTAAGCG-3′ Rv 5′-GAGGCTCACTACACAGGCT-3′ | 176 | 60 |
| TPI1 | Fw 5′-CGCAGATAACGTGAAGGAC-3′ Rv 5′-CAGTCACAGAGCCTCCATAA-3′ | 190 | 60 |
| GAPDH | Fw 5′-CTCTGATTTGGTCGTATTGG-3′ Rv 5′-GATGACAAGCTTCCCGTT-3′ | 184 | 60 |
| PKM | Fw 5′-GGTTCGGAGGTTTGATGA-3′ Rv 5′-GGCTTCTTGATCATGCTCT-3′ | 186 | 60 |
| LDHAL6A | Fw 5′-GCGACTCAAGTGTTCCTGT-3′ Rv 5′-GCTAATGCCCCAAGAAGTAT-3′ | 179 | 60 |
| G6PD | Fw 5′-ATATTTATGGCAGCCGAGG-3′ Rv 5′-GTCAATGGTCCCGGTGT-3′ | 190 | 60 |
| PGD1 | Fw 5′-CATTCGGAAGGCACTCTAC-3′ Rv 5′-CTTGTCTTCAAGGCCCAA-3′ | 199 | 60 |
| TKT1 | Fw 5′-GATCACGGGGGTAGAAGA-3′ Rv 5′-TGTCCCCAACTTTGTAGCT-3′ | 200 | 60 |
| SDHB | Fw 5′-TTCTTATGCAGGCCTATCG-3′ Rv 5′-GGTTGCCATCATTTTCTTG-3′ | 185 | 60 |
| FASN | Fw 5′-CCGCTCTGGTTCATCTG-3′ Rv 5′-GGTCTATGAGGCCTATCTGG-3′ | 226 | 60 |
| ACACA | Fw 5′-AAGAGGCAATTTCAAACATG-3′ Rv 5′-ATGGTGTCAGGTCGCTC-3′ | 182 | 60 |
| ELOVL2 | Fw 5′-AAGCTGACATCCGGGTAG-3′ Rv 5′-TGTCCACAAGGTATCCAGTT-3′ | 186 | 60 |
| GAPDHa | Fw 5′-AGATCCCTCCAAAATCAAGTGG-3′ Rv 5′-GGCAGAGATGATGACCCTTTT-3′ | 129 | 60 |
| GAPDHb | Fw 5′-TGCACCACCAACTGCTTAGC-3′ Rv 5′-GGCATGGACTGTGGTCATGAG-3′ | 87 | 60 |
| TBP | Fw 5′-GAGCTGTGATGTGAAGTTTCC-3′ Rv 5′-TCTGGGTTTGATCATTCTGTAG-3′ | 117 | 60 |
| Code | Gender | Age | Pathology Diagnoses | CNS WHO Grade |
|---|---|---|---|---|
| T1 | Male | 10 | Pylocitic astrocytoma | 1 |
| T12 | Male | 3 | Pylocitic astrocytoma | 1 |
| T4 | Female | 3 | Gemystocitic Astrocytoma | 2 |
| T18 | Female | 13 | Diffuse astrocytoma | 2 |
| T7 | Male | 6 | Stem Glioma | 3 |
| T10 | Male | 14 | Anaplasic astrocytoma | 3 |
| T9 | Female | 9 | Glioblastoma | 4 |
| Gene | BestKeeeper | Comparative ΔCT | geNorm | NormFinder | RefFinder (Geomean) |
|---|---|---|---|---|---|
| TPI1 | 0.024 | 4.29 | 0.017 | 0.009 | 1.41 |
| PKM | 0.016 | 4.29 | 0.017 | 0.009 | 1.73 |
| GAPDH | 0.029 | 4.29 | 0.035 | 0.020 | 2.06 |
| GAPDHa | 0.044 | 4.30 | 0.053 | 0.030 | 4.00 |
| TKT1 | 1.40 | 4.83 | 0.768 | 1.689 | 5.23 |
| SDHB | 1.88 | 5.49 | 1.445 | 1.207 | 5.73 |
| G6PD | 3.52 | 6.21 | 2.373 | 5.329 | 7.00 |
| ACACA | 4.14 | 6.77 | 2.986 | 6.275 | 8.24 |
| GAPDHb | 4.88 | 7.84 | 3.477 | 7.396 | 9.49 |
| TBP | 12.18 | 16.76 | 6.646 | 16.71 | 11.00 |
| Rank | BestKeeper | Comparative ΔCT | geNorm | NormFinder | RefFinder |
|---|---|---|---|---|---|
| 1 | PKM | PKM | PKM | PKM | TPI1 |
| 2 | TPI1 | TPI1 | TPI1 | TPI1 | PKM |
| 3 | GAPDH | GAPDH | GAPDH | GAPDH | GAPDH |
| 4 | GAPDHa | GAPDHa | GAPDHa | GAPDHa | GAPDHa |
| 5 | TKT1 | TKT1 | TKT1 | SDHB | TKT1 |
| 6 | SDHB | SDHB | SDHB | TKT1 | SDHB |
| 7 | G6PD | G6PD | G6PD | G6PD | G6PD |
| 8 | ACACA | ACACA | ACACA | ACACA | ACACA |
| 9 | GAPDHb | GAPDHb | GAPDHb | GAPDHb | GAPDHb |
| 10 | TBP | TBP | TBP | TBP | TBP |
Publisher’s Note: MDPI stays neutral with regard to jurisdictional claims in published maps and institutional affiliations. |
© 2021 by the authors. Licensee MDPI, Basel, Switzerland. This article is an open access article distributed under the terms and conditions of the Creative Commons Attribution (CC BY) license (https://creativecommons.org/licenses/by/4.0/).
Share and Cite
Hernández-Ochoa, B.; Fernández-Rosario, F.; Castillo-Rodríguez, R.A.; Marhx-Bracho, A.; Cárdenas-Rodríguez, N.; Martínez-Rosas, V.; Morales-Luna, L.; González-Valdez, A.; Calderón-Jaimes, E.; Pérez de la Cruz, V.; et al. Validation and Selection of New Reference Genes for RT-qPCR Analysis in Pediatric Glioma of Different Grades. Genes 2021, 12, 1335. https://doi.org/10.3390/genes12091335
Hernández-Ochoa B, Fernández-Rosario F, Castillo-Rodríguez RA, Marhx-Bracho A, Cárdenas-Rodríguez N, Martínez-Rosas V, Morales-Luna L, González-Valdez A, Calderón-Jaimes E, Pérez de la Cruz V, et al. Validation and Selection of New Reference Genes for RT-qPCR Analysis in Pediatric Glioma of Different Grades. Genes. 2021; 12(9):1335. https://doi.org/10.3390/genes12091335
Chicago/Turabian StyleHernández-Ochoa, Beatriz, Fabiola Fernández-Rosario, Rosa Angelica Castillo-Rodríguez, Alfonso Marhx-Bracho, Noemí Cárdenas-Rodríguez, Víctor Martínez-Rosas, Laura Morales-Luna, Abigail González-Valdez, Ernesto Calderón-Jaimes, Verónica Pérez de la Cruz, and et al. 2021. "Validation and Selection of New Reference Genes for RT-qPCR Analysis in Pediatric Glioma of Different Grades" Genes 12, no. 9: 1335. https://doi.org/10.3390/genes12091335