Article

Genetic Variation in PADI6-PADI4 on 1p36.13 Is Associated with Common Forms of Human Generalized Epilepsy

1
Department of Biomedical Sciences, Cooper Medical School of Rowan University, Camden, NJ 08103, USA
2
Center for Applied Genomics, The Children’s Hospital of Philadelphia, Philadelphia, PA 19104, USA
3
Department of Neurology, Thomas Jefferson University, Philadelphia, PA 19107, USA
4
Department of Computer Science, New Jersey Institute of Technology, Newark, NJ 07102, USA
5
Department of Neurology and Pediatrics, The Children’s Hospital of Philadelphia, Philadelphia, PA 19104, USA
6
Department of Neurology, University of Cincinnati College of Medicine, Cincinnati, OH 45267, USA
7
Department of Neurology, New York University, New York, NY 10016, USA
8
Department of Neurology, Nationwide Children’s Hospital, Columbus, OH 43205, USA
9
Montreal University Health Center, University of Montreal, Montreal, QC H3C 3J7, Canada
10
Departments of Neurology, Massachusetts General Hospital, Beth Israel Deaconess Medical Center, Harvard Medical School, Boston, MA 02114, USA
11
Research Service, Coatesville Veteran’s Affairs Medical Center, Coatesville, PA 19320, USA
12
Section on Clinical Genomics and Experimental Therapeutics, NIAAA, NIH, Bethesda, MD 20892, USA
*
Author to whom correspondence should be addressed.
Genes 2021, 12(9), 1441; https://doi.org/10.3390/genes12091441
Submission received: 11 August 2021 / Revised: 14 September 2021 / Accepted: 15 September 2021 / Published: 18 September 2021

Abstract

:
We performed a genome-wide association study (GWAS) to identify genetic variation associated with common forms of idiopathic generalized epilepsy (GE) and focal epilepsy (FE). Using a cohort of 2220 patients and 14,448 controls, we searched for single nucleotide polymorphisms (SNPs) associated with GE, FE and both forms combined. We did not find any SNPs that reached genome-wide statistical significance (p ≤ 5 × 10⁻⁸) when comparing all cases to all controls, and few SNPs of interest comparing FE cases to controls. However, we document multiple linked SNPs in the PADI6-PADI4 genes that reach genome-wide significance and are associated with disease when comparing GE cases alone to controls. PADI genes encode enzymes that deiminate arginine to citrulline in molecular pathways related to epigenetic regulation of histones and autoantibody formation. Although epilepsy genetics and treatment are focused strongly on ion channel and neurotransmitter mechanisms, these results suggest that epigenetic control of gene expression and the formation of autoantibodies may also play roles in epileptogenesis.

1. Introduction

Epilepsy is an umbrella term for a heterogeneous group of diseases that involve recurring seizures of many varieties as well as associated comorbidities. It is one of the most common of neurological illnesses, with a global incidence of 0.3–1.7% [1]. Although epilepsy incidence does not vary based on geography, culture or sex, it has nonetheless been difficult to estimate worldwide incidence due to socioeconomic variables between low- and high-income countries [2].
Some forms of epilepsy are rare, caused by a single gene mutation inherited in a predictable Mendelian pattern [3]. However, the vast majority of patients suffer from epilepsy subtypes of unknown etiology. These include both generalized epilepsies (GE, also called genetic generalized epilepsies: GGE) such as juvenile myoclonic epilepsy (JME) or childhood absence epilepsy (CAE), as well as focal epilepsies (FE) including temporal lobe epilepsy (TLE) with or without mesial temporal sclerosis (MTS). These common forms present as complex traits with no clear mode of inheritance, suggesting that they are caused by multiple genetic variants interacting with environmental influences [3]. Genome-wide association studies (GWAS) have been used to identify specific genetic variants that influence the etiology of many complex human traits and, in recent years, GWAS have successfully identified factors contributing to common illnesses [4]. Documenting an association between a common disease and common genetic variations (i.e., those occurring in >1% of chromosomes tested) opens new avenues of research into pathophysiological mechanisms.
To date, five epilepsy GWAS have been published. The first included cohorts of patients from Europe, USA and the UK who were diagnosed as having FE from both unknown and known causes, the latter including conditions such as infection, tumor or trauma [5]. No single nucleotide polymorphisms (SNPs) reached the conventionally accepted threshold for declaring genome-wide statistical significance (p < 5 × 10⁻⁸) [5]. There were several regions harboring SNPs that gave suggestive association (5 × 10⁻⁸ < p < 5 × 10⁻⁶) and it is likely that there were multiple false-negative (i.e., true-positive) loci represented within this level of statistical noise [4]. The second GWAS examined patients from China with FE, again including cases of both known and unknown cause [6]. In this study, only one variant, an SNP within CAMSAP1L1 on 1q32, reached genome-wide significance (p = 1 × 10⁻⁸) [6]. The third epilepsy GWAS examined patients of European ancestry with idiopathic GE, including presumed genetic absence epilepsy (GAE), CAE, juvenile absence (JAE) and JME (EPICURE Consortium; EMINet Consortium) [7]. The patients were separated into two cohorts, one for discovery and one for replication, and a two-stage statistical analysis approach was employed. No SNPs reached genome-wide significance in the discovery cohort when GE, GAE or JME were compared individually to controls. However, when the replication cohort was processed and both datasets were combined by a meta-analysis, there were several chromosomes where markers reached genome-wide significance, including regions on 2p16.1 and 17q21.32 for GE, 2q22.3 for GAE and 1q43 for JME; in addition, there was a region of suggestive association at 2q24.3 for GE [7]. Next, a meta-analysis of prior GWAS [5,7], as well as the patients from this present study and other cohorts from different groups, was published under the auspices of the International League Against Epilepsy (ILAE) led by a Consortium on Complex Epilepsies [8]. This latter report included 8696 epilepsy patients and 26,157 controls and, compared to prior published work, it used a more stringent statistical criterion to declare genome-wide significance (p < 1.66 × 10⁻⁸). Results from the comparison between all patients with epilepsy and all control individuals revealed a number of genome-wide significant SNPs at 2q24.3 (p = 8.71 × 10⁻¹⁰), implicating SCN1A (a sodium ion channel subunit gene), and at 4p15.1 (p = 5.44 × 10⁻⁹), implicating PCDH7 (a protocadherin gene). In the ILAE meta-analysis of the GE cohort, a single SNP at 2p16.1 (p = 9.99 × 10⁻⁹) was identified, most strongly implicating VRK2 or FANCL. In addition, a statistical signal was detected at multiple SNPs in the MMP8 locus on 11q22.2 (p < 2.37 × 10⁻⁸). The meta-analysis did not detect any SNPs that achieved genome-wide significance in the FE cohort. Most recently, the ILAE reported on an updated cohort that contained 15,212 patients and 29,677 controls, identifying 11 novel variations that reached genome-wide significance in the GE cohort and variants associated with all epilepsies, as well as with FE specifically [9].
Here, we report a GWAS on our cohort of patients we designate as the “Philadelphia Cohort”. The patients are all from North America and have common forms of GE and FE (see Materials and Methods). Our study results identify novel genetic loci that are potentially involved in the pathogenesis of epilepsy and that may provide entry points into novel pathways for possible therapeutic intervention [1].

2. Materials and Methods

2.1. Study Subjects

All subjects, including patients and controls, completed the informed consent process approved by local Institutional Review Boards at participating clinical sites. Peripheral blood samples were the preferred method for DNA sampling, but saliva samples were collected for some pediatric cases. Clinical inclusion criteria for GE and FE have been published previously [10]. These inclusion criteria give diagnostic age ranges for each of the epilepsy types collected and the cohorts have roughly equal distributions of male and female subjects. This cohort consisted of 2220 patients and 14,488 controls with 964 focal cases and 827 generalized cases collected directly by participating sites. Approximately 80% of the samples came from Jefferson, The Children’s Hospital of Philadelphia (CHOP) and Nationwide Children’s Hospital, with 20% coming from the remaining four sites (University of Pennsylvania, University of Cincinnati, University of Montreal and MGH/Harvard/Beth Israel Deaconess). Another 429 samples were added via screening of electronic health records from CHOP. Controls were also recruited at individual clinical sites with the majority (>95%) coming from the DNA repository at the Center for Applied Genomics (CAG) at CHOP. Case and controls were matched by ancestry and GWAS analysis used sex as a covariant.

2.2. Ethical Approval Code

All subjects gave their informed consent for inclusion before they participated in the study. The study was conducted in accordance with the Declaration of Helsinki, and the protocol was approved by the Ethics Committee of each participating institution under the overall auspices of the Institutional Review Board at Thomas Jefferson University Hospital (protocol #10F.208 approved 11 July 2019).

2.3. Overview: Genome-Wide Association Meta-Analysis

For gene discovery, we utilized cohorts in which the majority of cases were collected specifically for genetic studies and were recruited through epilepsy specialty physicians. We collected a smaller number of subjects via identification from the electronic medical record (EMR). To qualify for inclusion as a GE or FE case via EMR, an individual had to have an ICD9 code specifying that specific subtype of epilepsy (e.g., 345.1 or 345.4) and had to have been seen by a neurologist confirming the diagnosis (of GE or FE). All other ICD9 code diagnoses that pointed to idiopathic epilepsy were included in the ‘all epilepsy’ category. Table 1 presents information on patient ancestry, data acquisition chip used for genotyping and the type of epilepsy (GE or FE). For patients of European and African ancestries, we used METAL meta-analysis on cohorts 1, 3, and 5 and 2, 4 and 6, respectively [11]. All cases were matched with controls that were genotyped on the same platform with similar proportions of each cohort typed on each of the 3 platforms. For the combined European and African ancestry trans-ethnic meta-analysis, we utilized MANTRA and a Baysian approach [12].

2.4. Meta-Analysis: METAL and MANTRA

The genome-wide analyses of the European and Africa ancestry cohorts were meta-analyzed separately using METAL. MANTRA was then used for trans-ethnic meta-analysis. Sample numbers used are shown in Table 1. A total of 2220 epilepsy patient samples passed quality control and were included in the analysis. Of these, 964 were FE, 827 were GE and an additional 429 were from electronic records and not categorized as GE or FE. The control group consisted of 14,488 samples that passed all quality controls for genotyping. Statistical significance was set at genome-wide p ≤ 5 × 10⁻⁸ for METAL analysis. Statistical significance was set at Bayes Factor ≥ 6.00 for the MANTRA analysis.

2.5. Genotyping

We performed high-throughput genome-wide genotyping using three different high-density SNP arrays. Samples included in the discovery phase of the analysis were genotyped on the Illumina Infinium HumanHap550, Human610-Quad and HumanOmniExpress platforms.

2.6. Ancestry Determination

Data were pre-filtered for sample call rate > 95%, SNP call rate > 95% and minor allele frequency > 1%. The genotypes were then combined with those derived from overlapping SNPs within HapMap Phase 3. The Genome-wide Complex Trait Analysis (GCTA) program was used to determine the eigenvalues and eigenvectors of the samples [13]. The resulting top 10 eigenvectors were then used as input for a k-nearest neighbor‘s algorithm, which was trained on the Hapmap Phase 3 samples and their respective ancestries. The samples were then classified as the ancestry of the nearest Hapmap Phase 3 neighbor. The ‘knn’ function in the ‘class’ package in R was used for the k-nearest neighbor classification algorithm (https://stat.ethz.ch/R-manual/R-devel/library/class/html/knn.html) (accessed on 21 May 2017).

2.7. Imputation

Prior to imputation, samples were only retained in the analysis if they had either European or African ancestry, as these racial groups were the only ones of appropriate sample size. Samples were then grouped into their respective cohorts. Cohorts in which there were multiple BeadChip types were only analyzed with the subset of SNPs common to the different BeadChip types. Samples were then retained only if they had a sample call rate > 95% and were estimated to have an identity-by-descent proportion < 0.1875 with any other sample. SNPs were retained if they had a call rate > 95%, minor allele frequency > 1% and Hardy–Weinberg equilibrium (HWE) p > 1 × 10⁻⁶. All quality control was performed using PLINK [14]. All SNP positions are based on hg19 build. Samples were then pre-phased and genotypes imputed with the 1000 Genome phase 1 Interim haplotypes using Impute v2 [15]. Cases and controls were genotyped on different chip platforms, and all were matched to the appropriate chip and imputation data for final analyses (see Table 1).

2.8. SNP Validation

In order to test the accuracy of imputation, we selected a subset of cases and controls for Sanger sequencing using rs36067110 on 1p36.13 as a representative SNP. The forward sequencing primer was 5′-CTGTGCCTGGCCATATCATCT-3′ and the reverse sequencing primer was 5′-CCGTTGGTGGTAGGTGTCTAA-3′.

2.9. Genome-Wide Association

Prior to association analyses, SNPs were removed from the dataset if they had an info value < 0.8, minor allele frequency < 1% or HWE p < 1 × 10⁻⁶. All remaining SNPs were tested by logistic regression using the top 3 eigenvectors and sex as covariates for the 3 phenotypes. We used SNPtest for the association analysis (https://mathgen.stats.ox.ac.uk/genetics_software/snptest/snptest.html) (accessed on 21 May 2017).

2.10. Meta-Analysis

The cohorts separated by ancestry were meta-analyzed using METAL applying an inverse variance-based algorithm [15]. SNPs were removed from the meta-analysis if they had a heterogeneity (p < 0.05 or I2 < 50) or were missing from one of the groups for quality control reasons. Individual study- and meta-analysis-level genomic control was used prior to calculation of final ancestry-specific meta-analysis statistics. An SNP in the ancestry-specific meta-analysis was considered to be genome-wide significant with a p-value ≤ 5 × 10⁻⁸. Ancestry-level meta-analysis statistics were then combined using MANTRA in a trans-ethnic meta-analysis. The number of samples in each analysis was calculated as the effective sample size Neff = 4/(1/Ncases + 1/Nctrls). An SNP in the trans-ethnic meta-analysis was considered to be genome-wide significant with a log10 (Bayes Factor) ≥ 6.

3. Results

3.1. METAL and MANTRA for All Epilepsy Patients vs. All Controls

When comparing all patients to all controls, no SNPs reached the threshold for statistical significance in either METAL or MANTRA analyses.

3.2. METAL for Patients of European Ancestry with GE

Table 2 shows that three SNPs reached genome-wide significance (p < 5 × 10⁻⁸) in the METAL analysis. The markers are located at 1p36.13 in the PADI4-PADI6 locus. Furthermore, six additional SNPs in this region reached p-values of 5.3–8.1 × 10⁻⁸, resulting in nine linked markers with p-values between 10−7 and 10−8. These data document a positive association between variants in PADI6-PADI4 and GE in European subjects.

3.3. METAL for GE in Patients of African Ancestry

Table 2 shows that no SNPs reached genome-wide significance when comparing patients of African ancestry with GE to controls. However, suggestive p values (~10−5) were found at three linked markers on the X chromosome near TMEM47, as was also found for patients of European ancestry.

3.4. MANTRA for GE Trans-Ethnic Analysis

Table 2 shows the results of the MANTRA analysis on all patients with GE. These data support the METAL analysis of European patients with GE, as the same three PADI6 SNPs that reach genome-wide significance in the METAL analysis also reach genome-wide significance in the Bayes analysis, with Bayes Factors between 6.02 and 6.21. Two additional markers in PADI4 reached Bayes Factors of 5.99 and 5.98. Four more SNPs in PADI4 reached Bayes factors between 5.71 and 5.75. These data confirm a strong association between GE and PADI4-PADI6.
In the METAL analysis, the association between GE and SNPs on the X chromosome near TMEM47 gave a p-value of 10−5 for patients of both European and African ancestry. Combined ancestry data with MANTRA show that two of these markers reach genome-wide significance (rs5928634, Bayes = 6.39 and rs5927306 Bayes = 6.23). One SNP on chromosome 17 reached a statistically significant Bayes Factor of 6.16 with a METAL p-value in Europeans of 3.98 × 10⁻⁸); however, this is a lone marker in a gene poor region and most likely represents a false-positive result.

3.5. METAL for FE Patients of European Ancestry

Table 3 shows the results of METAL analysis for the cohort of European FE patients. Only one marker, on the X chromosome (X-73537149) in MAP2K4P1, reached METAL significance in FE patients of European ancestry (p = 2.45 × 10⁻⁸). Once again, this lone marker, which is in a pseudo-gene, most likely represents a false-positive signal.

3.6. METAL for Patients of African Ancestry with FE

Table 3 shows the results of METAL analysis for the cohort of African patients with FE. Overall, four SNPs reached genome-wide significance; however, only two were linked and found in the same gene, RANBP3, on chromosome 19 (rs114591251, p = 3.66 × 10⁻⁸ and 19-5961503, p = 2.15 × 10⁻⁸). The other two are single markers, one in the ASS1 gene on chromosome 9 and another in a gene poor region of chromosome 2 (rs12554609 in ASS1, p = 1.08 × 10⁻⁹, and rs58069848, p = 3.82 × 10⁻⁸).

3.7. MANTRA for FE Trans-Ethnic Analysis

Table 3 shows the results of the MANTRA trans-ethnic analyses for all patients with FE. Interestingly, for this cohort, the analysis calculated genome-wide significance for the single marker in ASS1 noted above (Bayes 7.2) and the two linked SNPs in RANBP3 also noted above (Bayes = 6.30 and 6.15, respectively). The lone marker in MAP2K4P1 that reached genome-wide significance in the European FE METAL analysis is also statistically significant in MANTRA (Bayes = 6.29). The lone marker in the gene-poor region of chromosome 2 also shows a statistically significant MANTRA signal (Bayes = 6.13). In addition, the MANTRA results provide evidence for a suggestive association at 18q12.3 in the PIK3C3 locus. Two SNPs in this region are very close to the threshold for genome-wide significance with Bayes factors at 5.99 and 5.96. Seven additional SNPs in this locus had Bayes factors between 5.65 and 5.94, and p-values in the African cohort via METAL that ranged from 1.2 × 10⁻⁷ to 5.1 × 10⁻⁸. These combined data provide evidence for a suggestive association between FE and PIK3C3. Further study of this locus is warranted, especially in patients of African ancestry.

3.8. SNP Validation

In order to test the accuracy of SNP imputation, we selected a subset of cases and controls for Sanger sequencing using rs36067110 on 1p36.13 as a representative locus. The specific subset of samples for validation was chosen based on case/control status and the imputed presence/absence of the respective alleles. We sequenced 57 samples (n = 25 cases and n = 32 controls), with two samples failing. A plot of the Sanger sequence minor allele dosage vs. the imputed minor allele dosage is shown in Figure 1. The overall correlation coefficient of imputed SNP dosage vs. Sanger sequence SNP dosage was 0.826.

3.9. Manhattan Plots

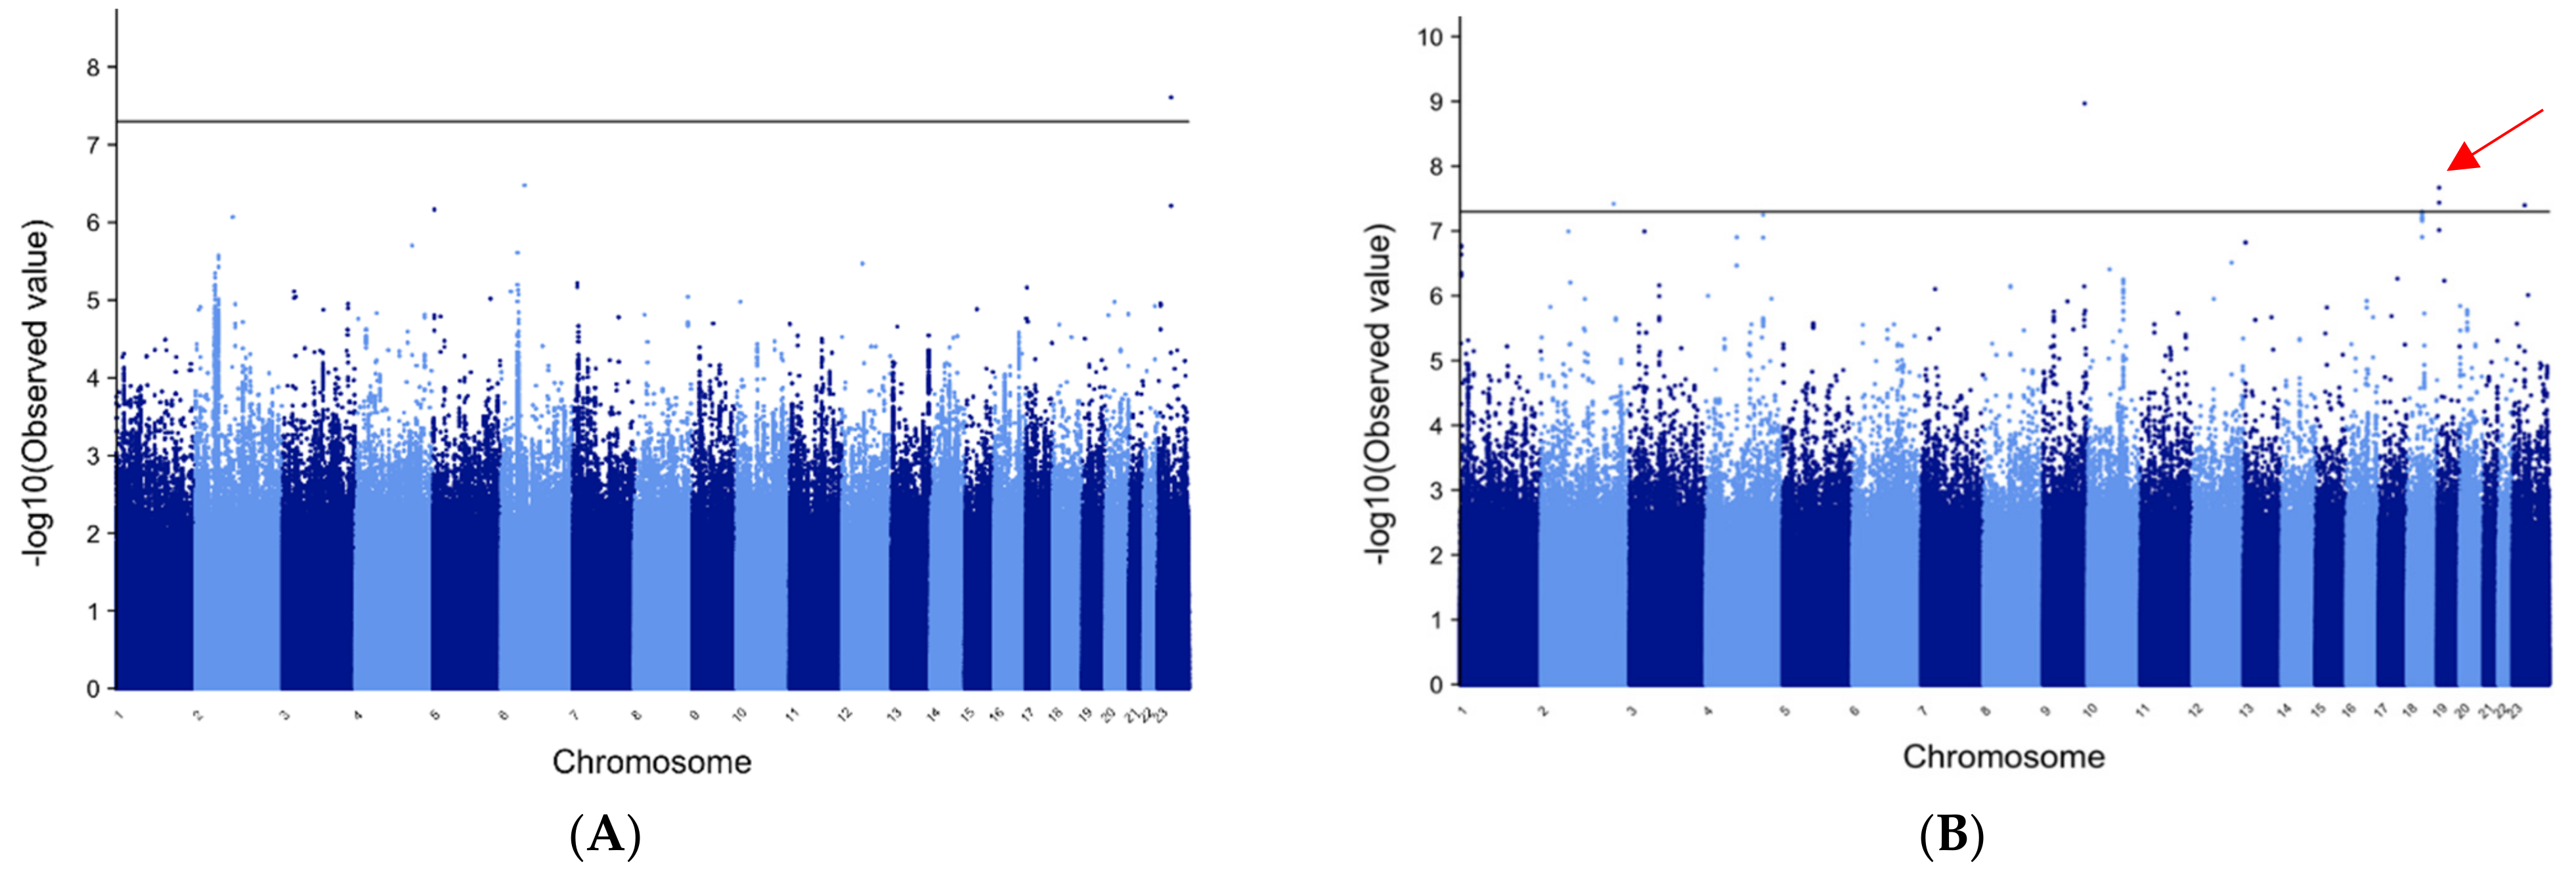
Figure 2 shows the Manhattan plot for the METAL analysis of GE in patients of European ancestry. Note the three linked markers on chromosome 1 in the PADI4-PADI6 locus that reach genome-wide statistical significance (red arrow) and an additional five linked markers in this region that are close to genome-wide significance.
Figure 3 shows the Manhattan plots for the METAL analysis of FE in patients of both European and African ancestry. Of note is the solo marker in MAP2K4P1 that reaches genome-wide statistical significance in the cohort of European patients and is most likely a false-positive signal. Similarly, in the African cohort, a single marker in ASS1 and a single marker in a gene-poor region on the X chromosome near NUDT10 reach genome-wide significance, but again, these likely represent false positives since no other linked marker shows significant or suggestive association. Two linked SNPs in RANBP3 reached genome-wide significance in the African cohort. In addition, twelve linked SNPs in the PIKC3 gene reached p-values of 10−5 in the METAL analysis in patients of African descent and two reached 5.99 and 5.96 Bayes factors in the MANTRA analysis.
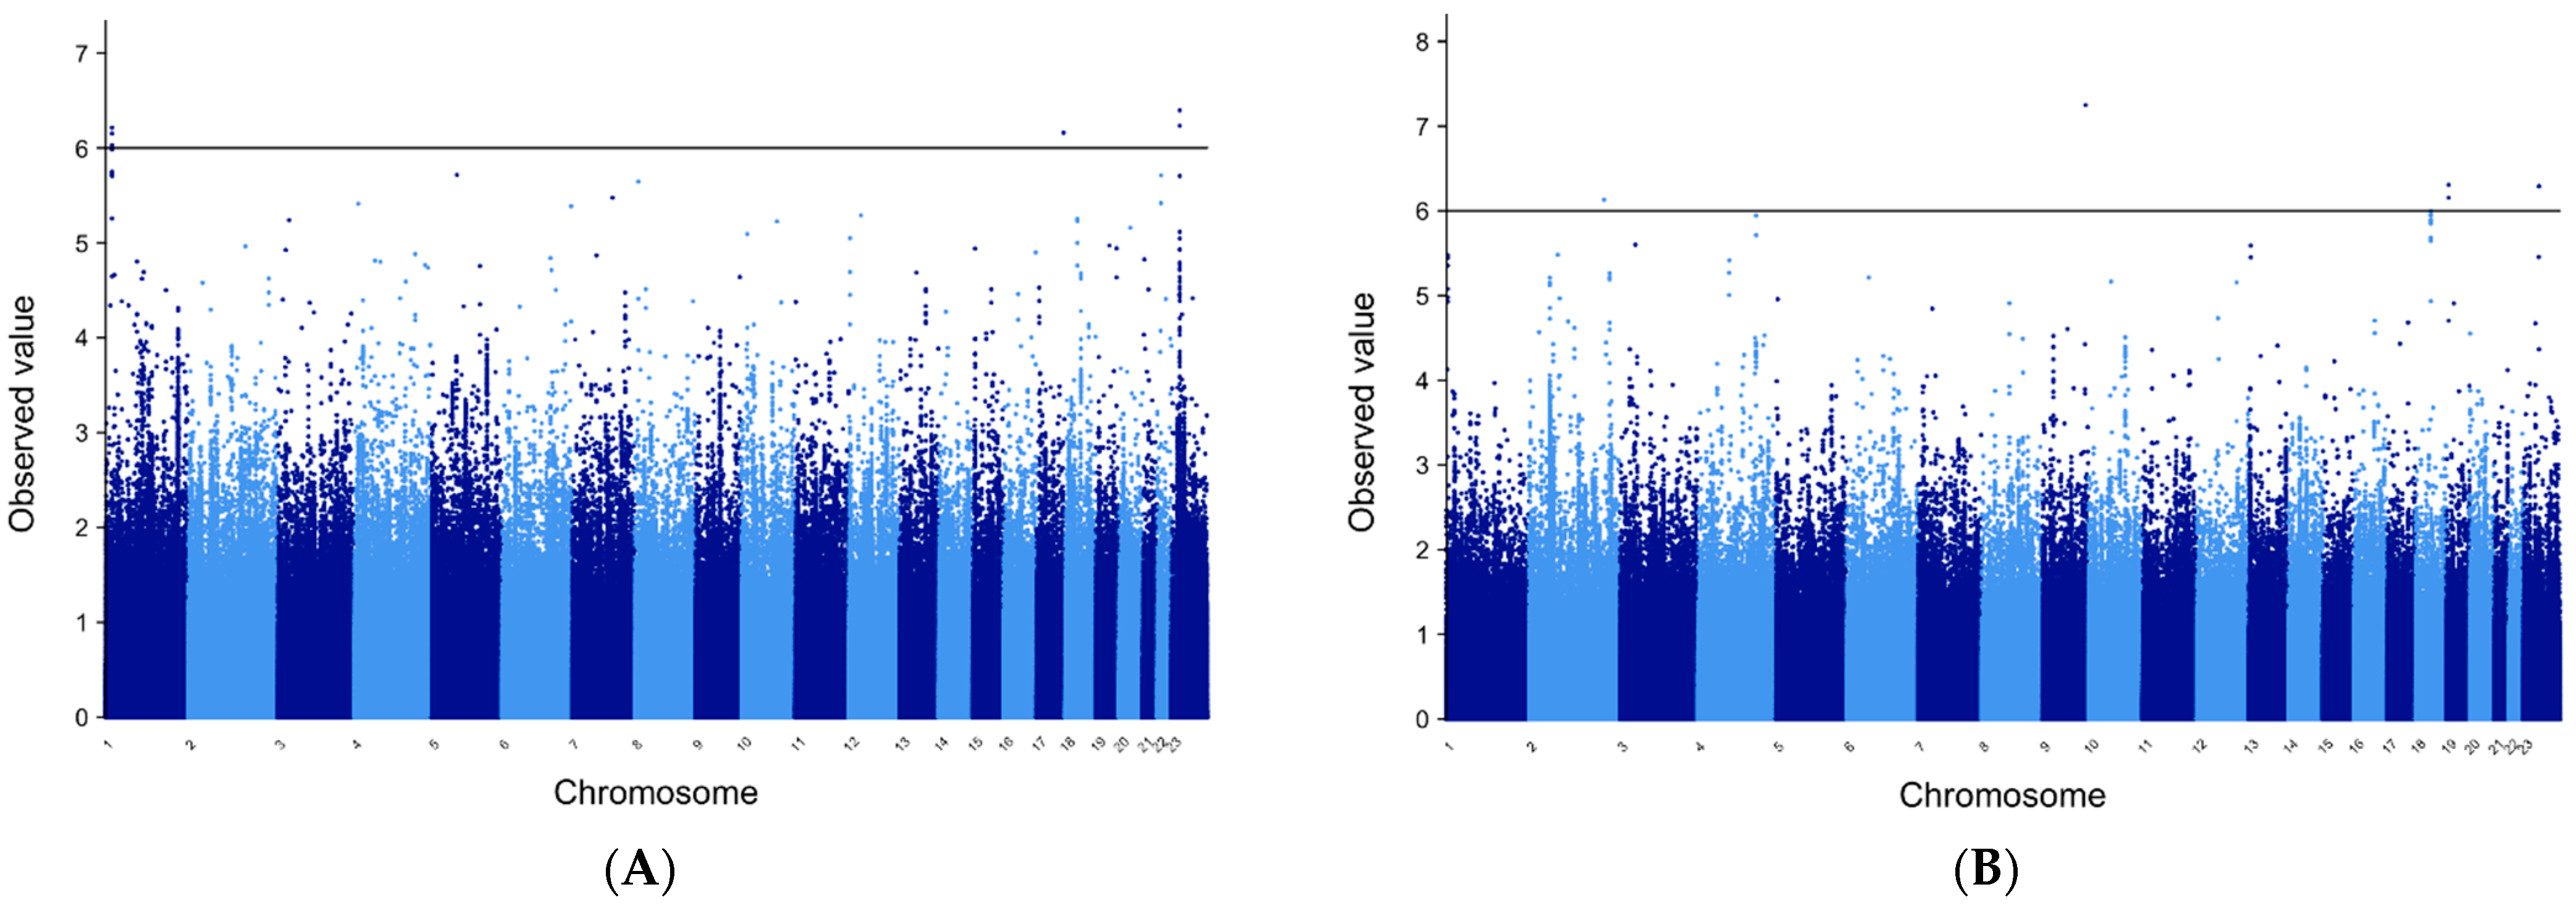
Figure 4. Manhattan plots for the trans-ethnic MANTRA analysis for both GE and FE, respectively. The PADI4-PADI6 locus shows the strongest evidence for association in the combined GE cohorts. In addition, two linked markers on the X chromosome near the TMEM47 gene reach the threshold for declaring statistical significance in the GE cohort and warrant further investigation. In the FE cohort, MANTRA results showed that two linked markers in RANBP3 reach statistical significance along with solo markers in the ASS1 and MAP2K4P1 genes.

4. Discussion

We report positive results from a GWAS in common forms of epilepsy utilizing patients exclusively from the Philadelphia Cohort, samples that were included as part of a global (and ongoing) ILAE project [8,9]. In the present study, a set of nine linked markers in the PADI4-PADI6 locus reach genome-wide or near genome-wide levels of statistical significance in patients with GE of European ancestry. Although this is a low yield, it is consistent with prior epilepsy GWAS using individual or a small number of patient cohorts [5,6,7].
Follow-up studies on larger patient populations assembled by combining cohorts from various international sites support the notion that, compared to FE, GE phenotypes have the strongest association with common genetic variation as a greater number of loci are detected with increasing sample size [8,9]. One possible explanation for the paucity of positive findings in FE is heterogeneity introduced by inclusion of cases with known symptomatic causes (arterio-venous malformation, tumor, infection or trauma), as examined in most prior studies [5,6,8,9]. These patients likely harbor genetic risk factors that are different than patients with idiopathic epilepsy and may dilute statistical power or introduce other confounds. Patients with FE in the Philadelphia Cohort were only included if they had no evidence for a symptomatic cause of their epilepsy.
Lack of replication of specific GWAS signals between independent cohorts remains a problem in the field of epilepsy research. Thus far, the SCN1A locus is the most replicated genetic risk factor found in epilepsy. It is a known causative factor in rare Mendelian epilepsies, as well as a risk factor in common epilepsies [8,9]. The PADI findings in our study are not reproduced at genome-wide significance levels in the larger meta-analyses performed thus far [8,9]. Heterogeneity of cohorts collected from different parts of the world likely contributes to this lack of replication at genome-wide levels. Thus, increasing sample size may not always increase power for specific signals, as important variations may be diluted when large heterogeneous populations are combined for analysis. In general, replication of SNP variations that reach genome-wide significance from prior published epilepsy GWAS have not been systematically studied in independent cohorts. While the ILAE continues to pool cohorts to create larger sample sizes for continued GWAS analysis, attempts to replicate prior findings in independent cohorts could help identify true positive findings. Replication could be conducted with less stringent requirements for claiming statistical significance, as correction for multiple testing is greatly reduced when specific markers are tested compared with a genome-wide analysis. It is possible that rare mutations in PADI4 or PADI6 are driving a synthetic association in our independent cohort as the PADI loci do not appear to be genome-wide significant in larger meta-analyses with other cohorts from around the world. Next generation sequencing of whole exomes from patients in our cohort would allow testing of the possibility that our reported results represent a synthetic association created by rare mutations in the Philadelphia Cohort. In every GWAS, there are a number of sub-threshold associations detected that point to genes participating in pathways that affect neurodevelopment or the electrical properties of neurons. Prioritizing this list for analysis based on biological plausibility, brain expression patterns and additional data linking genes to epilepsy phenotypes will identify additional candidate molecules that warrant further study.
Here, we report a genome-wide significant association between GE and a locus on chromosome 1 at 1p36.13 in the PADI4/PADI6 gene region. Three SNP markers in this region reach genome-wide significance via METAL and six more SNPs have p-values between 2.4 × 10⁻⁷ and 5.3 × 10⁻⁸. These three SNPS also reach genome-wide significance in the MANTRA analysis (Bayes ≥ 6.00), as well as two additional markers at Bayes = 5.99 and 5.96. Of interest is the fact that deletion of regions on 1p36 in humans leads to variable clinical phenotypes, but the majority include epilepsy [16,17]. PADI4-PADI6 is in the critical region of the 1p36 deletion syndromes; thus, our data point to this locus as potentially involved in the epilepsy phenotype in these individuals.
PADI4 encodes an enzyme that mediates the conversion of arginine to citrulline as a post translational protein modification and is not able to convert free arginine to citrulline [18]. Genetic variation in PADI4 has been associated with rheumatoid arthritis through the utilization of GWAS [18]. It has been proposed that increased citrullination of synovial proteins may alter their conformation and make them appear foreign, thereby triggering an autoimmune response [19]. In support of this hypothesis, overexpression of PADI4 activity leads to loss in myelin in mouse nervous tissue, and citrullination of arginine residues in myelin proteins may induce autoantibody production [20,21]. More important is documentation that PADI4 is expressed in both neurons and astrocytes of the hippocampus and cortex in human brain, and may contribute to formation of autoantibodies in Alzheimer’s disease [22]. Autoantibodies have been reported previously in patients with epilepsy, and over the past several decades, a substantial amount of literature on putative autoimmune defects in epilepsy has emerged [23]. It also is interesting to note that histone modifications include arginine-to-citrulline conversion [24], and this biochemical reaction decondenses chromatin and activates gene transcription, especially for genes that are expressed by early pluripotent stem cell progenitors [25]. Alternatively, arginine residues in histones are methylated as part of the epigenetic code, and conversion to citrulline would eliminate this site of epigenetic regulation. Thus, histone citrullination is an epigenetic process and it could be a mechanism that affects a wide variety of gene targets, including some that mediate epileptogenesis.
We also found suggestive evidence for an association between GE and markers on the X chromosome, with two markers near the TMEM47 gene reaching significance via MANTRA (Bayes 6.39 and 6.23). TMEM47 encodes a transmembrane protein of unknown function; thus, although the relationship to epileptogenesis is unclear, these results warrant further study.
In addition to positive results in GE, our data also provide suggestive evidence for several associations in FE, specifically in patients of African ancestry where we identified weak signals within PIK3C3 and RANBP3, and weaker, single-marker signals in ASS1 and MAP2K4P1. Although lone markers most likely represent false-positive results, ASS1 is noteworthy in the context of our other findings because it encodes an enzyme that catalyzes the penultimate step in arginine synthesis and is upstream of the PADI enzymatic pathway. Nine linked markers with p-values just below genome-wide levels of significance in PIK3C3 make this gene of particular interest. PIK genes participate in autophagy and lysosomal function [26]. Variations in PIK3C3 have been associated with bipolar and schizophrenia in numerous studies [27]. The role of this gene in neurodevelopment is documented with a case report of a deletion in the gene in a patient with a specific learning disability [28].

5. Conclusions

We identified a locus at 1p36.13 that is associated strongly with common forms of human GE and, taken together, our data suggest that PADI4 is the gene most likely to underlie this signal. We document multiple linked markers at genome-wide levels of significance by both METAL and MANTRA analyses. Additional markers of suggestive association warrant further study in separate cohorts. Future progress anticipated in larger epilepsy consortium projects will enable us to attempt replication of the results of the present study.

Author Contributions

R.J.B., T.N.F. and H.H.: Conceptualization, methodology, funding acquisition, original draft preparation, writing, review and editing, project administration, supervision. J.P.B. and Z.W.: formal analysis, methodology, data curation, original draft preparation, writing, editing and reviewing. M.R.S., D.J.D.: Conceptualization, resources, supervision, methodology, writing, editing and reviewing. M.D.P., J.A.F., W.L., P.C., S.C.S., F.W.L., H.B., S.F.A.G.: Resources, supervision, methodology, writing, editing and reviewing. All authors have read and agreed to the published version of the manuscript.

Funding

This research was funded by NIH R01-NS49306-01 to RJB and NIH R01-NS064154-01 to RJB and HH. The APC was funded by RJB using funds from the Camden Health Research Initiative internal grants sponsored by Rowan University.

Institutional Review Board Statement

The study was conducted according to the guidelines of the Declaration of Helsinki, and approved by the Institutional Review Board of each participating institution under the overall auspices of the Institutional Review Board at Thomas Jefferson University (protocol #10F.208 approved 11 July 2019).

Informed Consent Statement

Informed consent was obtained from all subjects involved in the study and we have received written informed consent from all participating subjects.

Data Availability Statement

Summary statistics for this study are available upon request from the corresponding author RJB. The ILAE is depositing all summary statistics from this cohort and others around the world in dbGAP.

Acknowledgments

We thank all the patients and their family members for participating. We acknowledge the clinical coordinators who directed the collection of samples, including Terry Scattergood, Molly Taylor and Micheline Gravel, and multiple participating physicians at each site who helped identify patients for the study.

Conflicts of Interest

The authors declare no conflict of interest. The funders (NIH) had no role in the design of the study; in the collection, analyses, or interpretation of data; in the writing of the manuscript, or in the decision to publish the results.

References

  1. Banerjee, P.N.; Filippi, D.; Hauser, W.A. The descriptive epidemiology of epilepsy—A review. Epilepsy Res. 2009, 85, 31–45. [Google Scholar] [CrossRef] [Green Version]
  2. Beghi, E.; Hesdorffer, D. Prevalence of epilepsy-An unknown quantity. Epilepsia 2014, 55, 963–967. [Google Scholar] [CrossRef] [Green Version]
  3. Ferraro, T. The relationship between genes affecting the development of epilepsy and approaches to epilepsy therapy. Expert Rev. Neurother. 2014, 14, 329–352. [Google Scholar] [CrossRef]
  4. Buono, R.J. Genome wide association studies (GWAS) and common forms of human epilepsy. Epilepsy Behav. 2013, 28, S63–S65. [Google Scholar] [CrossRef] [Green Version]
  5. Kasperaviciūte, D.; Catarino, C.B.; Heinzen, E.L.; Depondt, C.; Cavalleri, G.L.; Caboclo, L.O.; Tate, S.K.; Jamnadas-Khoda, J.; Chinthapalli, K.; Clayton, L.M.S.; et al. Common genetic variation and susceptibility to partial epilepsies: A genome-wide association study. Brain 2010, 133 Pt 7, 2136–2147. [Google Scholar] [CrossRef]
  6. Guo, Y.; Baum, L.W.; Sham, P.C.; Wong, V.; Ng, P.W.; Lui, C.H.T.; Sin, N.C.; Tsoi, T.H.; Tang, C.S.N.; Kwan, J.S.H.; et al. Two-stage genome-wide association study identifies variants in CAMSAP1L1 as susceptibility loci for epilepsy in Chinese. Hum. Mol. Genet. 2012, 21, 1184–1189. [Google Scholar] [CrossRef] [PubMed] [Green Version]
  7. Steffens, M.; Leu, C.; Ruppert, A.-K.; Zara, F.; Striano, P.; Robbiano, A.; Capovilla, G.; Tinuper, P.; EPICURE Consortium; EMINet Consortium; et al. Genome-wide association analysis of genetic generalized epilepsies implicates susceptibility loci at 1q43, 2p16.1, 2q22.3 and 17q21.32. Hum. Mol. Genet. 2012, 21, 5359–5372. [Google Scholar] [PubMed]
  8. International League against Epilepsy Consortium on Complex Epilepsies. Genetic determinants of common epilepsies: A meta-analysis of genome-wide association studies. Lancet Neurol. 2014, 13, 893–903. [Google Scholar] [CrossRef] [Green Version]
  9. International League against Epilepsy Consortium on Complex Epilepsies Genome-wide mega-analysis identifies 16 loci and highlights diverse biological mechanisms in the common epilepsies. Nat. Commun. 2018, 9, 5269. [CrossRef] [PubMed]
  10. Buono, R.J.; Lohoff, F.W.; Sander, T.; Sperling, M.R.; O’Connor, M.J.; Dlugos, D.J.; Ryan, S.G.; Golden, G.T.; Zhao, H.; Scattergood, T.M.; et al. Association between variation in the human KCNJ10 potassium ion channel gene and seizure susceptibility. Epilepsy Res. 2004, 58, 175–178. [Google Scholar] [CrossRef]
  11. Willer, C.J.; Li, Y.; Abecasis, G.R. METAL: Fast and efficient meta-analysis of genome wide association scans. Bioinformatics 2010, 26, 2190–2191. [Google Scholar] [CrossRef]
  12. Morris, A.P. Transethnic meta-analysis of genomewide association studies. Genet. Epidemiol. 2011, 35, 809–822. [Google Scholar] [CrossRef] [Green Version]
  13. Yang, J.; Lee, S.H.; Goddard, M.E.; Visscher, P.M. GCTA: A Tool for Genome-wide Complex Trait Analysis. Am. J. Hum. Genet. 2011, 88, 76–82. [Google Scholar] [CrossRef] [PubMed] [Green Version]
  14. Purcell, S.; Neale, B.; Todd-Brown, K.; Thomas, L.; Ferreira, M.A.R.; Bender, D.; Maller, J.; Sklar, P.; de Bakker, P.I.W.; Daly, W.J.; et al. PLINK: A tool set for whole-genome association and population-based linkage analyses. Am. J. Hum. Genet. 2007, 81, 559–575. [Google Scholar] [CrossRef] [PubMed] [Green Version]
  15. Howie, B.N.; Donnelly, P.; Marchini, J. A Flexible and Accurate Genotype Imputation Method for the Next Generation of Genome-Wide Association Studies. PLoS Genet. 2009, 5, e1000529. [Google Scholar] [CrossRef] [PubMed] [Green Version]
  16. Greco, M.; Ferrara, P.; Farello, G.; Striano, P.; Verrotti, A. Electroclinical features of epilepsy associated with 1p36 deletion syndrome: A review. Epilepsy Res. 2018, 139, 92–101. [Google Scholar] [CrossRef] [PubMed]
  17. Scott, D.; Jordan, V.; Zaveri, H. 1p36 deletion syndrome: An update. Appl. Clin. Genet. 2015, 8, 189–200. [Google Scholar] [CrossRef] [PubMed] [Green Version]
  18. Yamamoto, K.; Yamada, R. Genome-wide single nucleotide polymorphism analyses of rheumatoid arthritis. J. Autoimmun. 2005, 25, 12–15. [Google Scholar] [CrossRef] [Green Version]
  19. van Venrooij, W.J.; Pruijn, G.J. Citrullination: A small change for a protein with great consequences for rheumatoid arthritis. Arthritis Res. 2000, 2, 249–251. [Google Scholar] [CrossRef] [PubMed] [Green Version]
  20. Musse, A.A.; Li, Z.; Ackerley, C.A.; Bienzle, D.; Lei, H.; Poma, R.; Harauz, G.; Moscarello, M.A.; Mastronardi, F.G. Peptidylarginine deiminase 2 (PAD2) over-expression in transgenic mice leads to myelin loss in the central nervous system. Dis. Model. Mech. 2008, 1, 229–240. [Google Scholar] [CrossRef]
  21. Carrillo-Vico, A.; Leech, M.D.; Anderton, S.M. Contribution of myelin autoantigen citrullination to T cell autoaggression in the central nervous system. J. Immunol. 2010, 184, 2839–2846. [Google Scholar] [CrossRef] [Green Version]
  22. Acharya, N.K.; Nagele, E.P.; Han, M.; Coretti, N.J.; DeMarshall, C.; Kosciuk, M.C.; Boulos, P.A.; Nagele, R.G. Neuronal PAD4 expression and protein citrullination: Possible role in production of autoantibodies associated with neurodegenerative disease. J. Autoimmun. 2012, 38, 369–380. [Google Scholar] [CrossRef]
  23. Bien, C.G.; Bauer, J. Autoimmune Epilepsies. Neurotherapeutics 2014, 11, 311–318. [Google Scholar] [CrossRef] [PubMed] [Green Version]
  24. Wang, Y.; Wysocka, J.; Sayegh, J.; Lee, Y.-H.; Perlin, J.R.; Leonelli, L.; Sonbuchner, L.S.; McDonald, C.H.; Cook, R.G.; Dou, Y.; et al. Human PAD4 Regulates Histone Arginine Methylation Levels via Demethylimination. Science 2004, 306, 279–283. [Google Scholar] [CrossRef]
  25. Christophorou, M.A.; Castelo-Branco, G.; Halley-Stott, R.; Oliveira, C.S.; Loos, R.; Radzisheuskaya, A.; Mowen, K.A.; Bertone, P.; Silva, J.C.R.; Zernicka-Goetz, M.; et al. Citrullination regulates pluripotency and histone H1 binding to chromatin. Nat. Cell Biol. 2014, 507, 104–108. [Google Scholar] [CrossRef] [PubMed] [Green Version]
  26. Munson, M.J.; Ganley, I.G. MTOR, PIK3C3, and autophagy: Signaling the beginning from the end. Autophagy 2015, 11, 2375–2376. [Google Scholar] [CrossRef] [PubMed]
  27. Carrard, A.; Salzmann, A.; Perroud, N.; Gafner, J.; Malafosse, A.; Karege, F. Genetic association of the Phosphoinositide-3 kinase in schizophrenia and bipolar disorder and interaction with a BDNF gene polymorphism. Brain Behav. 2011, 1, 119–124. [Google Scholar] [CrossRef]
  28. Inaguma, Y.; Matsumoto, A.; Noda, M.; Tabata, H.; Maeda, A.; Goto, M.; Usui, D.; Jimbo, E.F.; Kikkawa, K.; Ohtsuki, M.; et al. Role of Class III phosphoinositide 3-kinase in the brain development: Possible involvement in specific learning disorders. J. Neurochem. 2016, 139, 245–255. [Google Scholar] [CrossRef] [PubMed]
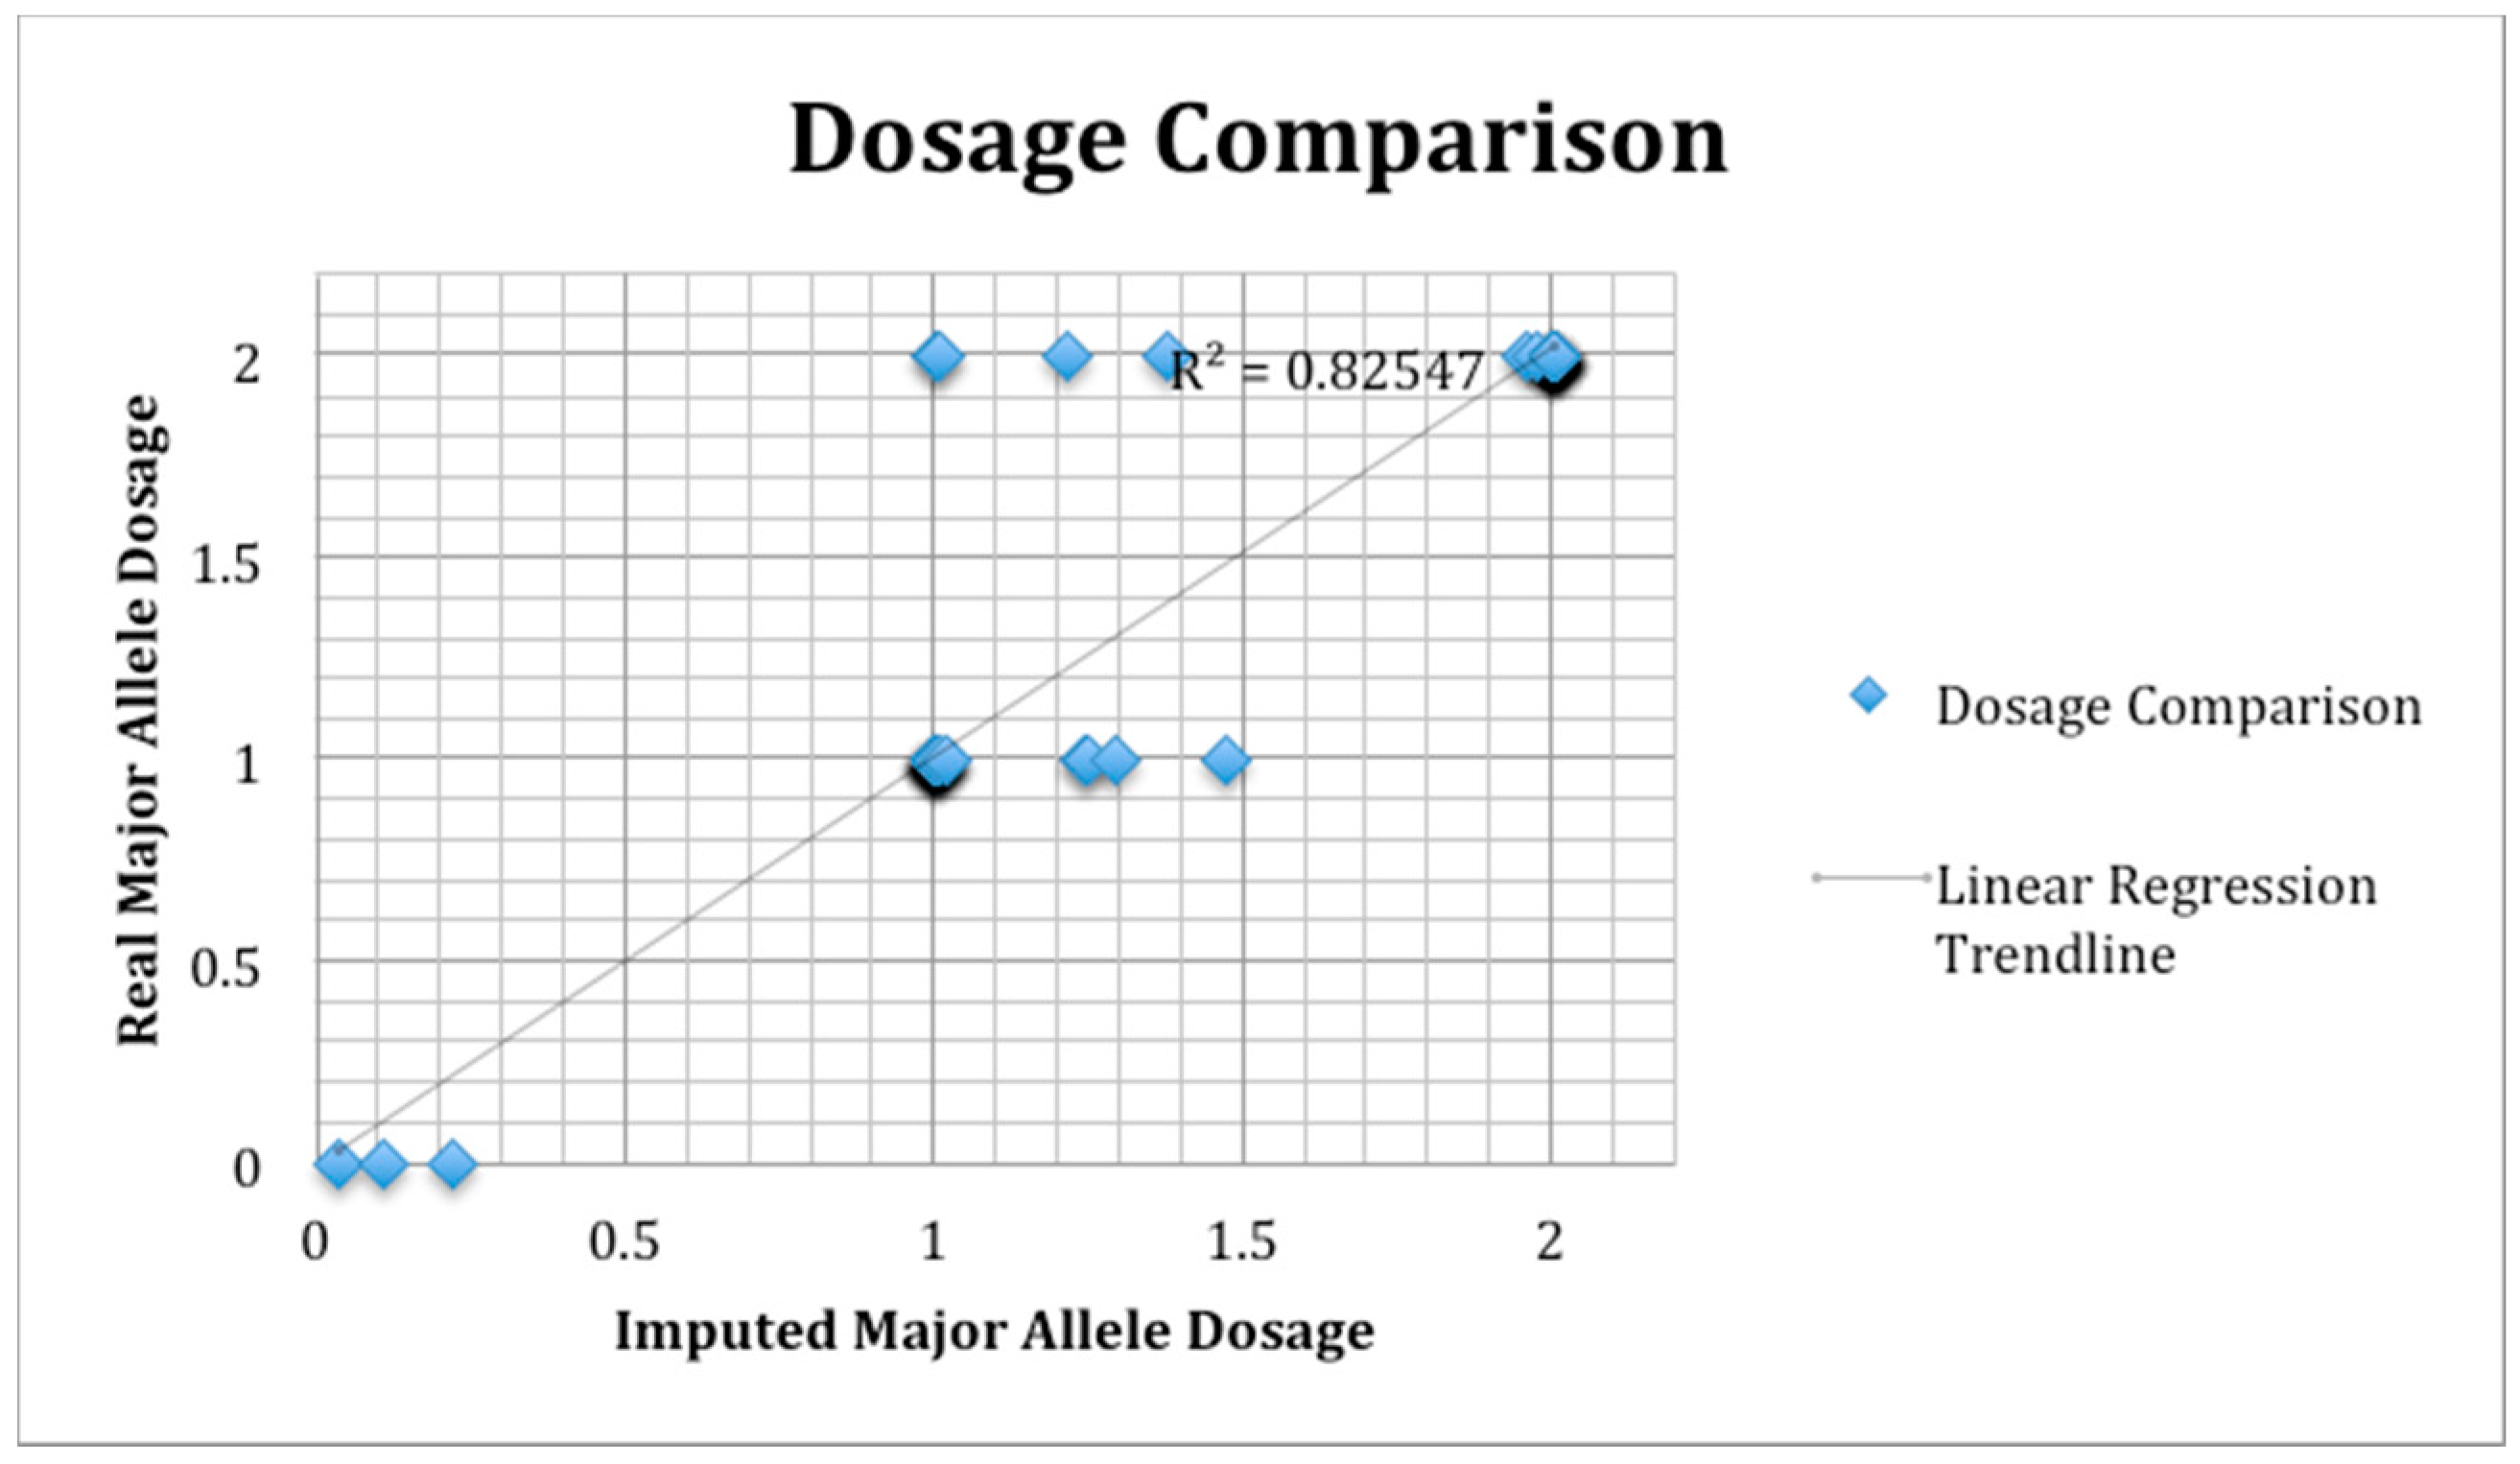
Figure 1. SNP validation by Sanger sequencing. Plot of Sanger sequence minor allele dosage vs. the imputed minor allele dosage. A set of 57 samples (n = 25 cases and n = 32 controls) was chosen for validation using rs36067110 on 1p36.13 as a representative SNP. The overall correlation coefficient of imputed SNP dosage vs. Sanger sequence SNP dosage was 0.826.
Genes 12 01441 g001
Figure 2. METAL Manhattan plot for generalized epilepsy European ancestry. Manhattan plots for the METAL analysis of generalized epilepsy patients of European ancestry. Multiple linked markers in the PADI4-6 locus reached genome-wide statistical significance for patients of European ancestry. No markers reached genome-wide significance in patients of African ancestry (plot not shown).
Genes 12 01441 g002
Figure 3. METAL Manhattan plots for focal epilepsy A. Manhattan plots for the METAL analysis of focal epilepsy patients: (A) patients of European ancestry; (B) patients of African ancestry. Few markers reach levels of statistical significance; however, 12 linked markers in PIKC3 reach levels strongly suggestive of association in the patients of African ancestry (red arrow).
Genes 12 01441 g003
Figure 4. MANTRA Manhattan plots. Manhattan plots for the MANTRA trans-ethnic analysis (A) GE; (B) FE. Note markers in the PADI4-PADI6 locus on 1p36 (above the horizontal line) that reach genome-wide levels of significance in patients with GE. Fewer positive results are observed in the FE cohort; however, two linked markers in RANBP3 reach levels of statistical significance. This gene therefore warrants further study.
Genes 12 01441 g004
Table 1. Epilepsy cohorts.
Cohort 1Cohort 2Cohort 3Cohort 4Cohort 5Cohort 6
PhenotypingPhysician verifiedPhysician verifiedPhysician verifiedPhysician verifiedElectronic Medical RecordElectronic Medical Record
Genotyping Platform550v1, 550v3, 610550v1, 550v3, 610OmniExpressOmniExpress550v1, 550v3, 610550v1, 550v3, 610
RaceEuropean AmericanAfrican AmericanEuropean AmericanAfrican AmericanEuropean AmericanAfrican American
Patient categories/numbers analyzed
All Epilepsy819159483106432221
Focal Epilepsy37892287619155
Generalized Epilepsy44067190445432
Controls573627466829734431784
Table 2. METAL and MANTRA analyses for generalized epilepsy.
METAL
AFRICANEUROPEANMANTRA
SNPCHRp-Valueβp-ValueβBayes FactorGene
rs5928634230.0000050.750.000050.226.39 *near TMEM47
rs5927306230.000005−0.750.00005−0.226.23 *near TMEM47
rs716440491NANA2.93 × 10−8 *−1.496.21 *PADI6 intron
17-7786530217NANA3.98 × 10−8 *1.366.16 *none
rs716440481NANA3.05 × 10−8 *−1.316.15 *PADI6 intron
rs360671101NANA2.86 × 10−8 *1.396.02 *PADI6 intron
rs341996751NANA5.31 × 10−8−1.335.99PADI4 intron
rs348711241NANA5.41 × 10−8−1.335.98PADI4 intron
rs791007671NANA8.12 × 10−81.275.75PADI4 intron
rs716440421NANA5.99 × 10−81.315.73PADI4 intron
rs340182141NANA1.70 × 10−8 *1.425.72PADI4 intron
rs11375574456.22 × 10−8−2.55NANA5.72none
rs79351721228.30 × 10−8−1.76NANA5.71HPS4
rs4609339230.000040.650.000050.225.71near TMEM47
rs352401851NANA7.88 × 10−81.275.70PADI4 syn
4-6406930040.90.027.8 × 10−9−1.974.80near TECRL
* statistically significant for METAL (p ≤ 5 × 10⁻⁸) or MANTRA (Bayes ≥ 6.00). β represents the log of the odds ratio. A positive β is an odds ratio greater than 1 and represents a susceptibility allele. Conversely, a negative β is an odds ratio less than 1 and represents a resistance allele.
Table 3. METAL and MANTRA analyses for focal epilepsy.
METAL
AFRICANEUROPEANMANTRA
SNPCHRp-Valueβp-ValueβBayes FactorGene
rs1255460991.08 × 10−9 *−2.06NANA7.25 *ASS1 intron
19-5961503192.15 × 10−8 *2.25NANA6.30 *RANBP3
X-7353714923NANA2.45 × 10−8 *1.046.29 *MAP2K4P1
rs114591251193.66 × 10−8 *−2.08NANA6.15 *RANBP3
rs5806984823.83 × 10−8 *2.02NANA6.13 *none
18-41994464185.19 × 10−81.68NANA5.99PIKC3
18-42005131186.14 × 10−8−1.67NANA5.95PIKC3
rs116831532185.11 × 10−81.68NANA0.95PIKC3
18-42008808186.97 × 10−81.66NANA5.95PIKC3
rs1249943145.68 × 10−82.30NANA5.94SMARCA5
rs117507875186.33 × 10−8−1.67NANA5.89PIKC3
rs114818774186.93 × 10−8−1.66NANA5.89PIKC3
18-41998414185.48 × 10−8−1.68NANA5.88PIKC3
18-42005556186.20 × 10−8−1.68NANA5.87PIKC3
18-42004210185.07 × 10−8−1.68NANA5.87PIKC3
rs114184892186.55 × 10−8−1.66NANA5.85PIKC3
rs11305551341.27 × 10−72.28NANA5.71SMARCA5
18-41991735185.09 × 10−81.68NANA5.68PIKC3
18-42008321181.24 × 10−71.62NANA5.65PIKC3
X-51313775X4.03 × 10−81.05NANA4.67near NUDT10
* statistically significant for METAL (p ≤ 5 × 10⁻⁸) or MANTRA (Bayes ≥ 6.00). β represents the log of the odds ratio. A positive β is an odds ratio greater than 1 and represents a susceptibility allele. Conversely, a negative β is an odds ratio less than 1 and represents a resistance allele.
Publisher’s Note: MDPI stays neutral with regard to jurisdictional claims in published maps and institutional affiliations.