Article

Molecular Evolution and Inheritance Pattern of Sox Gene Family among Bovidae

by
Mabel O. Akinyemi
1,
Jessica Finucan
1,
Anastasia Grytsay
2,
Osamede H. Osaiyuwu
3,
Muyiwa S. Adegbaju
4,
Ibukun M. Ogunade
5,
Bolaji N. Thomas
6,
Sunday O. Peters
7 and
Olanrewaju B. Morenikeji
2,*
1
Department of Biological Sciences, Fairleigh Dickinson University, Madison, NJ 07940, USA
2
Division of Biological and Health Sciences, University of Pittsburgh, Bradford, PA 16701, USA
3
Department of Animal Science, Faculty of Agriculture, University of Ibadan, Ibadan 200005, Nigeria
4
Institute for Plant Biotechnology, Stellenbosch University, Stellenbosch 7600, South Africa
5
Division of Animal and Nutritional Science, West Virginia University, Morgantown, WV 26505, USA
6
Department of Biomedical Sciences, Rochester Institute of Technology, Rochester, NY 14623, USA
7
Department of Animal Science, Berry College, Mount Berry, GA 30149, USA
*
Author to whom correspondence should be addressed.
Genes 2022, 13(10), 1783; https://doi.org/10.3390/genes13101783
Submission received: 5 September 2022 / Revised: 21 September 2022 / Accepted: 28 September 2022 / Published: 2 October 2022
(This article belongs to the Section Animal Genetics and Genomics)

Abstract

:
Sox genes are an evolutionarily conserved family of transcription factors that play important roles in cellular differentiation and numerous complex developmental processes. In vertebrates, Sox proteins are required for cell fate decisions, morphogenesis, and the control of self-renewal in embryonic and adult stem cells. The Sox gene family has been well-studied in multiple species including humans but there has been scanty or no research into Bovidae. In this study, we conducted a detailed evolutionary analysis of this gene family in Bovidae, including their physicochemical properties, biological functions, and patterns of inheritance. We performed a genome-wide cataloguing procedure to explore the Sox gene family using multiple bioinformatics tools. Our analysis revealed a significant inheritance pattern including conserved motifs that are critical to the ability of Sox proteins to interact with the regulatory regions of target genes and orchestrate multiple developmental and physiological processes. Importantly, we report an important conserved motif, EFDQYL/ELDQYL, found in the SoxE and SoxF groups but not in other Sox groups. Further analysis revealed that this motif sequence accounts for the binding and transactivation potential of Sox proteins. The degree of protein–protein interaction showed significant interactions among Sox genes and related genes implicated in embryonic development and the regulation of cell differentiation. We conclude that the Sox gene family uniquely evolved in Bovidae, with a few exhibiting important motifs that drive several developmental and physiological processes.

1. Introduction

The Sox genes belong to a large group of genes whose DNA binding domain is called a high mobility group (HMG), encoding diverse and well-conserved transcription factors, and consisting of 20 genes in vertebrates and only a handful in invertebrates [1,2]. Sox genes share homology with the HMG box of the sex-determining region Y (Sry) gene, a founding member of the Sox gene family, which is required to specify the male phenotype. This group of genes owes their acronym to sharing 46% or more identity to the Sry gene in the HMG box [3].
Vertebrate Sox genes have been divided into eight groups (A–H) based on conserved protein domains and similarity in their amino acid sequences [2,4]. Members of the same group are highly similar to each other within and outside the HMG box, while those of different groups share a lower degree of identity in the HMG box and no significant identity outside the domain [3]. Most members of this group are scattered throughout the genome, with the exception of Sry and Sox3, which are located on sex chromosomes [2].
Sox proteins control transcription in several ways; for example, the protein domain connects the minor groove of DNA to AACAAAG, AACAAT, and related sequences and induces a sharp bend in DNA, thereby allowing the protein to play an important structural role in the assembly of transcription enhancer complexes [3]. They exhibit their structural role by shaping the regulatory regions and establishing physical contacts between transcription factors bound to the same target gene promoter or enhancer [2]. Thus, the regulatory functions of Sox proteins require the cooperation of interacting partners that bind DNA and enable the specific selection of target genes. This type of cooperation is dynamic, allowing Sox proteins to regulate different events by changing partner factors—a key factor that drives the progression of developmental processes [5].
All Sox genes have a specific expression pattern and mostly play important roles in the determination of cells fate and the differentiation of cells into specific lineages, such as embryonic stem cells, neuronal and glial cells, Sertoli cells, chondrocytes, etc. [3]. They have also been shown to be capable of reprogramming differentiated somatic cells into pluripotent stem cells [6,7], activating genes that are important for maintaining the pluripotent cell state [8], and inducing the delta crystallin gene in the lens [9].
The functions of the members of the Sox B1 (Sox) family overlap, although each has a function during the migration of neuronal precursors in the ganglionic eminence [10]. Sox2 and Sox3 deficiency cause pituitary defects [11]. Single knockouts of Sox5 or Sox6 in mice lead to some skeletal abnormalities, and a Sox5 and Sox6 double knockout leads to a lack of chondrogenesis [12]. Mutations in Sox18 induce severe cardiovascular and hair follicle defects including lymphatic dysfunction in developing embryos [13,14]. Whereas mutational disruptions in Sox9 lead to the failure of sertotic placode invagination [15]. Members of the SoxF subfamily exhibit overlapping functions [16] and are expressed in endothelial cells, while their mutation has been reported in lymphatic defects [17]. Kamai-Azuma et al. [18] also reported defects in gut tube formation in Sox17 knockout mice. Members of the SoxC subfamily (Sox4, 11, and 12) are expressed in neural and mesenchymal progenitor cells. Mutations in these subfamilies lead to the malformation of various organs. Sox4 and Sox11 knockout mice exhibit multiple organ defects [19]. Several studies aimed at discovering more Sox protein functions have been impaired by extensive functional redundancy among members of the same group and pleiotropy [14].
The Bovidae family includes several economically and socially important ruminant species such as cattle, sheep, goats, and antelope, comprising more than 140 recognized species distributed among 49 genera. The evolution of the different members of this family has been molded by several mechanisms including temperature adaptations, feeding ecology, vegetation physiognomy, climate fluctuations, immigration, adaptive radiations, and mass extinctions [20]. There are published reports examining the evolutionary history of Bovidae through morphological data, allozymes, serum immunology, DNA sequences, and mitochondrial DNA analyses [21]. Protein and DNA-based sequence methods utilize sequence variations and the analysis of conserved domains, in addition to computational methods utilizing genetic variation within and between amino acid sequences to predict functional and structural outcomes [22,23,24,25].
Most computational analyses on Sox genes have focused on individual genes and their regulatory functions rather than the entire gene family. Despite the abundance of information on the importance of Sox proteins in various developmental processes in other species, we found no published report on the Sox gene family in Bovidae. Taking this into consideration along with the fact that Sox genes are significant players in the regulation of developmental processes, we examined the evolutionary dynamics of the Sox gene family within Bovidae by evaluating their biochemical properties, structural prediction, conserved domains, protein–protein interaction, and phylogenetic relationships.

2. Materials and Methods

2.1. Sequence Retrieval and Multiple Sequence Alignment

Sox gene sequences of the Bovidae family, namely, Bos taurus (Cattle), Bos grunniens (Domestic Yak), Bison bison (Bison), Capra hircus (Goat), Ovis aries (Sheep), Bubalus bubalis (Buffalo), Bos mutus (Wild Yak), and Antilocapra americana (Antelope) species, were employed for comparative analysis. All sequences were retrieved in the FASTA format from the National Centre for Biotechnology Information (NCBI) database (https://www.ncbi.nlm.nih.gov accessed on 10 April 2022). The Bos sp. accession numbers are as follows: SoxA (ABY19364.1), SoxB (XP_005214070.1, NP_001098933.1, XP_027390716.1), SoxB2(NP_001157253.1,XP_024855919.1}, SoxC (NP_001071596.1,XP_024855327.1,XP_010809935.2), SoxD (AAI14659.1,XP_027419183.1, XP_027419995.1) SoxE (XP_002698019.3,XP_027374751.1, XP_027396627.1), SoxF (XP_027404803.1, XP_027416795.1, XP_027415027.1), SoxG (XP_027374313.1), and SoxH (XP_027401619). The total number of Sox genes, categories, and abundance of each subfamily were collated for further analysis.
Sequence alignment was performed using the ClustalW algorithm on the MEGAX software [26]. The alignment was imported to itol for phylogenetic tree construction using Maximum Likelihood Tree method, as described in [27]. Thereafter, MEME (Multiple Em for Motif Elicitation http://alternate.meme-suite.org accessed on 12 June 2022) version 5.0.2 [28] was used to predict the conserved motif structures encoded across all Bos Sox genes. All sequences were scanned for the presence of the sequence motif RPMNAFMVW, which has been reported to be conserved for all Sox sequences other than Sry and only sequences that have the motif were included in further analysis. We used Multalin software (http://multalin.toulouse.inra.fr/multalin accessed on 24 April 2022) to identify the conserved amino acid sequences among the species. The sequence logo of the identified domain in the Sox protein family was constructed with WebLogo (http://weblogo.berkeley.edu/logo.cgi, accessed on 24 April 2022).

2.2. Physicochemical Characterization of Sox Gene Family

To decipher the physicochemical properties of Sox gene family in Bovidae, we used Expasy ProtParam server (https://web.expasy.org/protparam accessed on 21 June 2022) to compute the molecular weight, isoelectric point (pI), instability index, aliphatic index, and grand average of hydropathicity (GRAVY) of all the proteins in the Bovidae Sox family, as previously described [23]. The chromosomal location of each Sox gene was retrieved from Unitprot/KB/Swiss-Prot database in NCBI (https://www.ncbi.nlm.nih.gov accessed on 10 April 2022).

2.3. Identification of Interacting Proteins, Functional Enrichment, and Pathway Analysis

Protein–protein interactions were predicted using the Search Tool for the Retrieval of Interacting Genes database (STRING https://stringdb.org accessed on 7 June 2022). This is important to elucidate the association of Sox proteins with other molecules. Functional enrichment analysis was performed with PANTHER (http://www.pantherdb.org accessed on 5 June 2022) [29] and Database for Annotation, Visualization, and Integrated Discovery (DAVID) to classify the genes according to their function, annotated with ontology terms: biological processes, cellular components, and molecular functions of the studied genes.

2.4. Evolutionary Phylogenetic Analysis of Sox Gene Family

To study the evolutionary pattern and inheritance of Sox genes in Bos sp., a multiple sequence alignment was performed using ClustalW tool in MEGA11 [26] with default parameters; all positions containing gaps and missing data were eliminated. The phylogenetic trees of Sox gene family in Bos sp. were constructed by adopting the Neighbor-joining method of MEGA11 software with the following parameters: Poisson correction, pairwise deletion, and 1000 bootstrap replicates. The constructed tree files were visualized using itol (Interactive Tree of Life, https://itol.embl.de accessed on 3 June 2022).

3. Results

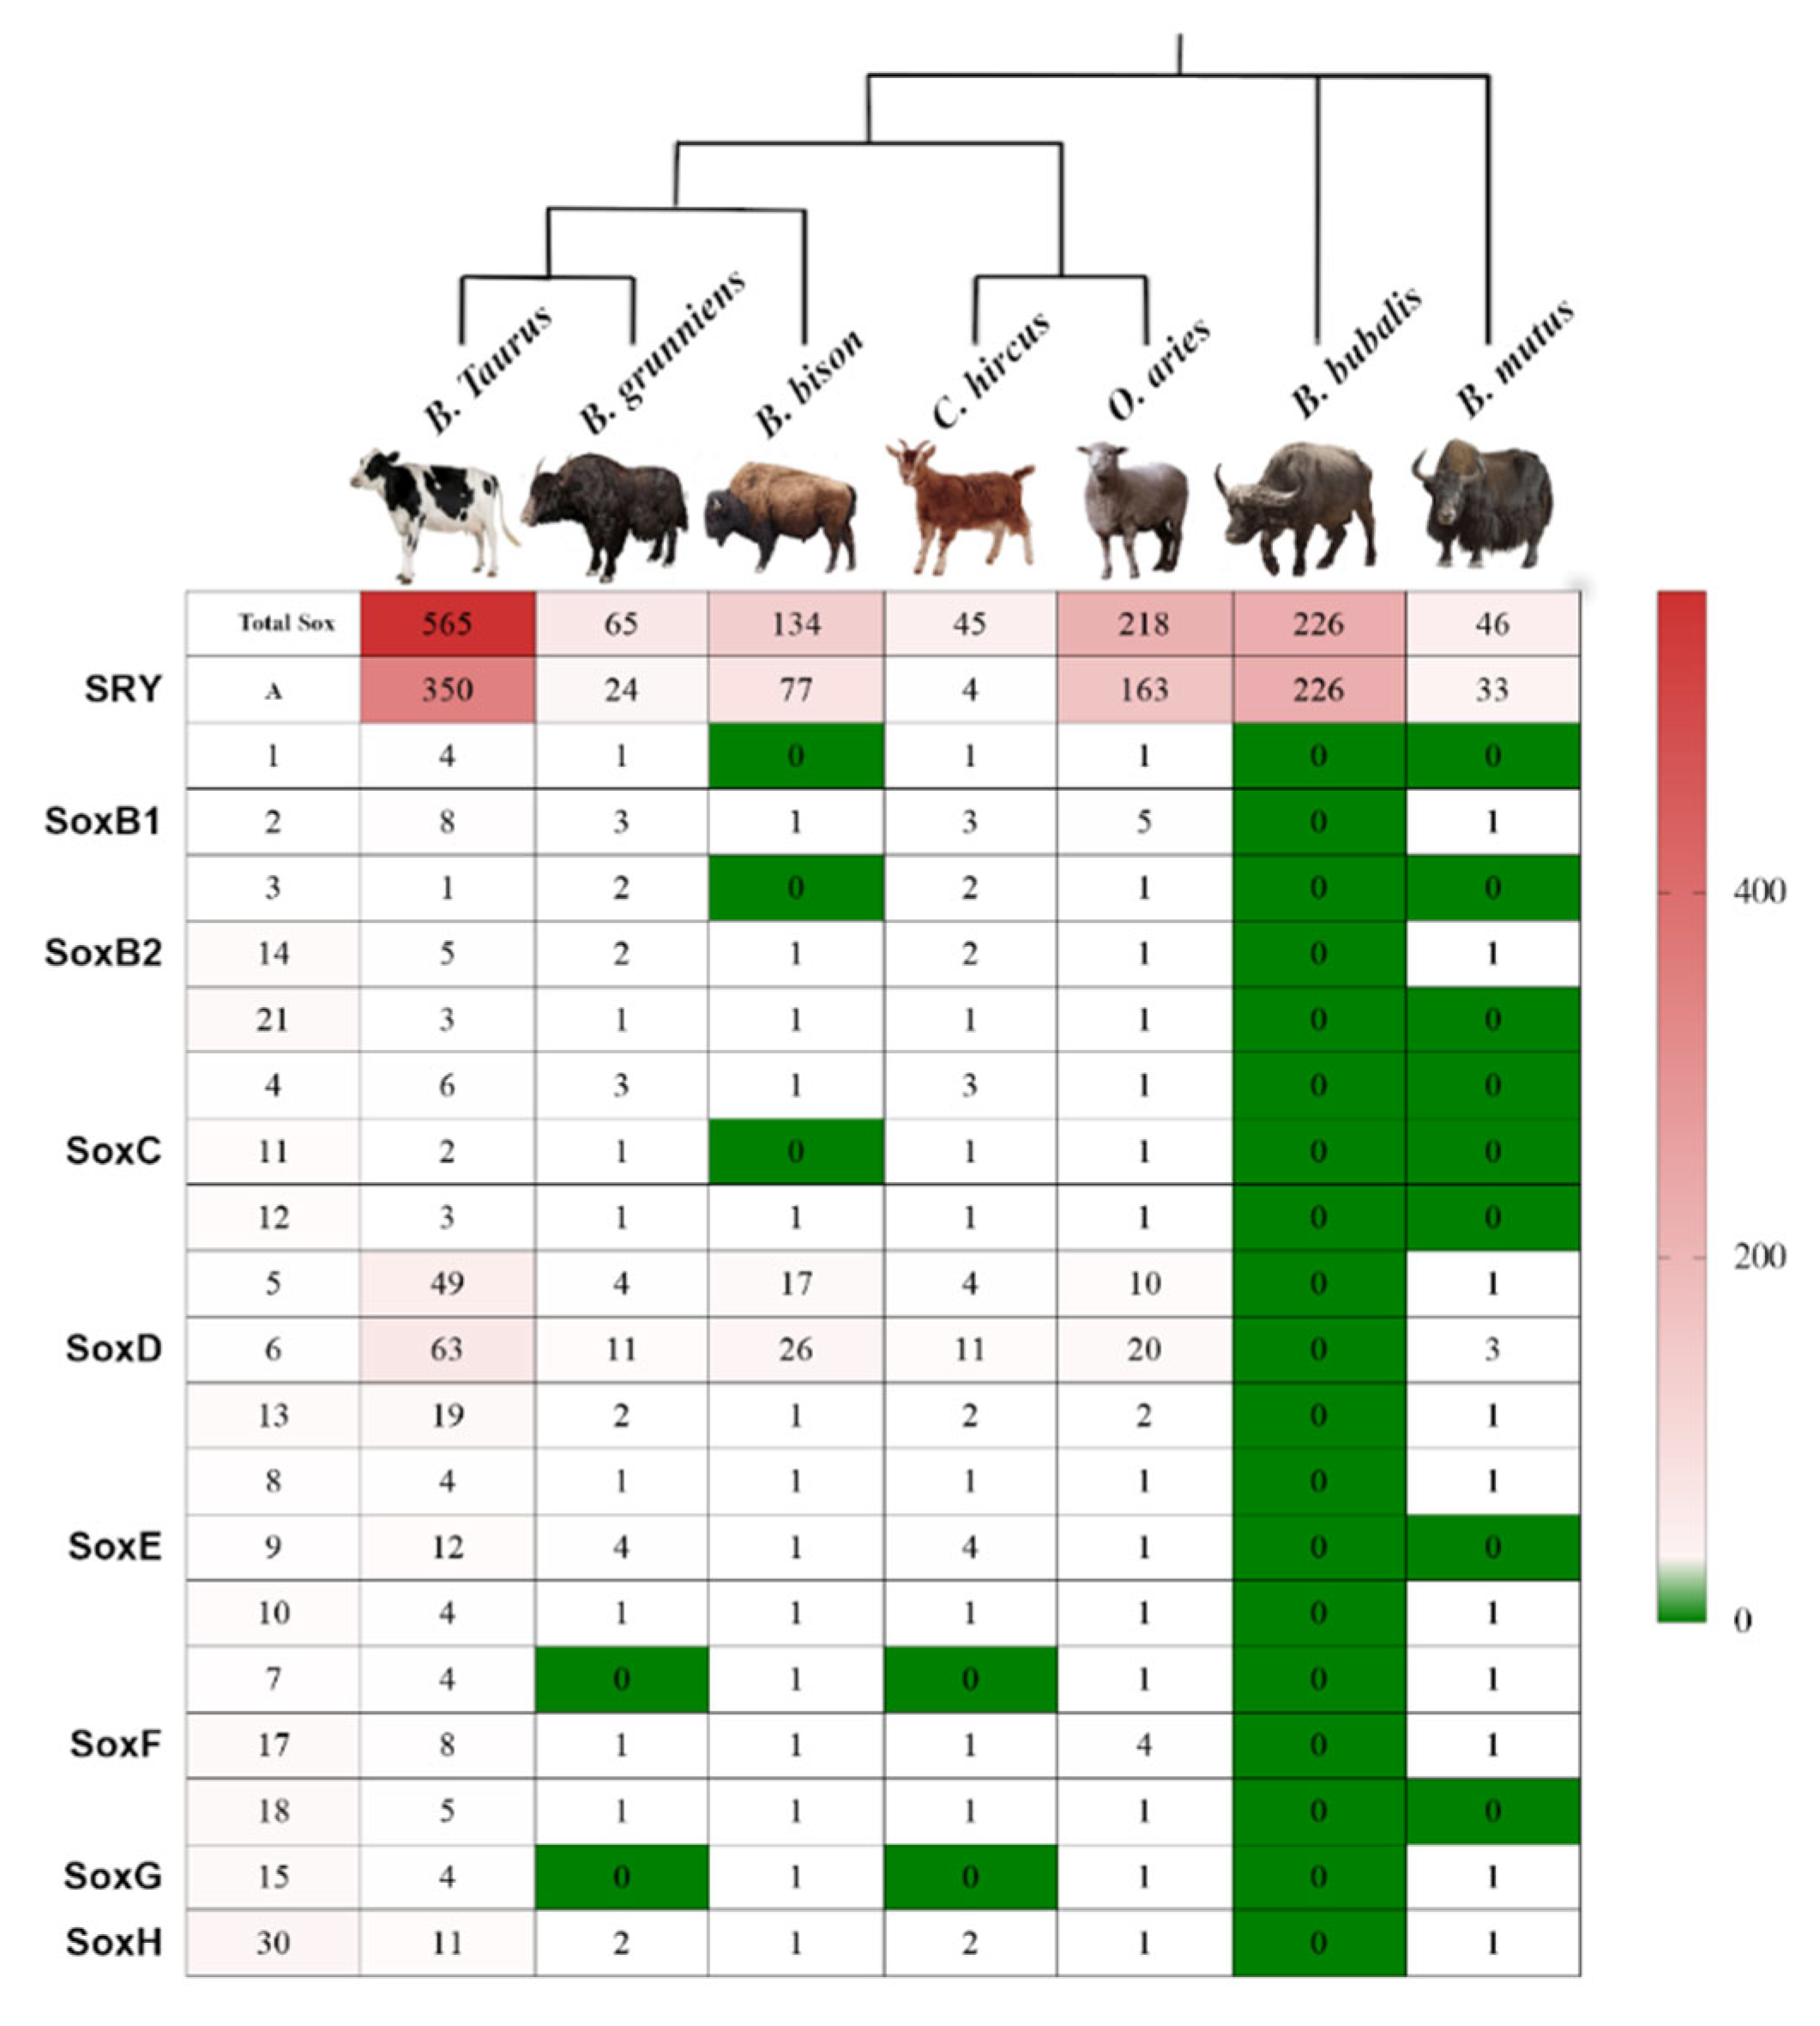
3.1. Genome Wide Analysis of Sox Genes in Bovidae

A total of 350 variants of SRY, 49 variants of Sox5, and 63 variants of Sox 6 were reported in B. taurus (Figure 1). Bos mutus has 33 variants of SoxA and 3 variants of Sox 6. The water buffalo (B. bubalis) has 226 variants of SoxA and 34 variants of Sox6, while 24 variants of SoxA were reported for Yaks. Sheep (O. aries) have 163 variants of SoxA and 20 variants of Sox6 while goats (C. hircus) presented with 4 variants of SoxA and 11 variants of Sox6. B. bison has 77 variants of SoxA and 26 variants of Sox6. There was no record of Sox variants for antelopes.

3.2. Physicochemical Properties of Sox Genes

Our analysis of the physicochemical properties revealed that Sox15 had the lowest molecular weight of 25,140 Da, while the SoxD family [5,6,13] had the highest molecular weight values (Table 1). The pI is the pH at which a particular molecule carries no net electric charge; this value is useful for understanding protein charge stability. Overall, the pI ranged from 4.95 to 9.85 (Table 1). The results for the instability index reveal that the genes were all unstable (II > 40), with the lowest value of 41.96 in Sox1 and the highest of 80.78 in Sox9. The aliphatic index, regarded as the factor determining the thermostability of globular proteins, was lowest in Sox1 (44.44) and highest in Sox13 (71.88). A high extinction coefficient and low negative GRAVY values were also observed.

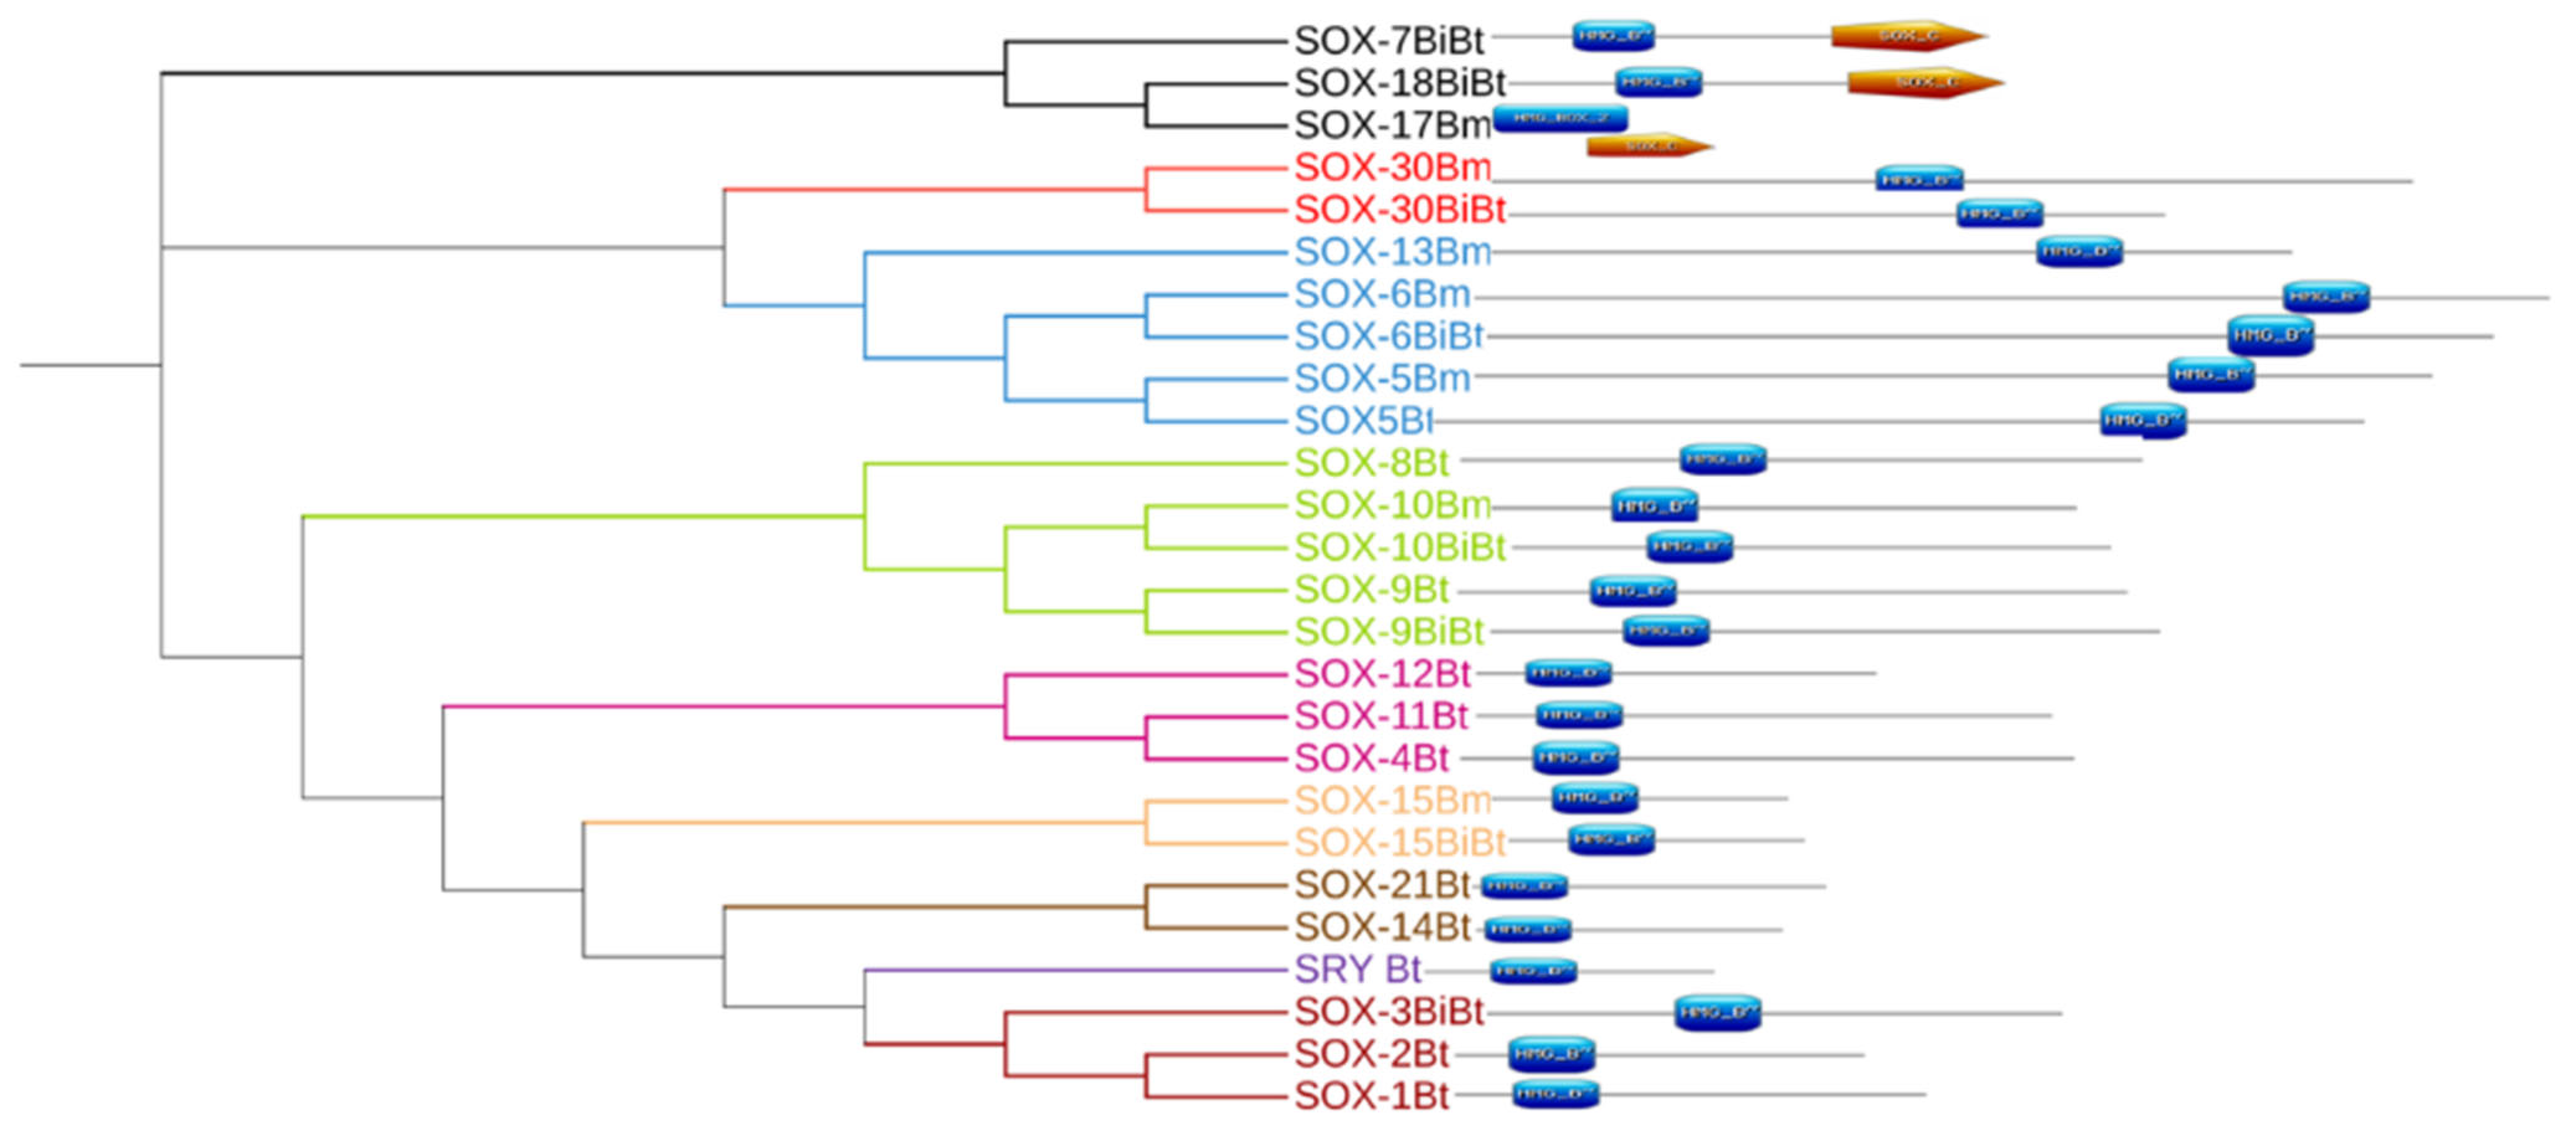
3.3. Evolutionary Dynamics and Phylogenetic Analysis

Furthermore, this study examined the evolutionary pattern of 31 Sox sequences of the Bos sp. The multiple sequence alignment indicated that Lysine (K), Proline (P), Arginine R), Glycine (G), and Leucine (L) are conserved in the Sox family (Figure 2). The sequences demonstrated significant variability in both percentage identity and similarity in Bos despite their common evolutionary origin. The analysis of the percentage identity and similarity revealed that Sox14 and 21 (71.73%) were highly similar while Sox7 and 30 exhibited the lowest similarity (15.17%) (Table 2 and Supplementary Table S1)
Using the distance-based method, we examined the phylogenetic relationships among the Bos Sox sequences. A phylogenetic tree based on the alignment showed that the Sox proteins are segregated into nine specific groups: A (SRY), B1 (Sox1, 2, and 3), B2 (Sox14 and 21), C (Sox4, 11, and 12), D (Sox5, 6, and 13), E (Sox8, 9, and 10), F (Sox7, 17, and 18), and Sox15 and 30 are the sole members of Groups G and H, respectively (Figure 3a). The branch lengths, representative of the extent of divergence, suggest a monophyletic arrangement, with SoxB1 diverging first. The result is further represented in an unrooted tree, with the expected clustering pattern observed for all groups (Figure 3b). Figure 4 shows the MSA of the homology of the HMG domain across the Sox genes showing that Lysine (K), Proline (P), Glutamate (E), Arginine (R), and Leucine (L) are 100% conserved in this region. The sequence logo showing the relative frequencies of each of the conserved domains and their respective positions is displayed (Figure 5).

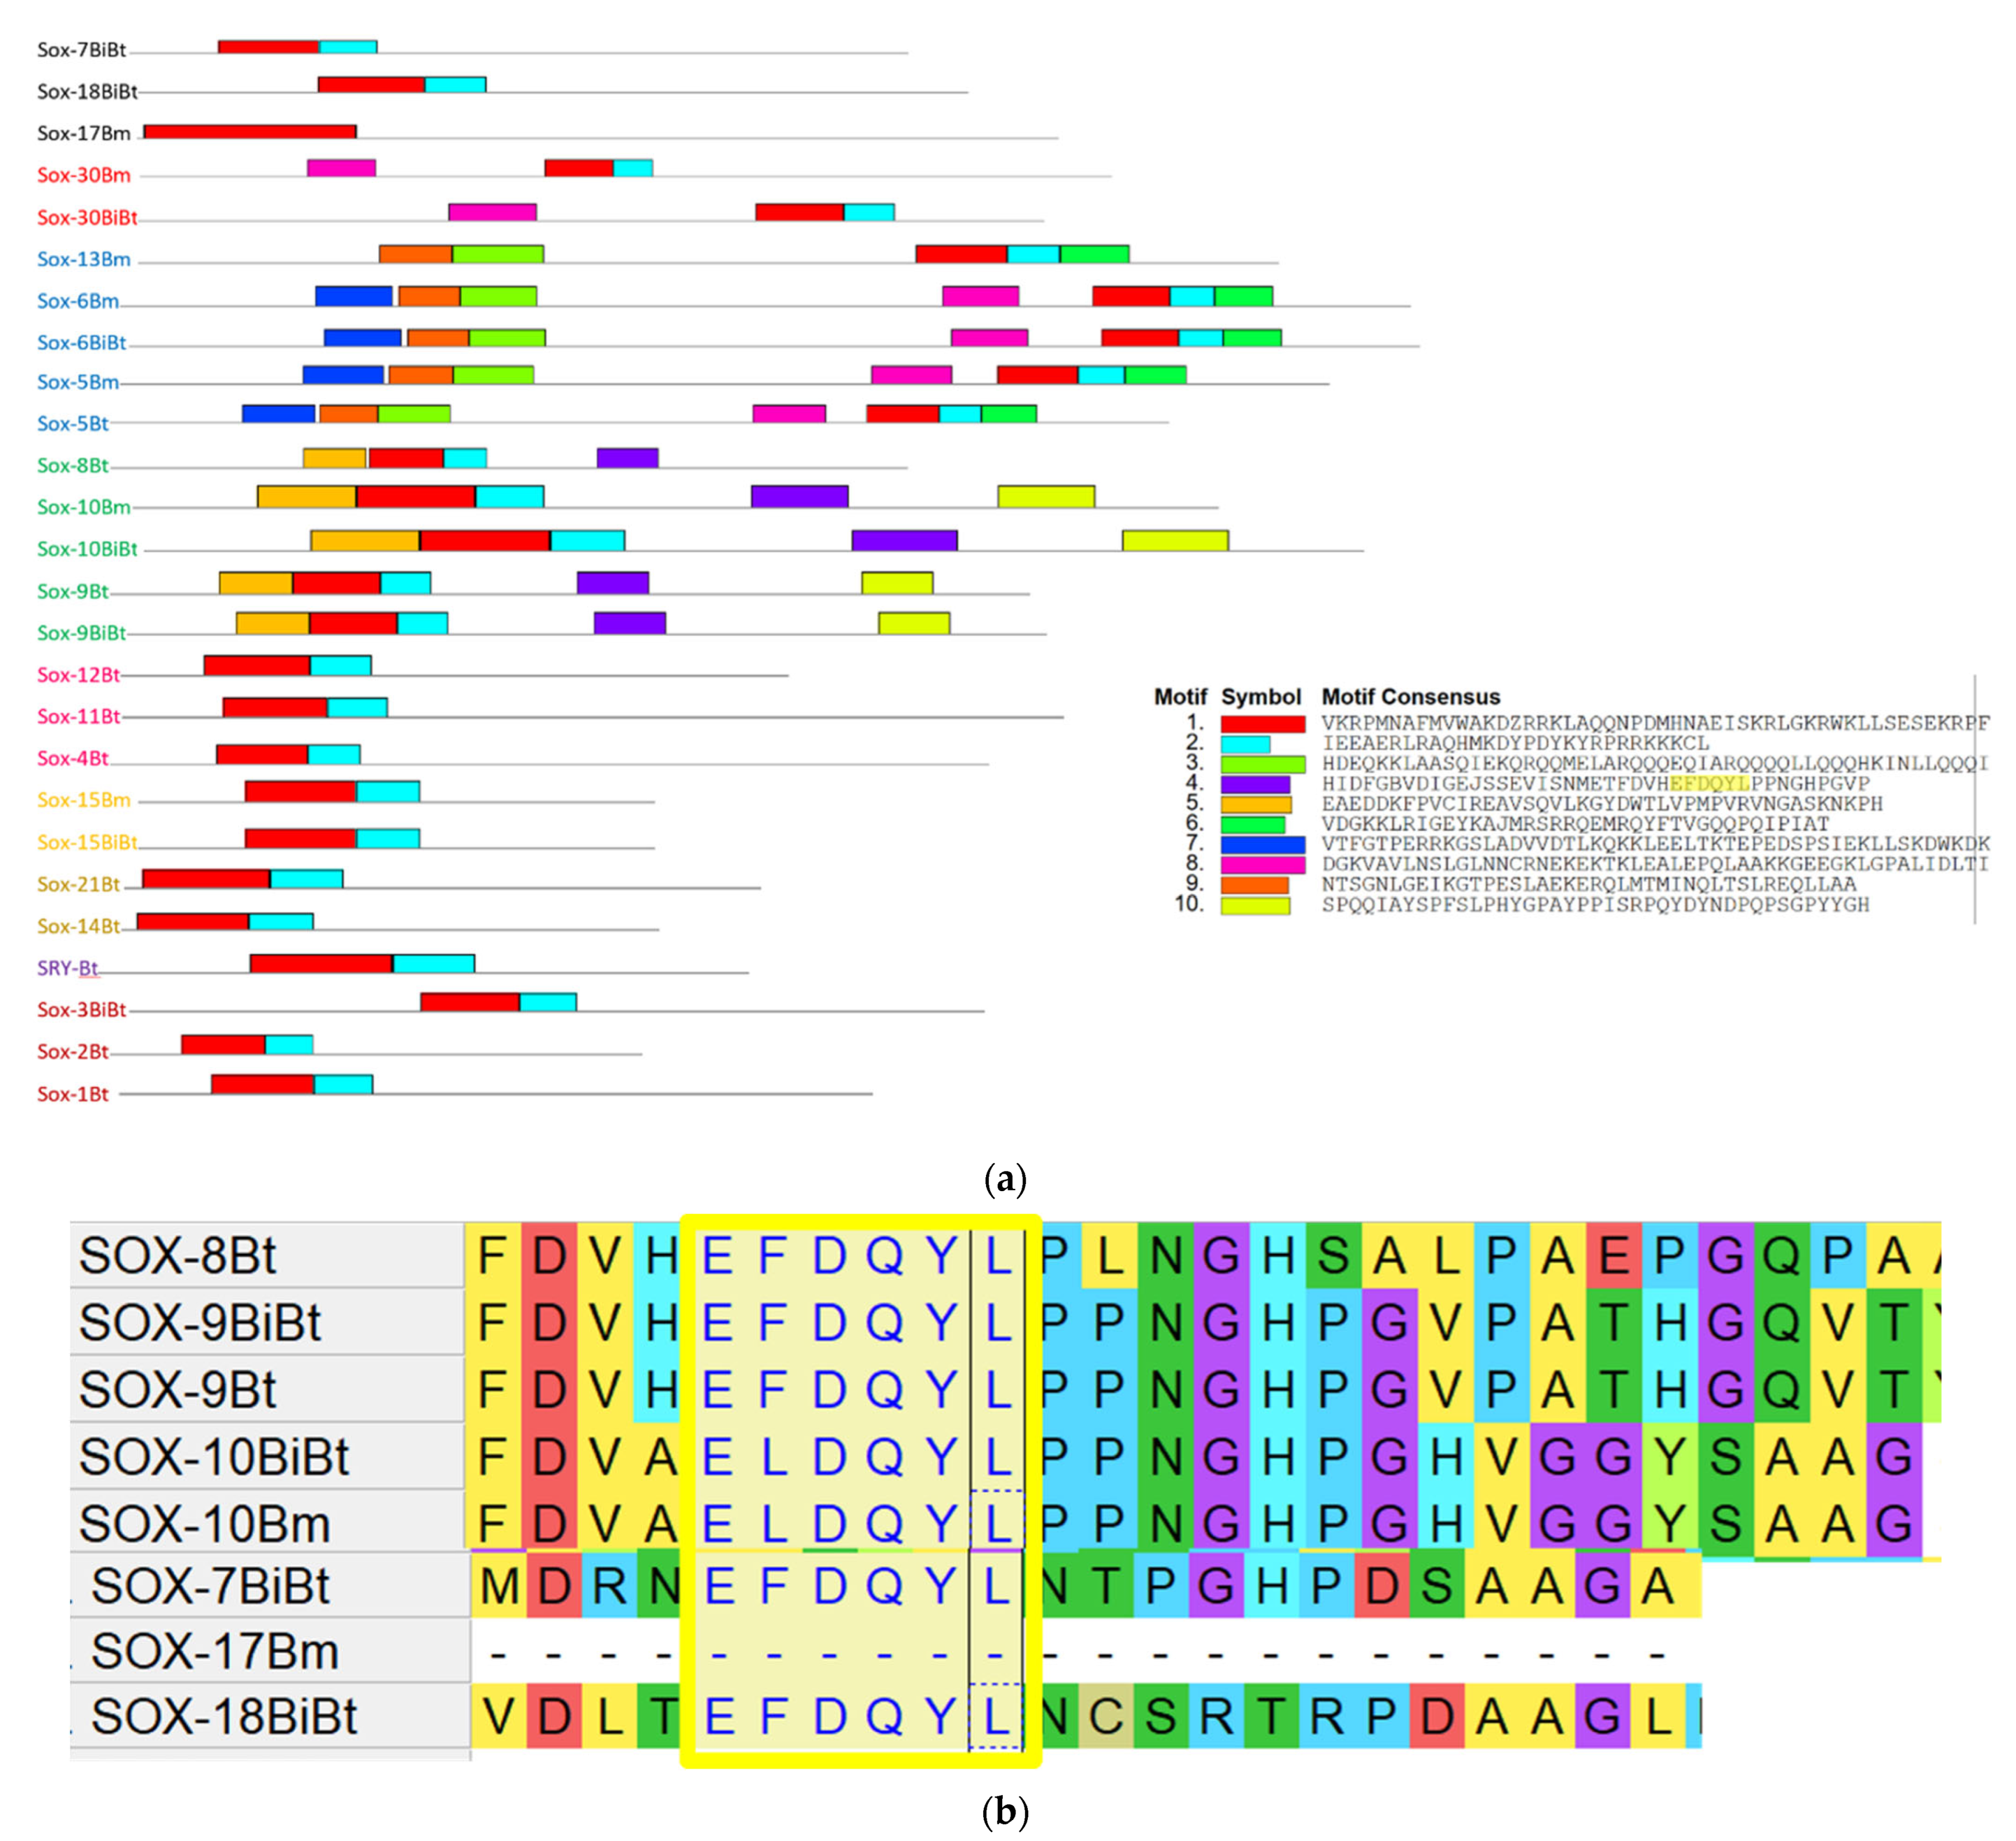
3.4. Conserved Motif Analysis of Sox Genes

To further characterize the evolutionary pattern of the Sox gene in the Bos species, a conserved motif analysis was performed using the MEME and MEGA programs. The results indicate that 10 conserved motifs are present in the Bos species. Interestingly, we found that conserved motifs 1 and 2 (M1 and M2) exist in all members of the Sox family except Sox17, which had motif 1 only. The other nine motifs were present in the different Sox groups. M1 and M2 are the core HMG boxes, containing 79 amino acid residues. As shown, five motifs are present in SoxD—sox13 and SoxE:Sox9 and 10, and seven motifs in SoxD:Sox5 (Figure 6a). Four motifs exist in SoxE:Sox8 and three motifs in SoxH:Sox30. Interestingly, we found an importantly conserved motif, namely, EFDQYL/ELDQYL, in both SoxE and F including Sox 7–10 and 18 with the exception of Sox 17 (Figure 6b). This motif is crucial for the transactivation and regulation of these protein family and has also been observed in humans.

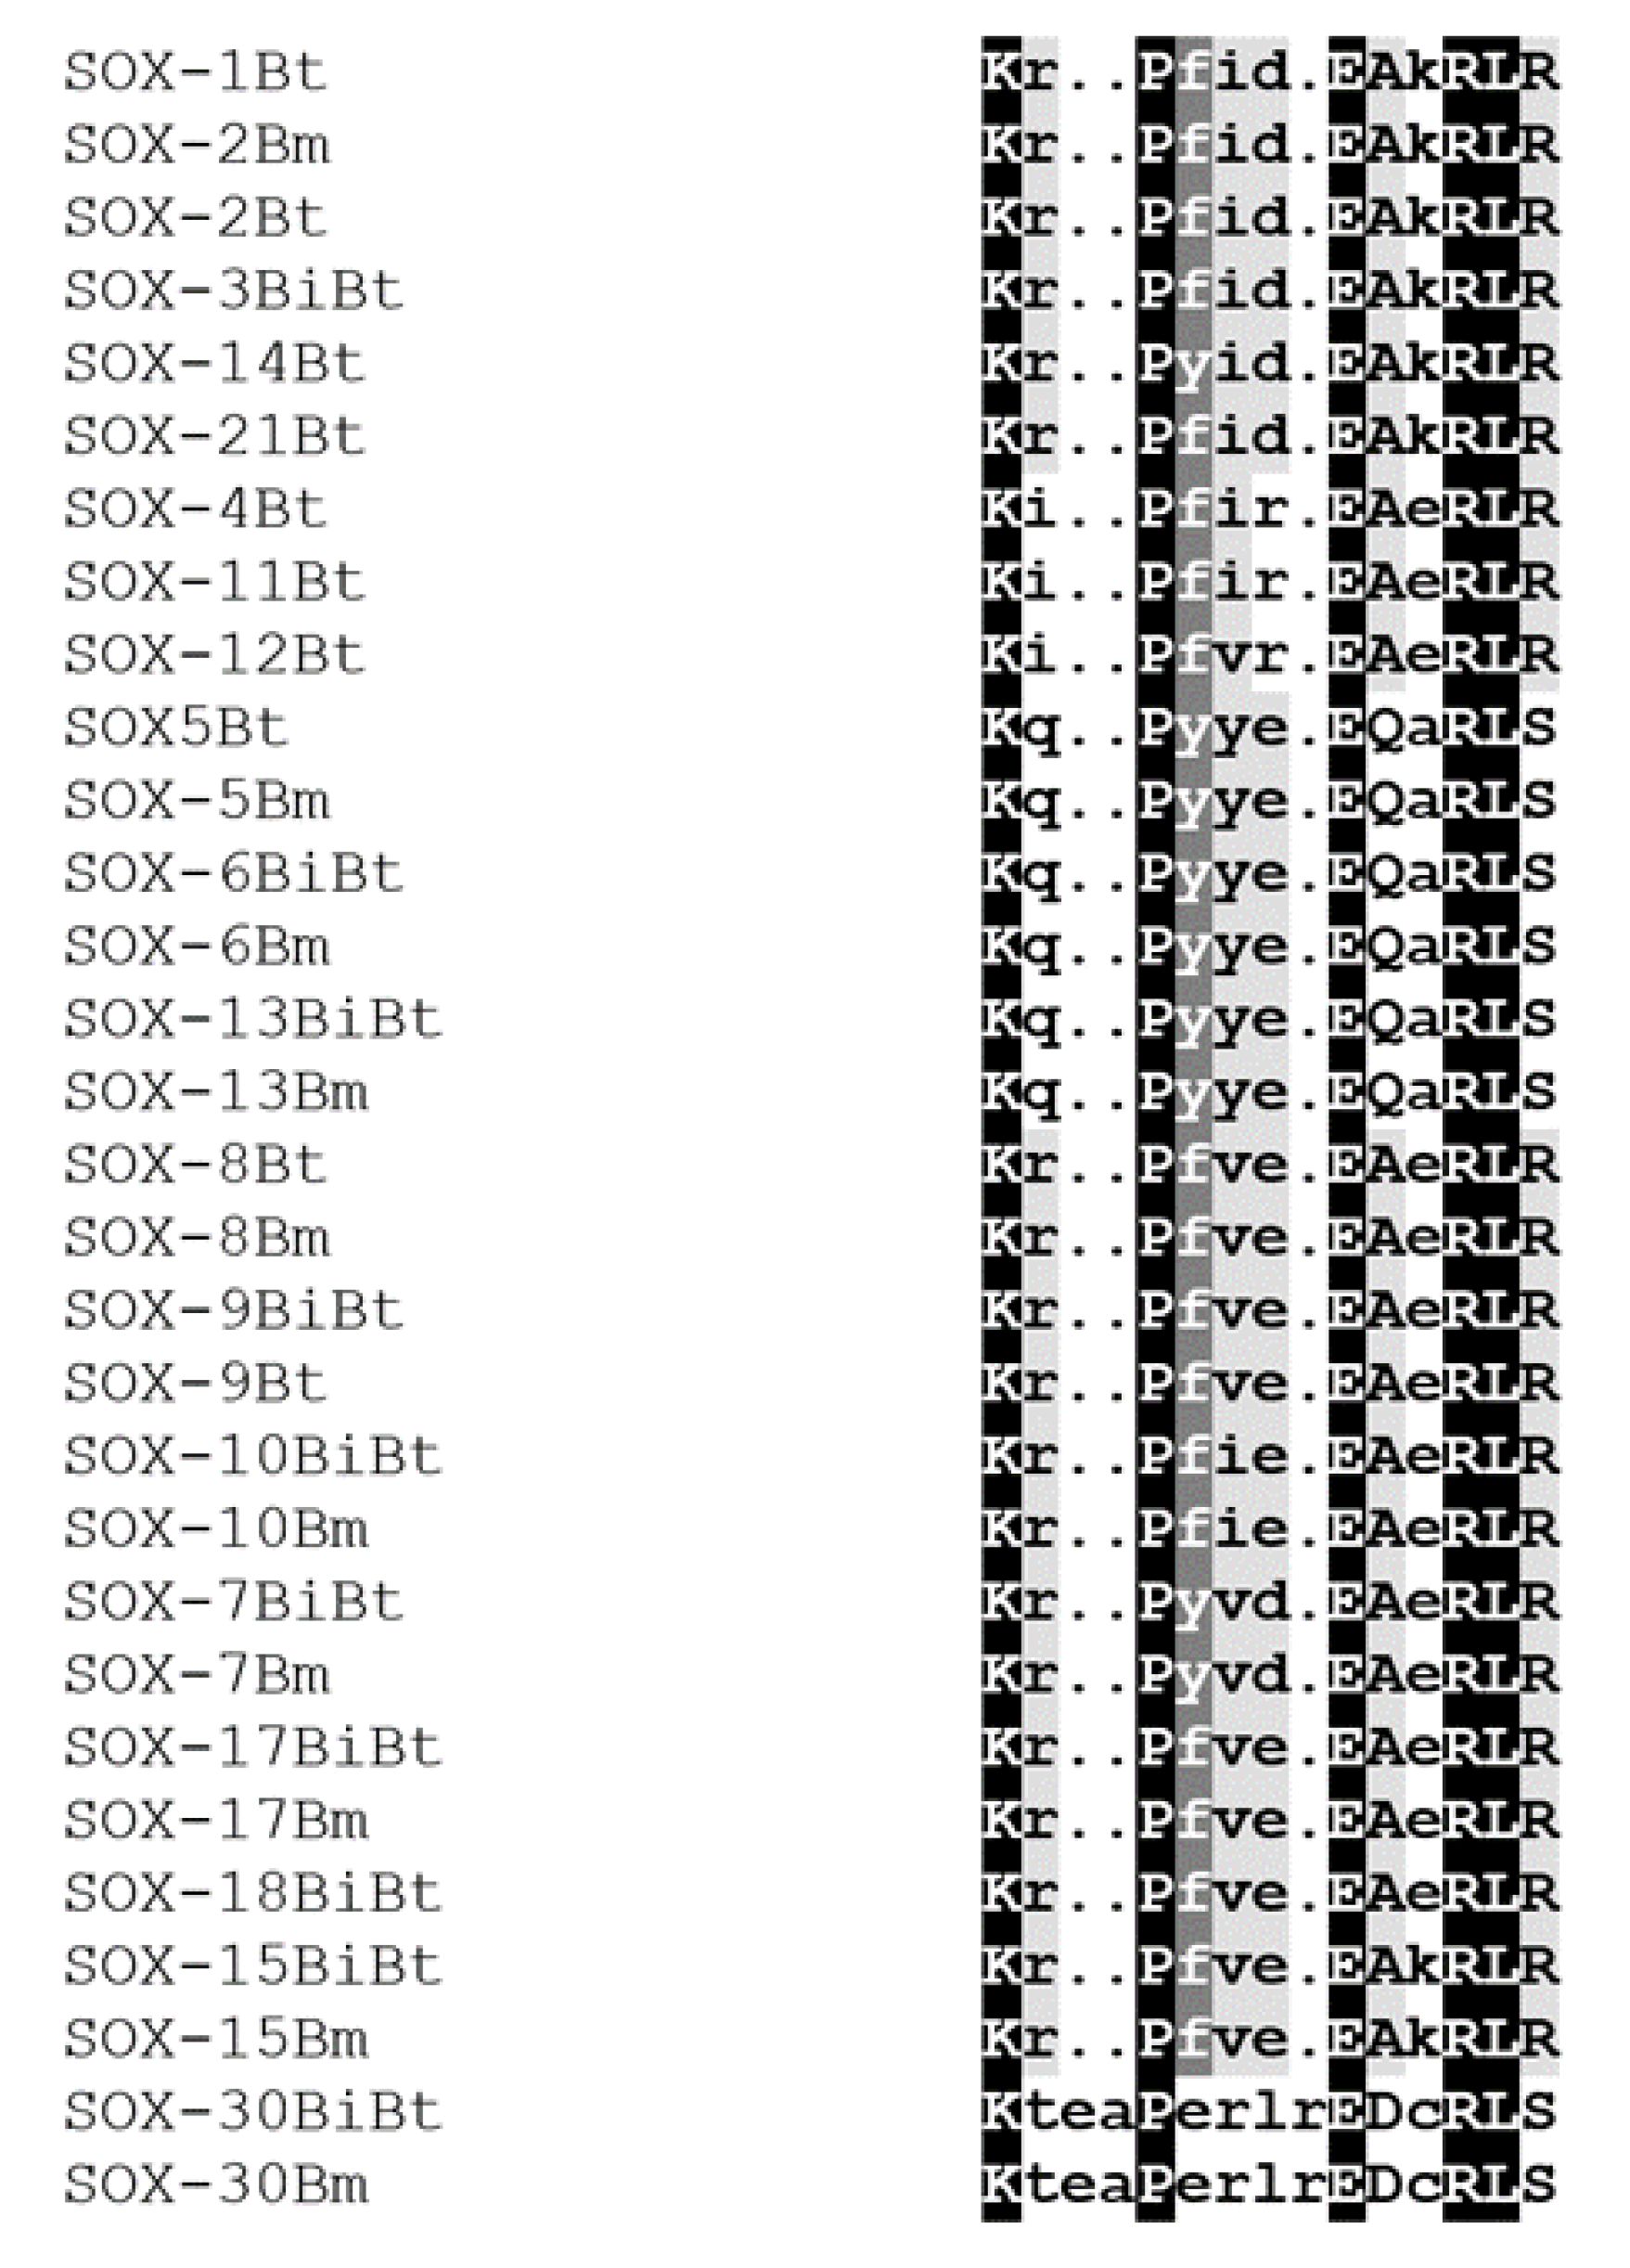
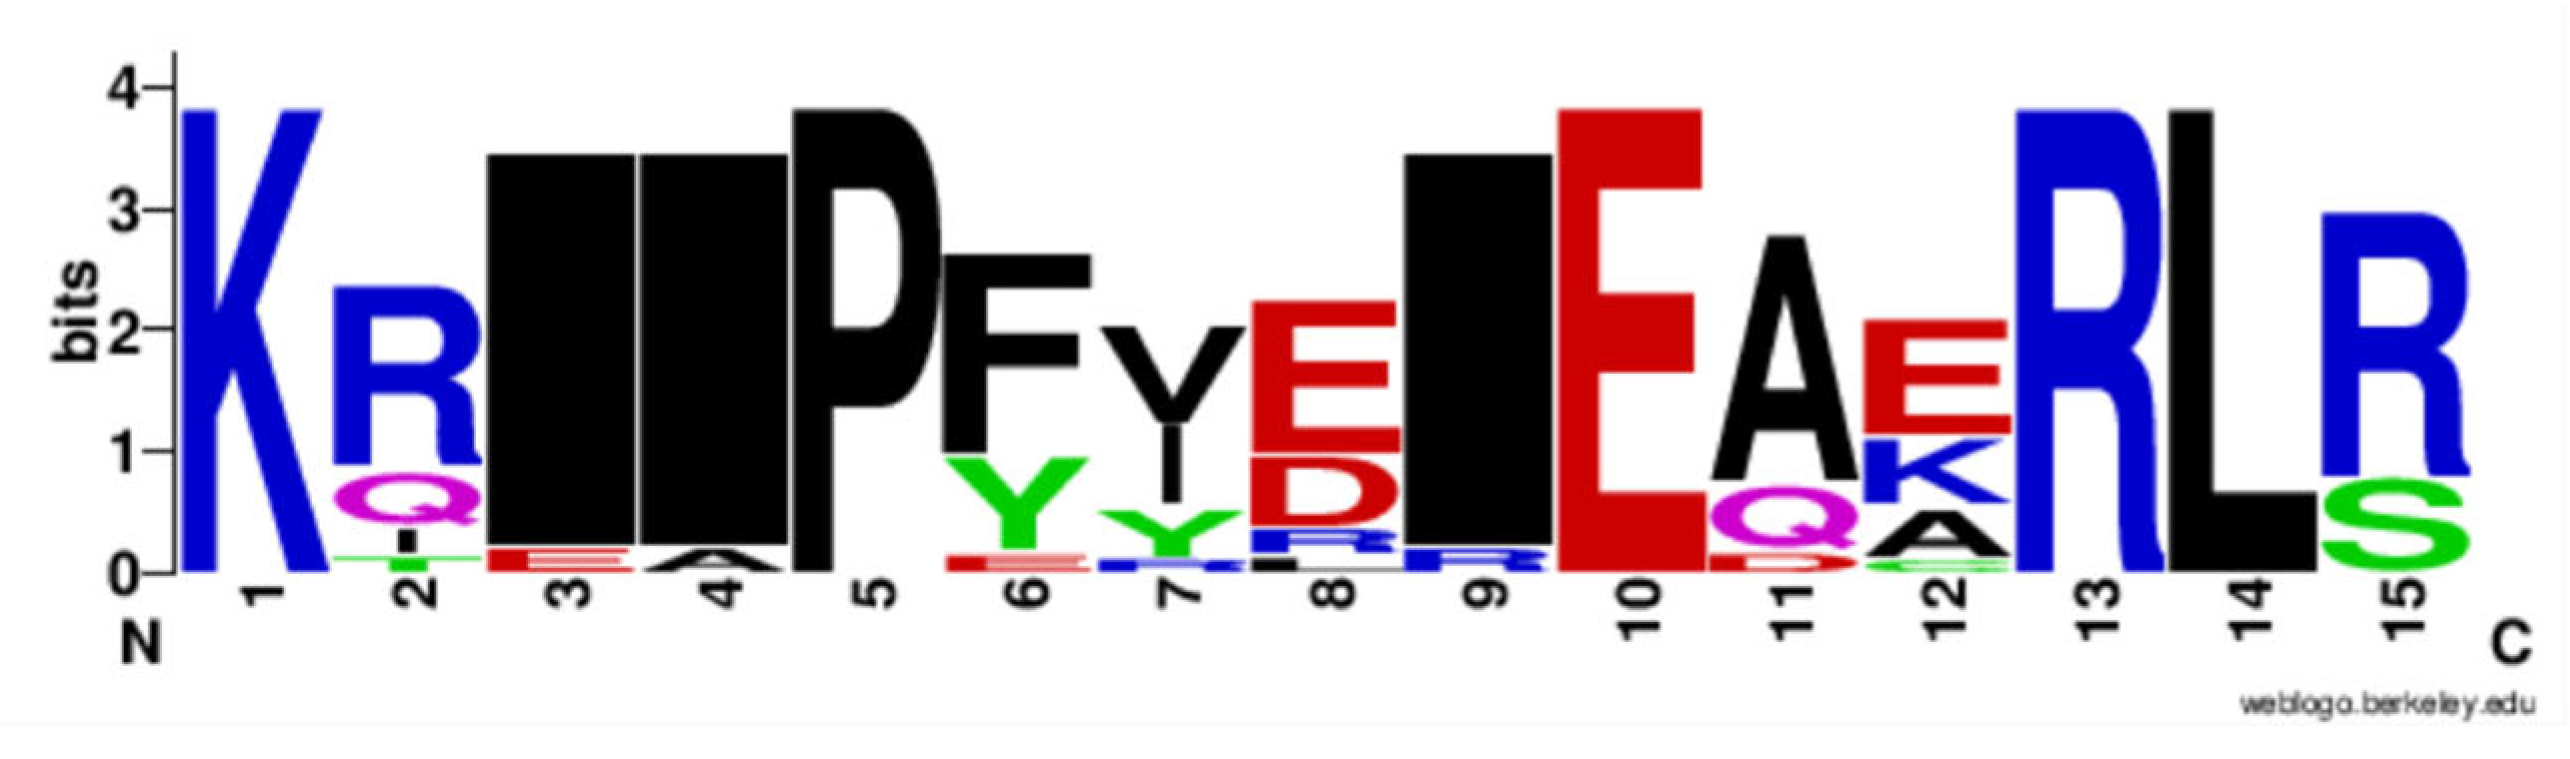
3.5. Characterization of Functional Motifs

All the Sox sequences analyzed were individually scanned for matches against the PROSITE collection of protein signature databases. We found two main domains, HMG box B and the SoxC terminal domains (Figure 7), with varying frequency across the Sox gene family in Bovidae. We found one proline-rich domain in Sox9, 17, 18, 15, and 30. The amino acid composition analysis reveals that these proteins have the highest proline concentration among the studied Sox proteins (Sox9-16.98%; Sox17-16.34%; Sox18-19.28%; Sox15-14.59%; Sox30-14.40%) (Supplementary Table S2).

3.6. Biological, Molecular, and Cellular Function of Bos Sox Genes

For the Gene Ontology analysis, three criteria were utilized: the biological processes the genes were involved in, the cellular components they are a part of, and their molecular function. We identified 49 biological processes with a false discovery rate <100, 6 cellular components, and 19 molecular functions (Table S3, Figure 8). The DAVID analysis revealed 26 biological processes, 2 cellular components, and 7 molecular functions (Supplementary Table S4). Nineteen significant biological processes including stem cell fate specification, the positive regulation of mesenchymal cells, renal vesicle induction, retinal rod cell differentiation, metanephric nephron tubule formation, the negative regulation of myoblast differentiation, and the positive regulation of chondrocyte differentiation were concomitantly identified from both databases (Supplentary Tables S3 and S4, Figure 8).

3.7. Protein–Protein Interaction Cluster with Sox Genes

In order to analyze the protein–protein interaction (PPI), co-expression, co-regulation, and physical association, we used STRING to build the protein network. Using k-means clustering we generated three clusters composed of closely connected interactions. The results revealed a major PPI network cluster with all the studied genes except Sox12, 15, and 30, which exhibited no interaction (Figure 9a). Sox5 had the most interaction with 10 nodes while Sox11, 13, and 14 had the least interaction. However, Sox1, 2, and 3 were not found in the cluster.
The PPI also indicated a possible involvement in pathways such as metabolic, developmental, and regulatory. Cellular signaling pathways such as the regulation of the Wnt signaling pathway, the negative regulation of the canonical Wnt signaling pathway, the regulation of the canonical Wnt signaling pathway, and the signal transduction involved in cell cycle checkpoint were associated with these protein networks. The STRING-extended analysis revealed the interaction of specific Sox genes with CTNNB1, HERC1, LEF1, PAX3, and TCF7L1 (Figure 9b).

4. Discussion

The Sox family of transcription factors exhibit diverse tissue-specific expression patterns during early embryonic development and plays important roles in cell fate [30]. To provide a deeper understanding of the inheritance pattern and the role of Sox protein in Bovidae evolution, we utilized sequences available in public databases to perform several computational analyses, yielding evolutionary relationships among the Sox gene family in Bos. Our analysis identified nine distinct clades, which were assigned to the known Sox groups A–H [31,32]. The genes within the same subgroup shared greater sequence similarity outside the HMG domain than those that are more related, a finding consistent with a previous report [33]. We observed high percentages of proline, glycine, and alanine in all the Sox proteins. Studies have shown that proline readily adopts a cis and trans configuration in response to subtle influences, induces sharp turns in the local geometry, is important in protein–protein interaction and cell adhesion, and mediates signal transduction [34]. The SoxG and SoxD subfamilies had the lowest and highest amino acid residues and molecular weights, respectively. All the Sox proteins had negative GRAVY values, indicating the hydrophilic nature of the proteins, as previously described [31,35], enhancing their binding capacity [36,37]
SoxA (SRY) protein, a transcriptional regulator that controls the genetic switch in male development, is the only member of Group A and formed a monophyletic group in the phylogenetic analysis. Its expression inhibition causes defects in the development of testes [32,38], with cytogenetic and molecular studies revealing that it possibly arose from a mutation of Sox3 and the fusion of the gene with regulatory sequences from another gene already on the X chromosome [39]. STRING pathway analysis revealed its association with Sox9, with GO enrichment confirming that SRY and Sox9 are enriched in male sex determination, which is consistent with published reports [31,40]. SRY binds to the TESCO (testis-specific enhancer core) sequence of Sox9 and initiates the differentiation of somatic precursors into Sertoli cells that coordinate the gonadal development into the testis [41]. Despite the substantial variation in expression profile structure and amino acid sequences within mammals, the function of SRY to activate Sox9 during development appears to be conserved.
The Sox B1 group comprises Sox1, 2, and 3, which are groups of transcription factors that have been reported to affect the Wnt β-catenin signaling pathway [2]. Sox1 inhibits β-catenin/TCF transcription activity by binding to β-catenin via their C-terminal region while Sox2 overexpression down-regulates the Wnt β-catenin signaling pathway suggesting a negative feedback loop between them. These proteins also promote the self-renewal of neural progenitor cells. PANTHER analysis shows that Sox3 interacts with SRY and Sox9 in sex determination. There was no interaction reported for Sox1 and 2, possibly attributed to a functional redundancy in this subfamily [42,43]
The proteins encoded by members of SoxB2 subfamily, Sox14 and Sox21, are very similar to each other but different from subfamily B1 in areas outside the HMG domain. They have been implicated in the regulation of mesenchymal stem cell differentiation. Sox21 has been reported to promote neurogenesis in mice while Sox14 mediates terminal differentiation of the neural progenitor cells [44]. The STRING pathway analysis identified Sox14 as one of the genes involved in the regulation of neurogenesis while Sox21 was enriched in stem cell differentiation.
The SoxC subfamily (Sox4, 11, and 12) has three members in most vertebrates [3]. Sox4 and 11 share a similar function and structural properties. Reports on Sox12 functional properties are scarce. Sox4 and 11 were shown to be involved in lymphocyte differentiation, osteoblast development, neural and glial cell development, control progenitor development, and the capacity to crosstalk with other cells to grow and mature skeletal structures [1,3]. Phylogenetic analysis revealed that the three proteins are closely related, as they all appeared in one clade. PROSITE revealed a SoxC-rich domain in all SoxF genes, suggesting that the complex interacts with this group. The HMG box domain in this group is virtually identical; therefore, the difference in DNA binding efficiency may be due to sequence differences outside the HMG box [3]. The STRING pathway analysis identified Sox4 and Sox11 as enriched in cardiac ventricle formation and limb bud formation, enteric nervous system development, and glial cell proliferation.
The SoxD subfamily (Sox5, 6, and 13) have higher amounts of amino acid residues than other Sox proteins. Our result showed that this subgroup is significantly enriched in oligodendrocyte differentiation, cell fate commitment, and glial cell differentiation. Members of this group formed a paraphyletic group with Sox30 suggesting a recent divergence. These genes interact with Sox9 of the SoxE subfamily, and expression of the three Sox genes culminates in growth plate proliferation in chondrocytes. Furthermore, the co-inactivation of Sox5 and 6 genes was reported to result in stunted or underdeveloped growth plates and articular cartilage, while Sox9 is required to turn on and maintain chondrocyte-specific genes [45,46].
SoxE proteins, Sox8, 9, and 10, overlap in expression, play critical roles in various biological processes, and are renowned for their role in transactivation. Haseeb and Lefebvre [47] reported a study in humans wherein SoxE and F proteins possess the unique motif EFDQYL/ELDQYL required for transactivation, which we also found in both SoxE and F of the Bovidae family. Based on its amino acid composition, it is functionally crucial and highly conserved in various vertebrate and invertebrate species [48]. The residues within the motif revealed the presence of acidic and hydrophilic amino acids (E, Q) alternating with hydrophobic residues (F, Y, L), which fold into pocket-like structures involved in recognizing and binding to functional partners and coactivators [47]. Other studies also showed that the sequence is required for the interaction of Sox9 and β-catenin, [49]
The SoxF subfamily promotes the fate specification of endothelial cells [50]. They are thought to share a recent common ancestor with SoxE and exhibit a substantial overlap in expression function and regulation implying a redundant type of cooperation. The only Sox member in the G subfamily is Sox15. This Sox protein is found only in mammals and shares a common ancestry with SoxB, forming a paraphyletic tree. [14,51,52]. This common ancestry likely accounts for the ability of Sox15 to replace the function of Sox2 in the self-renewal of mouse stem cells [53,54]
The STRING analysis revealed the complex interaction of the studied Sox proteins with CTNNB1, PAX3, HERC1, and TCF7L1. The catenin β-1 gene (CTNNB1) provides instructions for making the β-catenin protein, which is primarily found at junctions connecting neighboring cells. β-catenin plays a major role in sticking cells (adhesion), cell signaling, and in cell communication [55]. This pathway is important for Sox proteins to recognize target genes during cellular interactions. CTNNB1 formed complex interactions with Sox2,6,7 and 9 in several developmental processes in Coturnix japonica [31]. Furthermore, CTNNB1 also interacts with Sox17 and 30, LEF1, and TCF7L1 in β-catenin binding. LEF1 (lymphoid enhancer-binding factor 1) shares significant homology with HMG protein and is involved in the Wnt canonical pathway, cell differentiation, and follicle morphogenesis [56]. Pax3, Sox10, and c-Ret are components of a neural crest development pathway, and the interruption of this pathway at various stages results in neural crest-related human genetic syndromes [57].

5. Conclusions

Our study shows the detailed molecular evolution, inheritance pattern, and functions of Sox genes in the Bos family using several computational tools. In addition, this study documents the first comprehensive evidence of genetic variation in the Sox gene family in Bos sp. We reported a total of 20 Sox genes, which were classified into nine subfamilies based on phylogenetic analysis. We also provided evidence of divergent evolution in some Sox genes among the Bos family. This study further revealed important functional motifs that drive these proteins and enhance their ability to shape the regulatory regions of several genes and promote cells’ fate and differentiation. Lastly, we found the motif EFDQYL/ELDQYL, which is required for the unique transactivation ability of SoxE and SoxF proteins. Based on the findings of this study, we have provided a suitable background for further studies to harness the potential of these protein families in immunotherapeutic and regenerative medicine targeted at Bovidae.

Supplementary Materials

The following supporting information can be downloaded at: https://www.mdpi.com/article/10.3390/genes13101783/s1, Table S1: Genetic Distance of Bos Sox gene subfamilies; Table S2: Amino acid composition of Sox genes in Bos sp; Table S3: Gene ontology: biological processes, molecular function and cellular components of Sox genes in Bos sp. (PANTHER); Table S4: Gene ontology: biological processes, molecular function and cellular components of Sox genes in Bos sp. (DAVID).

Author Contributions

O.B.M. conceptualized and designed the experiments; M.O.A., J.F. and M.S.A. carried out the experiments and analyzed the data; M.O.A. and O.B.M. drafted the manuscript; M.O.A., M.S.A., O.H.O., J.F., A.G., I.M.O., B.N.T., S.O.P. and O.B.M. revised the manuscript, contributed to the discussion and scientific content. All authors have read and agreed to the published version of the manuscript.

Funding

This research received no external funding.

Institutional Review Board Statement

Not Applicable.

Informed Consent Statement

Not Applicable.

Data Availability Statement

Data used, and their accession numbers are included in this manuscript. See supplementary Tables S1–S3.

Acknowledgments

OBM and AG were supported by Pitt-Momentum Fund of the University of Pittsburgh. Ongoing support by the Division of Biological and Health Sciences, Pitt-Bradford and Department of Biological Sciences, Fairleigh Dickinson University is acknowledged.

Conflicts of Interest

The authors declare no conflict of interest.

References

  1. Lefebvre, V. Roles and regulation of SOX transcription factors in skeletogenesis. Curr. Top. Dev. Biol. 2019, 133, 171–193. [Google Scholar] [CrossRef]
  2. Stevanovic, M.; Drakulic, D.; Lazic, A.; Ninkovic, D.S.; Schwirtlich, M.; Mojsin, M. SOX Transcription Factors as Important Regulators of Neuronal and Glial Differentiation During Nervous System Development and Adult Neurogenesis. Front. Mol. Neurosci. 2021, 31, 654031. [Google Scholar] [CrossRef]
  3. Dy, P.; Penzo-Mendez, A.; Wang, H.; Pedraza, C.E.; Macklin, W.B.; Lefebvre, V. The three SoxC proteins–Sox4, Sox11 an Sox12–exhibit overlapping expression patterns and molecular properties. Nucleic Acids Res. 2008, 36, 3101–3117. [Google Scholar] [CrossRef] [Green Version]
  4. Schepers, G.E.; Teasdale, R.D.; Koopman, P. Twenty pairs of Sox: Extent, homology, and nomenclature of the mouse and human Sox transcription factor gene families. Dev. Cell 2002, 3, 167–170. [Google Scholar] [CrossRef] [Green Version]
  5. Kondoh, H.; Kamachi, Y. SOX-partner code for cell specification: Regulatory target selection and underlying molecular mechanisms. Int. J. Biochem. Cell Biol. 2010, 42, 391–399. [Google Scholar] [CrossRef]
  6. Takahashi, K.; Tanabe, K.; Ohnuki, M.; Narita, M.; Ichisaka, T.; Tomoda, K.; Yamanaka, S. Induction of pluripotent stem cells from adult human fibroblasts by defined factors. Cell 2007, 131, 861–872. [Google Scholar] [CrossRef] [Green Version]
  7. Takahashi, K.; Yamanaka, S. Induction of pluripotent stem cells from mouse embryonic and adult fibroblast cultures by defined factors. Cell 2006, 126, 663–676. [Google Scholar] [CrossRef] [Green Version]
  8. Takahashi, K.; Yamanaka, S. A decade of transcription factor-mediated reprogramming to pluripotency. Nat. Rev. Mol. Cell Biol. 2016, 17, 183–193. [Google Scholar] [CrossRef]
  9. Smith, A.N.; Miller, L.A.; Radice, G.; Ashery-Padan, R.; Lang, R.A. Stage-dependent modes of Pax6-Sox2 epistasis regulate lens development and eye morphogenesis. Development 2009, 136, 2977–2985. [Google Scholar] [CrossRef] [Green Version]
  10. Ekonomou, A.; Kazanis, I.; Malas, S.; Wood, H.; Alifragis, P.; Denaxa, M.; Karagogeos, D.; Constanti, A.; Lovell-Badge, R.; Episkopou, V. Neuronal migration and ventral subtype identity in the telencephalon depend on SOX1. PloS Biol. 2005, 3, e186-10. [Google Scholar] [CrossRef] [PubMed]
  11. Rizzoti, K.; Brunelli, S.; Carmignac, D.; Thomas, P.Q.; Robinson, I.C.; Lovell-Badge, R. SOX3 is required during the formation of the hypothalamopituitary axis. Nat. Genet. 2004, 36, 247–255. [Google Scholar] [CrossRef] [PubMed]
  12. Smits, P.; Li, P.; Mandel, J.; Zhang, Z.; Deng, J.M.; Behringer, R.R.; de Crombrugghe, B.; Lefebvre, V. The transcription factors L-Sox5 and Sox6 are essential for cartilage formation. Dev. Cell 2001, 1, 277–290. [Google Scholar] [CrossRef] [Green Version]
  13. Pennisi, D.; Gardner, J.; Chambers, D.; Hosking, B.; Peters, J.; Muscat, G.; Abbott, C.; Koopman, P. Mutations in Sox18 underlie cardiovascular and hair follicle defects in ragged mice. Nat. Genet. 2000, 24, 434–437. [Google Scholar] [CrossRef] [PubMed]
  14. Kamachi, Y.; Kondoh, H. Sox proteins: Regulators of cell fate specification and differentiation. Development 2013, 140, 4129–4144. [Google Scholar] [CrossRef] [Green Version]
  15. Barrionuevo, F.; Naumann, A.; Bagheri-Fam, S.; Speth, V.; Taketo, M.M.; Scherer, G.; Neubüser, A. Sox9 is required for invagination of the otic placode in mice. Dev. Biol. 2008, 317, 213–224. [Google Scholar] [CrossRef] [Green Version]
  16. Sakamoto, Y.; Hara, K.; Kanai-Azuma, M.; Matsui, T.; Miura, Y.; Tsunekawa, N.; Kurohmaru, M.; Saijoh, Y.; Koopman, P.; Kanai, Y. Redundant roles of Sox17 and Sox18 in early cardiovascular development of mouse embryos. Biochem. Biophys. Res. Commun. 2007, 360, 539–544. [Google Scholar] [CrossRef]
  17. François, M.; Caprini, A.; Hosking, B.; Orsenigo, F.; Wilhelm, D.; Browne, C.; Paavonen, K.; Karnezis, T.; Shayan, R.; Downes, M.; et al. Sox18 induces development of the lymphatic vasculature in mice. Nature 2008, 456, 643–647. [Google Scholar] [CrossRef]
  18. Kanai-Azuma, M.; Kanai, Y.; Gad, J.M.; Tajima, Y.; Taya, C.; Kurohmaru, M.; Sanai, Y.; Yonekawa, H.; Yazaki, K.; Tam, P.P.; et al. Depletion of definitive gut endoderm in Sox17-null mutant mice. Development 2002, 129, 2367–2379. [Google Scholar] [CrossRef]
  19. Sock, E.; Rettig, S.D.; Enderich, J.; Bosl, M.R.; Tamm, E.R.; Wegner, M. Gene targeting reveals a widespread role for the high-mobility-group transcription factor Sox11 in tissue remodeling. Mol. Cell. Biol. 2004, 24, 6635–6644. [Google Scholar] [CrossRef] [Green Version]
  20. Matthee, C.A.; Davis, S.K. Molecular Insights into the Evolution of the Family Bovidae: A Nuclear DNA Perspective. Mol. Biol. Evol. 2001, 18, 1220–1230. [Google Scholar] [CrossRef]
  21. Escudeiro, A.; Ferreira, D.; Mendes-da-Silva, A.; Heslop-Harrison, J.; Adega, F.; Chaves, R. Bovine satellite DNAs–a history of the evolution of complexity and its impact in the Bovidae family. Eur. Zool. J. 2019, 86, 20–37. [Google Scholar] [CrossRef]
  22. Hepp, D.; Gonçalves, G.L.; de Freitas, T.R. Prediction of the damage-associated non-synonymous single nucleotide polymorphisms in the human MC1R gene. PLoS ONE 2015, 10, e0121812. [Google Scholar] [CrossRef] [PubMed] [Green Version]
  23. Morenikeji, O.B.; Thomas, B.N. In silico analyses of CD14 molecule reveal significant evolutionary diversity, potentially associated with speciation and variable immune response in mammals. PeerJ 2019, 7, e7325. [Google Scholar] [CrossRef] [PubMed]
  24. Singh, N.P.; De Kumar, B.; Paulson, A.; Parrish, M.E.; Zhang, Y.; Florens, L.; Conaway, J.W.; Si, K.; Krumlauf, R. A six-amino-acid motif is a major determinant in functional evolution of HOX1 proteins. Genes Dev. 2020, 34, 1680–1696. [Google Scholar] [CrossRef] [PubMed]
  25. Soremekun, O.S.; Omolabi, K.F.; Soliman, M.E.S. Identification and classification of differentially expressed genes reveal potential molecular signature associated with SARS-CoV-2 infection in lung adenocarcinomal cells. Inform. Med. Unlocked 2020, 20, 100384. [Google Scholar] [CrossRef]
  26. Kumar, S.; Stecher, G.; Li, M.; Knyaz, C.; Tamura, K. MEGA X: Molecular Evolutionary Genetics Analysis across computing platforms. Mol. Biol. Evol. 2018, 35, 1547–1549. [Google Scholar] [CrossRef]
  27. Ciccarelli, F.D.; Doerks, T.; von Mering, C.; Creevey, C.J.; Snel, B.; Bork, P. Toward automatic reconstruction of a highly resolved tree of life. Science 2006, 311, 1283–1287. [Google Scholar] [CrossRef] [PubMed] [Green Version]
  28. Bailey, T.L.; Boden, M.; Buske, F.A.; Frith, M.; Grant, C.E.; Clementi, L.; Ren, J.; Li, W.W.; Noble, W.S. MEME SUITE: Tools for motif discovery and searching. Nucleic Acids Res. 2009, 37, W202–W208. [Google Scholar] [CrossRef]
  29. Mi, H.; Muruganujan, A.; Casagrande, J.; Thomas, P.D. Large-scale gene function analysis with the PANTHER classification system. Nat. Protoc. 2013, 8, 1551–1566. [Google Scholar] [CrossRef]
  30. Bowles, J.; Schepers, G.; Koopman, P. Phylogeny of the SOX family of developmental transcription factors based on sequence and structural indicators. Dev. Biol. 2000, 227, 239–255. [Google Scholar] [CrossRef]
  31. Jiang, L.; Bi, D.; Ding, H.; Wu, X.; Zhu, R.; Zeng, J.; Yang, X.; Kan, X. Systematic Identification and Evolution Analysis of Sox Genes in Coturnix japonica Based on Comparative Genomics. Genes 2019, 10, 314. [Google Scholar] [CrossRef] [PubMed] [Green Version]
  32. Hu, Y.; Wang, B.; Du, H. A review on Sox genes in fish. Rev. Aquac. 2021, 13, 1986–2003. [Google Scholar] [CrossRef]
  33. Heenan, P.; Zondag, L.; Wilson, M.J. Evolution of the Sox gene family within the chordate phylum. Gene 2016, 575, 385–392. [Google Scholar] [CrossRef] [PubMed]
  34. Morgan, A.A.; Rubenstein, E. Proline: The distribution, frequency, positioning, and common functional roles of proline and polyproline sequences in the human proteome. PLoS ONE 2013, 8, e53785. [Google Scholar] [CrossRef] [Green Version]
  35. Zhang, S.; Chen, X.; Wang, M.; Zhang, W.; Pan, J.; Qin, Q.; Zhong, L.; Shao, J.; Sun, M.; Jiang, H.; et al. Genome-wide identification, phylogeny and expressional profile of the Sox gene family in channel catfish (Ictalurus punctatus). Comp. Biochem. Physiol. 2018, 28, 17–26. [Google Scholar] [CrossRef]
  36. Roy, S.; Maheshwari, N.; Chauhan, R.; Sen, N.K.; Sharma, A. Structure prediction and functional characterization of secondary metabolite proteins of Ocimum. Bioinformation 2011, 6, 315–319. [Google Scholar] [CrossRef] [Green Version]
  37. Kadel, S.; Persico, M.; Thibodeau, J.; Lainé, C.; Bazinet, L. Use of redundancy analysis and multivariate regression models to select the significant membrane properties affecting peptide migration during electrodialysis with filtration membranes. Sep. Purif. Technol. 2019, 221, 114–125. [Google Scholar] [CrossRef]
  38. Larney, C.; Bailey, T.L.; Koopman, P. Switching on sex: Transcriptional regulation of the testis-determining gene Sry. Development 2014, 141, 2195–2205. [Google Scholar] [CrossRef] [Green Version]
  39. Herpin, A.; Schart, M. Plasticity of gene-regulatory networks controlling sex determination: Of masters, slaves, usual suspects, newcomers, and usurpators. EMBO Rep. 2015, 16, 1260–1274. [Google Scholar] [CrossRef] [Green Version]
  40. Sun, F.; Liu, S.; Gao, X.; Jiang, Y.; Perera, D.; Wang, X.; Li, C.; Sun, L.; Zhang, J.; Kaltenboeck, L. Male-biased genes in catfish as revealed by RNA-Seq analysis of the testis transcriptome. PLoS ONE 2013, 8, e68452. [Google Scholar] [CrossRef]
  41. Wilhelm, D.; Palmer, S.; Koopman, P. Sex determination and gonadal development in mammals. Physiol. Rev 2007, 87, 1–28. [Google Scholar] [CrossRef] [Green Version]
  42. Brunelli, S.; Silva Casey, E.; Bell, D.; Harland, R.; Lovell-Badge, R. The expression of Sox3 throughout the developing central nervous system is dependent on the combined action of discrete, evolutionarily conserved regulatory elements. Genesis 2003, 36, 12–24. [Google Scholar] [CrossRef] [PubMed]
  43. Weiss, J.; Meeks, J.J.; Hurley, L.; Raverot, G.; Frassetto, A.; Jameson, J.L. Sox3 is required for gonadal function, but not sex determination, in males and females. Mol. Cell. Biol. 2003, 23, 8084–8091. [Google Scholar] [CrossRef] [PubMed] [Green Version]
  44. Makrides, N.; Panayiotou, E.; Fanis, P.; Karaiskos, C.; Lapathitis, G.; Malas, S. Sequential Role of SOXB2 Factors in GABAergic Neuron Specification of the Dorsal Midbrain. Front. Mol. Neurosci. 2018, 11, 152. [Google Scholar] [CrossRef] [PubMed] [Green Version]
  45. Han, Y.; Lefebvre, V. L-Sox5 and Sox6 drive expression of the aggrecan gene in cartilage by securing binding of Sox9 to a far-upstream enhancer. Mol. Cell. Biol. 2008, 28, 4999–5013. [Google Scholar] [CrossRef] [PubMed] [Green Version]
  46. Liu, C.F.; Lefebvre, V. The transcription factors SOX9 and SOX5/SOX6 cooperate genome-wide through super-enhancers to drive chondrogenesis. Nucleic Acids Res. 2015, 43, 8183–8203. [Google Scholar] [CrossRef] [Green Version]
  47. Haseeb, A.; Lefebvre, V. The SOXE transcription factors-SOX8, SOX9 and SOX10-share a bi-partite transactivation mechanism. Nucleic Acids Res. 2019, 47, 6917–6931. [Google Scholar] [CrossRef]
  48. Frietze, S.; Farnham, P.J. Transcription factor effector domains. Sub. Cell Biochem. 2011, 52, 261–277. [Google Scholar]
  49. Akiyama, H.; Lyons, J.P.; Mori-Akiyama, Y.; Yang, X.; Zhang, R.; Zhang, Z.; Deng, J.M.; Taketo, M.M.; Nakamura, T.; Behringer, R.R.; et al. Interactions between Sox9 and beta-catenin control chondrocyte differentiation. Genes Dev. 2004, 18, 1072–1087. [Google Scholar] [CrossRef] [Green Version]
  50. Kim, K.; Kim, I.K.; Yang, J.M.; Lee, E.; Koh, B.I.; Song, S.; Park, J.; Lee, S.; Choi, C.; Kim, J.W.; et al. SoxF Transcription Factors Are Positive Feedback Regulators of VEGF Signaling. Circ. Res. 2016, 119, 839–852. [Google Scholar] [CrossRef] [Green Version]
  51. Ito, M. Function and molecular evolution of mammalian Sox15, a singleton in the SoxG group of transcription factors. Int. J. Biochem. Cell Biol. 2010, 42, 449–452. [Google Scholar] [CrossRef] [PubMed]
  52. Williams, C.A.C.; Soufi, A.; Pollard, S.M. Post-translational modification of SOX family proteins: Key biochemical targets in cancer? Semin. Cancer Biol. 2020, 67, 30–38. [Google Scholar] [CrossRef] [PubMed]
  53. Maruyama, M.; Ichisaka, T.; Nakagawa, M.; Yamanaka, S. Differential roles for Sox15 and Sox2 in transcriptional control in mouse embryonic stem cells. J. Biol. Chem. 2005, 280, 24371–24379. [Google Scholar] [CrossRef] [PubMed] [Green Version]
  54. Niwa, H.; Nakamura, A.; Urata, M.; Shirae-Kurabayashi, M.; Kuraku, S.; Russell, S.; Ohtsuka, S. The evolutionally conserved function of group B1 Sox family members confers the unique role of Sox2 in mouse ES cells. BMC Evol. Biol. 2016, 16, 173. [Google Scholar] [CrossRef] [PubMed] [Green Version]
  55. Bienz, M. β-catenin: A pivot between cell adhesion and Wnt signaling. Curr. Biol. 2005, 127, 2061–2069. [Google Scholar] [CrossRef] [Green Version]
  56. Xiao, L.; Zhang, C.; Li, X.; Jia, C.; Chen, L.; Yuan, Y.; Gao, Q.; Lu, Z.; Feng, Y.; Zhao, R.; et al. LEF1 Enhances the Progression of Colonic Adenocarcinoma via Remodeling the Cell Motility Associated Structures. Int. J. Mol. Sci. 2021, 22, 10870. [Google Scholar] [CrossRef] [PubMed]
  57. Lang, D.; Chen, F.; Milewski, R.; Li, J.; Lu, M.; Epstein, J.A. Pax3 is required for enteric ganglia formation and functions with Sox10 to modulate expression of c-ret. J. Clin. Invest. 2000, 106, 963–971. [Google Scholar] [CrossRef]
Figure 1. The phylogenetic analysis, categories, and abundance of the Sox gene family in Bovidae.
Genes 13 01783 g001
Figure 2. Multiple sequence alignment of Sox genes in Bos sp. (SRY: Sex-determining region Y, Bt: Bos taurus, BiBt: Bos indicus x Bos tautus, and Bm: Bos mutus. Colors were assigned by MEGA software based on the biochemical properties of the amino acids. Red, acidic; yellow, non-polar neutral; cyan, positive polar basic; blue, positive polar; green, neutral polar; purple, neutral non-polar; lime, neutral polar).
Genes 13 01783 g002
Figure 3. (a) Rooted phylogeny of Sox genes in Bos sp. computed using the neighbor-joining method (MEGA). (b) Unrooted phylogeny of Sox genes created by the interactive tree of life (ITOL) online software (https://itol.embl.de accessed on 3 June 2022) which assigned color to the different subfamilies. The various subfamilies (A, B1, B2, C, D, E, F, G and H) are highlighted in different colors.
Genes 13 01783 g003
Figure 4. Conserved domain pattern in Sox proteins across Bos sp.
Genes 13 01783 g004
Figure 5. Logo plots of Sox protein sequences displaying the most conserved domain and positions of amino acids. A total of 26 multiple sequence alignments are represented using Weblogo (http://weblogo.berkeley.edu/logo.cgir accessed on 24 April 2022). The relative frequency of the amino acids is shown on the y-axis.
Genes 13 01783 g005
Figure 6. (a) Motif patterns of Bos Sox gene family. Ten differentially conserved motifs are indicated with differently colored boxes using the online Multiple Expectation Maximization for Motifs Elicitation (MEME, http://alternate.meme-suite.org accessed on 12 June 2022) program. M4 included an important motif, which was highlighted in yellow. (b) Multiple sequence alignment of Sox genes in Bos sp. (Bt: Bos taurus, BiBt: Bos indicus x Bos tautus, and Bm: Bos mutus) showing conserved transactivation motif highlighted in yellow. The motif is conserved in Sox 7–10 and 18 but not Sox 17. Amino acids colors were assigned by MEGA software based on their biochemical properties. Red, acidic; yellow, non-polar neutral; cyan, positive polar basic; blue, positive polar; green, neutral polar; purple, neutral non-polar; lime, neutral polar).
Genes 13 01783 g006
Figure 7. Comparison of intra-domain features of Sox proteins. This comparison shows the HMG box and SoxC domain that provide additional information about the structure and functions of Sox proteins. Members of SoxF subfamily have an additional C- terminal domain.
Genes 13 01783 g007
Figure 8. The biological process and the corresponding number of target genes involved. Red bars indicate the biological process/pathways predicted with the highest p-value; purple bars indicate the pathways predicted with the lowest p-value. Figure created with Microsoft Excel (2017) (https://www.microsoft.com/en-us/microsoft-365/excel accessed on 1 September 2022).
Genes 13 01783 g008
Figure 9. Sox protein interaction. Protein–protein interaction: (a) Sox proteins only; (b) predicted interactions with other proteins; (c) k means clustering. Network created using STRING (string-db.org).
Genes 13 01783 g009
Table 1. Physicochemical properties of Sox genes in Bos sp.
Gene Symbol SizeMW (Da)pIChromosomeAIIIGRAVYExtinction
Coefficient
Accession Number
SoxASRYABY19364.122926,627.119.53Y62.6260.71−0.85830,285
SoxB1Sox1XP_005214070.1369**144.4441.96−0.47235,870
Sox2NP_001098933.132034,480.959.74148.2559.43−0.73937,360
Sox3XP_027390716.145145,113.009.78X61.1869.35−0.31438,850
SoxB2Sox14NP_001157253.124026,485.399.68163.1753.51−0.58533,015
Sox21XP_024855919.127728,666.929.741269.1358.51−0.20831,525
SoxCSox4NP_001071596.148147,785.117.202354.2258.41−0.47835,660
Sox11XP_024855327.145147,147.034.951158.1665.27−0.65237,150
Sox12XP_010809935.231433,997.765.141349.8767.74−0.98240,575
SoxDSox5AAI14659.172880,127.286.13569.4863.71−0.74643,445
Sox6XP_027419183.185895,541.567.931564.5261.11−0.79464,790
Sox13XP_027419995.162369,061.046.141671.8869.67−0.74241,870
SoxESox8XP_002698019.353456,239.997.772552.2559.49−0.70863,175
Sox9XP_027374751.152457,173.496.311946.9880.78−0.98455,935
Sox10XP_027396627.146950,020.206.19553.3058.52−0.82254,445
SoxFSox7XP_027404803.153457,216.309.62855.6663.44−0.83458,830
Sox17XP_027416795.141043,060.765.911460.6365.47−0.50939,225
Sox18XP_027415027.138941,337.008.421362.9678.07−0.57340,255
SoxGSox15XP_027374313.123325,140.189.851949.0669.49−0.87538,515
SoxHSox30XP_027401619.175782,746.768.62770.0168.76−0.60348,415
* Sox 1 Sequence contains several consecutive undefined AA. Its pI and Mw cannot be computed.
Table 2. Molecular similarity index of Sox gene family in Bovidae.
SRY
SOX-1Bt50100
SOX-2Bt51.8074.05100
SOX-3BiBt51.8068.6268.20100
SOX-14Bt47.5946.4243.7547.76100
SOX-21Bt42.7745.8844.3543.9271.42100
SOX-4Bt36.1433.2034.3032.5434.3737.25100
SOX-11Bt36.7431.1233.0532.5434.8232.1554.47100
SOX-12Bt30.7238.4638.4641.7534.6138.4659.8956.04100
SOX5Bt16.8614.1212.1313.3312.0512.5412.8713.2216.48100
SOX-5Bm16.8614.1212.1313.3312.0512.5412.8313.2216.48100100
SOX-6BiBt19.2714.8814.2213.7215.6211.3712.3514.7815.3881.4381.13100
SOX-6Bm19.2714.8814.2213.7215.6211.3712.3514.7815.3881.4381.13100100
SOX-13Bm15.6613.3312.9714.5014.7313.3313.7211.7614.8370.5870.5865.4965.49100
SOX-8Bt37.3430.1533.0530.1935.7132.1531.3232.6839.0112.5012.4512.4512.4512.54100
SOX-9BiBt39.7527.8632.2129.0133.4828.6227.2729.5739.5611.3611.3611.3611.3612.5462.50100
SOX-9Bt39.7527.8632.2129.0133.4828.6227.2729.5739.5611.3611.3611.3611.3612.5462.50100100
SOX-10BiBt36.7428.7333.0529.8034.8230.5830.2633.0739.5612.6412.6412.6412.6411.3759.7772.0372.03100
SOX-10Bm36.7428.7333.0529.8034.8230.5830.2633.0739.5612.6412.6412.6412.6411.3759.7772.0372.03100100
SRY: Sex-determining region Y, Bt: Bos taurus, BiBt: Bos indicus x Bos tautus, and Bm: Bos mutus. Colors were assigned based on the percent pairwise similarity scores of Sox sequences with red indicating scores between 11–19; yellow, 30–43 and green, 60–100.
Publisher’s Note: MDPI stays neutral with regard to jurisdictional claims in published maps and institutional affiliations.

