Abstract
Hemiculter leucisculus is an invasive fish and widely distributed in the Xinjiang Tarim River. In this study, RAD-seq was used to explore the genetic diversity and population subgroup structure of H. leucisculus in the Tarim River and develop relevant Simple Sequence Repeat (SSR) markers. The study collected 40 samples distributed at four different sites of the Tarim River. A total of 7,291,260 single nucleotide polymorphisms (SNPs) were obtained. The genetic diversity results showed that the population genetic diversity level of H. leucisculus was low. The population pairwise FST values ranged from 0.231 to 0.258, indicating that there was moderate genetic differentiation among these populations. AMOVA showed that the genetic variation within populations accounted for 92.31% of the total variation. The principal component analysis (PCA) and neighbor joining (NJ) tree revealed that the four populations could be separated into two clusters (upper-middle and downstream populations) and the individuals from Taitema Lake (TTMH) showed differences and had a bigger geographic distance than the others. There is the probability that the H. leucisculus from Bosten Lake entered Taitema Lake to breed and then expanded into the Tarim River due to the water diversion projects in location. In addition, 147,705 SSRs loci were detected and 22,651 SSR primer pairs were developed. This study will contribute to providing valuable molecular data for the management of wild populations, marker-assisted selection and resource exploitation of H. leucisculus.
1. Introduction
Hemiculter leucisculus (Basilewsky, 1855) is a small cyprinid fish. It has a wide distribution in East Asia, living in the upper middle layer of water and likes to live in clusters. It is an invasive fish in the Tarim River of Xinjiang. In the past, the economic value of H. leucisculus was considered low, so its potential value has not been exploited. However, in some areas where stable populations have been established, it has become an important economic fish [1]. Xie Zongyong et al. studied H. leucisculus of Fenhe Reservoir and the growth characteristics of H. leucisculus [2]. Li Baolin et al. conducted biological research on H. leucisculus from Dalai Lake [3]. Currently, the research on H. leucisculus mainly focuses on classification, nutrition and biology. At the same time, there is less research on the genetic background of H. leucisculus, which makes it difficult to gain strong theoretical support for the population dynamics of H. leucisculus. Therefore, it is important to study the genetic diversity of H. leucisculus.
RAD-seq (Restriction site-associated DNA sequencing) is a series of sequencing technologies based on restriction endonucleases characterized by simple operation, low application cost and wide coverage. It provides an accurate and efficient technique for studying population genetic structure and diversity at the genome level and has been widely used in these fields. Microsatellites, also known as simple sequence repeats (SSR), are abundant and dispersed broadly in the coding region and non-coding region of eukaryote genome and are composed of short (2–5 bp) variable tandemly repeated arrays. SSR markers are very practical genetic markers widely used in many fields, such as paternity testing, molecular marker-assisted breeding, genetic map construction, quantitative trait loci location and population genetics [4,5].
In this study, we used the RAD-seq method to unravel the population structure of H. leucisculus in the Tarim River. The objectives of our study were to use SNP genotyping to investigate and evaluate the genetic diversity, genetic differentiation and population structure of H. leucisculus and develop SSR markers. These data are the basis for the formulation of effective management strategies for this invasive fish, providing essential information both for its control and its potential exploitation as a fishery resource.
2. Materials and Methods
2.1. Sampling and DNA Extraction
Along the 1321 km long main course of the Tarim River, fish were sampled in four sectors corresponding to the upper, middle and lower reaches of the river. Fish samples were taken from four locations in the Tarim River basin from May to October 2019. In total, 40 specimens were collected from four sample sites in the Tarim River basin (Figure 1). The fin samples were obtained and stored in 95% ethyl alcohol in −20 °C refrigerators for subsequent experiments. The genomic DNA of 40 individuals was extracted using the CTAB (Cetyltrimethylammonium Bromide) method. DNA quality and concentration were measured by 1.0% agarose gel electrophoresis and NanoDrop 2000 spectrophotometers (Thermo Scientific, Wilmington, DE, USA).
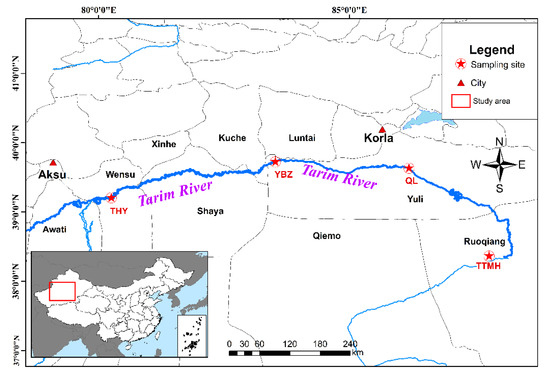
Figure 1.
Sample sites of H. leucisculus in the Tarim River basin located in Xinjiang.
2.2. RAD Library Construction and Sequencing
The restriction site-associated DNA sequencing library was constructed using the recommended method described by Willing E M et al. (2011) [6]. About 1 μg of genomic DNA per sample was digested with EcoRI and incubated at 37 °C with T4 DNA ligase and EcoRI adapter. Using NEBNext dsDNA fragmentase, the reaction mixtures were segmented into 50–1000 bp. The samples were purified with AMPure XP beads (Beckman Coulter, Brea, CA, USA). The fragmented DNA was used to conduct end repairing, dA-tailing and adapter ligation. Subsequently, the PCR productions were purified and pooled to obtain the lengths of 300–400 bp digested fragment sequences for library construction. PCR amplification was performed on the size-selected fragments (12 cycles of PCR; 50 μg reaction system) using NEBNext high-fidelity 2X PCR master mix. Finally, the PCR products were purified using a High Sensitivity DNA assay Kit (Agilent Technologies, Lithuania) and sequenced on the Hi-Seq 2500 platform (Illumina Inc., San Diego, CA, USA).
The raw data generated from the Illumina sequencer were filtered with the fastp program. Low-quality data filtering included removing reads with adapter, reads containing more than 10% of N and reads containing more than 50% bases with a quality value of less than 20 to obtain clean reads for subsequent bioinformatic analysis. To ensure the quality and quantity of the data, the minor allele frequency (MAF) was below 0.01. With the population RAD-tags set as a reference, the Burrows–Wheeler Aligner (BWA) was used to compare reads of each sample in the population, and GATK, a mutation detection software, was used to detect SNP in the population.
2.3. Genetic Diversity and Population Structure
SNPs obtained by sequencing were used to evaluate population genetic statistics, including average nucleotide diversity (Pi), observed heterozygosity per locus (Ho), expected heterozygosity (He), and Wright’s inbreeding coefficient (FIS). Pairwise F-statistics (FST) among the four populations were performed using the Arlequin v3.5 [7]. In addition, to detect within and among populations genetic variance components, molecular variance (AMOVA) was analyzed using the StAMPP v1.6.3 [8].
A neighbor-joining (NJ) tree was constructed to cluster the populations using TreeBest software. Based on SNP differences between individuals, principal components analysis (PCA) can cluster individuals into different subgroups according to different traits. PCA analysis was conducted by software GCTA v1.93.2 [9], and the scatter plotting was performed with the first and second components using the Ggplot2 package [10] in R. The Admixture software [11] was used to constructed population structure in order to analyze the ancestral components of the 40 individuals and visualized using R. Considering the complex history of the Tarim River, such as multiple water diversion projects, there may be more than four populations. Therefore, the default K value was set as 1–9, the bootstrap value was set as 1000 and other parameters were set as default. The optimal K value was determined by a cross-validation error of the software.
2.4. SSR Loci Detection and SSR Marker Development
Microsatellite mining (http://pgrc.ipk-gatersleben.de/misa/ (accessed on 9 November 2020)) was performed using the Microsatellite (MISA) identification tool, Primer3 V2.3.6 [12] for each SSR primer pair at default Settings design, the size of the PCR products between 100~300 bp. Locus polymorphism screening mainly included singleness and polymorphism screening. Singleness was determined by agarose gel after PCR and whether the product is single or not. The polymorphic screening was performed by agarose electrophoresis after PCR with fluorescent primers to determine whether the peak types were qualified or polymorphic.
3. Results
3.1. RAD Sequencing and Data Quality
Forty H. leucisculus were sequenced using RAD-seq. The sequence results showed that 632,037,408 clean reads were obtained, with an average number of 15,800,935 samples, and the average quality of Q20 was 96.91%. The average quality of Q30 was 91.57%. The average GC content was 39%, indicating that the difference before and after filtration is very small. Q20 and Q30 were both at a high level, and GC content was low, which proved that the sequencing quality was up to standard, the base error rate was very low and the sequencing information was reliable (Table 1).

Table 1.
Statistics of genomic sequences generated by RAD-seq.
Population SNP spectrum analysis (Figure 2) showed that SNP mutations could be divided into 12 categories, with A/C (10.90%), C/A (10.58%), C/T (14.02%), G/A (13.99%) and T/C (10.65%) as the main types of SNP mutations. Transversions (Tv) was larger than transition (Ti), accounting for 50.43% of SNP, and the ratio of Ti to Tv is 0.98.
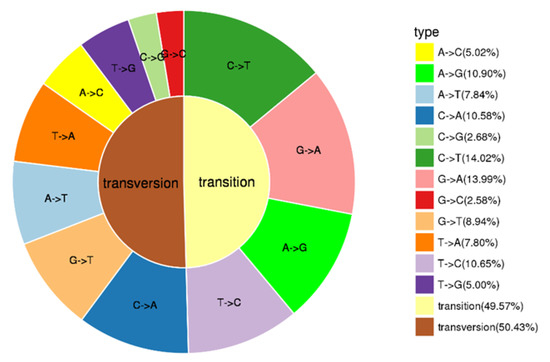
Figure 2.
Types of SNPs.
3.2. Genetic Diversity and Genetic Differentiation Analysis
The genetic diversity of 40 H. leucisculus populations was analyzed. The results showed that the population genetic diversity level of H. leucisculus was low. The nucleotide diversity (Pi) of the populations ranged from 0.000964 to 0.001144, which was highest in TTMH. The observed heterozygosity (Ho) across all populations ranged from 0.0593 to 0.0774, with an average of 0.0672. Ho was lowest in YBZ (0.0593) and highest in TTMH (0.0774). Expected heterozygosity (He) ranged from 0.1925 to 0.2055. He was lowest in YBZ (0.1925) and highest in TTMH (0.2055). The individual inbreeding coefficients (FIS) of the populations ranged from 0.402 to 0.7016 (Table 2). The Ho of the four populations was lower than the He, and FIS was greater than 0, indicating that heterozygote deletion existed in H. leucisculus population. Pi was lower than 0.005, which showed that the genetic diversity of H. leucisculus population was relatively weak. TTMH had the highest Ho, He and Pi, indicating that the population had the highest genetic diversity.
Table 2.
The statistical values of genetic diversity among different clusters of H. leucisculus.
The population pairwise FST values varied from 0.231 to 0.258 (Table 3). Significant genetic differentiation was observed in all population pairs. The lowest FST values were between QL and TTMH and highest FST values were between THY and YBZ. In addition, to detect genetic variance components within and among populations, AMOVA was conducted (Table 4). AMOVA showed that the genetic variation within populations accounted for 92.31% of total variation, and 7.69% of variation was distributed among populations.
Table 3.
Pairwise FST among four populations of H. leucisculus.
Table 4.
Analyses of molecular variance (AMOVA) of H. leucisculus.
3.3. Population Structure Analysis
According to the SNP information generated form RAD-seq, the NJ tree was performed in the 40 individuals (Figure 3A). The NJ tree was supported by bootstrapping (>70%; Figure 3A). The results showed that the forty individuals could be grouped into two clusters (upper–middle and downstream populations). TTMH formed a cluster (cluster 1), and the other populations formed a large group (cluster 2). However, to some extent some individuals from TTMH can be clustered into the large cluster 2 (QL, THY, YBZ) together, which indicated that TTMH did not split as a whole and the four populations had a contact. The results of the PCA scatter plot, of which principal factor 1 explained 3.55% and principal factor 2 explained 3.16% of the overall variance, were consistent with NJ tree (Figure 3B). The PCA indicated that QL, THY and YBZ were clustered closely and showed a highly mixed state. In addition, the individuals from TTMH clustered together with other populations, but they had a bigger geographic distance than the other populations. The results of PCA were consistent with the NJ tree.
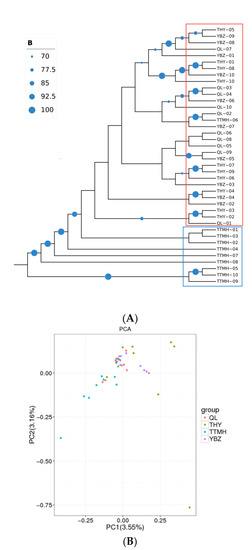
Figure 3.
The NJ tree of 40 individuals based on SNPs (A) and the PCA plotting of the individuals from different locations (B). The size of the blue circle at the node represents the size of the bootstrap value and squares with different colors represent different clusters (blue: cluster 1; red: cluster 2) in (A).
To further reveal the genetic structure of 40 individuals, the cluster analysis was conducted (K = 1~9). The CV error showed the lowest value with K = 9 and indicated that the optimal cluster number was nine genetic clusters (Figure 4B). When the K value was 3, the component of ancestry of most individuals from TTMH and YBZ was similar compared with QL and THY. When the K value was 6, the component of ancestry information of QL, THY and TTMH was similar except YBZ. Notably, TTMH formed a cluster compared with the other locations, which corresponded with the results of NJ tree and PCA plotting. When the K value was 9, several individuals had the admixture ancestry composition, such as THY-02, TTMH-08 and TTMH-10, which indicated that there could have been four different ancestries (Figure 4A).
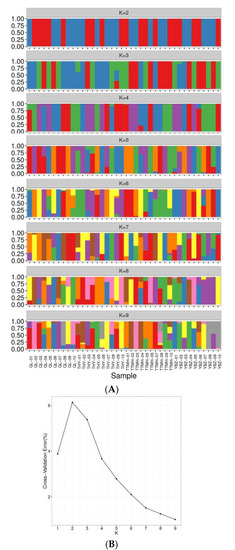
Figure 4.
Analysis of the population structure from four locations. (A): Population structure of 40 individuals from different sites. (B): The admixture validation error rate corresponding to the different K values.
3.4. Frequency of SSRs in H. leucisculus
The study detected a total of 147,705 potential simple sequence repeats in 1,533,492 fragments (Table 5). The unit size of SSRs varied from 1 to 6, including 25,576 (17.32%) mono-nucleotide motifs, 64,803 (41.68%) di-nucleotide motifs, 29,974 (20.29%) tri-nucleotide motifs and 22,566 (15.28%) tetra-nucleotide motifs. There were 3947 (2.67%) penta-nucleotide motifs and 839 (0.57%) hexa-nucleotide sequences. The motif (AC/GT) was the most abundant repeating type, accounting for 26.7%, was followed by A/T (25242, 17.1%), AAG/CTT (17942, 12.1%), AG/CT (15646, 10.6%), AT/AT (9439, 6.4%) and AAAT/ATTT (6046, 4.1%) (Figure 5).
Table 5.
Detection results of SSR loci in H. leucisculus.
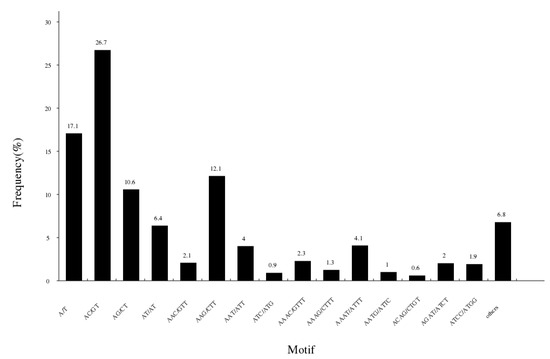
Figure 5.
Characterization and frequency of microsatellites with different motif sizes.
3.5. SSR Marker Development and Characterization
The Primer3 V2.3.6 was used to develop SSR primer pairs using 147,705 sequences containing SSRs (Table 5). Finally, 22,651 pairs of primer pairs were successfully designed, and 17,211 locus-specific primer sets were retained after strict filtering.
In order to verify the value of these primers via PCR, 10 primers pairs were randomly selected and synthesized to substantiate in forty H. leucisculus individuals. Among the 10 primers, 6 pairs of H. leucisculus genomic DNA were successfully amplified by PCR, while the other 4 pairs of primers could not obtain PCR products (Table 6). Most successful primer pairs amplified expected size bands.
Table 6.
The messages of 6 working SSR primer pairs from 10 synthesized primers.
This proved that the ability of high-throughput sequencing identifies genes in non-model organisms [13]. These results will provide valuable tools for future genetic studies at H. leucisculus.
4. Discussion
RAD-seq technology includes the lower cost acquisition of DNA sequence data from multiple sites in the genome, simpler library preparation processes, the simplified management of genomic data and improved pipelines for data processing and analysis [14]. It can be used to identify and genotype large numbers of SNPs [15]. SNP refers to the DNA sequence polymorphism formed due to nucleotide variation. SNP has the characteristics of a large number, wide distribution and high diversity in biological individuals and plays an important role in the fields of life science and molecular breeding [16]. Though RAD-seq requires considerable sequencing effort per individual compared with ddRAD, the values of commonly used summary statistic, Pi, Tajima’s D and FST of RAD-seq has lower deviation than ddRAD [17,18]. In this study, forty H. leucisculus individuals were sequenced using RAD-seq and a total of 7,291,260 high-quality SNPs were detected, which provided the basis for molecular marker development, population differentiation and the invasion analysis of the Tarim River H. leucisculus in Xinjiang.
Genetic diversity research can reveal the status quo of species germplasm resources, genetic diversity and phylogenetic evolution of species [19]. Due to the lack of the genome-wide sequence of H. leucisculus, the RAD-seq method was chosen to analyze the population genetic diversity of H. leucisculus in this study. According to Ichikawa et al. the genetic diversity of H. leucisculus populations in Tarim River was low (Pi < 0.005) [20]. Genetic diversity is one of the most important factors affecting the success of invasive species [21]. It is traditionally believed that rich genetic diversity will help alien species adapt to new habitats and establish and maintain new population sizes [22]. We examined the relevant information that the Pi of H. leucisculus in the Huaihe River basin was low, while that in the Yangtze River was high (Pi = 0.03289) [23,24]. The reason could be that compared with the Yangtze River basin, the unstable water environment in the Tarim and Huaihe River basins makes fish resources vulnerable to environmental changes, leading to a decrease in genetic diversity [21]. In addition, H. leucisculus may have been affected by the founder effect during the invasion of the Tarim River, resulting in lower genetic diversity than in the Yangtze River basin [25,26]. The FIS in populations can directly indicate the loss or surplus of heterozygotes. The FIS values for the four populations were greater than 0, indicating that the H. leucisculus population had different degrees of heterozygote loss. Combined with Ho < He, there was a certain degree of inbreeding. The FST value has three levels of different genetic differentiation: moderate differentiation was 0.05 to 0.15, larger differentiation was 0.15 to 0.25 and high differentiation was greater than 0.25 [27]. In fact, RAD-seq has the drawbacks that missing data tends to inflate estimates of FST [17]. Therefore, the genetic differentiation of H. leucisculus may be at a moderate level. Combined with low genetic diversity, the high FST values (FST = 0.243) among these populations may be caused by habitat fragmentation in the Tarim River basin [28,29,30]. In addition, we noticed that the genetic differentiation of H. leucisculus was lower in the lower reaches than in other regions. This could be that the upstream terrain is more rugged than the downstream. Rugged reaches promote genetic differentiation, and gentle reaches are more conducive to gene flow [31].
Combined with the results of NJ tree and PCA, the individuals from TTMH showed differences and had a bigger geographic distance than the others. The genetic differentiation pattern of fish is usually consistent with the water system pattern of distribution [32,33]. It could be explained by the reason that due to the large-scale diversion and interception of water in the middle and upper reaches of the Tarim River, the lower reaches of Tarim River have been cut off [28,34,35]. It was not until 2000~2006 that the Lower Tarim River Emergency Water Transfer transferred water from Bosten Lake to Taitema Lake that this phenomenon was alleviated [36,37]. Therefore, geographic isolation led to a clear differentiation of TTMH populations. In addition, the result of population structure analysis showed that the degree of mixed blood among individuals was high, indicating frequent gene exchange. This could be because Taitema Lake is located at the end of the Tarim River, and the alluvial plain formed by three water systems of Tarim River, Qarqan River and Altun Rivers, with frequent water exchange [35]. There was increased gene flow between populations during floods [38,39,40].
H. leucisculus is an invasive species in the Tarim River system of Xinjiang. According to the population structure analysis, it was inferred that the origin of the four sites was the same species. Compared with the others, TTMH had some genetic differences. Dong et al. showed that human impact index (HII) was the most important factor affecting H. leucisculus invasion among the determinants of H. leucisculus invasion [41]. The water diversion project transferred water from Bosten Lake to Taitema Lake. In 1958, Bosten Lake introduced Cyprinus carpio, Carassius auratus, Hypophthalmichthys molitrix and Hypophthalmichthys nobilis directly or indirectly from the Yangtze River basin for economic benefits and H. leucisculus and Bosten male fish in the pond dominated [42,43]. High natural diffusion and human translocation are conducive to gene flow and high genetic diversity among river basins, which might help retain the invasive potential [38]. Therefore, it is speculated that H. leucisculus from Bosten Lake entered Taitema Lake to breed and then expanded into the Tarim River.
SSR markers are one of the most widely used molecular markers and play an important role in genetic research. Traditional SSR development methods often needed to construct the genome enrichment library, and the hybridization screening and sequencing processes were time-consuming and laborious. Today, the development of high-throughput sequencing technology and the sharp reduction of cost create better conditions for the development of SSR markers, which have the advantages of short development cycle, high yield and excellent flexibility [44]. In recent years, the technology of developing SSR markers using RAD to simplify genome sequencing has become increasingly mature, and there are more and more reports concerning it. Qu et al. used RAD-Seq to perform simplified genome sequencing on Indonesian tigerfish (Datnioides Pulcher), and a total of 26,359 SSR loci were detected through sequence analysis [45]. Wang et al. identified a total of 466 983 SSR loci by analyzing the RAD simplified genome sequencing data of Pelteobagrus Wallis [46]. At present, there are few reports about the development of H. leucisculus SSR markers. In this study, 22,651 SSR primers were designed to meet the primer development conditions by analyzing the simplified genome sequence of H. leucisculus. These results provide a basis for the development of H. leucisculus new primers.
5. Conclusions
In the study, low levels of genetic diversity were observed among four populations in the Tarim River. Major genetic variations originated from within populations variation and moderate genetic differentiation among these populations was observed. The four populations were able to be separated into two clusters (upper–middle and downstream populations), and the individuals from TTMH clustered and had a bigger geographic distance than the others. There is the probability that the H. leucisculus from Bosten Lake entered Taitema Lake to breed and then expanded into the Tarim River due to the water diversion projects in location. In addition, 147,705 SSRs loci were detected and 22,651 SSR primer pairs were developed. This study provides valuable genetic information for the management of wild populations, marker-assisted selection and resource exploitation of H. leucisculus.
Author Contributions
S.S. and Z.H. conceived the study. Z.L., L.L. and X.L. collected the samples. S.S. analyzed the data and wrote the manuscript. Q.Z., B.H., D.L. and R.T. contributed greatly to modifying the manuscript. All authors have read and agreed to the published version of the manuscript.
Funding
This work was supported by The Finance Special Fund of the Ministry of Agriculture and Rural Affairs “Fisheries Resources and Environment Survey in the Key Water Areas of Northwest China” (No. 2130111).
Institutional Review Board Statement
Not applicable.
Informed Consent Statement
Not applicable.
Data Availability Statement
The raw genome sequencing datasets generated during the current study have been submitted to the NCBI Sequence Read Archive (SRA) and are available online at http://www.ncbi.nlm.nih.gov/bioproject/848648 (accessed on 30 June 2022).
Conflicts of Interest
The authors declare no conflict of interest.
References
- Li, Q.; Zhao, J. Primary study on age, growth and life history types of Hemiculter leucisculus. In Proceedings of the Seventh General Meeting of the Ichthyology Branch of the Chinese Society for Marine and Lake Marsh Zoology and Symposium on the 110th Birthday Anniversary of Professor Zhu Yuanding, Shanghai, China, 22–24 October 2006. [Google Scholar]
- Xie, Z.Y.; Wu, X.F.; Zhuang, L.H.; Li, D.S. Investigation of the biology of Hemiculter leucisculus (Basilewsky) in Fen River Reservoir. Period. Ocean. Univ. China 1986, 4, 54–69. [Google Scholar]
- Li, B.L.; Wang, Y.T. Biology of sliver fish in Dalai Lake. Chin. J. Fish. 1995, 2, 46–49. [Google Scholar]
- O’Connell, M.; Dillon, M.C.; Wright, J.M.; Bentzen, P.; Merkouris, S.; Seeb, J. Genetic structuring among Alaskan Pacific herring populations identified using microsatellite variation. J. Fish Biol. 1998, 53, 150–163. [Google Scholar] [CrossRef]
- Pandolfi, V.C.F.; Yamachita, A.L.Y.; Souza, F.P.D.; Godoy, S.M.D.; Lima, E.C.S.D.; Felicaiano, D.C.; Pereira, U.D.P.; Povh, J.A.; Ayres, D.R.; Bignardi, A.B.; et al. Development of microsatellite markers and evaluation of genetic diversity of the Amazonian ornamental fish Pterophyllum scalare. Aquac. Int. 2021, 29, 2435–2449. [Google Scholar] [CrossRef]
- Willing, E.; Hoffmann, M.; Klein, J.D.; Weigel, D.; Dreyer, C. Paired-end RAD-seq for de novo assembly and marker design without available reference. Bioinformatics 2011, 27, 2187–2193. [Google Scholar] [CrossRef] [PubMed]
- Excoffier, L.; Lischer, H.E.L. Arlequin suite ver 3.5: A new series of programs to perform population genetics analyses under Linux and Windows. Mol. Ecol. Resour. 2010, 10, 564–567. [Google Scholar] [CrossRef]
- Pembleton, L.; Cogan, N.O.I.; Forster, J.W. StAMPP: An R package for calculation of genetic differentiation and structure of mixed-ploidy level populations. Mol. Ecol. Resour. 2013, 13, 946–952. [Google Scholar] [CrossRef]
- Yang, J.; Lee, S.H.; Goddard, M.E.; Visscher, P.M. GCTA: A tool for genome-wide complex trait analysis. Am. J. Hum. Genet. 2011, 88, 76–82. [Google Scholar] [CrossRef]
- Ginestet, C. ggplot2: Elegant Graphics for Data Analysis. J. R. Stat. Soc. 2011, 174, 245–246. [Google Scholar] [CrossRef]
- Alexander, D.H.; Lange, K. Enhancements to the ADMIXTURE algorithm for individual ancestry estimation. BMC Bioinform. 2011, 12, 246. [Google Scholar] [CrossRef]
- Andreas, U.; Ioana, C.; Triinu, K.; Jian, Y.; Brant, C.F.; Maido, R.; Steven, G.R. Primer3—New capabilities and interfaces. Nucleic Acids Res. 2012, 40, e115. [Google Scholar]
- Feng, J.; Zhao, S.; Li, M.; Zhang, C.; Qu, H.; Li, Q.; Li, J.; Lin, Y.; Pu, Z. Genome-wide genetic diversity detection and population structure analysis in sweetpotato (Ipomoea batatas) using RAD-seq. Genomics 2019, 112, 1978–1987. [Google Scholar] [CrossRef]
- Liu, C.; Chen, H.; Ren, Z.; Zhang, C.; Yang, X. Population genetic analysis of the domestic Bactrian camel in China by RAD-seq. Ecol. Evol. 2019, 9, 11232–11242. [Google Scholar] [CrossRef] [PubMed]
- Sherman, K.D.; Paris, J.R.; King, R.A.; Moore, K.A.; Dahlgren, C.P.; Knowles, L.C.; Stump, L.; Tyler, C.R.; Stevens, J.R. RAD-Seq Analysis and in situ Monitoring of Nassau Grouper Reveal Fine-Scale Population Structure and Origins of Aggregating Fish. Front. Mar. Sci. 2020, 7, e157. [Google Scholar] [CrossRef]
- Liu, X.; Zhang, A.; Shang, J.; Zhu, Z.; Tan, F.; Wang, Y.; Jiang, J.; Li, Y.; Zha, D.; Wu, X. Analysis of Genetic Diversity and Population Structure of Eggplant (Solanum melongena L.) Based on RAD-seq. Mol. Plant Breed. 2022, 5692–5702. [Google Scholar]
- Arnold, B.; Corbett-detig, B.R.; Hartl, D.; Bomblies, K. RADseq underestimates diversity and introduces genealogical biases due to nonrandom haplotype sampling. Mol. Ecol. 2013, 22, 3179–3190. [Google Scholar] [CrossRef]
- Nousias, O.; Oikonomou, S.; Manousaki, T.; Papadogiannis, V.; Angelova, N.; Tsaparis, D.; Tsakogiannis, A.; Duncan, N.; Estevez, A.; Tzokas, K.; et al. Linkage mapping, comparative genome analysis, and QTL detection for growth in a non-model teleost, the meagre Argyrosomus regius, using ddRAD sequencing. Sci. Rep. 2022, 12, 5301. [Google Scholar] [CrossRef] [PubMed]
- Dai, Y.; Xiao, H. Review of Studies on the Germplasm Resources of the Schizothoracinae Fishes. Chin. Agric. Sci. Bull. 2011, 32, 38–46. [Google Scholar]
- Ichikawa-Seki, M.; Tokashiki, M.; Opara, M.N.; Iroh, G.; Hayashi, K.; Kumar, U.M.; Itagaki, T. Molecular characterization and phylogenetic analysis of Fasciola gigantica from Nigeria. Parasitol. Int. 2017, 66, 893–897. [Google Scholar] [CrossRef]
- Kolbe, J.J.; Glor, R.E.; Schettino, L.R.; Lara, A.C.; Larson, A.; Losos, B.J. Genetic variation increases during biological invasion by a Cuban lizard. Nature 2004, 431, 177–181. [Google Scholar] [CrossRef]
- Xu, C.; Zhang, W.; Lu, B.; Chen, J. Progress in studies on mechanisms of biological invasion. Biodivers. Sci. 2001, 4, 430–438. [Google Scholar]
- Fang, D.; Gu, Q.; Zhou, C.; Meng, X.; Li, X.; Nie, G. Genetic Diversity of Hemiculter leucisculus in Fountainhead Area of Huaihe River. Fish. Sci. 2018, 5, 665–673. [Google Scholar]
- Fan, Q.; He, S. The pattern of upper and middle Yangtze drainges shapes the genetic structure and diversity of Hemiculter leucisculus revealed by mitochondrial DNA locus. Acta Hydrobiol. Sin. 2014, 4, 627–635. [Google Scholar]
- Liu, H.; Li, C.; Xiong, F. Population genetic structure of Neosalanx taihuensis between invasive and original areas revealed by microsatellite DNA. J. Fish. China 2016, 10, 1521–1530. [Google Scholar]
- Shi, W.; Geng, Y.; Ou, X. Genetic diversity and invasion success of alien species: Where are we and where should we go? Biodivers. Sci. 2010, 6, 590–597. [Google Scholar]
- Fang, F.; Chen, X.; Lv, J.; Shi, X.; Feng, X.; Wang, Z.; Li, X. Population Structure and Genetic Diversity of Chinese Honeybee (Apis Cerana Cerana) in Central China. Genes 2022, 13, 1007. [Google Scholar] [CrossRef]
- Fraik, A.K.; McMillan, J.R.; Liermann, M.; Bennett, T.; McHenry, M.L.; McKinney, G.J.; Wells, A.H.; Winans, G.; Kelley, J.L.; Pess, G.R.; et al. The Impacts of Dam Construction and Removal on the Genetics of Recovering Steelhead (Oncorhynchus mykiss) Populations across the Elwha River Watershed. Genes 2021, 12, 89. [Google Scholar] [CrossRef]
- Valenzuela-Aguayo, F.; McCracken, G.R.; Manosalva, A.; Habit, E.; Ruzzante, D.E. Human-induced habitat fragmentation effects on connectivity, diversity, and population persistence of an endemic fish, Percilia irwini, in the Biobío River basin (Chile). Evol. Appl. 2019, 13, 794–807. [Google Scholar] [CrossRef]
- Wu, X.; Luo, J.; Huang, S.; Chen, Z.; Xiao, H.; Zhang, Y. Molecular Phylogeography and Evolutionary History of Poropuntius huangchuchieni (Cyprinidae) in Southwest China. PLoS ONE 2013, 8, e79975. [Google Scholar] [CrossRef]
- Tea, T.; Špoljar, M.; Kattakulov, F.; Tena, R.; Daniel, M. Interactions between Fish and Invertebrates in the Lowland Area of the Sava River following Excessive Change in Hydrological Regime. Hydrobiology 2022, 1, 196–210. [Google Scholar]
- Yang, L.; Hu, J.; Qin, C.; Zhang, Y.; Lu, R.; Meng, X.; Yang, G.; Yan, X.; Zhi, S.; Nie, G. Genetic structure analysis of Pseudorasbora parva in the four major river systems in Yunnan based on mitochondrial Cyt b. J. Fish. China 2020, 3, 339–350. [Google Scholar]
- Soliman, T.; Aly, W.; Fahim, R.M.; Berumen, M.L.; Jenke-Kodama, H.; Bernardi, G. Comparative population genetic structure of redbelly tilapia (Coptodon zillii (Gervais, 1848)) from three different aquatic habitats in Egypt. Ecol. Evol. 2017, 7, 11092–11099. [Google Scholar] [CrossRef] [PubMed]
- Xu, H.; Ye, M.; Song, Y.; Bai, Y. Characteristic Analysis on Hydrological Processes of Tarim River Basin. J. Soil Water Conserv. 2005, 19, 156–159. [Google Scholar]
- Zhou, X.; Yi, S.; Zhao, W.; Zhou, Q.; Shen, J.; Li, D.; Huo, B.; Tang, R. Genetic Diversity and Population Differentiation of Kashgarian Loach (Triplophysa yarkandensis) in Xinjiang Tarim River Basin. Biology 2021, 10, 734. [Google Scholar] [CrossRef]
- Chen, G. Taitema Lake surface area and main recharge water sources. Water Conserv. Sci. Technol. Econ. 2016, 22, 41–44. [Google Scholar]
- Shi, L.; Tuerxun, H.; Han, G. Effect of Ecological Water Delivery in Lower Reaches of Tarim River on Environmental Dynamic State and Its Control Measures. Xinjiang Agric. Sci. 2008, 45, 926–933. [Google Scholar]
- Moy, K.M.; Brasil, L.S.; Oliveira-Junior, J.M.B.; June, L.; Vieira, T.B.; Dias-Silva, K. Effects of Environmental Changes on Gerromorpha (Heteroptera: Hemiptera) Communities from Amazonian Streams. Hydrobiology 2022, 1, 111–121. [Google Scholar] [CrossRef]
- Fargeot, L.; Loot, G.; Prunier, J.G.; Rey, O.; Charlotte, V.; Blanchet, S. Patterns of Epigenetic Diversity in Two Sympatric Fish Species: Genetic vs. Environmental Determinants. Genes 2021, 12, 107. [Google Scholar] [CrossRef]
- David, D.; Garmona-Catot, G.; Araguas, R.; Vidal, O.; Sanz, N.; Emili, G.; Jose-Luis, G. Gene Flow and Maintenance of Genetic Diversity in Invasive Mosquitofish (Gambusia holbrooki). PLoS ONE 2013, 8, e82501. [Google Scholar]
- Dong, X.; Ju, T.; Grenouillet, G.; Laffaille, P.; Lek, S.; Liu, J. Spatial pattern and determinants of global invasion risk of an invasive species, sharpbelly Hemiculter leucisculus (Basilesky, 1855). Sci. Total Environ. 2019, 711, e134661. [Google Scholar] [CrossRef]
- Chen, P.; Ma, Y.; Xie, C.; Qi, F. Preliminary study on community structure of fishes in Bositeng Lake. Freshw. Fish. 2014, 44, 36–42. [Google Scholar]
- Chen, G.; Qiu, Y.; Li, L. Fish invasions and changes in the fish fauna of the Tarim Basin. Acta Ecol. Sin. 2017, 37, 700–714. [Google Scholar]
- Yang, B.; Xu, Q.; Niu, M.; Lou, X.; Huang, H.; Tong, Z.; Lin, E. Analysis of SSR Information in Transcriptome and Development of SSR Molecular Markers in Rhododendron fortunei. J. Nucl. Agric. Sci. 2018, 32, 2335–2345. [Google Scholar]
- Qu, Z.; Song, H.; Wang, X.; Liu, Y.; Mou, X.; Liu, C.; Hu, Y. Preliminary screening and characterization of microsatellite markers in RAD-seq data of Datnioides pulcher. Freshw. Fish. 2019, 49, 9–15. [Google Scholar]
- Wang, Q.; Guo, W.; Cheng, W.; Deng, G.; Xu, H.; Xia, R. Isolation of microsatellite markers for Pelteobagrus vachellii based on RAD sequencing. Fish. Sci. Technol. Inf. 2021, 48, 250–254. [Google Scholar]


Publisher’s Note: MDPI stays neutral with regard to jurisdictional claims in published maps and institutional affiliations. |
© 2022 by the authors. Licensee MDPI, Basel, Switzerland. This article is an open access article distributed under the terms and conditions of the Creative Commons Attribution (CC BY) license (https://creativecommons.org/licenses/by/4.0/).