Abstract
Long-non-coding RNA (lncRNA) is a transcription product that exerts its biological functions through a variety of mechanisms. The occurrence and development of a series of human diseases are closely related to abnormal expression levels of lncRNAs. Scientists have developed many computational models to identify the lncRNA-disease associations (LDAs). However, many potential LDAs are still unknown. In this paper, a novel method, namely MSF-UBRW (multiple similarities fusion based on unbalanced bi-random walk), is designed to explore new LDAs. First, two similarities (functional similarity and Gaussian Interaction Profile kernel similarity) of lncRNAs are calculated and fused linearly, also for disease data. Then, the known association matrix is preprocessed. Next, the linear neighbor similarities of lncRNAs and diseases are calculated, respectively. After that, the potential associations are predicted based on unbalanced bi-random walk. The fusion of multiple similarities improves the prediction performance of MSF-UBRW to a large extent. Finally, the prediction ability of the MSF-UBRW algorithm is measured by two statistical methods, leave-one-out cross-validation (LOOCV) and 5-fold cross-validation (5-fold CV). The AUCs of in LOOCV and 0.9183 in 5-fold CV confirmed the reliable prediction ability of the MSF-UBRW method. Case studies of three common diseases also show that the MSF-UBRW method can infer new LDAs effectively.
1. Introduction
Long-non-coding RNAs (lncRNAs) are long chains composed of nucleotides, with a wide range of actions and complex mechanisms. They get involved in many critical regulatory processes [1,2,3,4] and have attracted the attention of many life scientists and biologists in recent years. Studies have found that mutations and disorders of lncRNAs are bound up with the occurrence of human diseases [5,6], including AIDS [7], diabetes [8], Alzheimer’s disease [9], and many types of cancer, such as breast cancer [10], prostate [11], hepatocellular [12], and bladder cancer [13]. Many associations between lncRNAs and diseases and how they interact have also become a good breakthrough for researchers to understand the pathogenesis of diseases from the molecular level.
Although the research on identifying human lncRNA-disease associations (LDAs) progresses rapidly, the precise principles behind it remain largely unclear, such as transcriptional regulation, multi-biological processes, and molecular mechanisms of various diseases [14]. Predicting the undiscovered LDAs can help people figure out the pivotal factor of lncRNAs in biological processes, thus helping with the diagnosis, treatment, and prognosis of diseases. Using computational models to predict potential LDAs takes far less time and cost than biological experiments. Therefore, it is of great significance to study computational models to reveal new LDAs for further experimental verification. Scientists have done a lot to the research of lncRNA-disease relationship, and many excellent predictive models have appeared [15,16,17]. Existing models for predicting LDAs mainly fall into two categories: machine learning-based methods and biological network-based methods [18]. Machine learning-based methods play an important role in predicting LDAs. Classifiers can be trained based on the characteristics of known disease-associated lncRNAs and those of unknown disease-associated lncRNAs. Candidate lncRNAs can be ranked in line with the differences of biological characteristics. Lan et al. [19] developed a supervised method: LDAP, which integrated multivariate biological data. In this method, the bagging support vector machine (SVM) was trained to predict LDAs. Multiple training datasets are constructed by bagging method, and each dataset is trained by SVM to generate multiple weak classifiers, which vote on the category of test samples. Chen et al. [20] proposed a computational method: Laplacian Regularized Least Squares for LDA (LRLSLDA). This method was based on a semi-supervised learning framework to predict new LDAs and achieved reliable performance. However, LRLSLDA still has some limitations. For example, there are many parameters in the method, and it is very difficult to determine the optimal parameters. In addition, for the same LDA pair, two different scores can be obtained from the lncRNA space and the disease space, respectively. How to efficiently combine the two scores has become a current research topic. Gao et al. designed a method: Multi-Label Fusion Collaborative matrix factorization (MLFCMF) [21] to identify LDAs. First, the inner links between lncRNAs and diseases were improved and the hidden information was discovered by multi-label learning. Second, the fusion method was used to learn the multi-label information. Finally, potential LDAs were inferred by collaborative matrix factorization. Fu et al. [17] reconstructed the LDA matrix by the optimized low-rank matrices to identify latent LDAs. Lu et al. [22] proposed a method to recover informative features by principle components analysis and complement the LDA matrix derived from the inductive matrix completion. For the machine learning-based methods, the main challenge is how to select useful biometrics to train the classifier. Therefore, integrating multiple data resources can effectively improve prediction performance. Biswas et al. [23] designed a novel method for predicting potential LDAs based on matrix factorization. The model integrated known LDAs, experimentally verified gene-disease associations, gene-gene interaction data, and the profiles of lncRNAs and genes. The bi-clustering method was used to identify lncRNA modules and non-negative matrix factorization (NMF) was used to reveal potential LDAs.
In recent years, the outstanding performance of network-based methods in predicting LDAs has aroused the researchers’ interest. Many excellent algorithms have emerged based on the hypothesis that functionally similar lncRNAs may be related to diseases with similar phenotypes. For example, Sun et al. [24] proposed a computing method, namely RWRlncD. In this study, after the establishment of the LDA network, the disease similarity network (DSN) and the lncRNA similarity network (LSN), RWRlncD predicted the potential LDAs by randomly walking on the LSN. It is worth noting that RWRlncD is robust to different parameters. As more LDAs and more accurate measures of the lncRNA functional similarity become available, the prediction ability of RWRlncD will be improved. Zhou et al. [25] also designed a novel model to identify potential LDAs. This model integrated three networks (i.e., the miRNA-associated lncRNA-lncRNA crosstalk network, the DSN and the known LDA network) into one network and conducted random walks on it. However, the method is only applicable to lncRNAs with known lncRNA–miRNA interactions. In addition, the incomplete coverage of the lncRNAs crosstalk network and the LDA network may reduce the prediction performance of the model. Xie et al. [26] developed a method to infer new LDAs. First, the features of lncRNAs and diseases were mapped to the features of local-constraint by location-constrained linear coding, and then the initial correlation matrix and the acquired features of lncRNAs and diseases were mixed up by the label propagation strategy. Xie et al. [18] also used the weighted K-nearest known neighbors algorithm (WKNKN) method to solve the problem with rare known LDAs and applied the linear neighbor similarity (LNS) to reconstruct the DSN and LSN. In 2020, Ref. [27] designed a method to reveal potential LDAs. The method combined the heat spread algorithm and probability diffusion algorithm to reallocate resources, and used unbalanced bi-random walks to infer new LDAs.
However, these methods have some drawbacks. For example, most methods only introduce Gaussian Interaction Profile (GIP) kernel similarity, which makes the prior information used for prediction too simple and single. In response to this question, we propose a new method called MSF-UBRW to infer potential LDAs based on multiple similarities fusion and unbalanced bi-random walk. First, the lncRNA functional similarity matrix is obtained from known LDA matrix. Second, the GIP kernel similarity of lncRNAs is calculated derived from known LDAs, and the logistic function is used to adjust the similarity of the lncRNA network. The same is true for the disease network. Third, linear fusion is performed for the above two similarities of lncRNAs and diseases, respectively. Then, the initial association probability matrix is calculated by WKNKN. Next, the pairwise linear neighborhood similarities of lncRNAs and diseases are calculated. Finally, LDAs are inferred by bi-randomly walking with different steps on the lncRNA network and the disease network. The main highlights of the MSF-UBRW method are as follows:
(1) Linear fusion was performed for lncRNA functional similarity and GIP kernel similarity of lncRNAs, as well as for disease semantic similarity and GIP kernel similarity of diseases. In addition to that, logistic functions are constructed from known LDAs to improve the topology structure of networks.
(2) So far, very few LDAs have been identified, which results in a sparse LDA matrix. WKNKN is used to preprocess the known LDA matrix to solve the sparse problem and obtain the association probability matrix.
(3) The linear neighbor similarity is applied to reconstruct the DSN and LSN.
The MSF-UBRW method achieves the reliable AUC values with and 0.9183 based on leave-one-out cross validation (LOOCV) and 5-fold cross validation (5-fold CV), respectively. In addition, case studies of three common diseases (prostate cancer, esophageal squamous cell carcinoma (ESCC), and small cell lung cancer (NSCLC)) further prove the prediction ability of the MSF-UBRW method. Experimental results demonstrate that MSF-UBRW is an effective and reliable method for identifying potential LDAs.
2. Materials and Methods
2.1. Datasets
The known LDA dataset is downloaded from the public database LncRNADisease [28]. Due to the database upgrade, you can also download the new dataset from the LncRNADisease V2.0 database. We can provide the data set used in the experiment, if you need. After removing the non-human items and duplicated data, we finally get the known human LDAs, including 115 kinds of lncRNAs and 178 kinds of diseases. Then, denotes the lncRNA set, and is the disease set. We can describe the known LDAs by constructing a dimensional adjacency matrix . If the lncRNA is related to the disease , ; otherwise, .
2.2. Disease Similarity
The disease similarity is usually described by directed acyclic graphs (DAGs) in recent research [18,21,27,28]. In this study, the disease similarity is obtained by the following steps. First, the MeSH descriptor for each disease is downloaded from the U.S. National Library of Medicine. Second, based on the precise classification and semantic information provided by the MeSH descriptor, we use the Directed Acyclic graphs (DAGs) to calculate the disease semantic similarity. Let is the DAG of the disease . In the expression above, the node set contains all the nodes, and the edge set contains all the direct links between nodes in the . For each disease , the semantic value can be defined as follows:
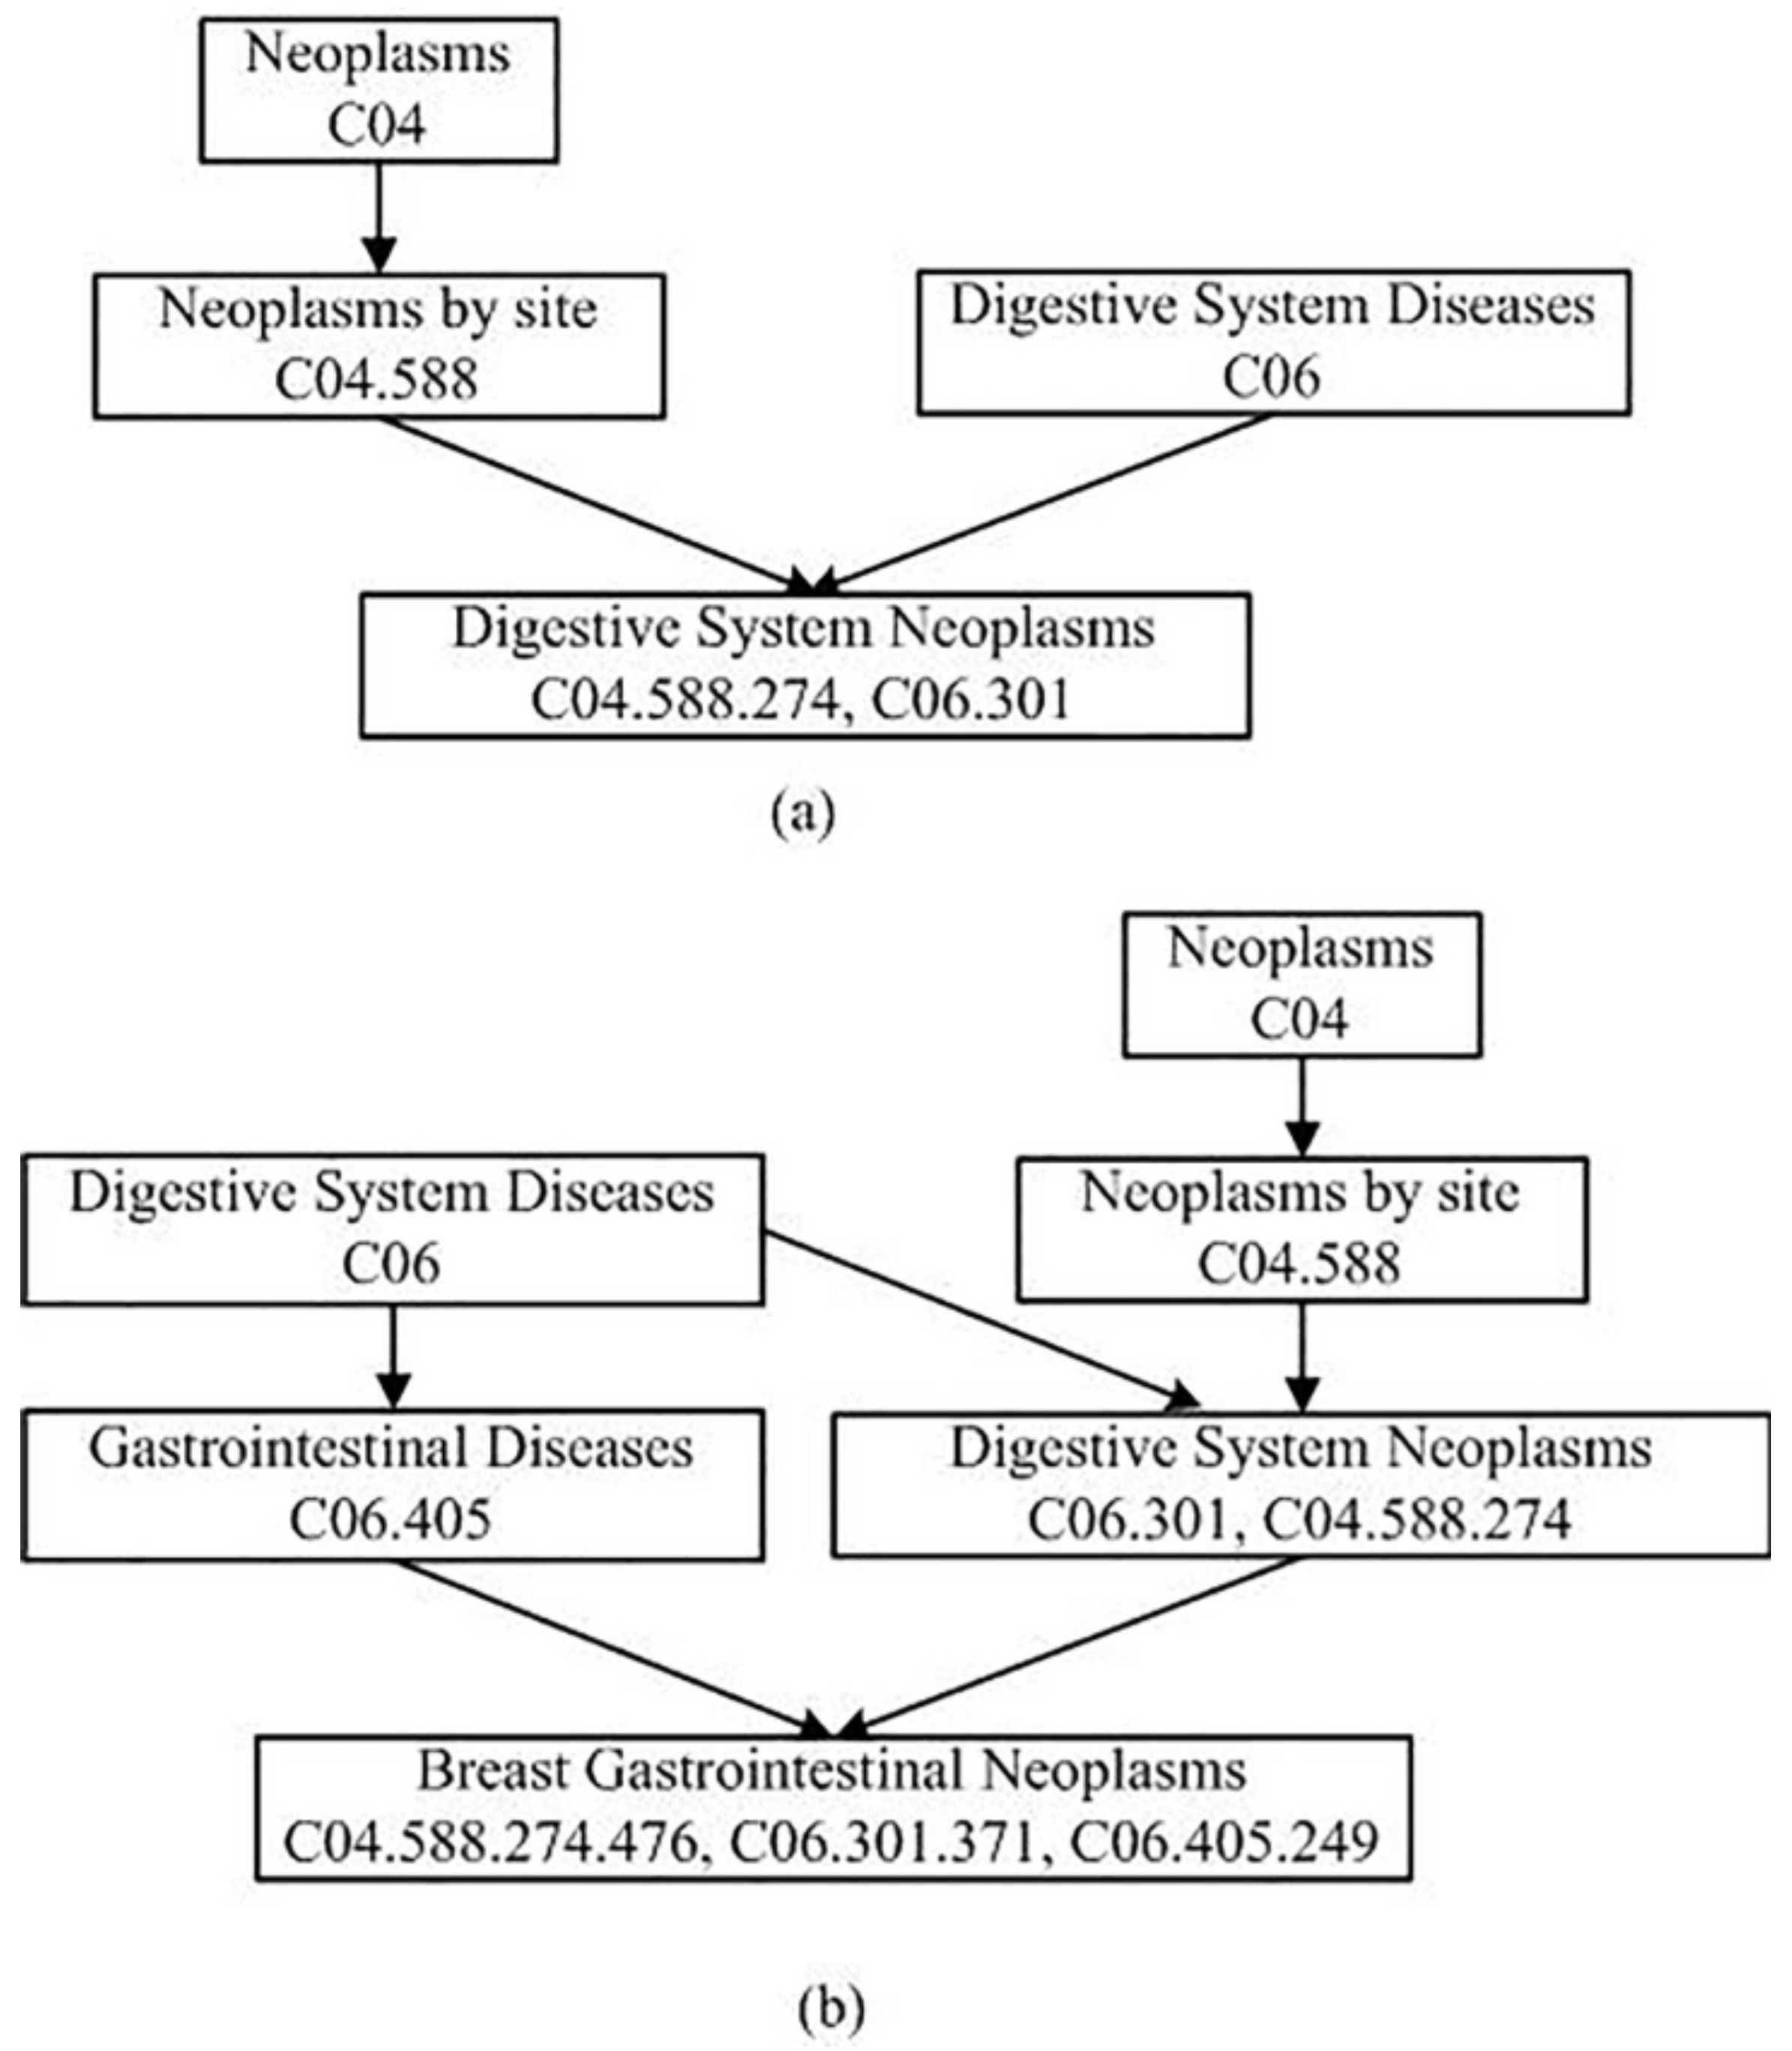
in (2) denotes the semantic contribution factor. According to the current research methods, we set to be 0.5. The node’s contribution to itself is defined as 1.0. The DAGs of the Digestive System Neoplasms and the Breast Gastrointestinal Neoplasms are illustrated in Figure 1. According to Figure 1, the semantic values of these two diseases can be calculated using Formulas (1) and (2). For Digestive System Neoplasms, (Digestive System Neoplasms) (Digestive System Diseases) + (Neoplasms by Site) + (Neoplasms). For Breast Gastrointestinal Neoplasms, (Breast Gastrointestinal Neoplasms) + (Gastrointestinal Diseases) + (Digestive System Diseases) + (Digestive System Neoplasms) + (Neoplasms by Site) + (Neoplasms) = 2.625.
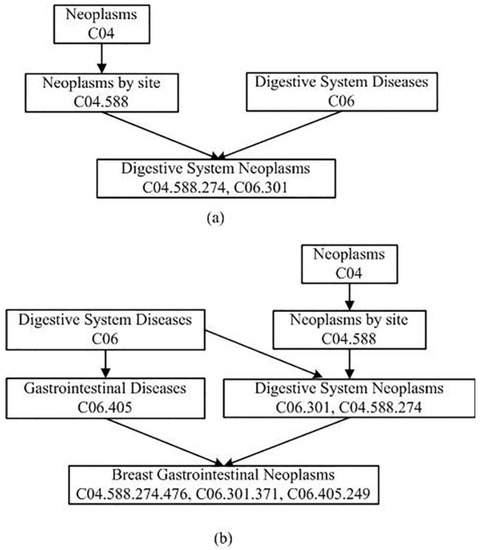
Figure 1.
DAGs of digestive system neoplasms and breast gastrointestinal neoplasms. (a) digestive system neoplasms. (b) breast gastrointestinal neoplasms.
Previous studies have shown that the more similar the structures of two diseases’ DAGs are, the greater the semantic contribution value will be. The semantic similarity between two diseases and can be calculated as the following formula:
where is the disease semantic similarity matrix.
As shown in Figure 1, there are four kinds of nodes in the gather . They are Neoplasms, Neoplasms by Site, Digestive System Diseases, and Digestive System Neoplasms. Therefore, = 1.0 (Digestive System Neoplasms) (Digestive System Diseases) (Neoplasms by Site) (Neoplasms) = 2.25, = (Digestive System Diseases) (Digestive System Neoplasms) (Neoplasms by Site) (Neoplasms) = 1.125. Finally, the semantic similarity between Digestive System Neoplasms and Breast Gastrointestinal Neoplasms is calculated according to the Formula (3): .
2.3. LncRNA Similarity
In previous studies, Chen et al. [29] proposed and tested the assumption that functionally similar lncRNAs are usually related to diseases with similar phenotypes, and vice versa. In 2015, Chen et al. [29] obtained the functional similarity between two lncRNAs by calculating the similarity between two sets of diseases associated with these two lncRNAs. For example, and are two different lncRNAs. It is assumed that and are associated with two sets of diseases and , respectively. The similarity between a disease d () and its set including k diseases can be defined as:
where . The similarity between and can be defined as the sum of similarities between all diseases of the sets with the respective other set, normalized by the size of the sets:
where and .
2.4. Gaussian Interaction Profile (GIP) Kernel Simlarity
Previous studies [29,30,31] show that GIP kernel similarity can be constructed from known LDAs to increase the topology structure of the LDA network. The similarity score between disease and can be defined as following:
The lncRNA network similarity between and can be obtained in a similar way:
where and are the parameters that control the kernel bandwidth. In this study, and and are the disease interaction profiles. denotes the ith row vector in the incidence matrix. is number of diseases in the data set. and denote the lncRNA interaction profiles. denotes the ith column vector in the incidence matrix. is number of diseases in the data set.
Relevant studies [29,32] have shown that logistic function transformation can improve the predictive ability of disease-associated problems. Therefore, we take the logistic function transform for and :
The value of parameter x is set to in line with the previous study [30]. The parameter c is tuned by the experiments.
2.5. Similarity Fusion
Disease semantic similarity and disease GIP kernel similarity are linearly fused to obtain the fused disease similarity matrix, and lncRNA functional similarity and lncRNA GIP kernel similarity are linearly fused to obtain the fused disease similarity matrix.
2.6. WKNKN Preprocessing
There may be some potentially unknown interactions in the known LDA matrix. In this study, the WKNKN method is used to initialize the association probabilities for potential interactions [33]. Specifically, the 0 values in the known LDA matrix are replaced by the values between 0 and 1 by the following steps:
(1) The K nearest neighbors are picked out by K-nearest neighbor (KNN) algorithm for each disease , and they are arranged in a descending order. The weighted average of the similarities between the disease and its K nearest neighbors can be obtained as follows:
where denotes the weight coefficient, is a delay factor, and is the normalization term.
(2) Similarly, the weighted average of the similarities between the lncRNA and its K nearest neighbors can be calculated as follows:
where is the weight coefficient, is a delay factor, and is the normalization term.
(3) The zero entries in the known LDA matrix are replaced by the averages of and . Then, denotes the probability that the lncRNA is related to the disease and it can be defined as follows:
2.7. Linear Neighborhood Similarity (LNS)
Roweis et al. [34] discovered that a data point and its neighboring data points are close to the locally linear patch of the manifold in a feature space. Wang et al. [35] revealed that each data point can be reestablished by its neighbors. In recent years, some researchers [18,36,37] obtained the pairwise similarity by reconstructing the data point through its neighbors. Here, we calculate the similarity between two different lncRNA data points (or two different disease data points) as previous work. Let denote the feature vector of the lncRNA in a feature space. Assume that the data point can be reestablished by the linear combination of its neighbors, we write the objective function and minimize the reconstruction error as follows:
where is the set of nearest neighbors of the node . is the j-th neighbor of . , and is the reconstructive weight of from . and . The regularization parameter is very important for the optimization problem (13). In this paper, the parameter is set to 1 based on the study of Ref. [37].
The optimization problem for each data point can be solved by using the standard quadratic programming technique. Finally, the weight matrix with size can be obtained, which describes the pairwise similarity between lncRNAs. The weight matrix can also be calculated in the same way, which denotes the pairwise similarity between diseases.
2.8. Unbalanced Bi-Random Walk
Inspired by the successful applications of bi-random walks in identifying drug-disease associations [38], predicting miRNA-disease associations [39] and inferring LDAs [18], we design a novel method (called MSF-UBRW) based on unbalanced bi-random walks on the DSN and the LSN to identify potential LDAs. First, a bipartite is used to represent LDAs. V denotes the set of vertices, and E is the set of edges. The weight of edge is equal to 1 when the disease is related to the lncRNA , otherwise . Next, there are many isolated nodes in the DSN and the LSN. In this study, LNS is used to overcome this shortcoming. Finally, based on the assumption that similar diseases may be related to similar lncRNAs, and vice versa, unbalanced bi-random walks are executed on the DSN and the LSN simultaneously. Considering the differences in the topology of the two networks, different random walk steps are performed on the DSN and the LSN.
The column-normalized adjacency matrix of the DSN can be defined as:
The column-normalized adjacency matrix of the LSN can be calculated as:
Let denote the association probability matrix. The element is the probability that the disease i is associated with the lncRNA j. and denote the steps of random walks on the DSN and the LSN, respectively. The iterative process of bi-random walks can be defined as follows:
where is a delay factor with a value ranging from 0.1 to 0.9. t denotes the number of iterations. Y denotes the known association information. is the initial association probability matrix, and .
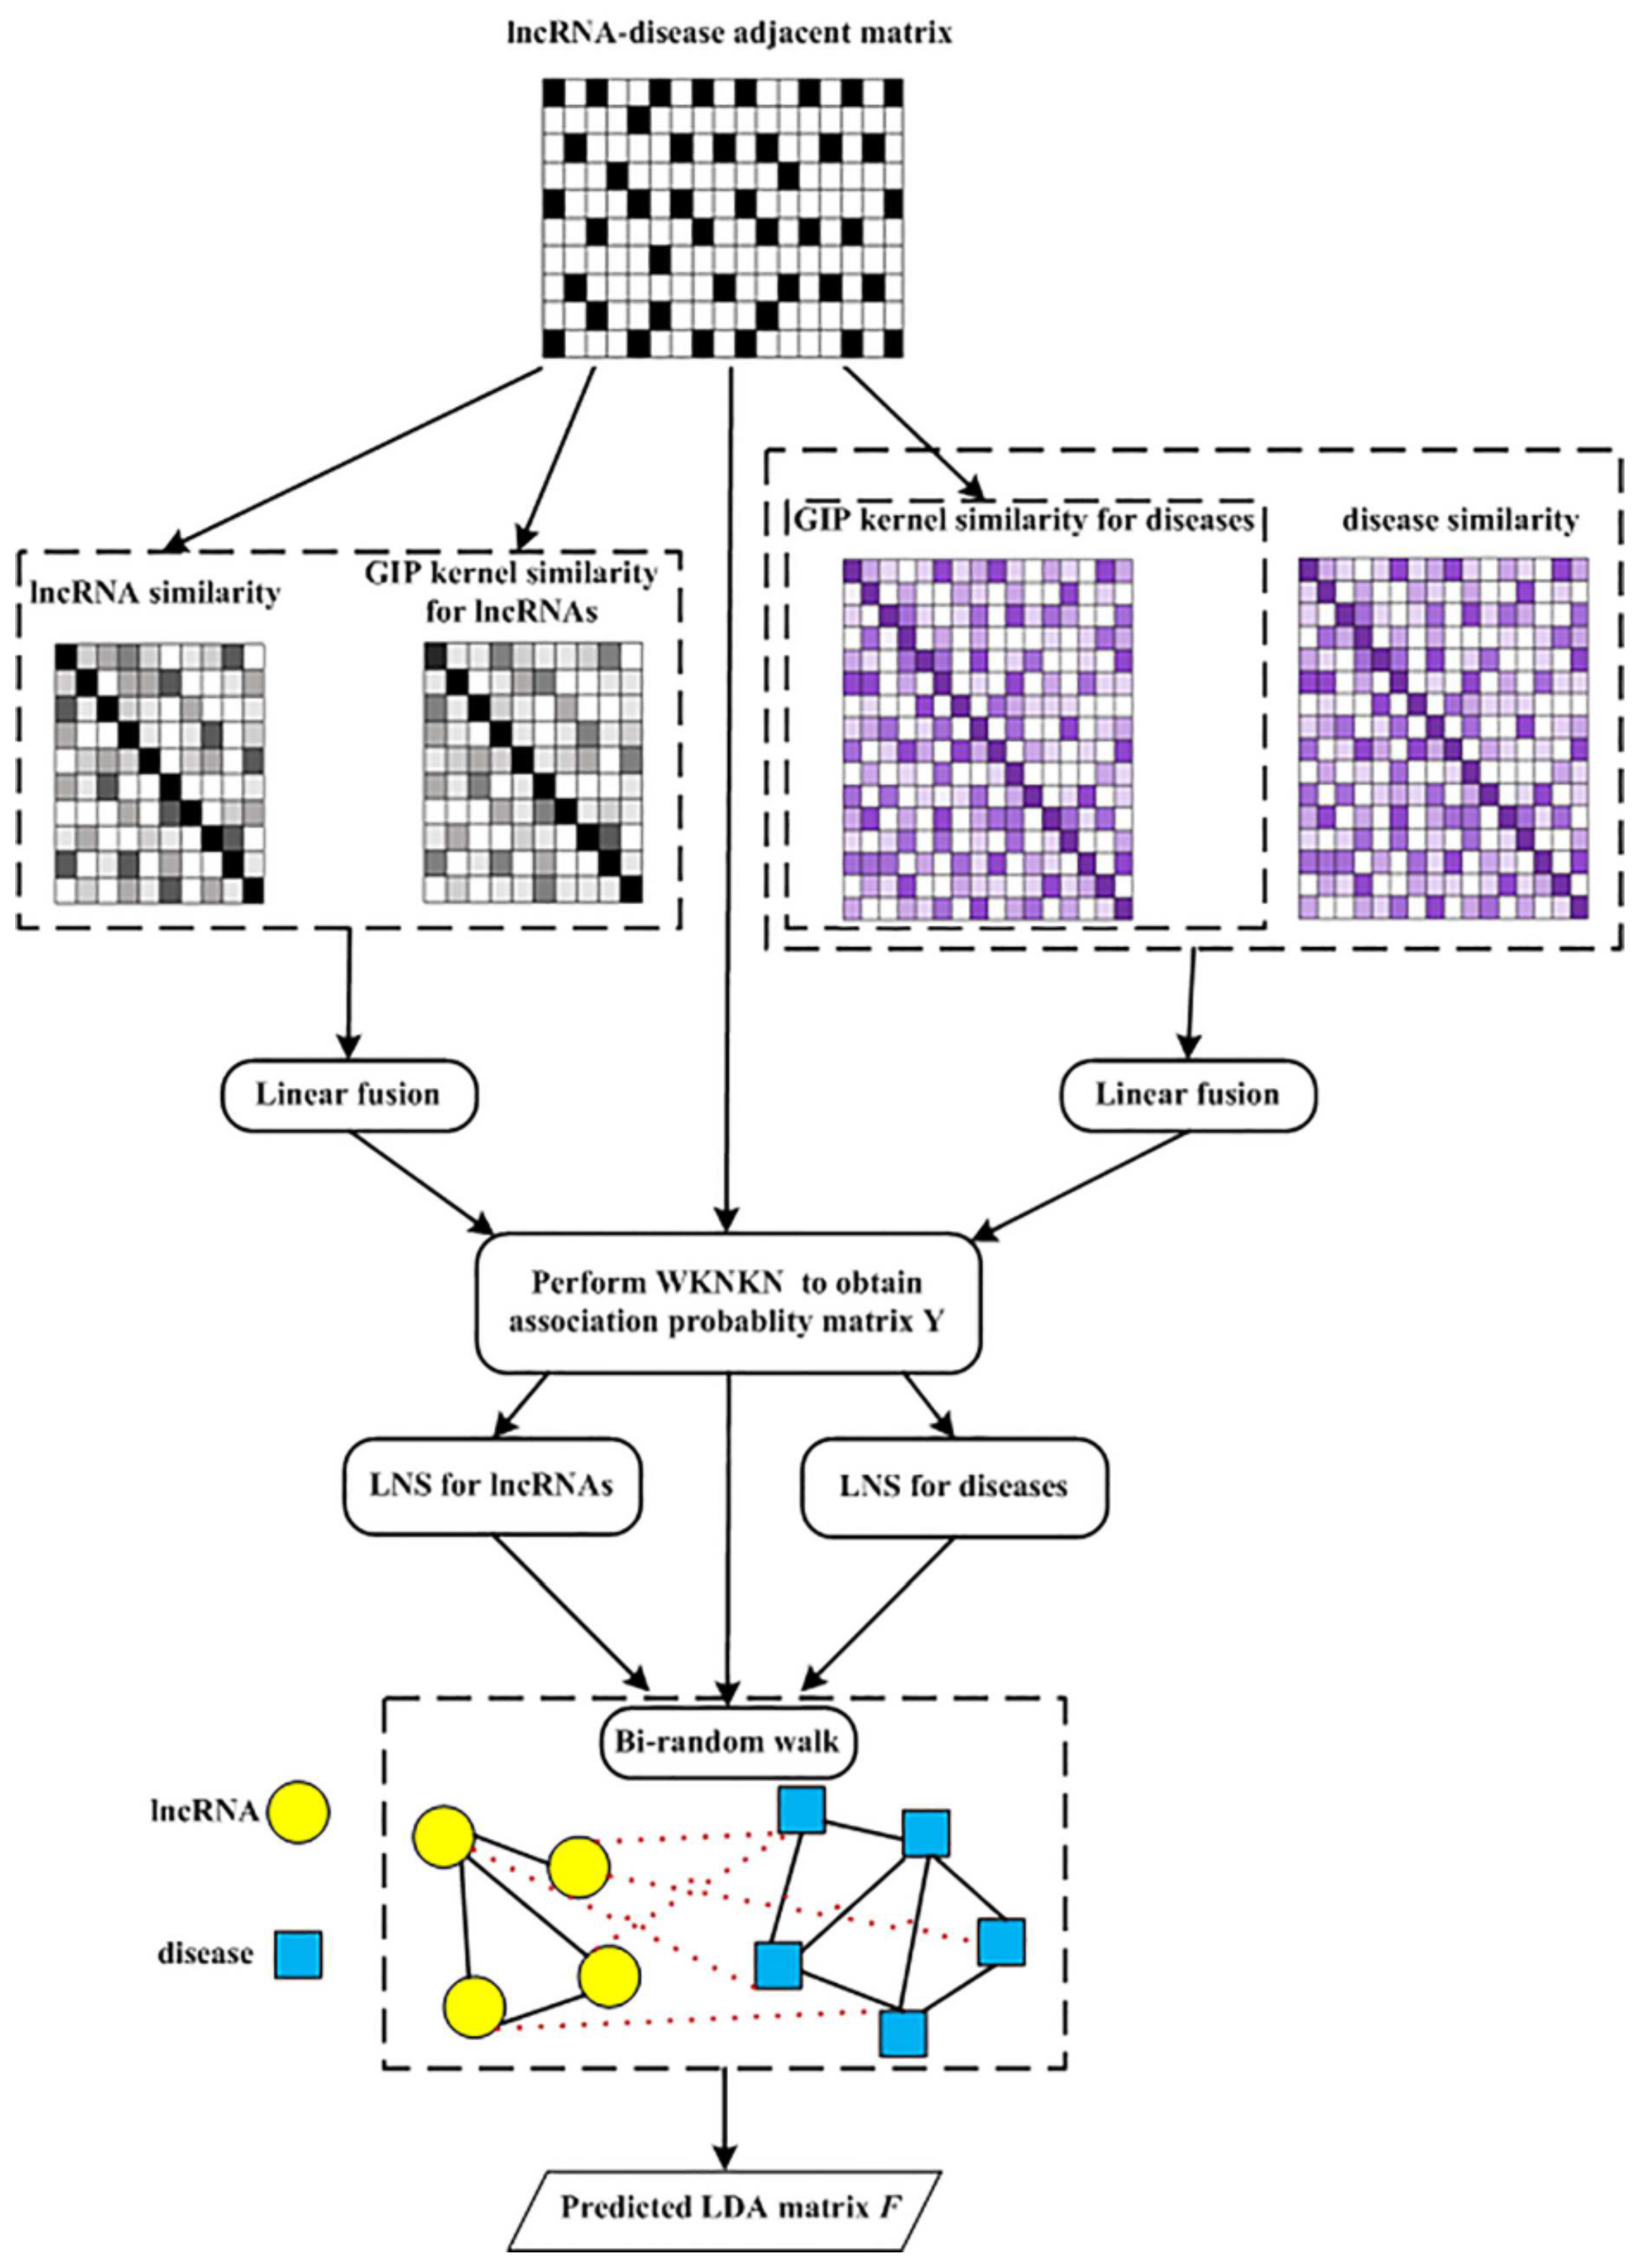
The flowchart of the MSF-UBRW algorithm is shown in Figure 2, and its pseudocode is Algorithm 1.
| Algorithm 1 MSF-UBRW |
|
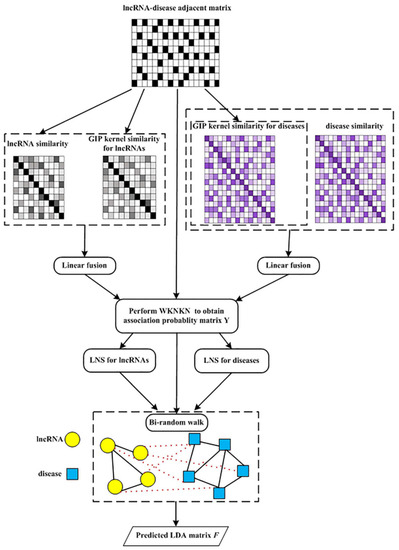
Figure 2.
Flowchart of MSF-UBRW.
3. Results
3.1. Performance Evaluation
In order to evaluate the performance of the MSF-UBRW method in predicting undiscovered LDAs, 5-fold CV and LOOCV are performed on the gold standard dataset downloaded from the LncRNADisease database [28]. In 5-fold CV, all known LDAs are randomly divided into 5 parts. Each part serves as the testing samples in turn and the others as the training samples. In this experiment, 5-fold CV is run 100 times to take the average value. In LOOCV, each known LDA is treated as the test sample in turn, and the remaining known LDAs are treated as the training samples. In 5-fold CV and LOOCV, the test samples are compared with all unknown LDAs. Area Under Curve (AUC) is the final evaluation metric. Previous studies [21] have shown that this method is meaningless when AUC is between 0 and 0.5. When AUC lies between 0.5 and 1, the larger the AUC value is, the better the prediction performance of this method will be.
3.2. Comparison with Other Methods
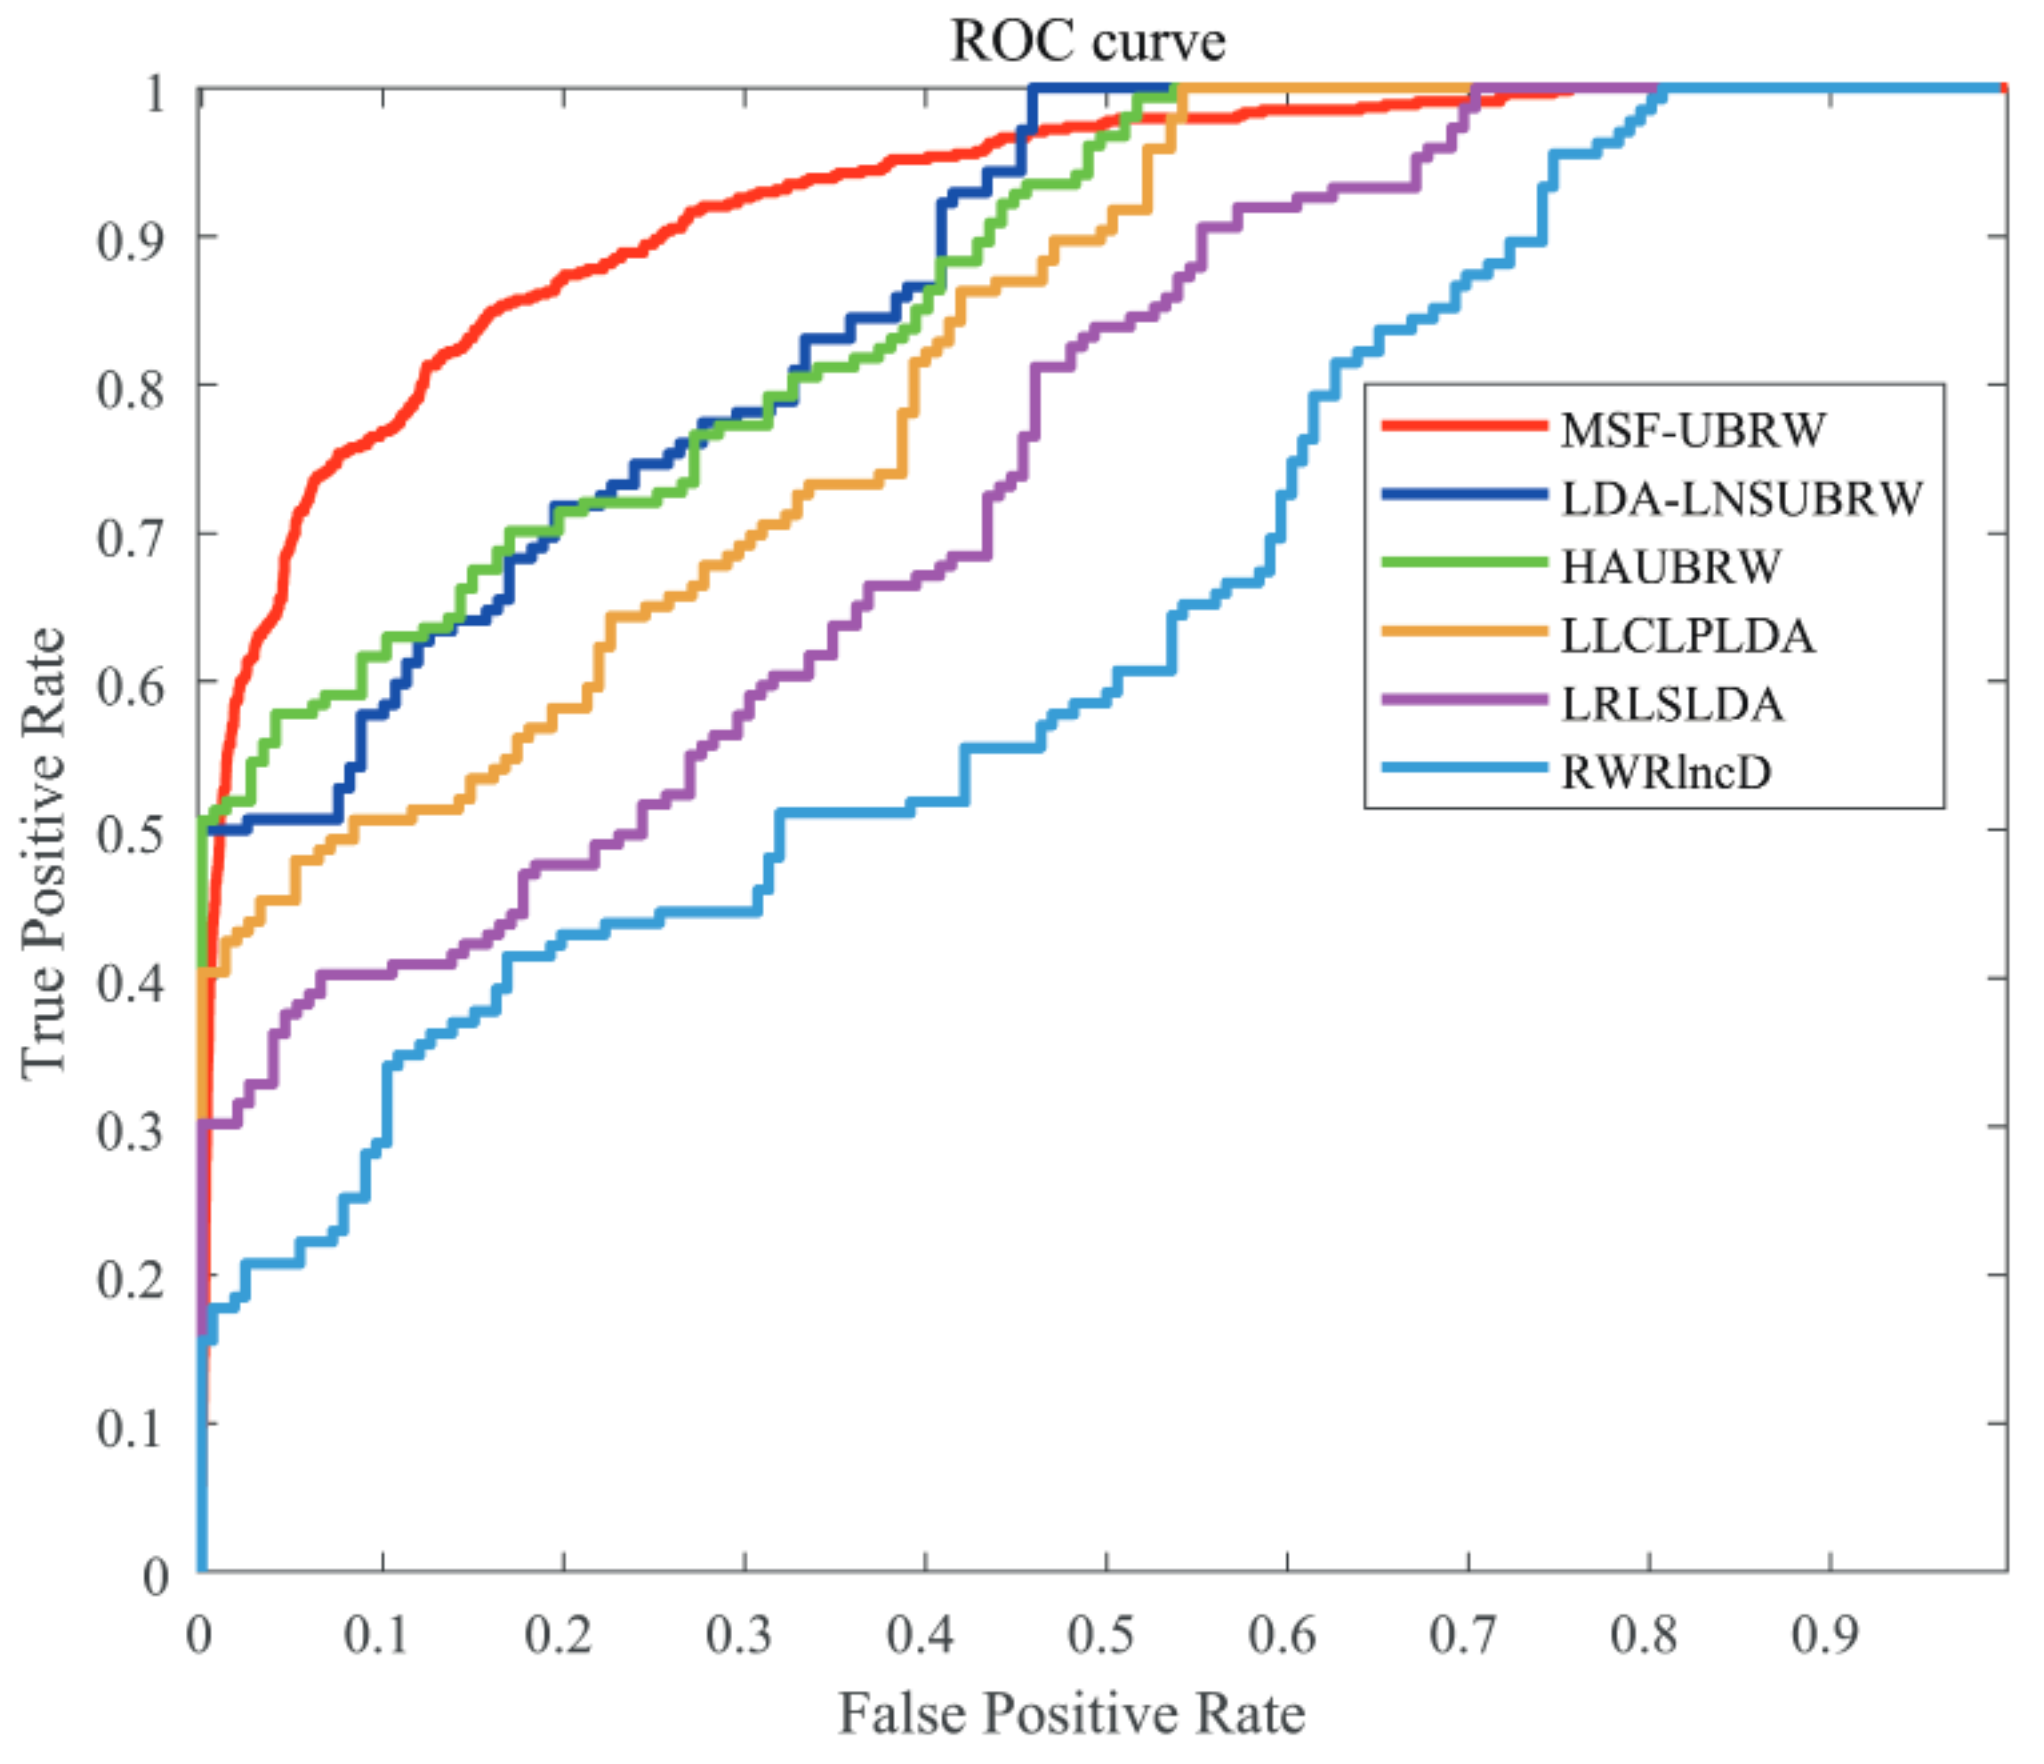
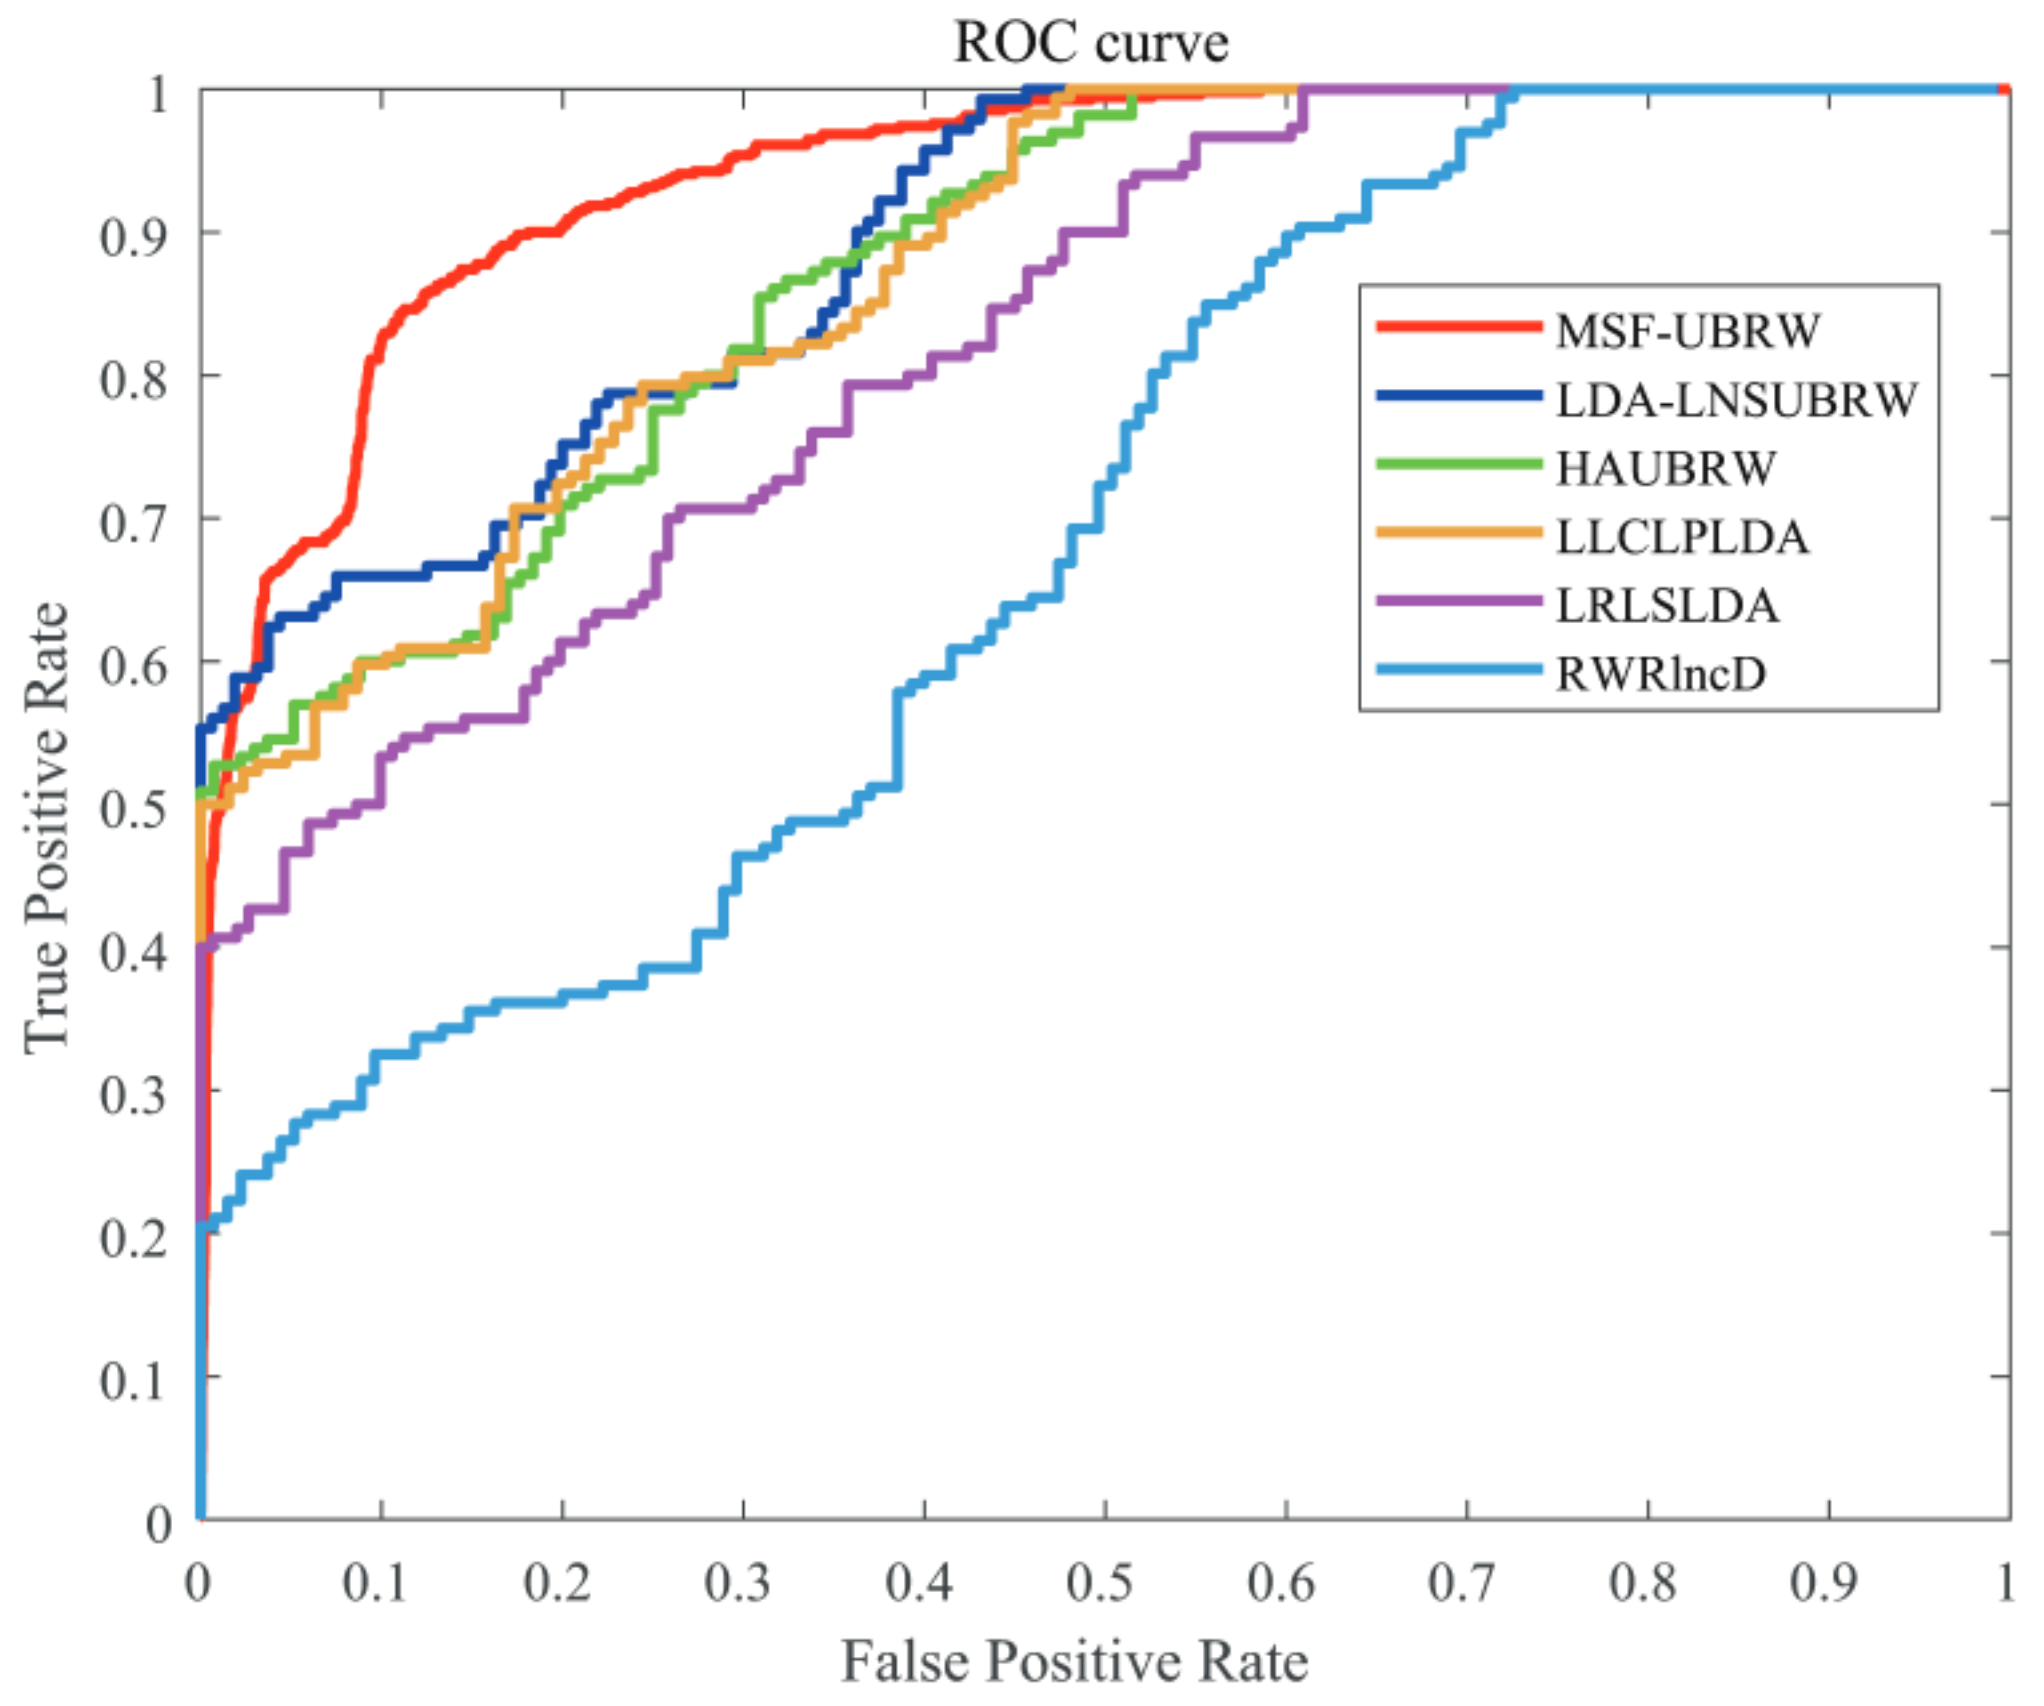
In this paper, the MSF-UBRW method is compared with the other five prediction methods, namely, LDA-LNSUBRW [18], HAUBRW [27], LLCLPLDA [26], LRLSLDA [20], and RWRlncD [24]. First, the MSF-UBRW method is compared with these prediction methods in 5-fold CV. The AUC values of these six methods are shown in Table 1. The MSF-UBRW method achieves the AUC value of , which is higher than the AUC values of the other methods (LDA-LNSUBRW: , HAUBRW: , LLCLPLDA: , LRLSLDA: and RWRlncD: ). Table 1 also presents the prediction results of the MSF-UBRW method and other five methods (LDA-LNSUBRW, HAUBRW, LLCLPLDA, LRLSLDA, and RWRlncD) via LOOCV. The MSF-UBRW method performs the best in predicting LDAs and its AUC value achieves , which exceeds the other five methods (LDA-LNSUBRW: , HAUBRW: , LLCLPLDA: , LRLSLDA: and RWRlncD: ). Figure 3 and Figure 4 show intuitively the comparison of the prediction performance of these six methods in 5-fold CV and LOOCV, respectively.

Table 1.
Auc results of six methods.
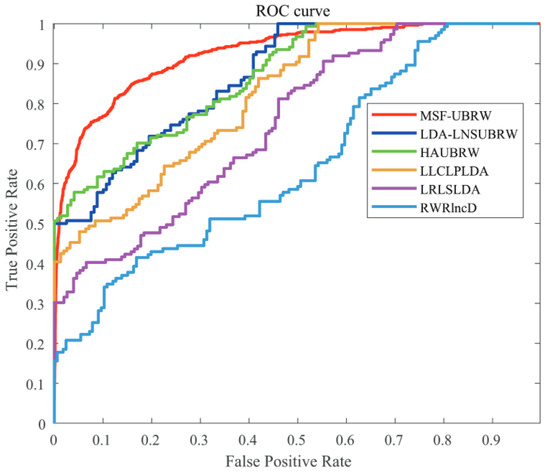
Figure 3.
The ROC curves of the six methods (MSF-UBRW, LDA-LNSUBRW, HAUBRW, LLCLPLDA, LRLSLDA and RWRlncD) based on the 5-fold CV method.
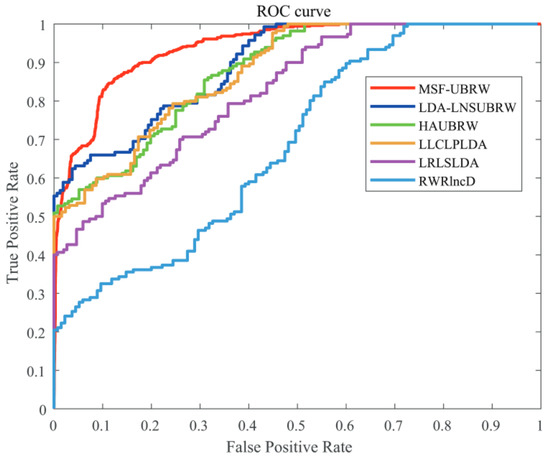
Figure 4.
The ROC curves of the six methods (MSF-UBRW, LDA-LNSUBRW, HAUBRW, LLCLPLDA, LRLSLDA and RWRlncD) based on the LOOCV method.
3.3. Parameters Analysis
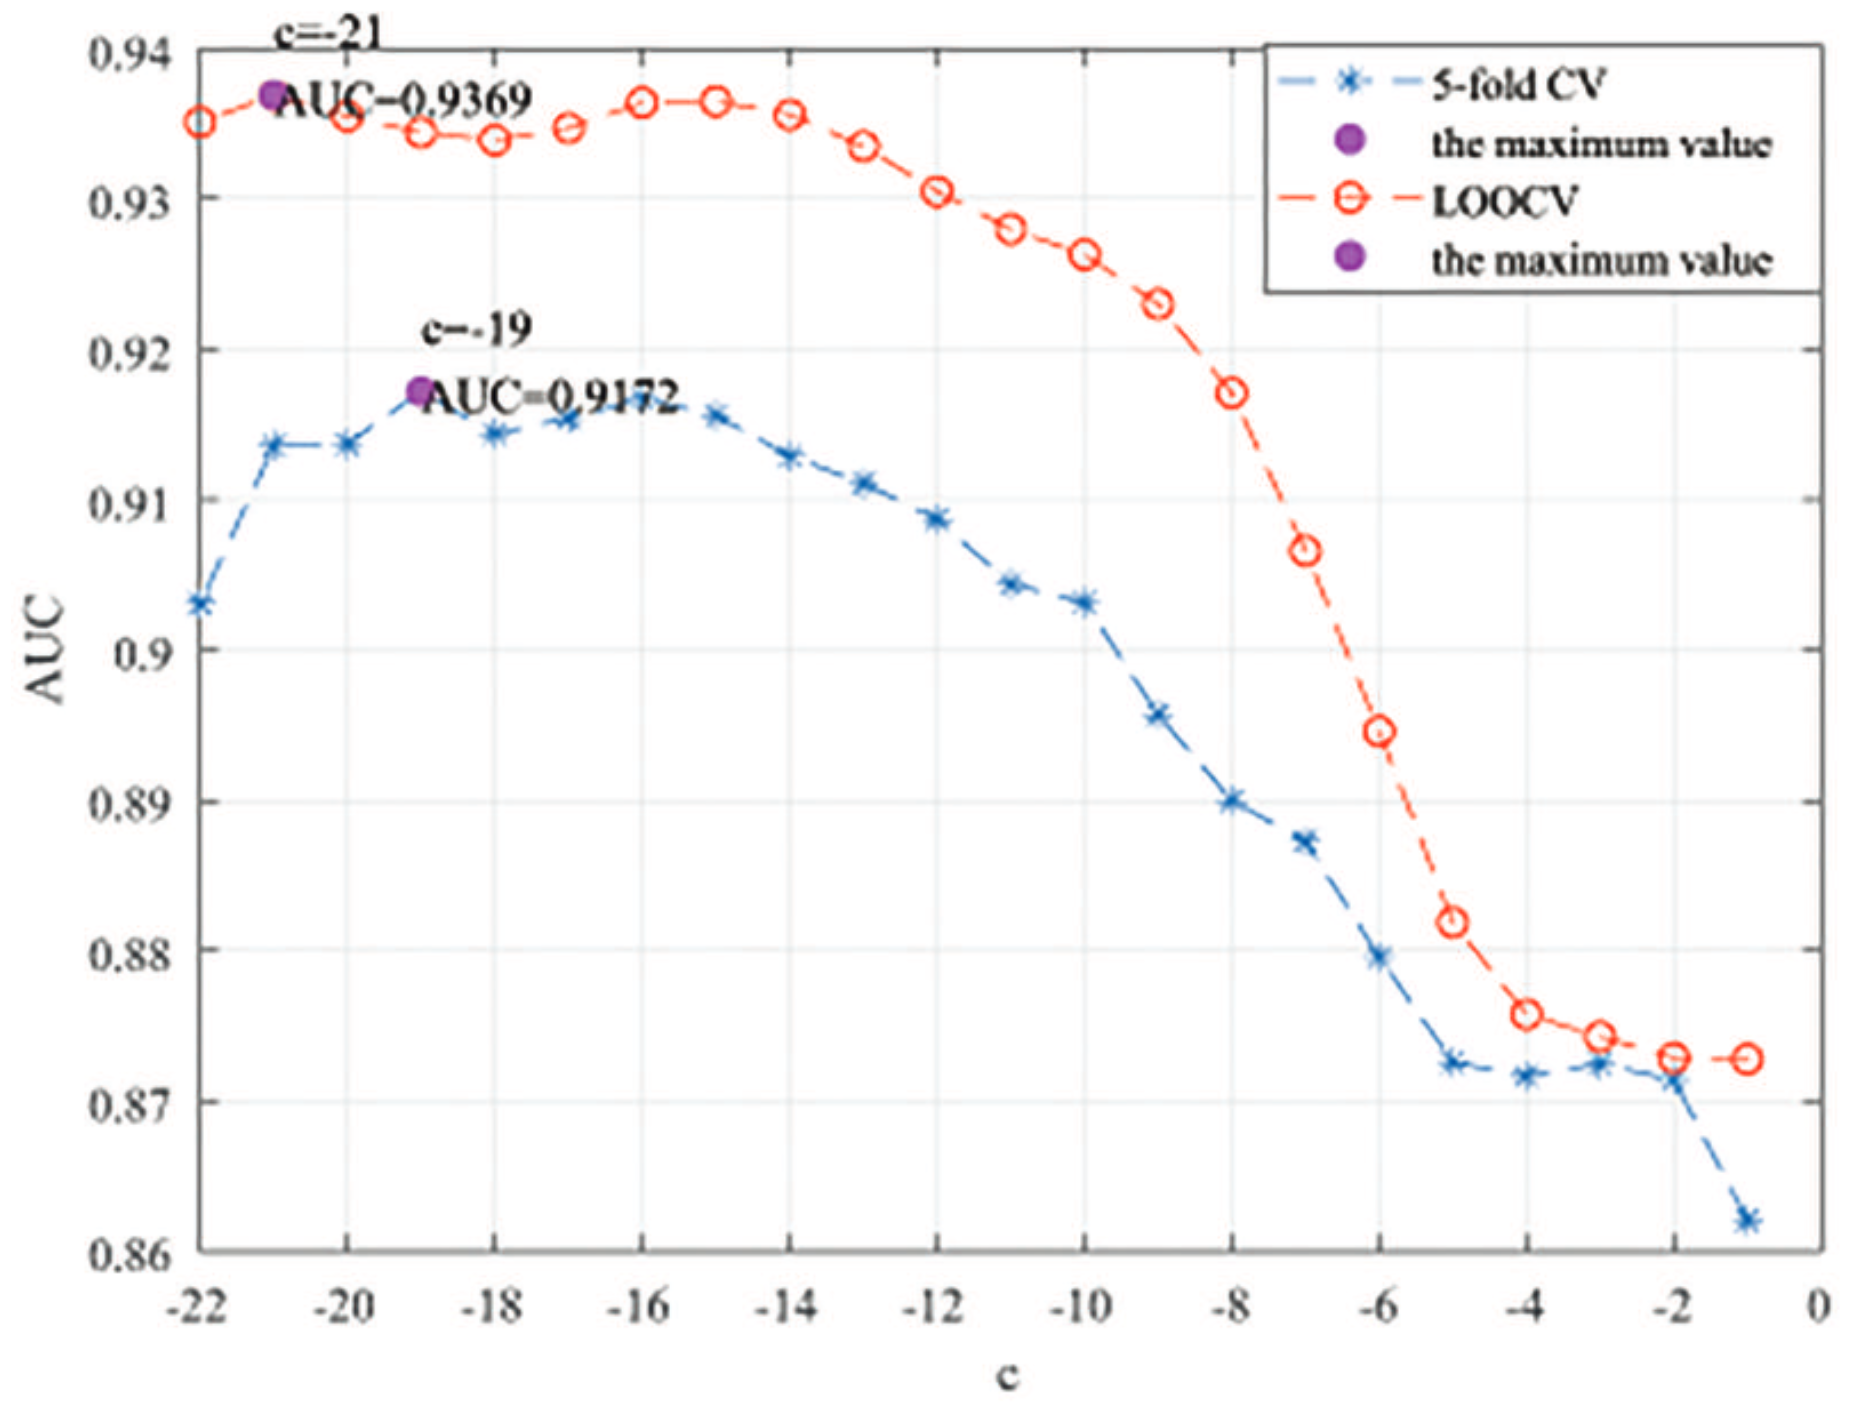
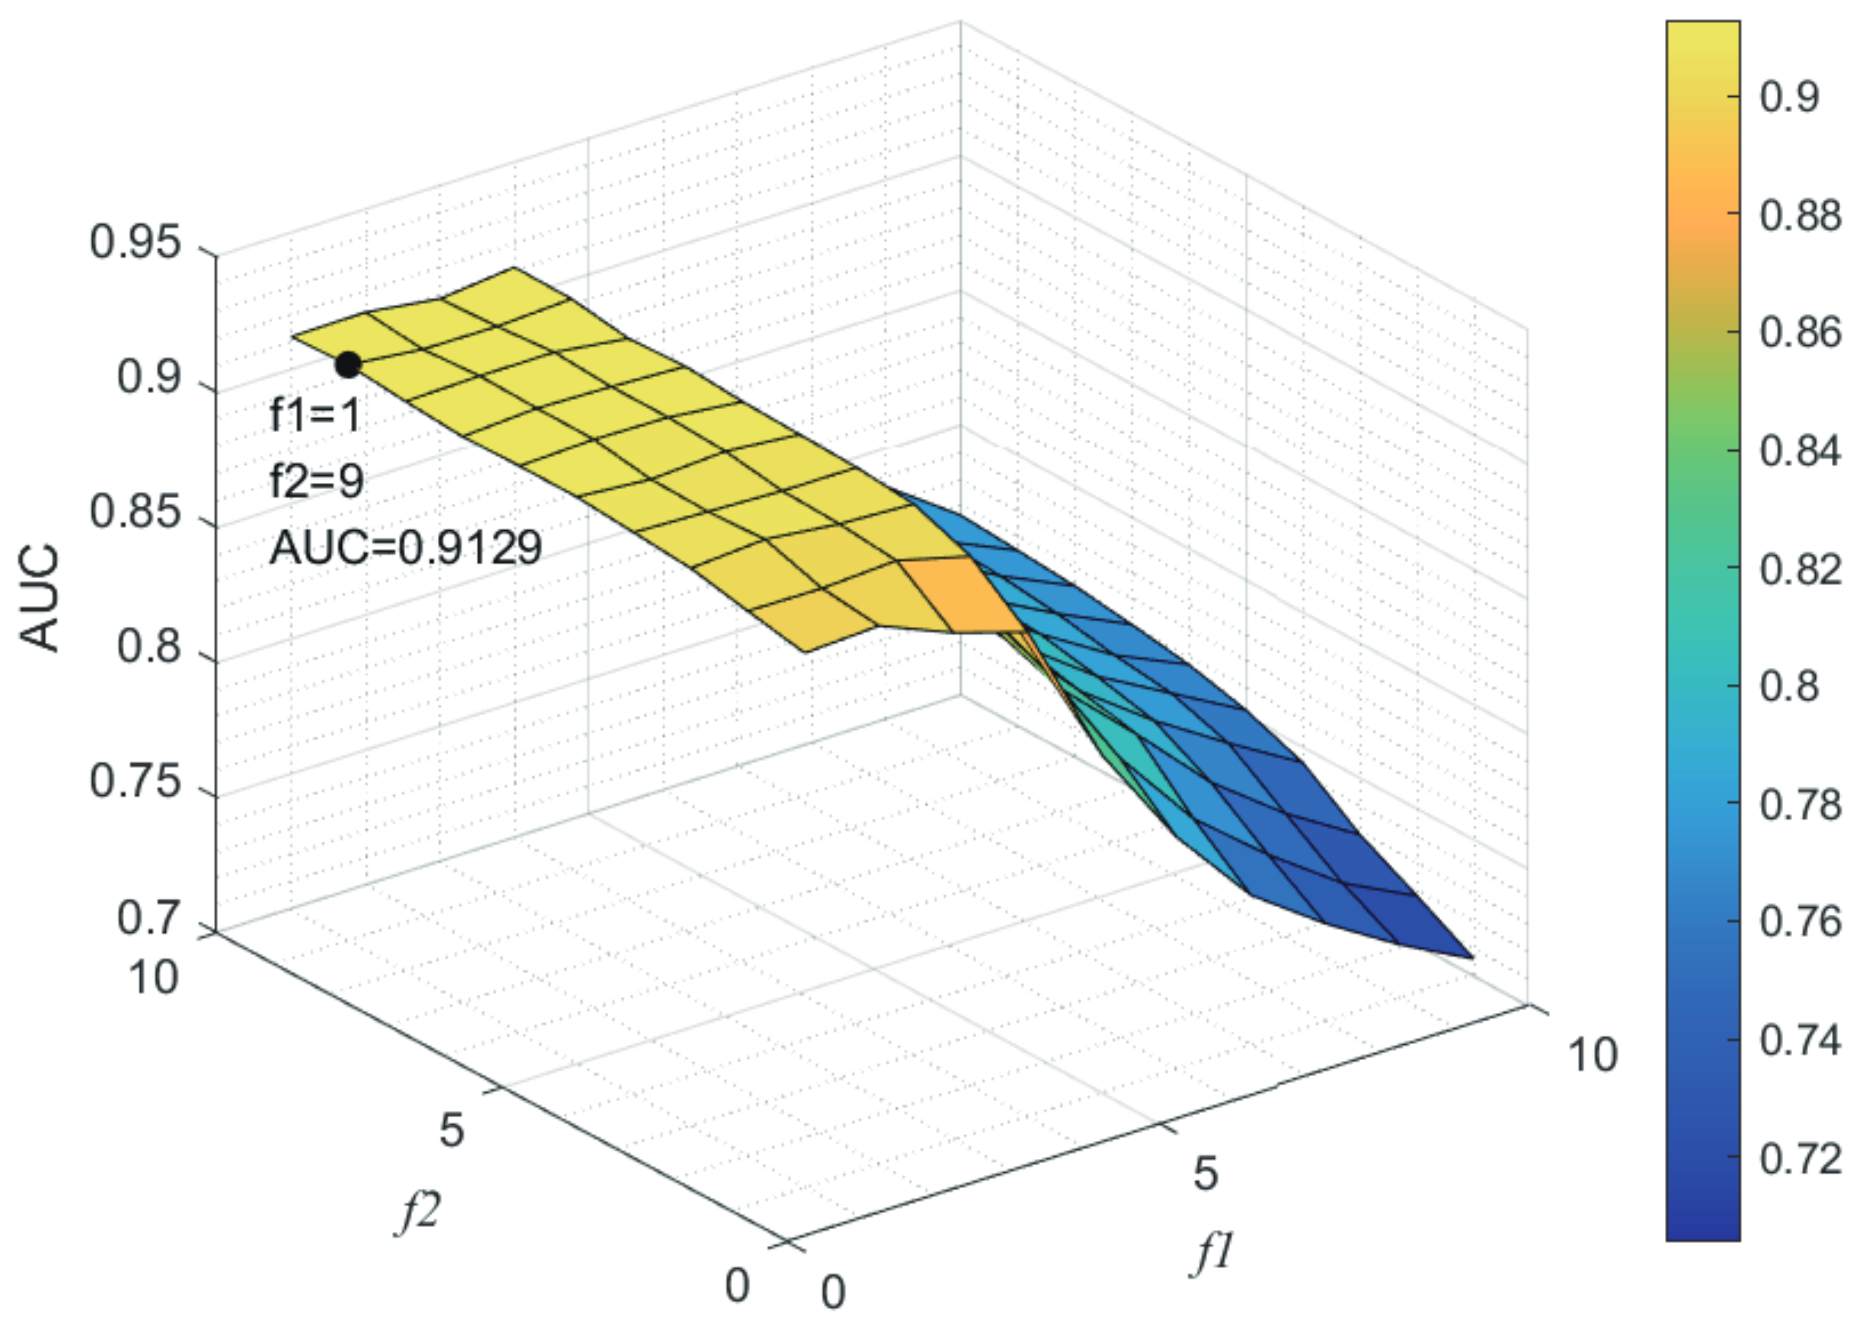
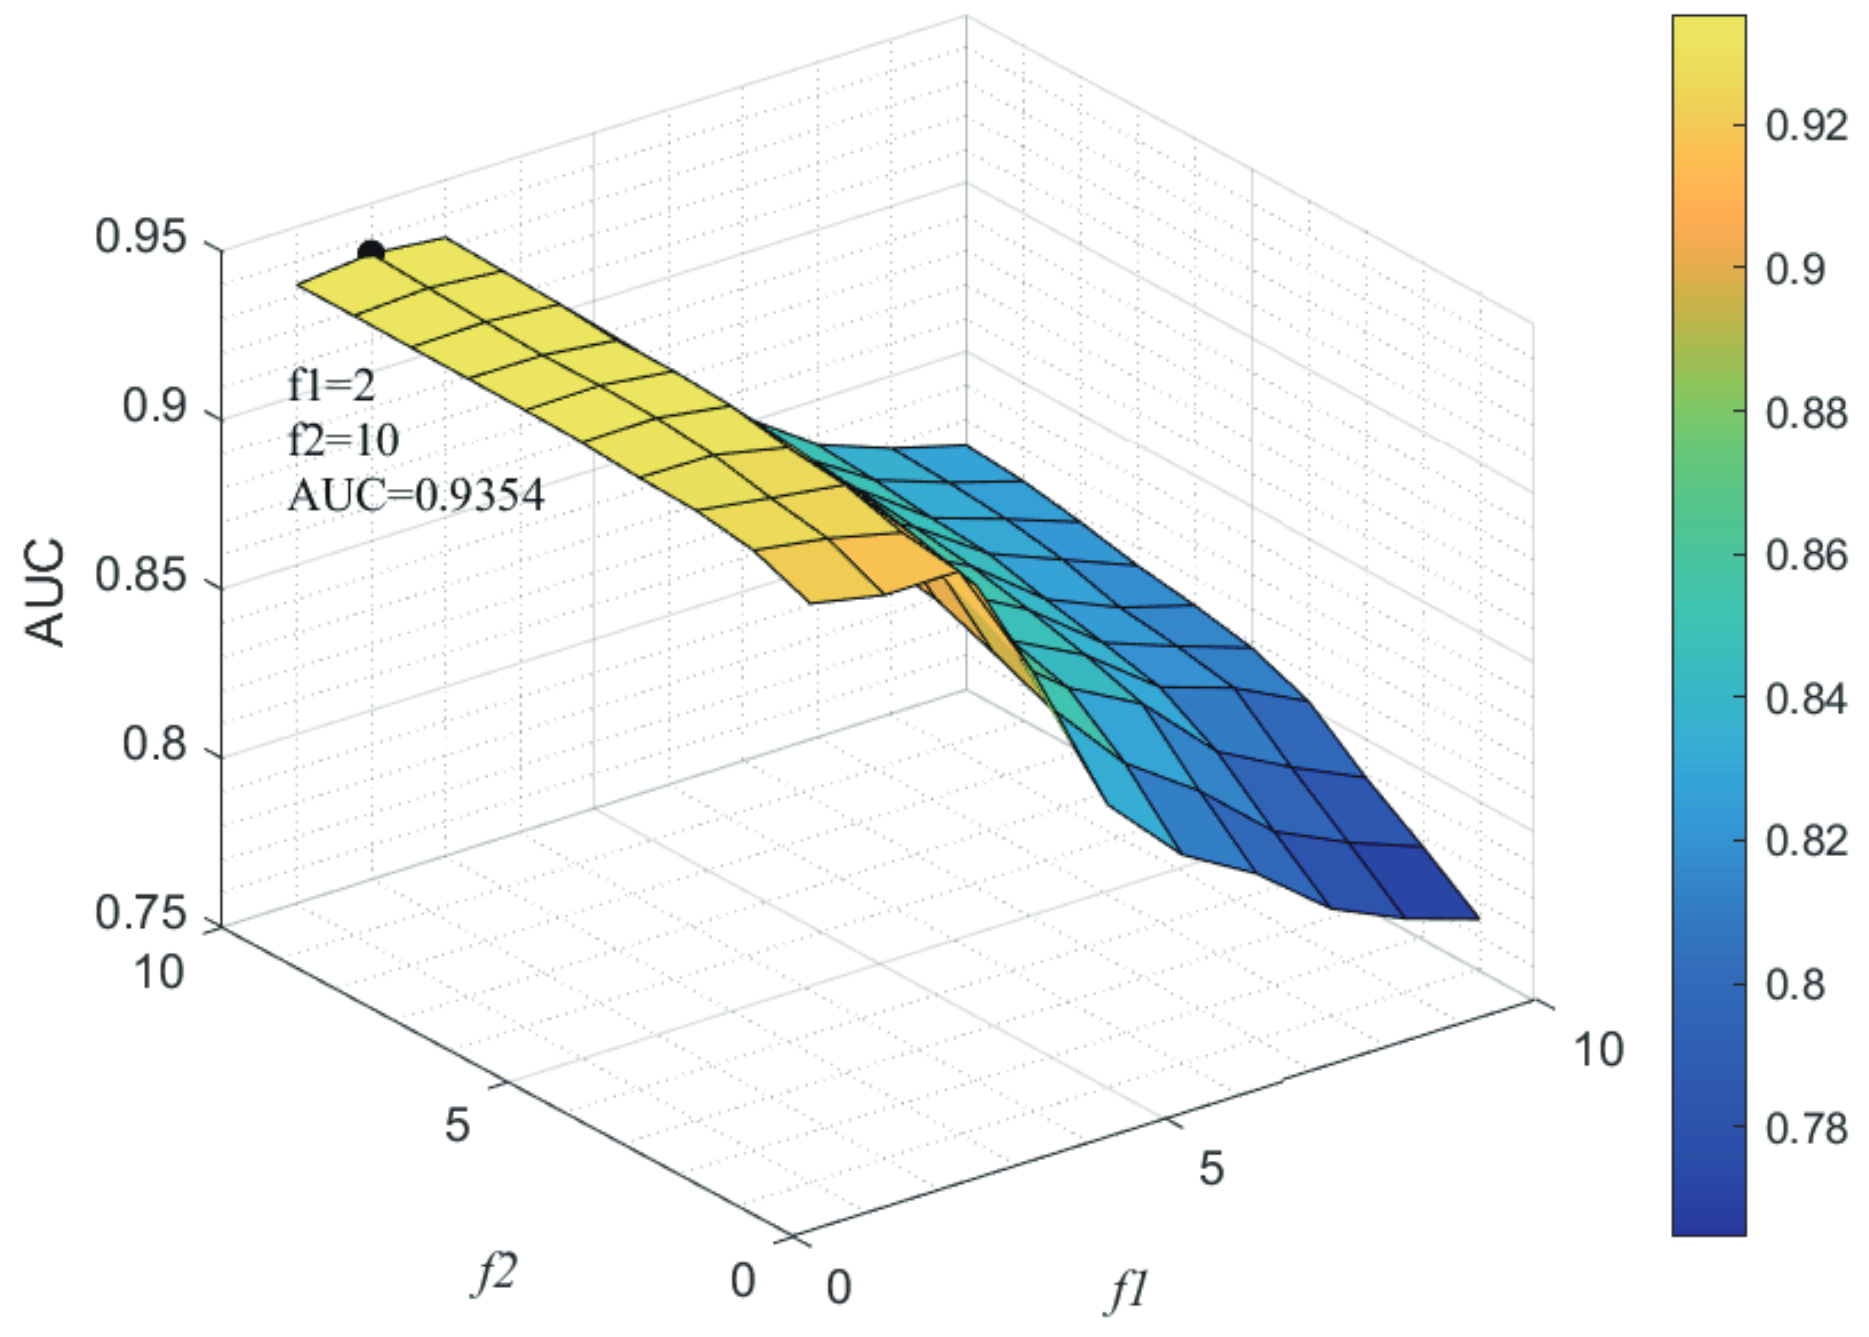
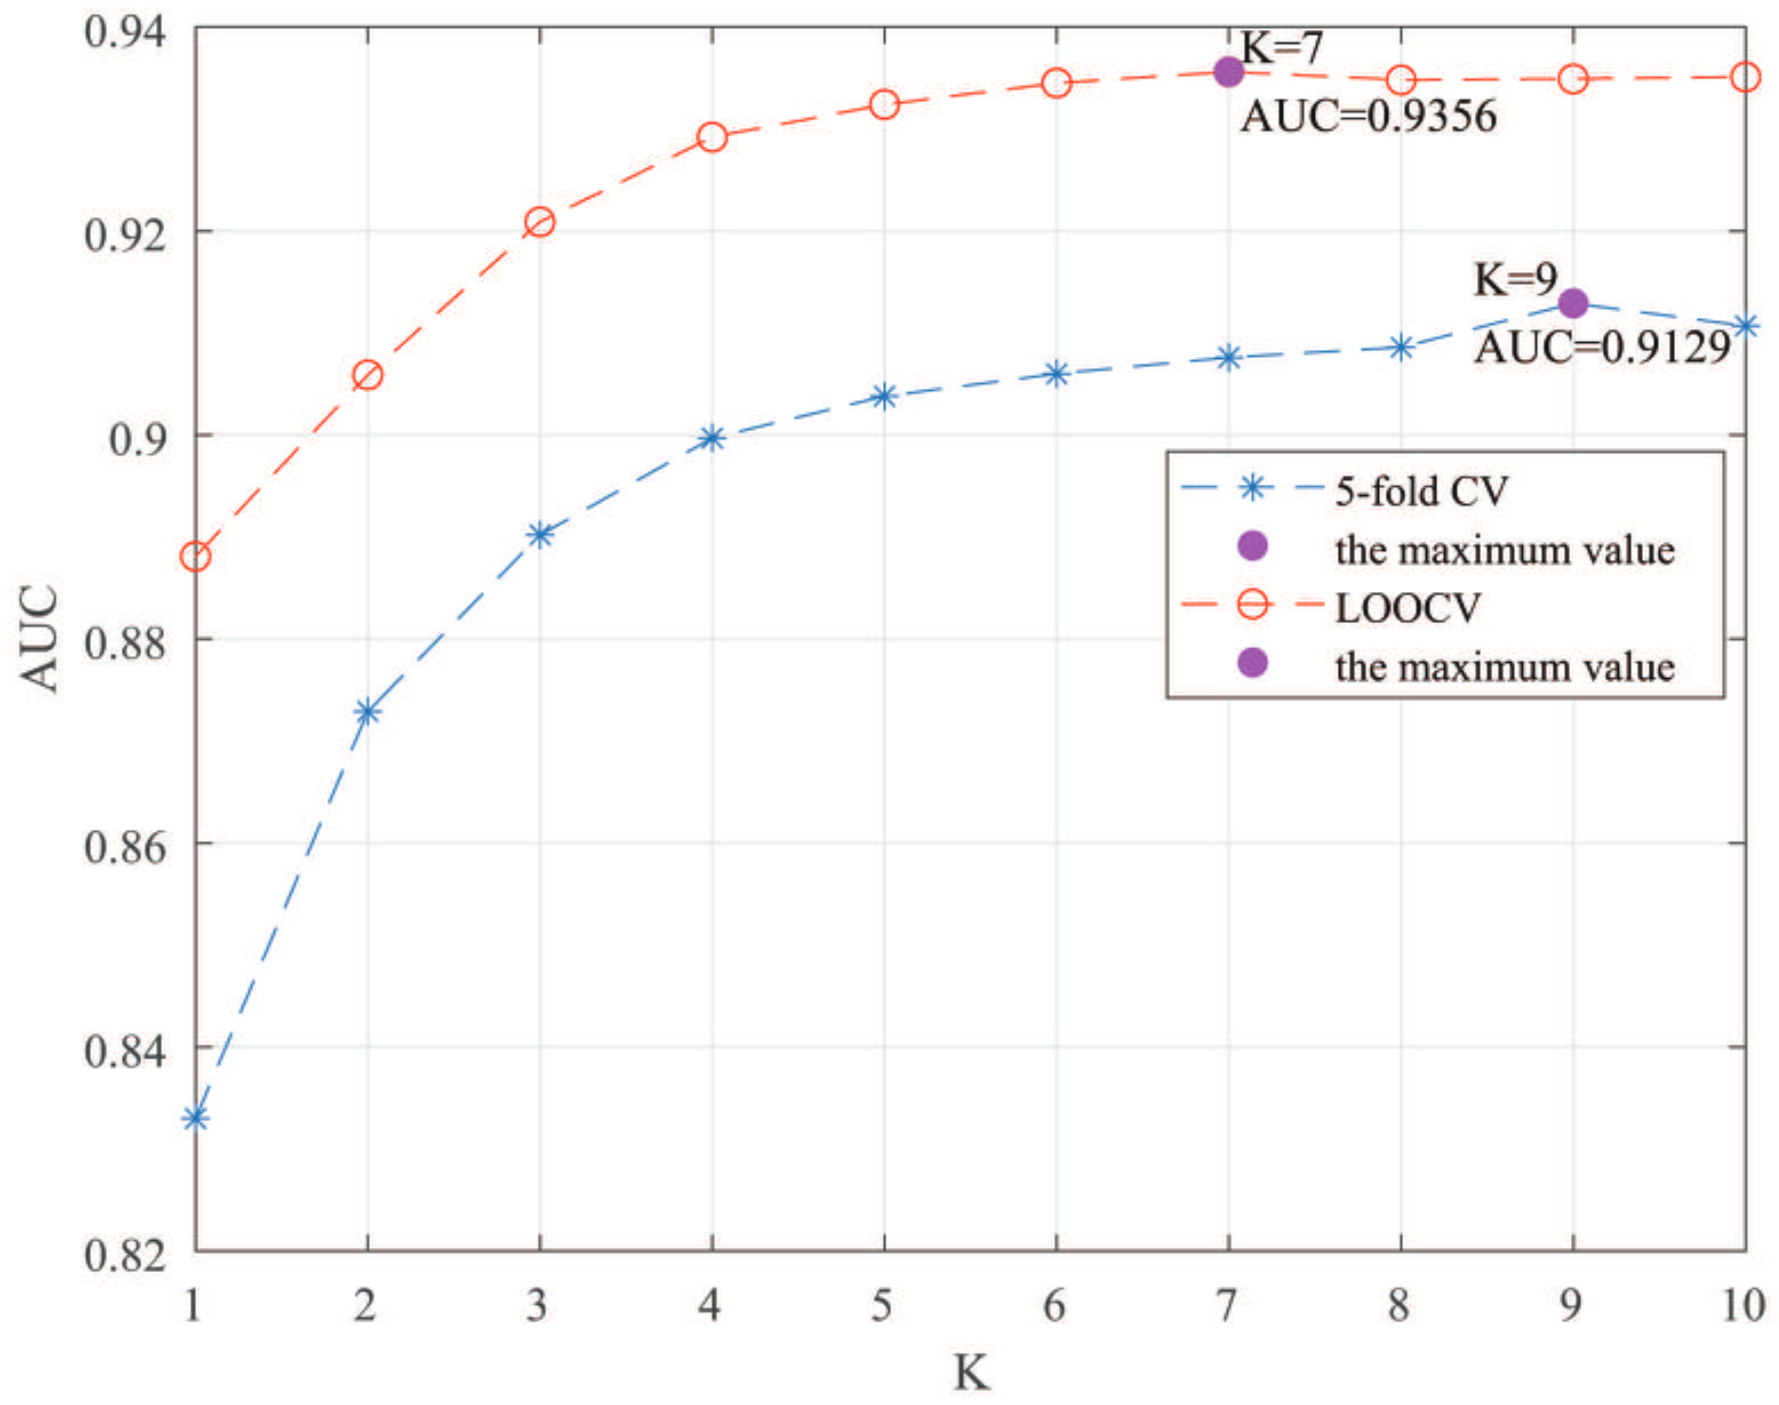
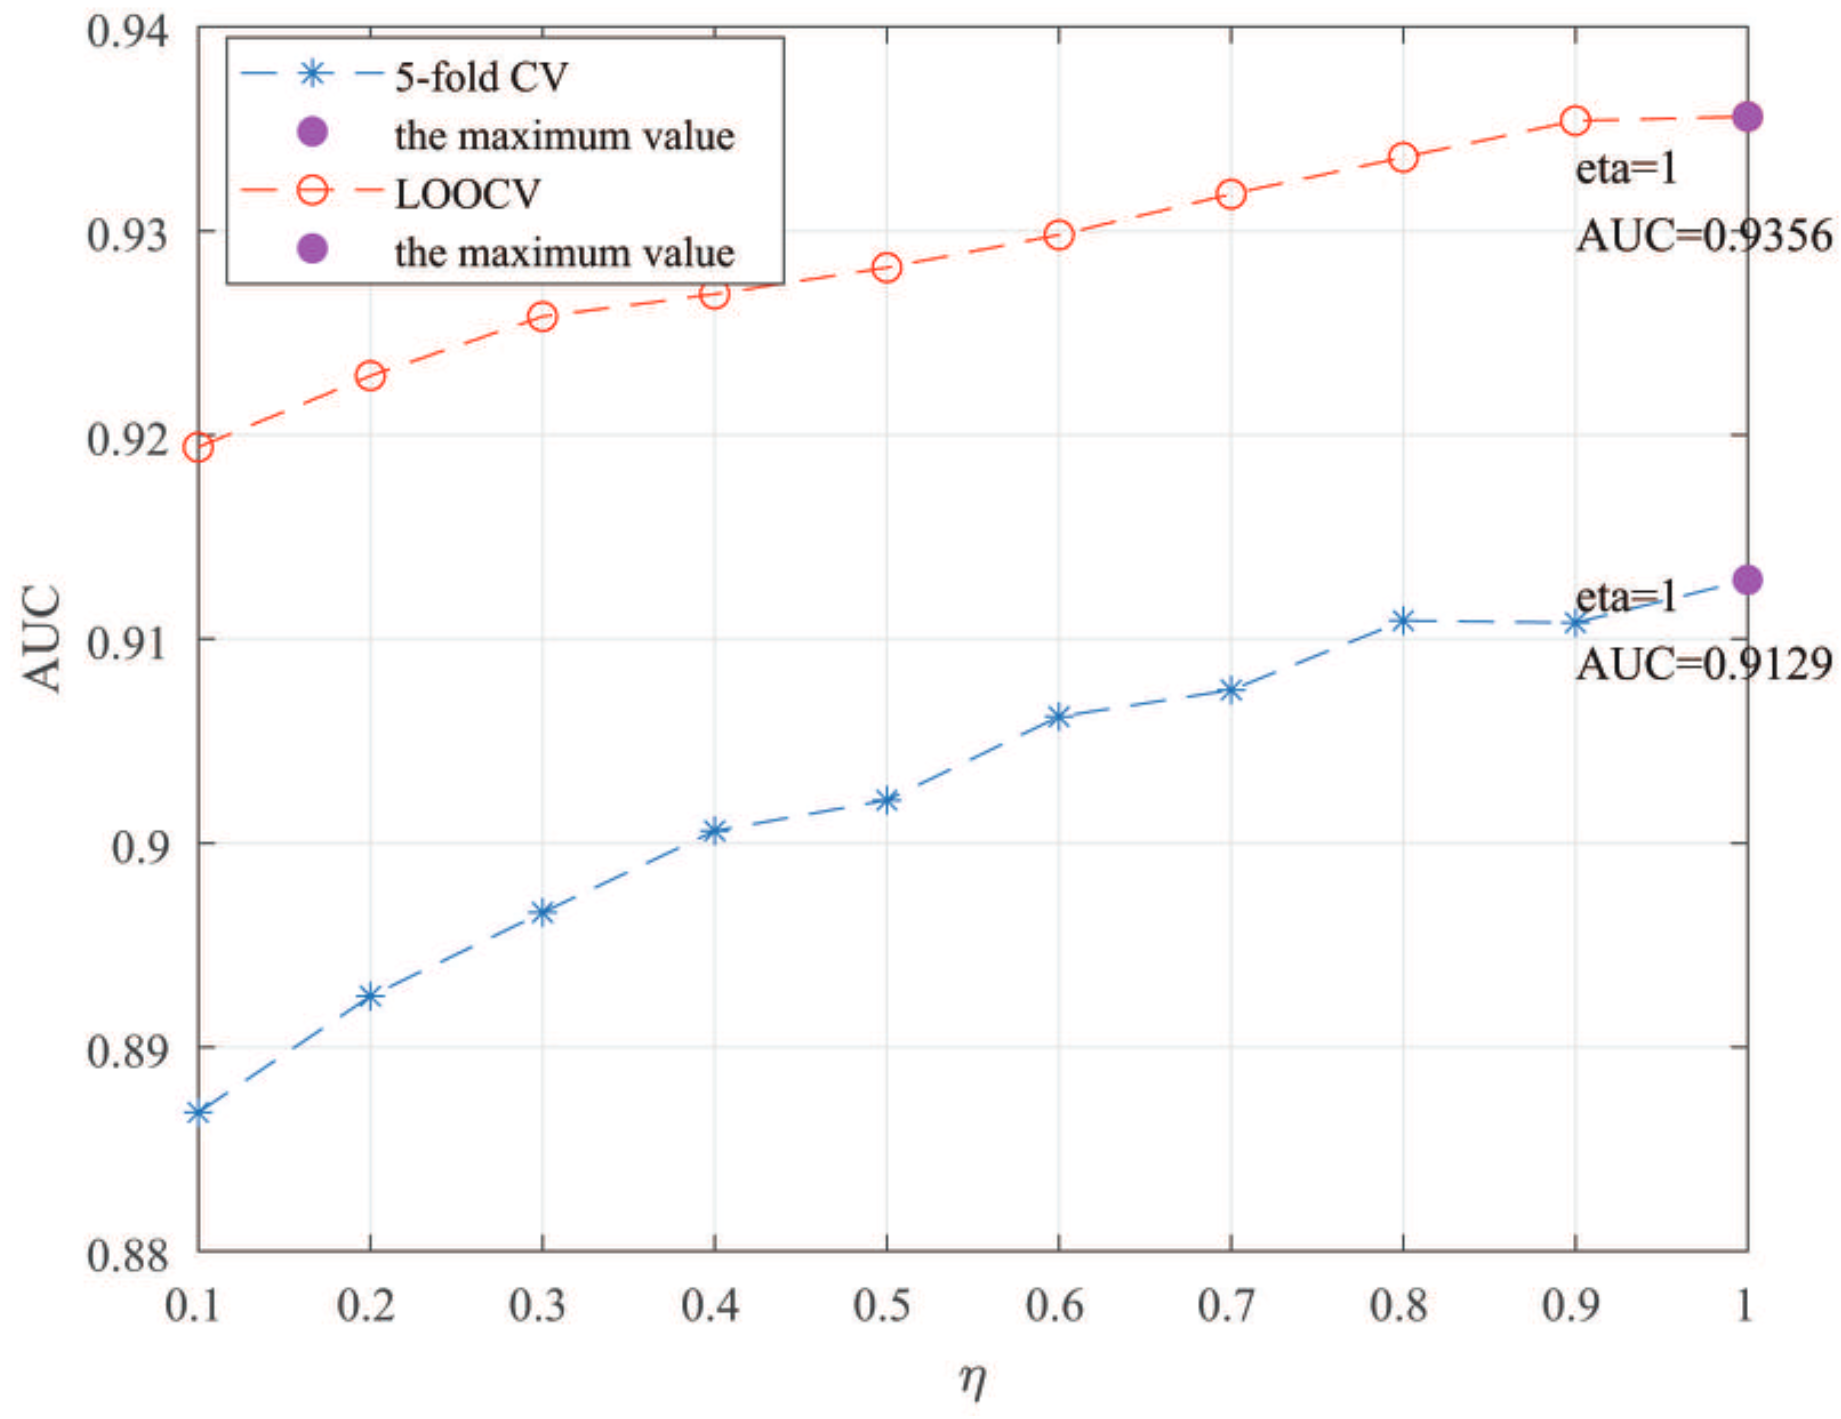
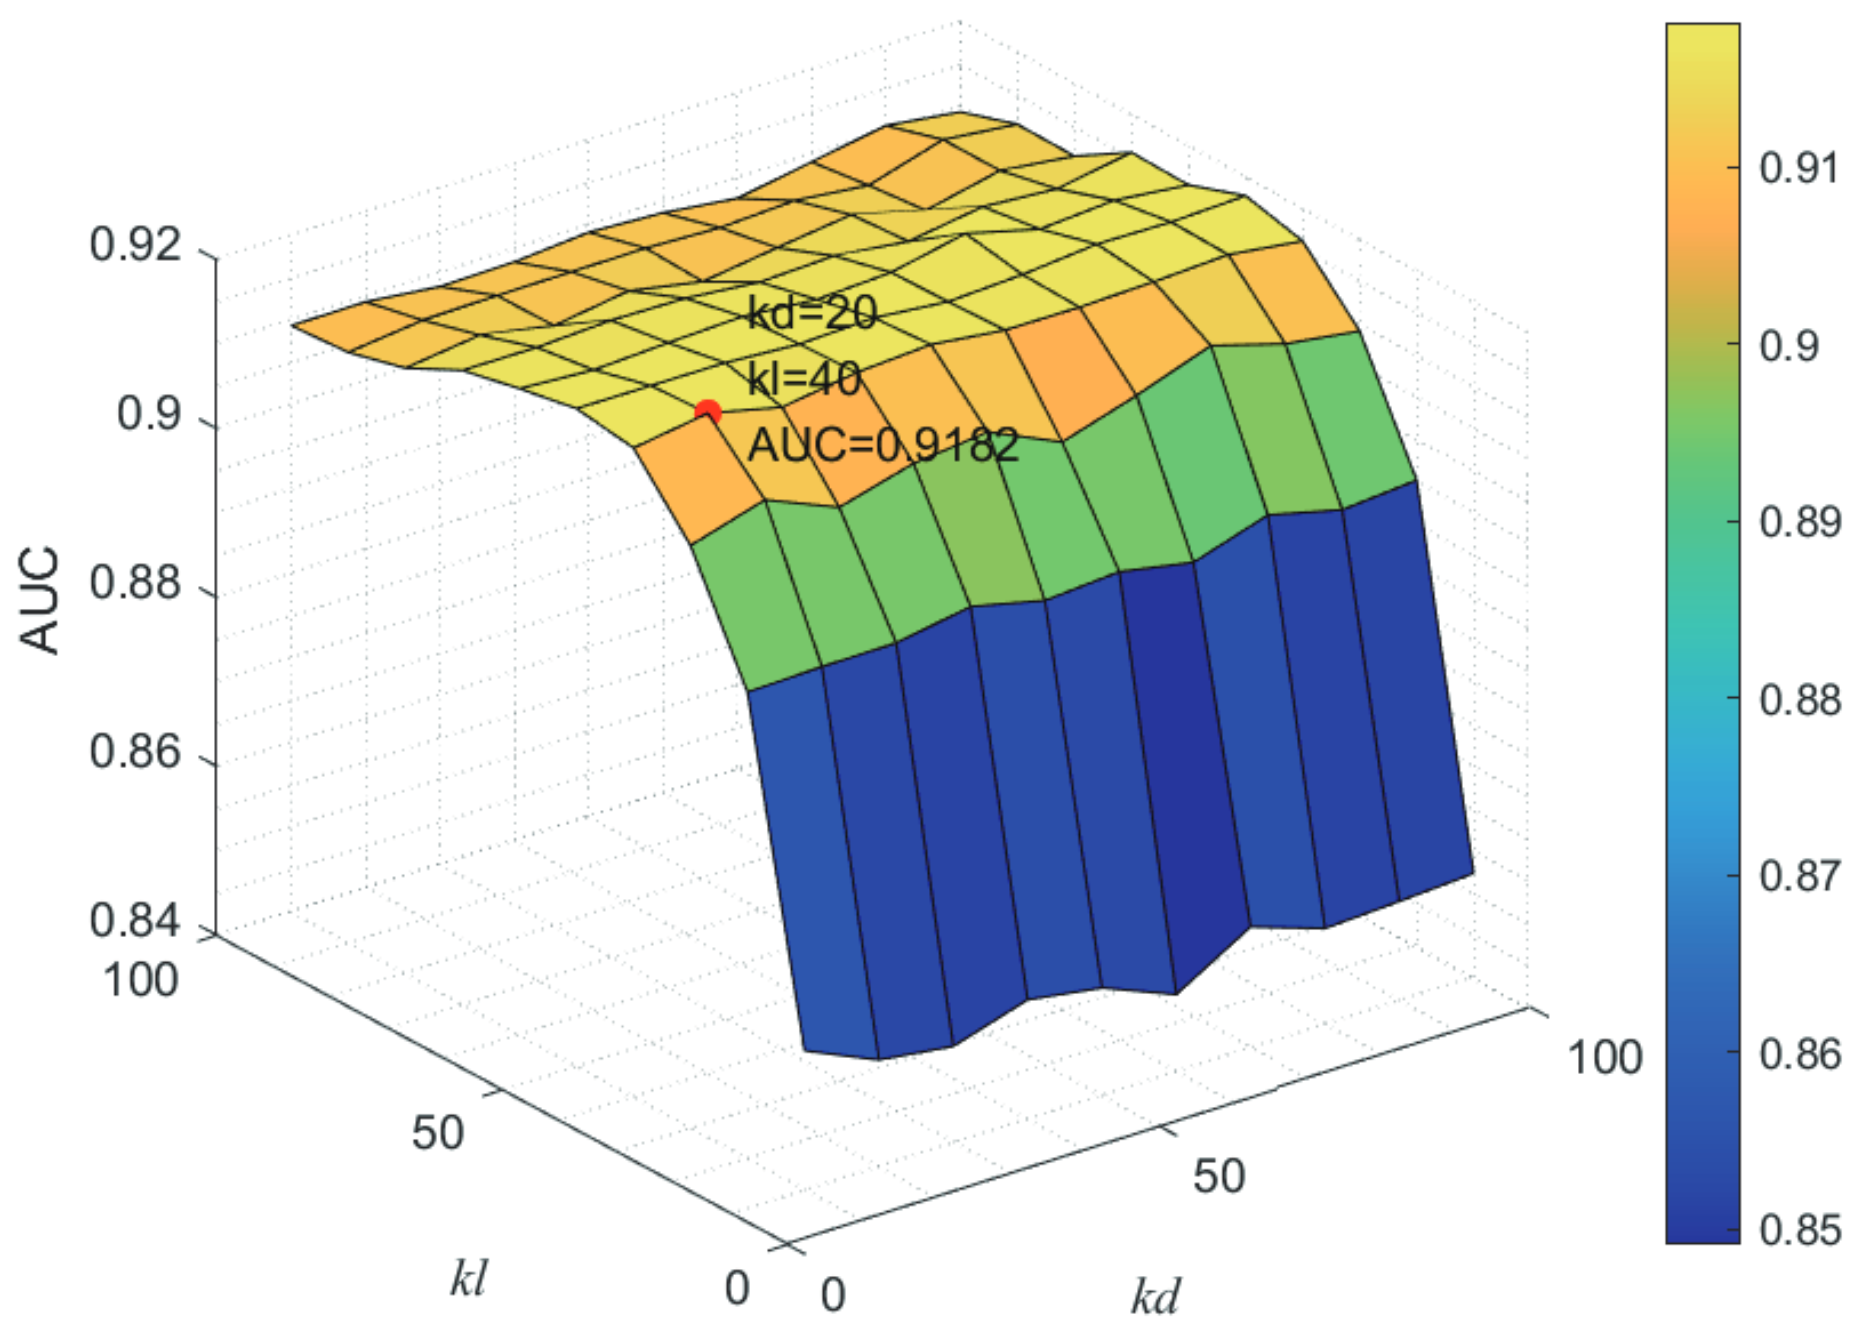
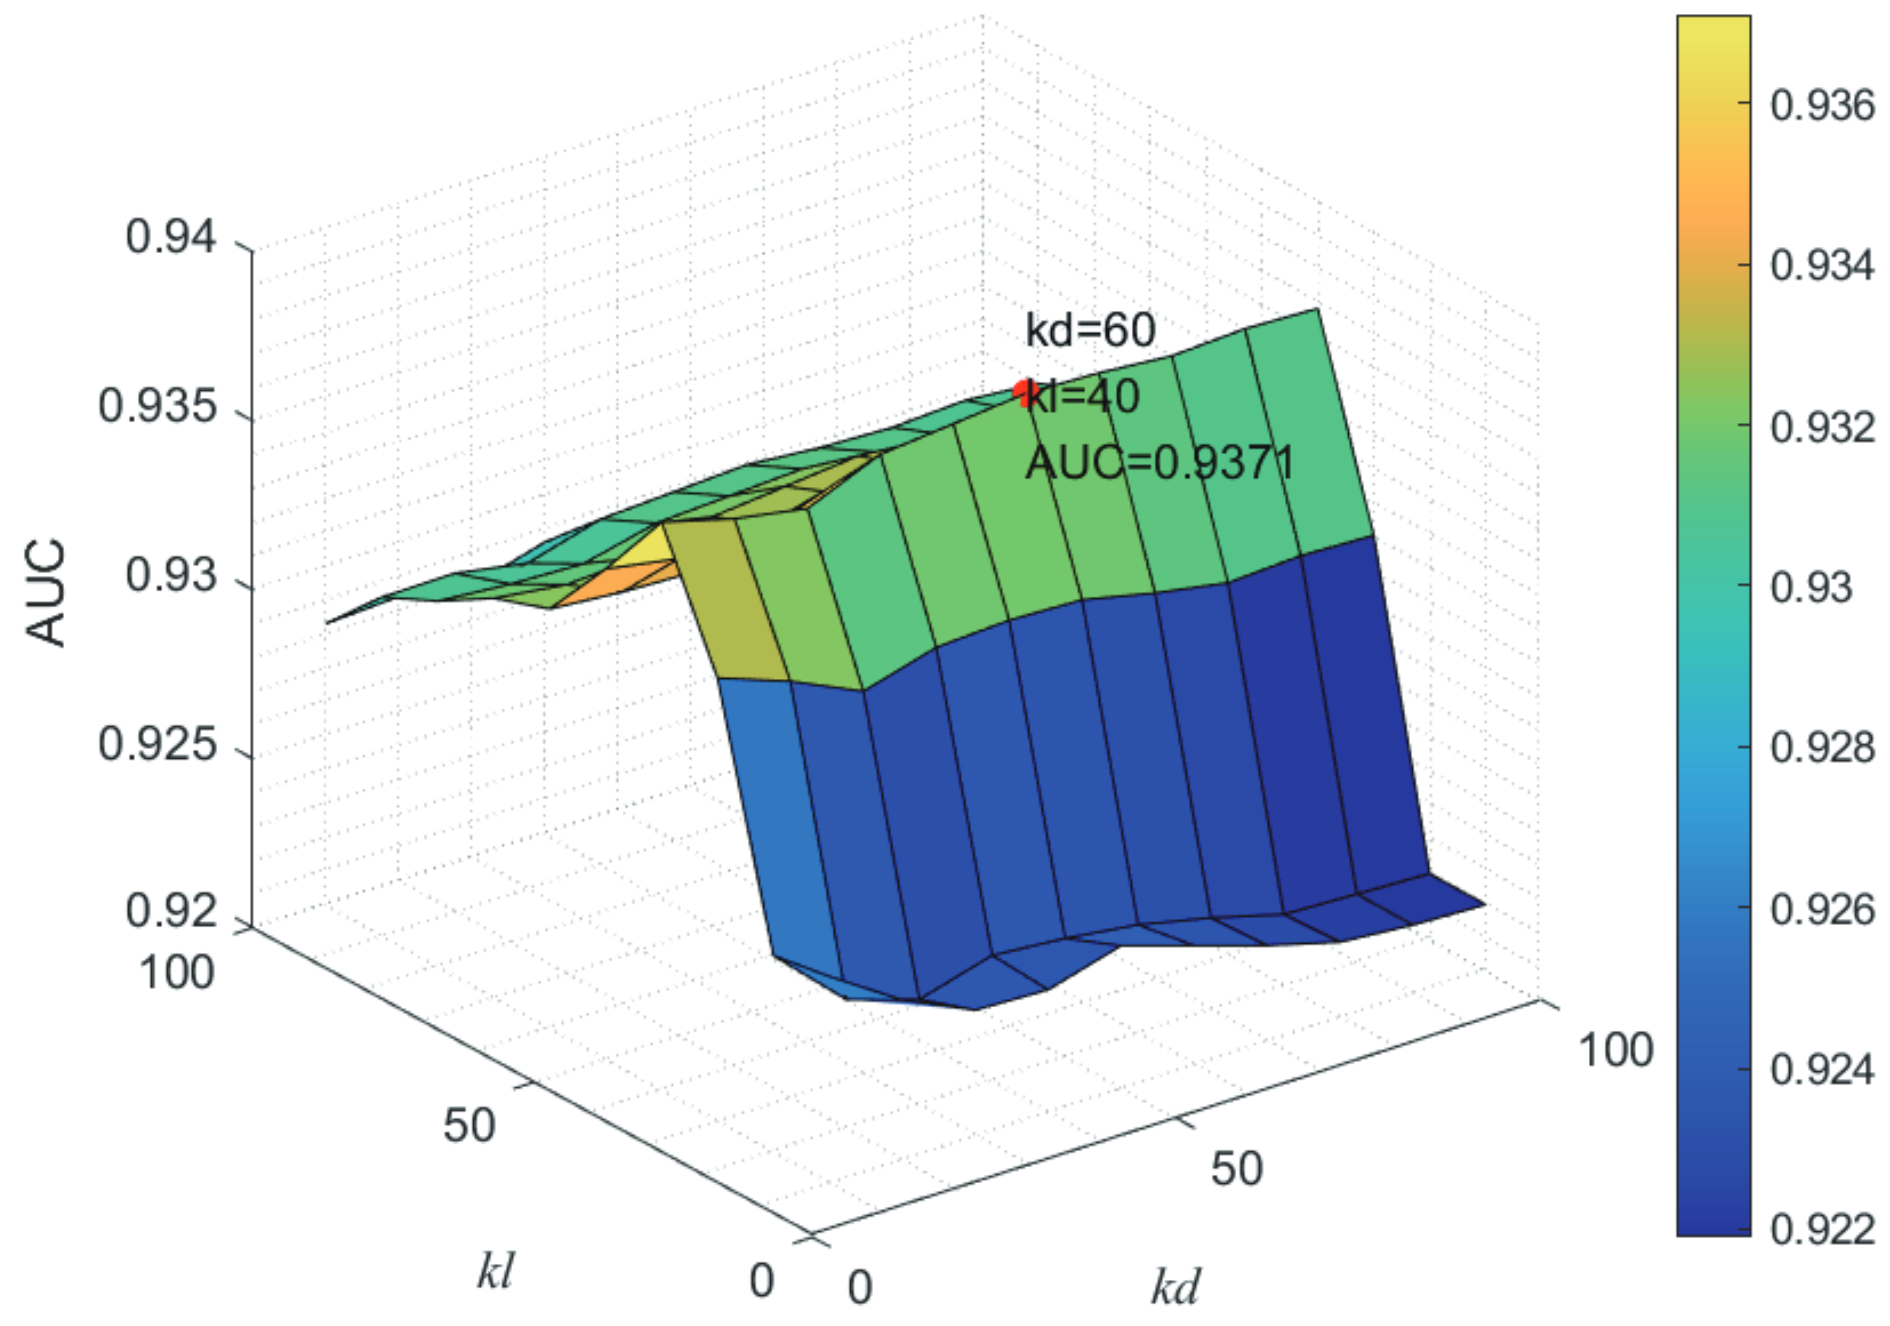
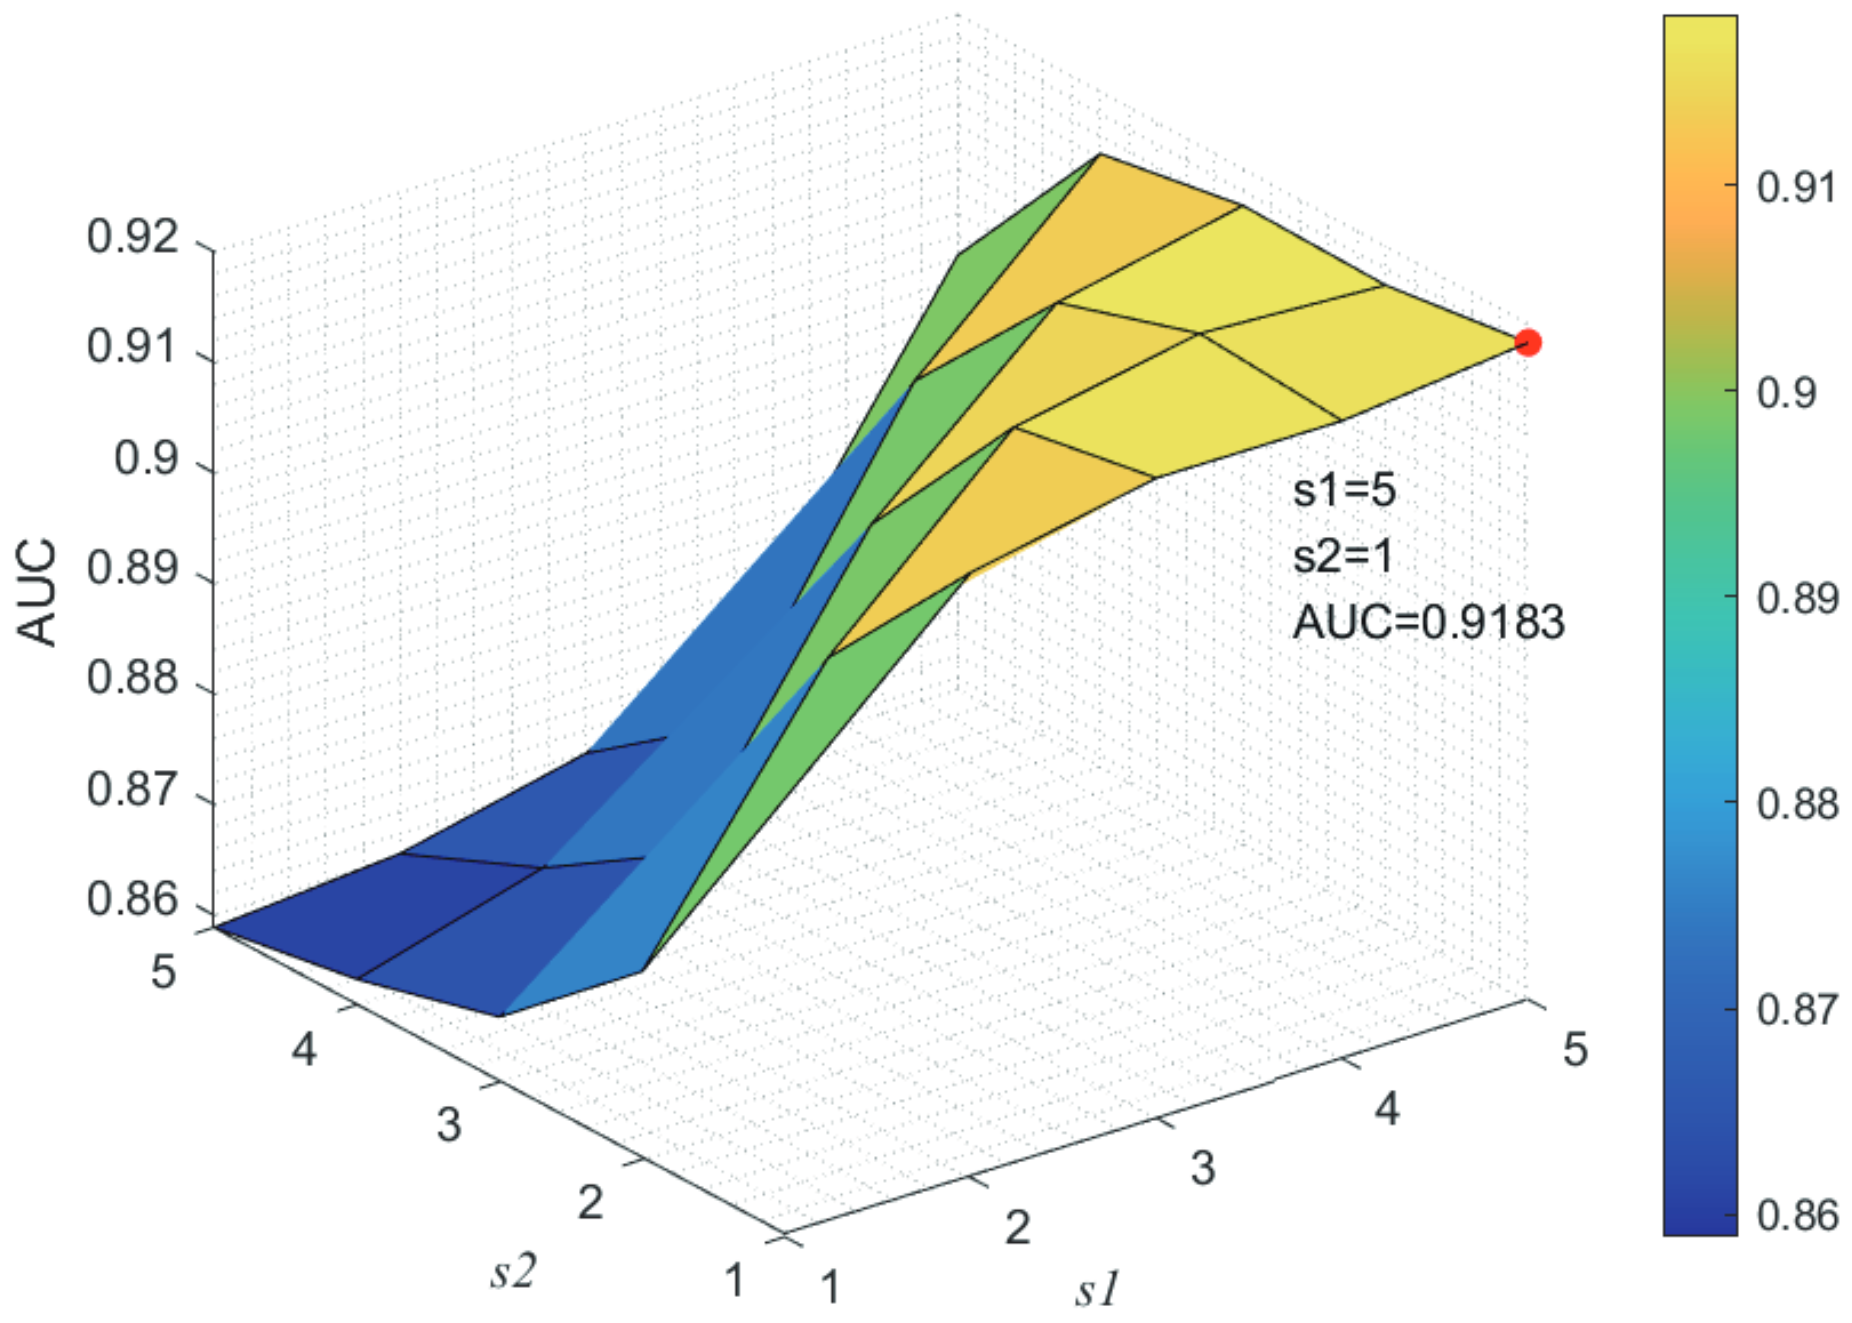
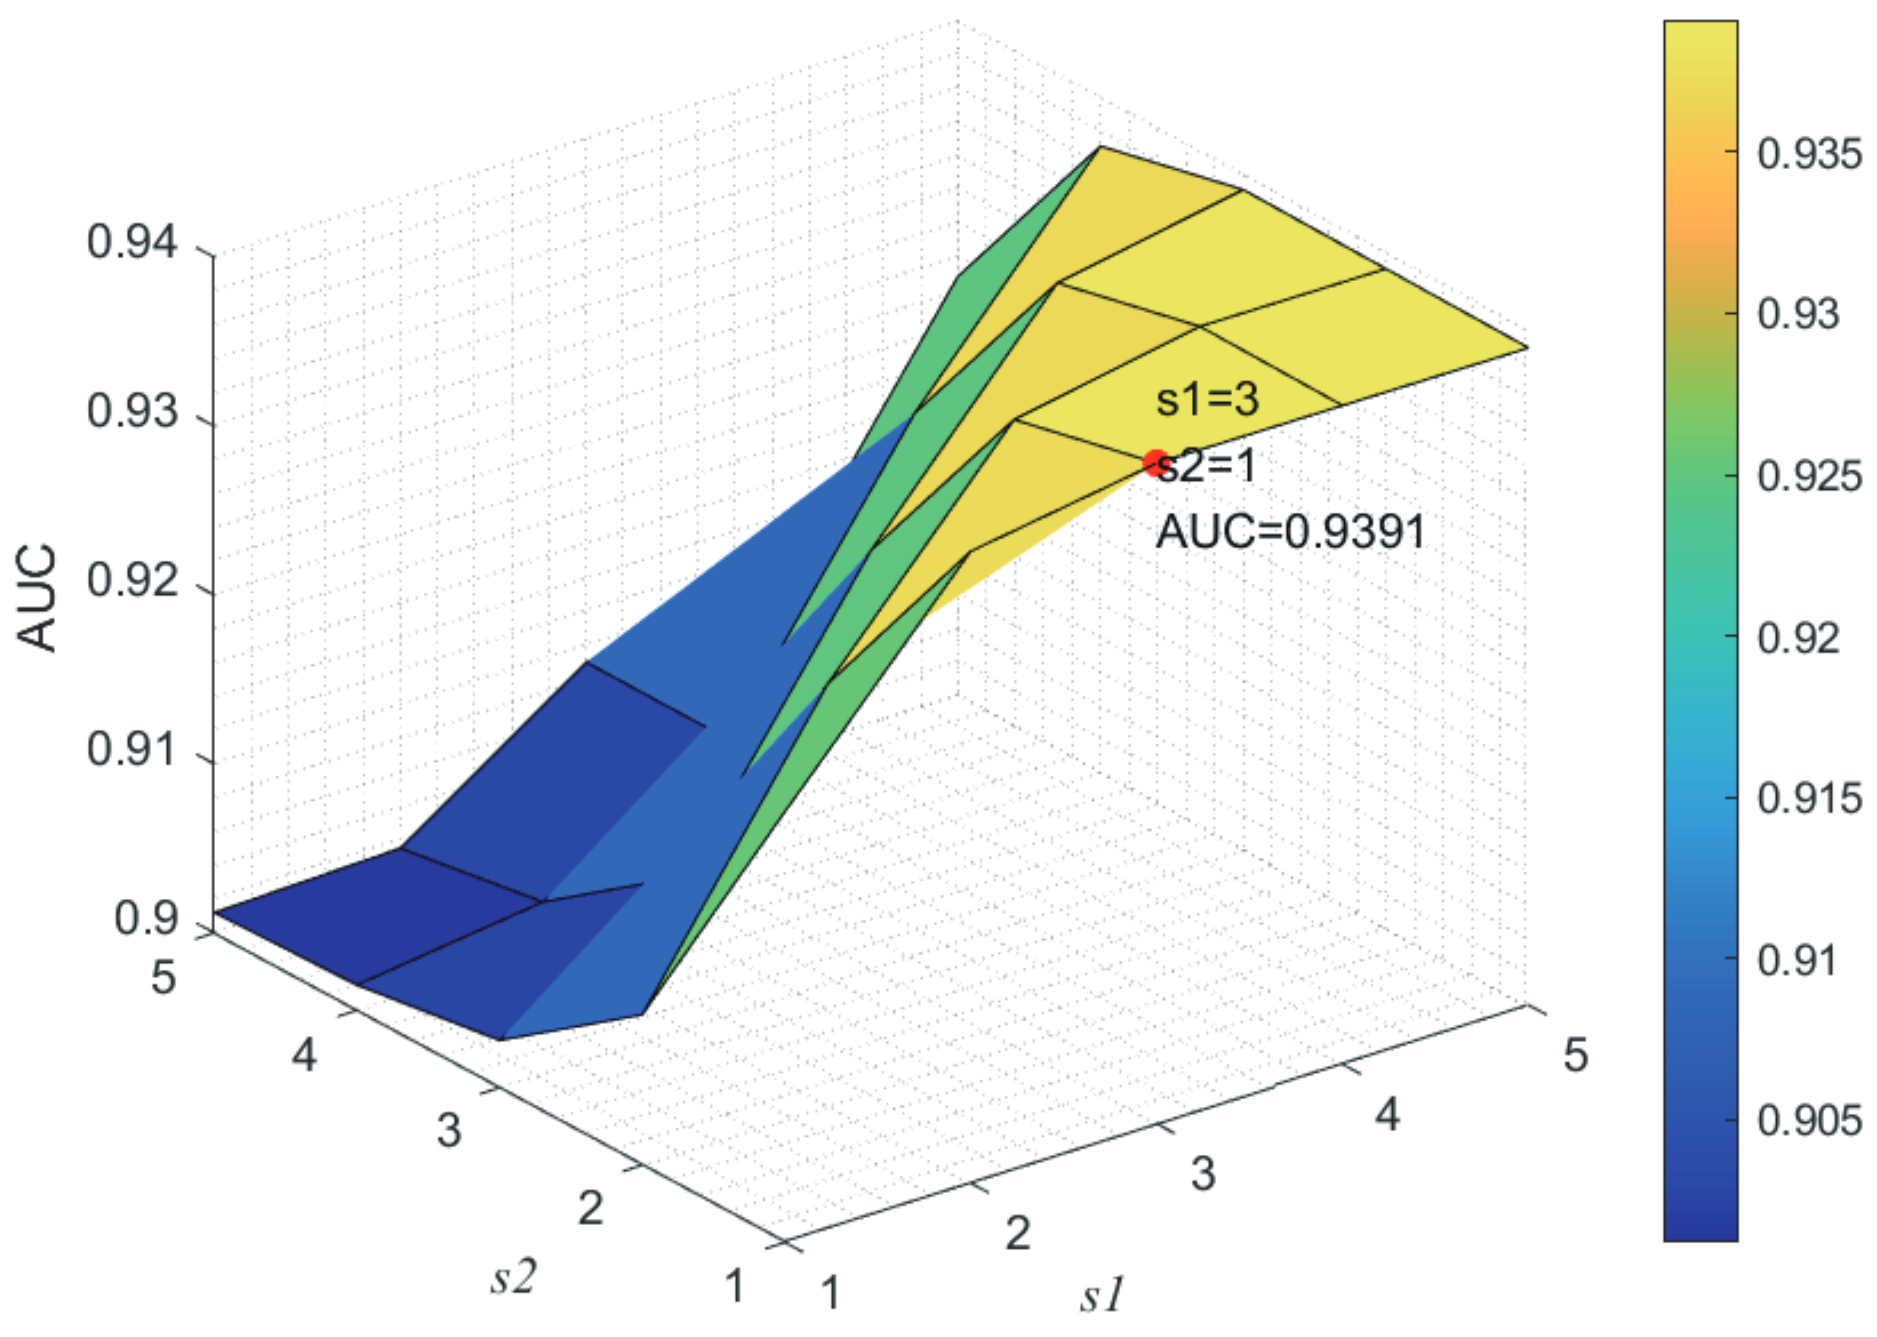
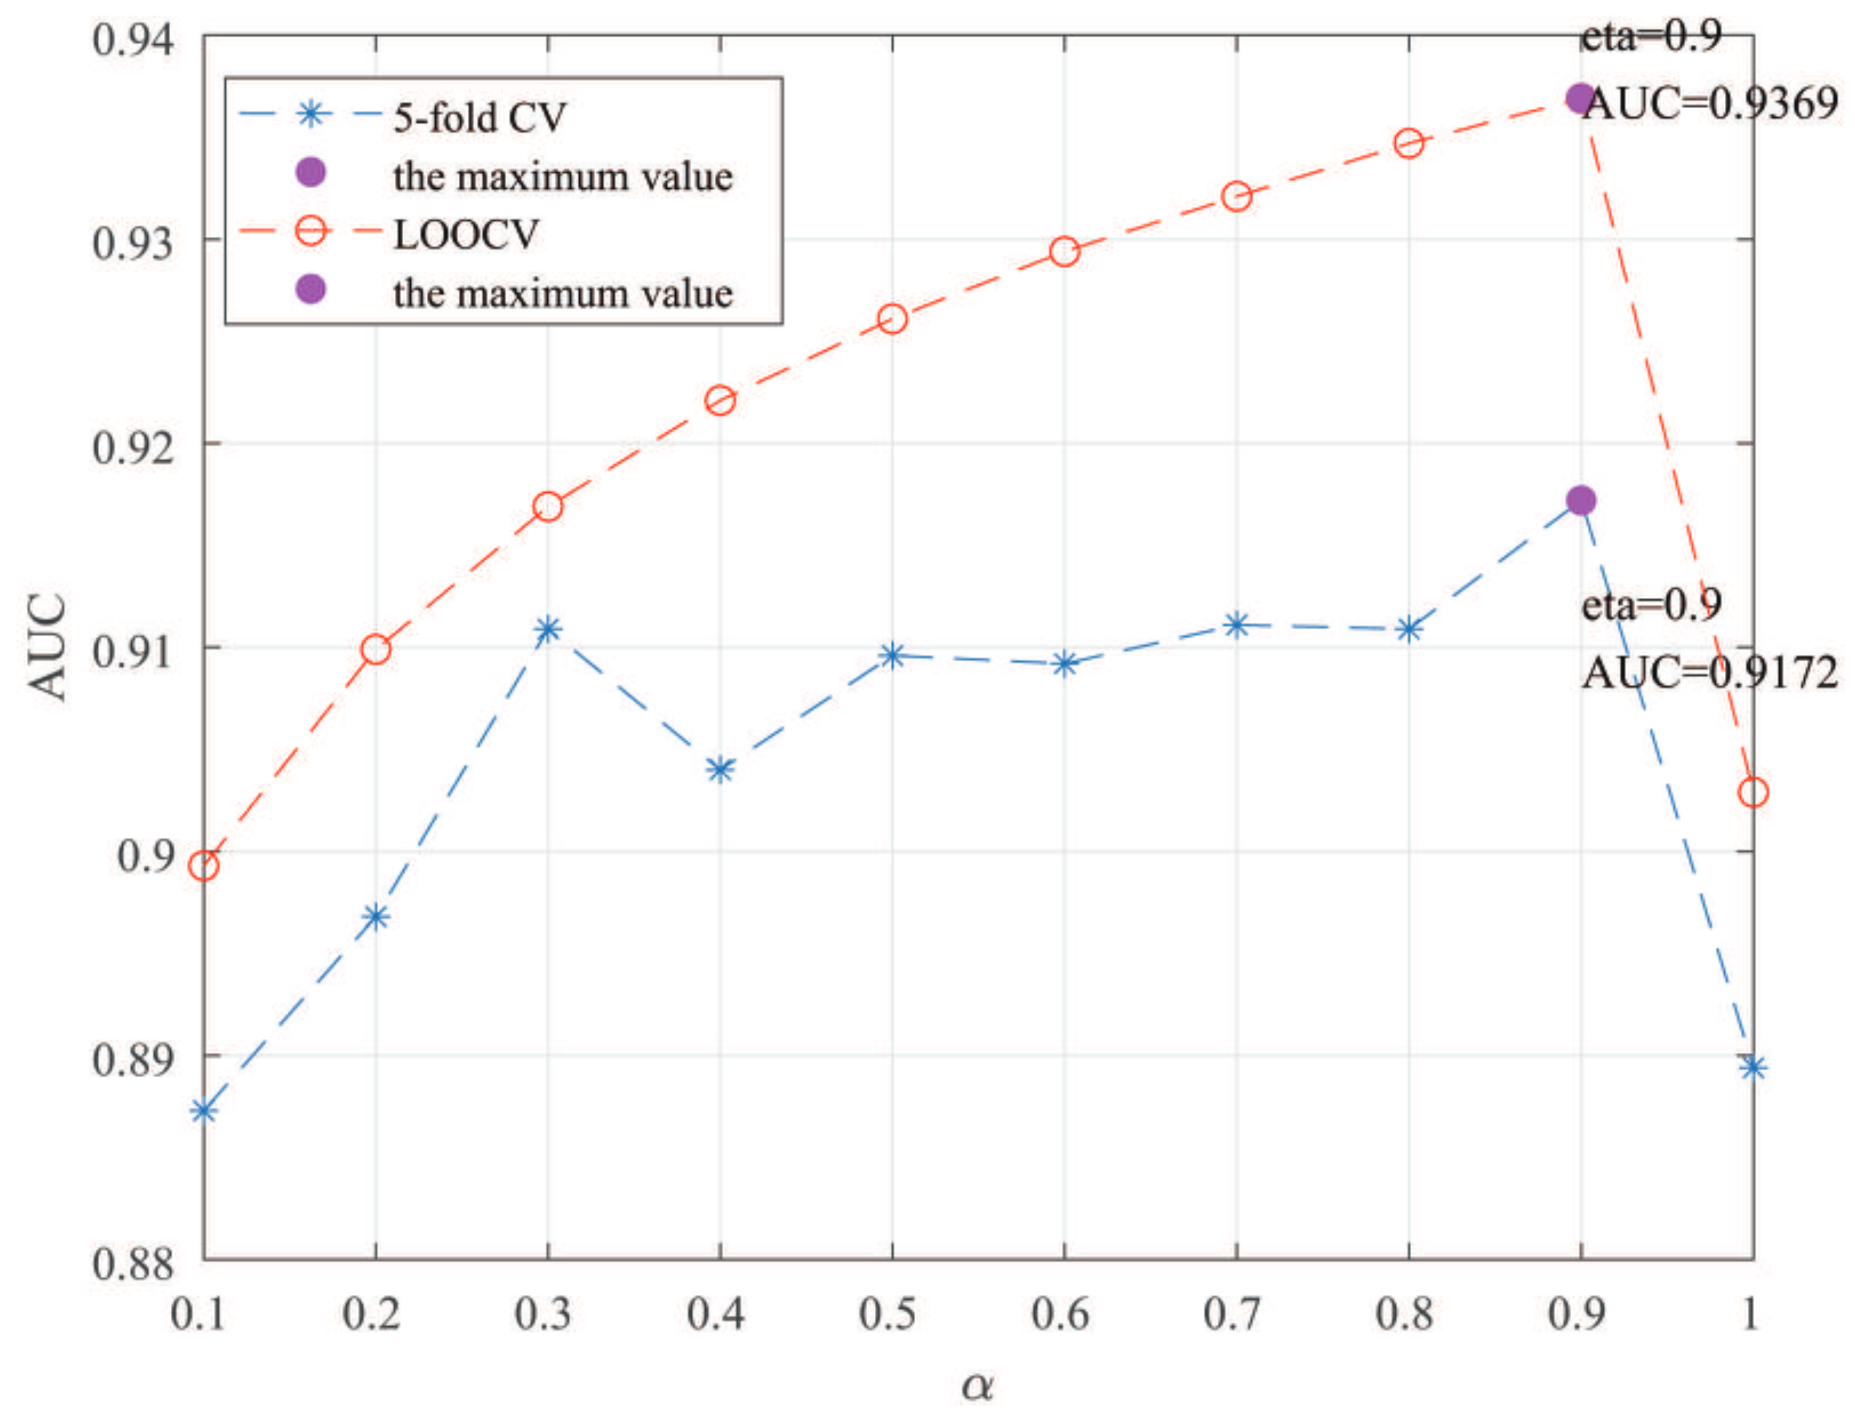
Here, we use the 5-fold CV and LOOCV to select the most appropriate parameters in the MSF-UBRW method. First, for the parameter c in the logistic function, it ranges from to . From Figure 5, we can see that MSF-UBRW can gain the best prediction performance when c is equal to in 5-fold CV and in LOOCV. As shown from Figure 6, and is set to 1 and 9 in 5-fold CV, respectively. According to Figure 7, and is set to 2 and 10 in LOOCV, respectively. Next, for the number of known nearest neighbors K and the delay factor in WKNKN, K is adjusted from 1 to 10 and is adjusted from to 1. According to Figure 8 and Figure 9, we finally set and in 5-fold CV, while and in LOOCV. Third, for the number of lncRNA neighbors and the number of disease neighbors in LNS, they are adjusted from 10 to 100, increasing by 10 each time. In fact, the number of lncRNA neighbors is less than the total number of lncRNAs, and the same is true for diseases. Considering the computational complexity, the maximum value of and is set to 100. As shown from Figure 10, and is set to 40 and 20 in 5-fold CV, respectively. According to Figure 11, and is set to 40 and 60 in LOOCV, respectively. Finally, we determine the maximum numbers of bi-random walks steps and on DSN and LSN. A grid searching method is conducted to analyze the parameters and via 5-fold CV and LOOCV. As seen from Figure 12 and Figure 13, the MSF-UBRW method achieves the highest AUC values when and in 5-fold CV and and in LOOCV. There is also a delay factor in the bi-random walk algorithm. is adjusted from to . The prediction performance as changes as shown in Figure 14. Obviously, should be equal to in both 5-fold CV and LOOCV.
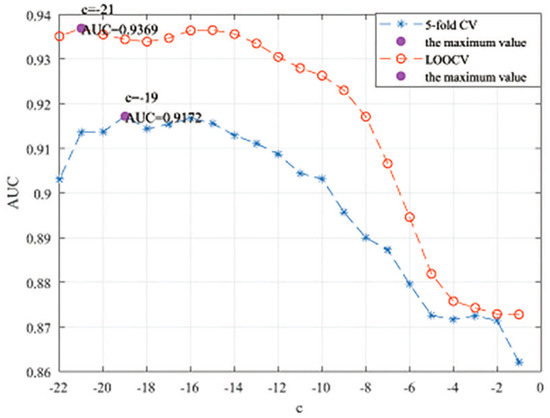
Figure 5.
Sensitivity analysis of parameter c.
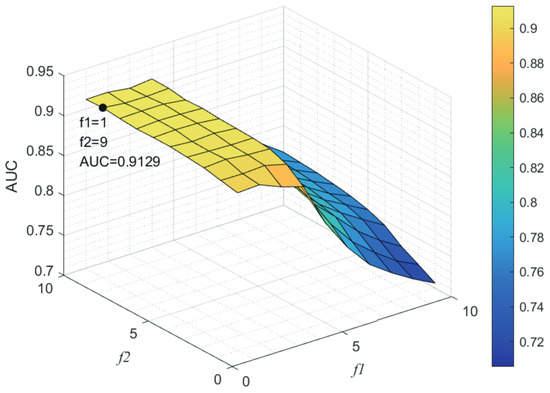
Figure 6.
Sensitivity analysis of parameter and .
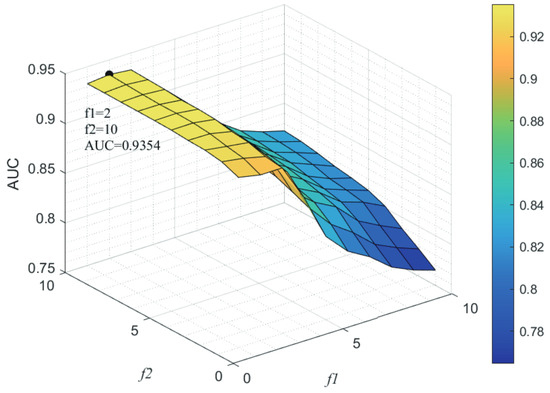
Figure 7.
Sensitivity analysis of parameter and .
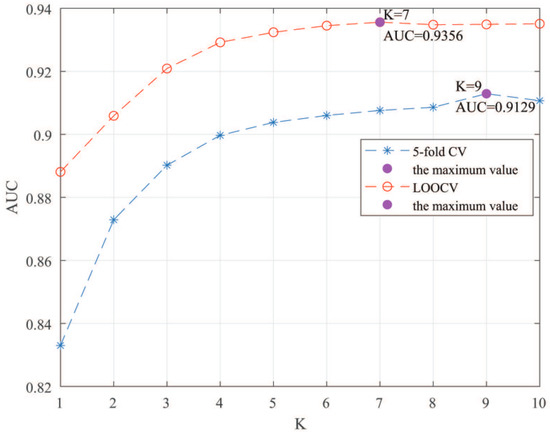
Figure 8.
Sensitivity analysis of parameter K.
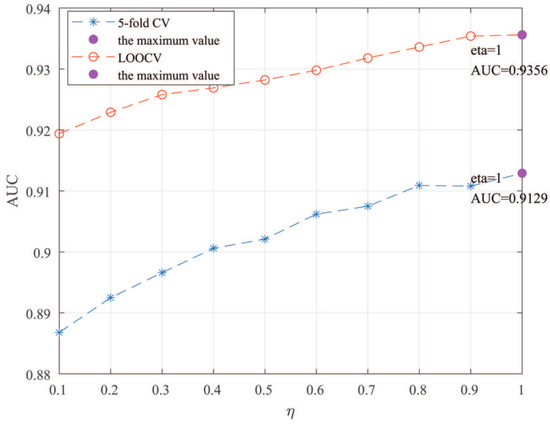
Figure 9.
Sensitivity analysis of parameter .
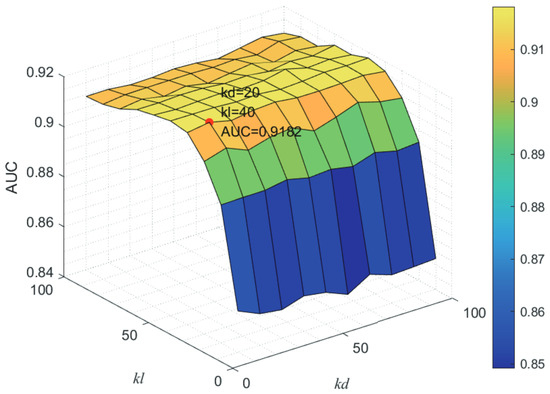
Figure 10.
Joint sensitivity analysis of parameters and .
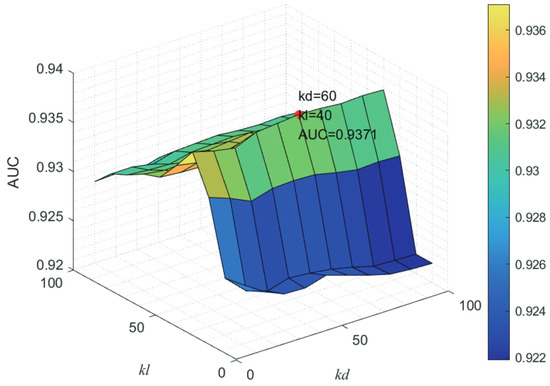
Figure 11.
Joint sensitivity analysis of parameters and .
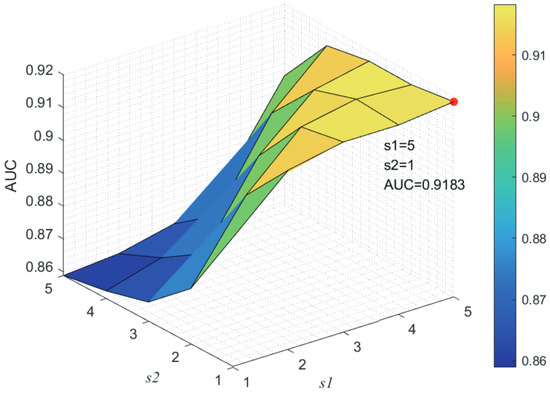
Figure 12.
Joint sensitivity analysis of parameters and .
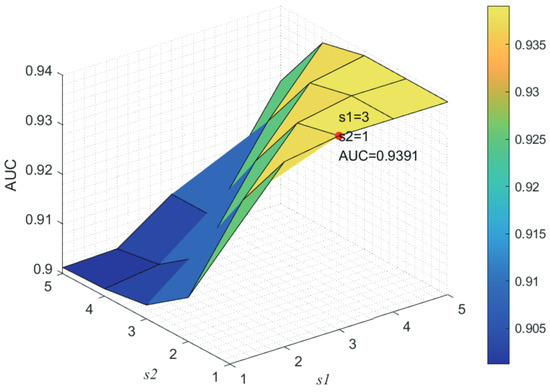
Figure 13.
Joint sensitivity analysis of parameters and .
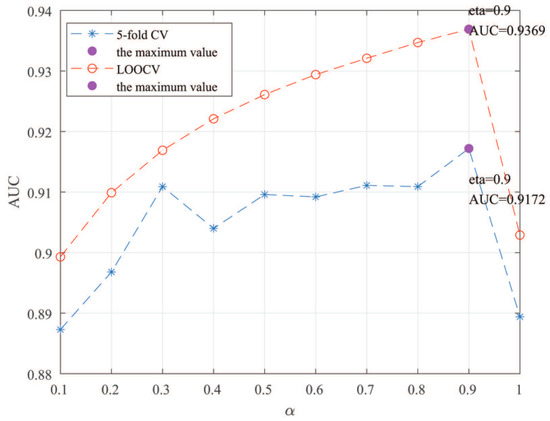
Figure 14.
Sensitivity analysis of parameter .
3.4. Case Studies
To further verify the prediction ability of the MSF-UBRW method, case studies of human diseases are performed in this section. Three common cancers are selected for verification: prostate cancer, ESCC, and NSCLC. The final prediction matrix is obtained by the MSF-UBRW method. The predicted scores are ranked in descending order for the column and the top 20 lncRNAs are selected for analysis. The prediction results are validated by two databases: Disease v2.0 (http://www.rnanut.net/lncrnadisease/) and Lnc2Cancer 3.0/ (http://bio-bigdata.hrbmu.edu.cn/lnc2cancer/).
Prostate cancer is caused by malignant hyperplasia of prostate epithelial cells with a very high incidence of the urinary system. It is closely related to age. The older the age, the higher the incidence. The early symptoms of the disease are not obvious, and the symptoms of metastasis are prone to appear, which will endanger the life of the patients. The top 20 lncRNAs with higher predicted scores related to prostate cancer are listed in descending order in Table 2. From Table 2, we can find that 13 known LDAs in the gold standard dataset are predicted successfully. We use the database LncRNADisease v2.0 and Lnc2Cancer 3.0 to verify whether the other 7 lncRNAs are associated with prostate cancer.

Table 2.
Top 20 identified lncRNAs for prostate cancer.
Recent studies [40] revealed that the CDKN2B-AS1 is overexpressed in prostate cancer. Du et al. [41] found that XIST is down-regulated in prostate cancer specimens and cell lines, and has a tumor suppressor effect in prostate cancer. Its regulatory role will provide new ideas for epigenetic diagnosis and treatment of prostate cancer. Huo et al. [42] demonstrated that BCYRN1 was overexpressed in prostate tumors. Some studies [43,44] revealed PTENP1 may act to suppress prostate cancer. So far, NPTN-IT1 and BOK-AS1 have not been found to be related to prostate cancer.
ESCC belongs to the category of esophageal malignant tumors. The main symptoms of ESCC are pain and difficulty swallowing after eating hard and dry food, which brings great pain to the patients. The cause of ESCC is not yet fully understood, and its treatment remains a worldwide problem till now. From Table 3, we can see that 13 known LDAs are predicted successfully. By searching in the database LncRNADisease v2.0 and Lnc2Cancer 3.0, six lncRNAs (GAS5, MEG3, PVT1, NEAT1, XIST and CCAT1) associated with ESCC are confirmed. Wang et al. [45] found that the expression of GAS5 was significantly reduced in ESCC patients and it can act as a tumor suppressor factor. Huang et al. [46] revealed that MEG3 decreased significantly in ESCC tissues. Zhang et al. [47] reported that the lncRNA CCAT1 was significantly up-regulated in ESCC tissues compared with normal tissues, and it was related to the prognosis. The up-regulation of XIST expression promoted the proliferation of ESCC cells [48]. Besides, PVT1 and NEAT1 were also verified to be related to ESCC [49,50,51,52]. BCYRN1 has not been confirmed to be associated with ESCC.

Table 3.
Top 20 identified lncRNAs for esophageal squamous cell carcinoma.
Lung cancer is currently the cancer that causes the highest mortality among malignant tumors in China. Compared to small cell lung cancer, NSCLC develops and spreads more slowly, but it is usually found to be very advanced and difficult to control and treat. There are 15 lncRNAs associated with NSCLC in the oringinal dataset. In this experiment, all these 15 lncRNAs have been confirmed to be associated with NSCLC. LncRNAs H19, CDKN2B-AS1, BCYRN1, UCA1 and LSINCT5 are demonstrated to be associated with NSCLC in the database LncRNADisease v2.0 and Lnc2Cancer 3.0. Evidences that these four lncRNAs are related to NSCLC are shown in Table 4 [53,54,55,56,57,58,59,60]. There is no evidence to prove that CDKN2B-AS1 is associated with NSCLC.

Table 4.
Top 20 identified lncRNAs for non-small cell lung cancer.
4. Conclusions
More and more studies have found that changes in lncRNA expression patterns are associated with specific diseases. Building computational models to predict LDAs is not only a meaningful complement to experimental methods, but also helps researchers to gain insight into the pathogenesis of diseases. In this study, based on GIP and LNS, MSF-UBRW performs unbalanced bi-random walks in the LSN and DSN based on multiple similarities fusion to find new LDAs. Compared with LDA-LNSUBRW, HAUBRW, LLCLPLDA, LRLSLDA, and RWRlncD methods, the MSF-UBRW method achieves the highest AUC values under 5-fold CV and LOOCV. In addition, case studies of prostate cancer, ESCC, and NSCLC also confirm the prediction ability of the MSF-UBRW method.
Although the MSF-UBRW method has achieved good prediction results, it still have some limitations. Existing experimental data are inadequate, which limits the prediction performance of the MSF-UBRW method. In the future, as more LDA data are available, the MSF-UBRW method will be improved. However, the complexity and heterogeneity of biological data also bring some difficulties in improving the prediction ability of the algorithm. In the future, we will integrate data from different sources and improve the integrity and quality of experimental data to achieve higher prediction performance.
Author Contributions
Conceptualization, L.D.; methodology, L.D. and J.S.; validation, R.Z., J.W. and F.L.; software, L.D. and J.L.; formal analysis, J.S.; writing—original draft preparation, L.D.; writing—review and editing, L.D., R.Z. and J.S. All authors have read and agreed to the published version of the manuscript.
Funding
This research was funded by the National Natural Science Foundation of China (61902215, 61972226, 61902216, and 62172253).
Institutional Review Board Statement
Not applicable.
Informed Consent Statement
Not applicable.
Data Availability Statement
The datasets used in this study can be derived from the e LncRNADisease website (http://www.cmbi.bjmu.edu.cn/lncrnadisease).
Acknowledgments
We are grateful to the anonymous reviewers whose suggestions and comments contributed to the significant improvement of this paper.
Conflicts of Interest
The authors declare no conflict of interest.
Abbreviations
The following abbreviations are used in this manuscript:
| LDAs | lncRNA-disease associations |
| MSF-UBRW | multiple similarities fusion based on unbanlanced bi-random walk |
| GIP | Gaussian Interaction Profile |
| LOOCV | leave-one-out cross-validation |
| NMF | non-negative matrix factorization |
| LSN | lncRNA similarity network |
| DSN | disease similarity network |
| WKNKN | weighted K-nearest known neighbors |
| ESCC | esophageal squamous cell carcinoma |
| NSCLC | small cell lung cancer |
References
- Wang, K.C.; Chang, H.Y. Molecular mechanisms of long noncoding RNAs. Mol. Cell 2011, 43, 904–914. [Google Scholar] [CrossRef]
- Zhao, W.; Luo, J.; Jiao, S. Comprehensive characterization of cancer subtype associated long non-coding RNAs and their clinical implications. Sci. Rep. 2014, 4, 6591. [Google Scholar] [CrossRef]
- Wapinski, O.; Chang, H.Y. Long noncoding RNAs and human disease. Trends Cell Biol. 2011, 21, 354–361. [Google Scholar] [CrossRef]
- Guttman, M.; Rinn, J.L. Modular regulatory principles of large non-coding RNAs. Nature 2012, 482, 339–346. [Google Scholar] [CrossRef]
- Kumar, P.; Bhattacharyya, S.; Peters, K.W.; Glover, M.L.; Sen, A.; Cox, R.T.; Kundu, S.; Caohuy, H.; Frizzell, R.A.; Pollard, H.B. Long noncoding RNAs and the genetics of cancer. Br. J. Cancer 2013, 108, 2419–2425. [Google Scholar]
- Mercer, T.R.; Dinger, M.E.; Mattick, J.S. Long non-coding RNAs: Insights into functions. Nat. Rev. Genet. 2009, 10, 155–159. [Google Scholar] [CrossRef]
- Zhang, Q.; Chen, C.Y.; Yedavalli, V.S.R.K.; Jeang, K.T. NEAT1 Long Noncoding RNA and Paraspeckle Bodies Modulate HIV-1 Posttranscriptional Expression. Mbio 2013, 4, e00596-12. [Google Scholar] [CrossRef]
- Pasmant, E.; Sabbagh, A.; Vidaud, M.; Bieche, I. ANRIL. a long, noncoding RNA, is an unexpected major hotspot in GWAS. FASEB J. 2010, 25, 444–448. [Google Scholar] [CrossRef]
- Faghihi, M.A.; Modarresi, F.; Khalil, A.M.; Wood, D.E.; Sahagan, B.G.; Morgan, T.E.; Finch, C.E.; Laurent, G.S.; Kenny, P.J.; Wahlestedt, C. Expression of a noncoding RNA is elevated in Alzheimer’s disease and drives rapid feed-forward regulation of beta-secretase. Nat. Med. 2008, 14, 723–730. [Google Scholar] [CrossRef]
- Zhou, W.; Ye, X.L.; Xu, J.; Cao, M.G.; Fang, Z.Y.; Li, L.; Guan, G.H.; Liu, Q.; Qian, Y.H.; Xie, D. The lncRNA H19 mediates breast cancer cell plasticity during EMT and MET plasticity by differentially sponging miR-200b/c and let-7b. Sci. Signal. 2017, 10, eeaak9557. [Google Scholar] [CrossRef]
- Hua, J.T.; Ahmed, M.; Guo, H.Y.; Zhang, Y.Z.; Chen, S.J.; Soares, F.; Lu, J.; Zhou, S.; Wang, M.; Li, H.; et al. Risk SNP-Mediated Promoter-Enhancer Switching Drives Prostate Cancer through lncRNA PCAT19. Cell 2018, 174, 564–575. [Google Scholar] [CrossRef] [PubMed]
- Zhang, D.Y.; Cao, C.H.; Liu, L.; Wu, D.H. Up-regulation of LncRNA SNHG20 Predicts Poor Prognosis in Hepatocellular Carcinoma. J. Cancer 2016, 7, 608–617. [Google Scholar] [CrossRef] [PubMed]
- Luo, H.R.; Zhao, X.; Wan, X.D.; Huang, S.S.; Wu, D.L. Gene microarray analysis of the lncRNA expression profile in human urothelial carcinoma of the bladder. Int. J. Clin. Exp. Med. 2014, 7, 1244–1254. [Google Scholar]
- Lu, Q.S.; Ren, S.J.; Lu, M.; Zhang, Y.; Zhu, D.H.; Zhang, X.G.; Li, T.T. Computational prediction of associations between long non-coding RNAs and proteins. BMC Genom. 2013, 14, 651. [Google Scholar] [CrossRef]
- Le, O.Y.; Jiang, H.; Zhang, X.F.; Li, Y.R.; Sun, Y.W.; Shan, H.; Zhu, Z.X. LncRNA-Disease Association Prediction Using Two-Side Sparse Self-Representation. Front. Genet. 2019, 5, 476. [Google Scholar]
- Ping, P.Y.; Wang, L.; Kuang, L.A.; Ye, S.T.; Iqbal, M.F.B.; Pei, T.R. A novel method for lncRNA-disease association prediction based on an lncRNA-disease association network. IEEE/ACM Trans. Comput. Biol. Bioinform. 2018, 16, 688–693. [Google Scholar] [CrossRef] [PubMed]
- Fu, G.Y.; Wang, J.; Domeniconi, C.; Yu, G.X. Matrix factorization-based data fusion for the prediction of lncRNA-disease associations. Bioinformatics 2018, 34, 1529–1537. [Google Scholar] [CrossRef]
- Xie, G.; Jiang, J.; Sun, Y. LDA-LNSUBRW: LncRNA-disease association prediction based on linear neighborhood similarity and unbalanced bi-random walk. IEEE/ACM Trans. Comput. Biol. Bioinform. 2020, 19, 989–997. [Google Scholar] [CrossRef]
- Lan, W.; Li, M.; Zhao, K.J.; Liu, J.; Wu, F.X.; Pan, Y.; Wang, J.X. LDAP: A web server for lncRNA-disease association prediction. Bioinformatics 2016, 33, 458–460. [Google Scholar] [CrossRef]
- Chen, X.; Yan, G.Y. Novel human lncRNA-disease association inference based on lncRNA expression profile. Bioinformatics 2013, 29, 2617–2624. [Google Scholar] [CrossRef]
- Gao, M.M.; Cui, Z.; Gao, Y.L.; Wang, J.; Liu, J.X. Multi-Label Fusion Collaborative Matrix Factorization for Predicting LncRNA-Disease Associations. IEEE J. Biomed. Health Inform. 2021, 25, 881–890. [Google Scholar] [CrossRef] [PubMed]
- Lu, C.Q.; Yang, M.Y.; Luo, F.; Wu, F.X.; Li, M.; Pan, Y.; Li, Y.H.; Wang, J.X. Prediction of lncRNA-disease associations based on inductive matrix completion. Bioinformatics 2018, 34, 3357–3364. [Google Scholar] [CrossRef] [PubMed]
- Biswas, A.K.; Kang, M.; Kim, D.C.; Ding, C.H.; Zhang, B.; Wu, X.; Gao, J.X. Inferring disease associations of the long non-coding RNAs through non-negative matrix factorization. Netw. Model. Anal. Health Inform. Bioinform. 2015, 4, 9. [Google Scholar] [CrossRef]
- Sun, J.; Shi, H.; Wang, Z.; Zhang, C.; Liu, L.; Wang, L.; He, W.; Hao, D.; Liu, S.; Zhou, M. Inferring novel lncRNA-disease associations based on a random walk model of a lncRNA functional similarity network. Mol. Biosyst. 2014, 10, 2074–2081. [Google Scholar] [CrossRef]
- Zhou, M.; Wang, X.J.; Li, J.W.; Hao, D.P.; Wang, Z.Z.; Shi, H.B.; Han, L.; Zhou, H.; Sun, J. Prioritizing candidate disease-related long non-coding RNAs by walking on the heterogeneous lncRNA and disease network. Mol. Biosyst. 2015, 11, 760–769. [Google Scholar] [CrossRef] [PubMed]
- Xie, G.B.; Huang, S.H.; Luo, Y.; Ma, L.; Lin, Z.Y.; Sun, Y.P. LLCLPLDA: A novel model for predicting lncRNA-disease associations. Mol. Genet. Genom. 2019, 294, 1477–1486. [Google Scholar] [CrossRef]
- Xie, G.B.; Wu, C.H.; Gu, G.S.; Huang, B. HAUBRW: Hybrid algorithm and unbalanced bi-random walk for predicting lncRNA-disease associations. Genomics 2020, 112, 4777–4787. [Google Scholar] [CrossRef]
- Chen, G.; Wang, Z.Y.; Wang, D.Q.; Qiu, C.X.; Liu, M.X.; Chen, X.; Zhang, Q.P.; Yan, G.Y.; Cui, Q.H. LncRNADisease: A database for long-non-coding RNA-associated diseases. Nucleic Acids Res. 2012, 41, 983–986. [Google Scholar] [CrossRef]
- Chen, X.; Yan, C.G.C.; Luo, C.; Ji, W.; Zhang, Y.D.; Dai, Q.H. Constructing lncRNA functional similarity network based on lncRNA-disease associations and disease semantic similarity. Sci. Rep. 2015, 5, 11338. [Google Scholar] [CrossRef]
- Chen, X.; Huang, Y.A.; You, Z.H.; Yan, G.Y.; Wang, X.S. A novel approach based on KATZ measure to predict associations of human microbiota with non-infectious diseases. Bioinformatics 2016, 33, 733–739. [Google Scholar] [CrossRef]
- Liu, J.X.; Cui, Z.; Gao, Y.L.; Kong, X.Z. WGRCMF: A Weighted Graph Regularized Collaborative Matrix Factorization Method for Predicting Novel LncRNA-Disease Associations. IEEE J. Biomed. Health Inform. 2020, 25, 257–265. [Google Scholar] [CrossRef] [PubMed]
- Yan, C.; Duan, G.H.; Wu, F.X.; Pan, Y.; Wang, J.X. BRWMDA:Predicting microbe-disease associations based on similarities and bi-random walk on disease and microbe networks. IEEE/ACM Trans. Comput. Biol. Bioinform. 2020, 17, 1595–1604. [Google Scholar] [CrossRef] [PubMed]
- Ezzat, A.; Zhao, P.L.; Wu, M.; Li, X.L.; Kwoh, C.K. Drug-Target Interaction Prediction with Graph Regularized Matrix Factorization. IEEE/ACM Trans. Comput. Biol. Bioinform. 2017, 14, 646–656. [Google Scholar] [CrossRef] [PubMed]
- Roweis, S.T.; Saul, L.K. Nonlinear dimensionality reduction by locally linear embedding. Science 2020, 290, 2323–2326. [Google Scholar] [CrossRef] [PubMed]
- Wang, F.; Zhang, C. Label Propagation through Linear Neighborhoods. IEEE Trans. Knowl. Data Eng. 2007, 20, 55–67. [Google Scholar] [CrossRef]
- Zhang, W.; Chen, Y.; Li, D. Drug-Target Interaction Prediction through Label Propagation with Linear Neighborhood Information. Molecules 2017, 22, 2056. [Google Scholar] [CrossRef]
- Zhang, W.; Yue, X.; Liu, F.; Chen, Y.L.; Tu, S.K.; Zhang, X.N. A unified frame of predicting side effects of drugs by using linear neighborhood similarity. BMC Syst. Biol. 2017, 11, 23–34. [Google Scholar] [CrossRef]
- Luo, H.M.; Wang, J.X.; Li, M.; Luo, J.W.; Peng, X.Q.; Wu, F.X.; Pan, Y. Drug repositioning based on comprehensive similarity measures and bi-random walk algorithm. Bioinformatics 2016, 32, 2664–2671. [Google Scholar] [CrossRef]
- Luo, J.; Xiao, Q. A novel approach for predicting micrornadisease associations by unbalanced bi-random walk on heterogeneous network. J. Biomed. Inform. 2017, 66, 194–203. [Google Scholar] [CrossRef]
- Kinan, D.A.; Sophie, V.; Didier, M.; Andre, N.; Marick, L.; Anne, S.; Walid, C.; Jerome, C.; Elisabeth, L.; Wulfran, C.; et al. High Positive Correlations between ANRIL and p16-CDKN2A/p15-CDKN2B/p14-ARF Gene Cluster Overexpression in Multi-Tumor Types Suggest Deregulated Activation of an ANRIL-ARF Bidirectional Promoter. Noncoding RNA 2019, 8, 44. [Google Scholar]
- Du, Y.; Weng, X.D.; Wang, L.; Liu, X.H.; Zhu, H.C.; Guo, J.; Ning, J.Z.; Xiao, C.C. LncRNA XIST acts as a tumor suppressor in prostate cancer through sponging miR-23a to modulate RKIP expression. Oncotarget 2017, 8, 94358–94370. [Google Scholar] [CrossRef] [PubMed]
- Huo, W.; Qi, F.; Wang, K. Long non-coding RNA BCYRN1 promotes prostate cancer progression via elevation of HDAC11. Oncol. Rep. 2020, 8, 1233–1245. [Google Scholar] [CrossRef] [PubMed]
- Poliseno, L.; Salmena, L.; Zhang, J.; Carver, B.; Haveman, W.J.; Pandolfi, P.P. A coding-independent function of gene and pseudogene mRNAs regulates tumour biology. Nature 2010, 465, 1033–1038. [Google Scholar] [CrossRef] [PubMed]
- Eritja, N.; Santacana, M.; Maiques, O.; Gonzalez-Tallada, X.; Dolcet, X.; Matias-Guiu, X. Modeling glands with PTEN deficient cells and microscopic methods for assessing PTEN loss: Endometrial cancer as a model. Methods 2015, 77–78, 31–40. [Google Scholar] [CrossRef]
- Wang, K.; Li, J.; Xiong, G.; He, G.; Guan, X.Y.; Yang, K.; Bai, Y. Negative regulation of lncRNA GAS5 by miR-196a inhibits esophageal squamous cell carcinoma growth. Biochem. Biophys. Res. Commun. 2018, 49, 1151–1157. [Google Scholar] [CrossRef]
- Huang, Z.L.; Chen, R.P.; Zhou, X.T.; Zhan, H.L.; Hu, M.M.; Liu, B.; Wu, G.D.; Wu, L.F. Long non-coding RNA MEG3 induces cell apoptosis in esophageal cancer through endoplasmic reticulum stress. Oncol. Rep. 2017, 37, 3093–3099. [Google Scholar] [CrossRef]
- Zhang, E.B.; Han, L.; Yin, D.D.; He, X.Z.; Hong, L.Z.; Si, X.X.; Qiu, M.T.; Xu, T.P.; De, W.; Xu, L. H3K27 acetylation activated-long non-coding RNA CCAT1 affects cell proliferation and migration by regulating SPRY4 and HOXB13 expression in esophageal squamous cell carcinoma. Nuclc. Acids Res. 2017, 45, 3086–3101. [Google Scholar] [CrossRef]
- Wang, H.R.; Li, H.M.; Yu, Y.K.; Jiang, Q.F.; Zhang, R.X.; Sun, H.B.; Xing, W.Q.; Li, Y. Long non-coding RNA XIST promotes the progression of esophageal squamous cell carcinoma through sponging miR-129-5p and upregulating CCND1 expression. Cell Cycle 2021, 20, 39–53. [Google Scholar] [CrossRef]
- Hu, J.; Gao, W. Long noncoding RNA PVT1 promotes tumour progression via the miR-128/ZEB1 axis and predicts poor prognosis in esophageal cancer. Clin. Res. Hepatol. Gastroenterol. 2021, 45, 101701. [Google Scholar] [CrossRef]
- Li, P.D.; Hu, J.L.; Ma, C.; Ma, H.; Yao, J.; Chen, L.L.; Chen, J.; Cheng, T.T.; Yang, K.Y.; Wu, G.; et al. Upregulation of the long non-coding RNA PVT1 promotes esophageal squamous cell carcinoma progression by acting as a molecular sponge of miR-203 and LASP1. Oncotarget 2017, 8, 34164–34176. [Google Scholar]
- Li, Y.; Chen, D.; Gao, X.; Li, X.H.; Shi, G.N. LncRNA NEAT1 Regulates Cell Viability and Invasion in Esophageal Squamous Cell Carcinoma through the miR-129/CTBP2 Axis. Dis. Markers 2017, 2017, 5314649. [Google Scholar] [CrossRef] [PubMed]
- Chen, X.J.; Kong, J.Y.; Ma, Z.K.; Gao, S.G.; Feng, X.S. Up regulation of the long non-coding RNA NEAT1 promotes esophageal squamous cell carcinoma cell progression and correlates with poor prognosis. Am. J. Cancer Res. 2015, 5, 2808–2815. [Google Scholar] [CrossRef] [PubMed]
- Ge, X.J.; Zheng, L.M.; Feng, Z.X.; Li, M.Y.; Liu, L.; Zhao, Y.J.; Jiang, J.Y. H19 contributes to poor clinical features in NSCLC patients and leads to enhanced invasion in A549 cells through regulating miRNA203mediated epithelialmesenchymal transition. Oncol. Lett. 2018, 16, 4480–4488. [Google Scholar] [PubMed]
- Zheng, Z.H.; Wu, D.M.; Fan, S.H.; Zhang, Z.F.; Chen, G.Q.; Lu, J. Upregulation of miR-675-5p induced by lncRNA H19 was associated with tumor progression and development by targeting tumor suppressor p53 in non-small cell lung cancer. J. Cell. Biochem. 2019, 120, 18724–18735. [Google Scholar] [CrossRef]
- Lv, X.T.; Cui, Z.G.; Li, H.; Li, J.; Yang, Z.T.; Bi, Y.H.; Gao, M.; Zhang, Z.W.; Wang, S.L.; Zhou, B.S.; et al. Association between polymorphism in CDKN2B-AS1 gene and its interaction with smoking on the risk of lung cancer in a Chinese population. Hum. Genom. 2019, 13, 58. [Google Scholar] [CrossRef]
- Tang, R.X.; Chen, Z.M.; Zeng, J.J.; Chen, G.; Luo, D.Z.; Mo, W.J. Clinical implication of UCA1 in non-small cell lung cancer and its effect on caspase-3/7 activation and apoptosis induction in vitro. Int. J. Clin. Exp. Pathol. 2018, 11, 2295–2304. [Google Scholar]
- Chen, X.L.; Wang, Z.L.; Tong, F.; Dong, X.R.; Wu, G.; Zhang, R.G. LncRNA UCA1 Promotes Gefitinib Resistance as a ceRNA to Target FOSL2 by Sponging miR-143 in Non-small Cell Lung Cancer. Mol. Ther. Nucleic Acids 2010, 19, 643–653. [Google Scholar] [CrossRef]
- Hu, T.; Lu, Y.R. BCYRN1, a c-MYC-activated long non-coding RNA, regulates cell metastasis of non-small-cell lung cancer. Cancer Cell. Int. 2015, 15, 36. [Google Scholar] [CrossRef]
- Lang, N.; Wang, C.Y.; Zhao, J.Y.; Shi, F.; Wu, T.; Cao, H.Y. Long non-coding RNA BCYRN1 promotes glycolysis and tumor progression by regulating the miR-149/PKM2 axis in non-small-cell lung cancer. Mol. Med. Rep. 2020, 21, 1509–1516. [Google Scholar] [CrossRef]
- Tian, Y.H.; Zhang, N.L.; Chen, S.W.; Ma, Y.; Liu, Y.Y. The long non-coding RNA LSINCT5 promotes malignancy in non-small cell lung cancer by stabilizing HMGA2. Cell Cycle 2018, 17, 1188–1198. [Google Scholar] [CrossRef]
Publisher’s Note: MDPI stays neutral with regard to jurisdictional claims in published maps and institutional affiliations. |
© 2022 by the authors. Licensee MDPI, Basel, Switzerland. This article is an open access article distributed under the terms and conditions of the Creative Commons Attribution (CC BY) license (https://creativecommons.org/licenses/by/4.0/).

