Article

Assessment of the Genetic Relationship and Population Structure in Oil-Tea Camellia Species Using Simple Sequence Repeat (SSR) Markers

1
Sanya Nanfan Research Institute of Hainan University, Hainan Yazhou Bay Seed Laboratory, Sanya 572025, China
2
Key Laboratory for Quality Regulation of Tropical Horticultural Plants of Hainan Province, College of Horticulture, Hainan University, Haikou 570228, China
3
Institute of Tropical Horticulture Research, Hainan Academy of Agricultural Sciences, Haikou 571100, China
4
Engineering Research Center for the Selection and Breeding of New Tropical Crop Varieties of Ministry of Education, College of Tropical Crops, Hainan University, Haikou 570228, China
5
Ministry of Education Key Laboratory for Ecology of Tropical Islands, College of Life Sciences, Hainan Normal University, Haikou 571158, China
*
Authors to whom correspondence should be addressed.
Genes 2022, 13(11), 2162; https://doi.org/10.3390/genes13112162
Submission received: 28 September 2022 / Revised: 6 November 2022 / Accepted: 17 November 2022 / Published: 19 November 2022
(This article belongs to the Section Plant Genetics and Genomics)

Abstract

:
Oil-tea camellia trees, the collective term for a class of economically valuable woody oil crops in China, have attracted extensive attention because of their rich nutritional and pharmaceutical value. This study aimed to analyze the genetic relationship and genetic diversity of oil-tea camellia species using polymorphic SSR markers. One-hundred and forty samples of five species were tested for genetic diversity using twenty-four SSR markers. In this study, a total of 385 alleles were identified using 24 SSR markers, and the average number of alleles per locus was 16.0417. The average Shannon’s information index (I) was 0.1890, and the percentages of polymorphic loci (P) of oil-tea camellia trees were 7.79−79.48%, indicating that oil-tea camellia trees have low diversity. Analysis of molecular variance (AMOVA) showed that the majority of genetic variation (77%) was within populations, and a small fraction (23%) occurred among populations. Principal coordinate analysis (PCoA) results indicated that the first two principal axes explained 7.30% (PC1) and 6.68% (PC2) of the total variance, respectively. Both UPGMA and PCoA divided the 140 accessions into three groups. Camellia oleifera clustered into one class, Camellia vietnamensis and Camellia gauchowensis clustered into one class, and Camellia crapnelliana and Camellia chekiangoleosa clustered into another class. It could be speculated that the genetic relationship of C. vietnamensis and C. gauchowensis is quite close. SSR markers could reflect the genetic relationship among oil-tea camellia germplasm resources, and the results of this study could provide comprehensive information on the conservation, collection, and breeding of oil-tea camellia germplasms.

Graphical Abstract

1. Introduction

Oil-tea camellia trees is the collective term for a group of plants of high economic value. There are approximately 50 species of these trees, and they belong to the family Theaceae [1]. Oil-tea camellia trees have high value and a wide range of uses. They can be used as chemical bioenergetics, chemical feedstock, and a nutrient source [2,3]. Oil-tea camellia trees have a long history of cultivation in China and are mainly distributed in areas south of the Yangtze River Valley [4,5]. The main cultivated species are Camellia chekiangoleosa, Camellia oleifera, Camellia crapnelliana, Camellia vietnamensis Huang, etc. [5,6]. Nevertheless, the quality and oil yield of oil-tea camellia trees may vary depending on the species [3]. Thus, it is essential to form molecular markers for identification of populations or species to support breeding improvement and promote the development of genetic resources for oil-tea camellia trees.
Due to its extensive planting under different ambient conditions in China, oil-tea camellia trees have formed species with different growth habits, morphological characteristics, and degrees of oil quality [7]. C. vietnamensis is a species of oil-tea tree from Hainan Island, the southernmost city in China with a unique geographical location and superior climate [8], and some other tropical countries, such as Thailand and Vietnam [9]. C. vietnamensis from Hainan Island, which is considered an independent and traditional plant resource according to the long-term isolation from the mainland [7,10], is somewhat different from C. oleifera, which is widely grown in mainland China. It is more suitable for a tropical climate, has a large amount of genetic variation, and has higher contents of active ingredients in the oil [1,8].
Simple sequence repeats (SSRs), also called short tandem repeats (STRs) or microsatellites, are widely distributed in the genomes of animals and plants [11]. The random distribution of SSRs in the genome, together with the high level of allelic variation in microsatellite loci, makes them an ideal marker for studying population structure and genetic relationships [12,13]. Designing suitable genetic markers using SSRs allows detailed understanding of the composition and regulatory mechanisms of loci controlling quantitative or disease-resistance traits, allowing one to construct genetic linkage groups with genetic markers [13]. Further manipulation of these genes, the identification and cloning of QTLs affecting target traits, and studying the diversity of population genetics will assist with reaching the goal of marker-assisted selection of an improved population or genotypic selection of an improved population [14]. Several polymorphic SSR markers have been built and used to analyze population structure and genetic relationship in Camellia species [15], such as Camellia sinensis [11], C. chekiangoleosa [16], C. oleifera [17], Camellia japonica [15], and Camellia fascicularis [18]. Huang for the first time analyzed the inter-species hybrid introgression and genetic structure between Camellia meiocarpa and C. oleifera by SSR markers [19]. Combining morphological traits and SSR markers analysis, He et al. found that C. oleifera had abundant genetic variation [17]. An unidentified oil-tea Camellia species from Hainan was identified by the chloroplast genome sequences and SSR analysis [1]. As a consequence, it was feasible to study the population structure and genetic relationships of oil-tea camellia species using SSRs.
To date, molecular marker studies in Camellia species have mainly involved SSRs [11,17], RAPD [20,21]), ISSR [22,23], and so on. However, few SSRs studies have compared C. vietnamensis and other Camellia species. Therefore, in this study, we collected SSR molecular markers from 140 oil-tea camellia samples, followed by the non-hierarchical analysis of molecular variance (AMOVA), the unweighted pair group method with arithmetic (UPGMA), principal coordinates analysis (PCoA), and population structure analysis, in the hope of providing some data basis and theoretical basis for the delineation of the relatives, resource system, and population structure of oil-tea camellia species.

2. Materials and Methods

2.1. Materials

A collection of 140 oil-tea camellia accessions was used in this study, which were divided into 5 groups (Table 1), including 114 oil-tea camellia leaves and 26 oil-tea camellia seeds. The samples in this study were identified by Prof. Kaibing Zhou in 2018. Among them, the leaves included 95 C. oleifera, 17 C. vietnamensis species, and 2 C. chekiangoleosa. The seeds included 13 C. oleifera, 3 C. chekiangoleosa, 5 C. crapnelliana, and 5 Camellia gauchowensis specimens. Details of the samples are shown in Table 1 and Figure S1.

2.2. DNA Extraction

Sample DNA was extracted by the TIANGEN genomic DNA extraction kit (Beijing, China). DNA quality and concentration were then checked by 1% (w/v) agarose gel electrophoresis and the Agilent 2100 Bioanalyzer (USA). Good quality DNA was used directly for SSR analysis or stored at –20 °C for further use.

2.3. SSR Analysis

Ninety-six pairs of SSR primers were selected for pre-screening based on the transcriptome data of C. vietnamensis (NCBI accession number: PRJNA825399) [24], in which 15 fluorescently labeled SSR primers were selected for further research (Table 2). In addition, nine pairs of primers with good polymorphism were screened, referring to Song’s study (Table 2) [25]. The 5’ end of each forward primer for this analysis was labelled with FAM fluorescent dye (Applied Biosystems, USA). The M13 universal linker sequence (TGTAAAACGACGGCCAGT) was used to add to the 5’ direction of the forward primer of each pair of primers, and M13 linker sequences with different fluorescent groups were synthesized. Following the method of Gu [26] with minor modification, the SSR-PCR amplification was performed in a 15 µL total reaction volume, including 1.0 µL (5 pmol·µL−1) of forward and reverse primers, 7.5 µL of 2 × Taq PCR master mix (Gene tech, Shanghai, China), 1 µL (50 ng·µL−1) of template DNA, and 4.5 µL of ddH2O. The PCR program was as follows: 96 °C, 3 min; 96 °C for 30 s, 50–60 °C for 30 s, and 72 °C for 1 min, and these three procedures were cycled 30 times; 72 °C, 10 min. Two microliters of amplified PCR products were used in 2% (w/v) agarose gel electrophoresis to check whether the amplified fragment size and concentration were in the normal ranges at each locus with reference to the DNA marker alignment. Then, 1.0 µL of the fluorescent PCR product was diluted 30 fold with ultrapure water and prepared for machine detection. The diluted PCR products were separated by capillary electrophoresis by the ABI 3730XL DNA Analyzer (Applied Biosystems, Foster City, CA, USA), and data were handled by Gene Marker v.2.2.0 software (Soft Genetics, State College, PA, USA).

2.4. Data Acquisition and Analysis

According to the PCR results, a binary matrix was formed in which the presence of the product was marked as 1 and the absence of the product as 0. The results of the 1/0 data matrix were utilized to analyze the genetic diversity of oil-tea camellia trees. Based on the number of alleles, the level of discrimination of each SSR marker was assessed by calculating the percentage of polymorphic loci (P), Nei’s genetic diversity (h), Shannon diversity index (I) [27], gene differentiation coefficient (Gst) [26], and gene flow from Gst (Nm). Nei’s genetic diversity (h) and Shannon diversity index (I) were calculated using the POPGENE software [28].
According to the DICE coefficient [29], Nei’s genetic distance (D) and genetic identity between different groups were further calculated using GenAlex software [30]. The degrees of genetic variation among and within groups were analyzed by the non-hierarchical analysis of molecular variance (AMOVA) method, with 9999 random permutations [28]. Then, the unweighted pair group method with arithmetic (UPGMA) and the principal coordinates analysis (PCoA) were performed [31]. PCoA analysis was performed with GenAlex software. Linkage disequilibrium was analyzed using the pair.ia method of the R package poppr, and plots were drawn in R. In addition, the genetic structure of oil-tea camellia samples was analyzed by STRUCTURE [32], which is a model-based Bayesian clustering program with a range of genetic clusters from K = 3 to 10. Twenty independent runs were evaluated for each fixed K, and the best potential clusters (K value) were checked by the ∆K method on the STRUCTURE Harvester program [32]. The running results were integrated by CLUMPP software [33].

3. Results

3.1. Assessment of SSR Marker Diversity Levels

The 140 accessions from five oil-tea camellia species were analyzed by SSR markers. The alleles detected by 24 pairs of primers at the polymorphic sites ranged from 6 to 31. A total of 385 alleles were generated by amplification, resulting in an average of 16.0417 alleles per locus (Table 3). The mean of Nei’s gene diversity (h) and Shannon’s information index (I) were 0.1104 and 0.1890, which indicate that the genetic diversity was not very rich. It can be seen in Table 3 and Table S1 that the range of total genetic variation Ht was 0.0019–0.5000; the average value was 0.1153. The range of genetic variation within population Hs was 0–0.4601; the average value was 0.0698. The gene differentiation coefficient Gst value ranged from 0.0037 to 1.0000, and the average was 0.3948, indicating 39.48% genetic variation among individuals and a high degree of genetic differentiation. The range of gene flow (Nm) values of the whole population was 0–134.0618, and the average value was 0.7666, indicating that there was little gene exchange among the oil-tea camellia group.
The alleles at each locus in each sample were coded into a fingerprint in the form of a 0/1 matrix based on bands amplified using 24 pairs of primers. Fingerprinting gives a visual representation of the differences for each sample (Figure 1). As could be found from the fingerprinting of 140 oil-tea camellia accessions, these 24 pairs of primers could discriminate some of the 140 accessions.

3.2. Genetic Diversity of Oil-Tea Camellia Species Based on SSR Analysis

The detailed information of each genetic locus of each species is shown in Table S2. The average sample size was 28 for each species (Table 4). The mean Na was 0.735 (range: 0.200–1.605). The average Ne was 1.138 (range: 1.041–1.197). The mean h was 0.086 (range: 0.027–0.128), and the mean uh was 0.096. The average Is within species reached 0.134. S1 had the highest genetic variability (0.214), and S4 had the lowest value (0.041). When computed at the individual level, the mean I was 0.1890. The results indicate that the genetic differences among different groups were small and the genetic diversity was not very rich.

3.3. Analysis of Nei’s Genetic Distance between Species

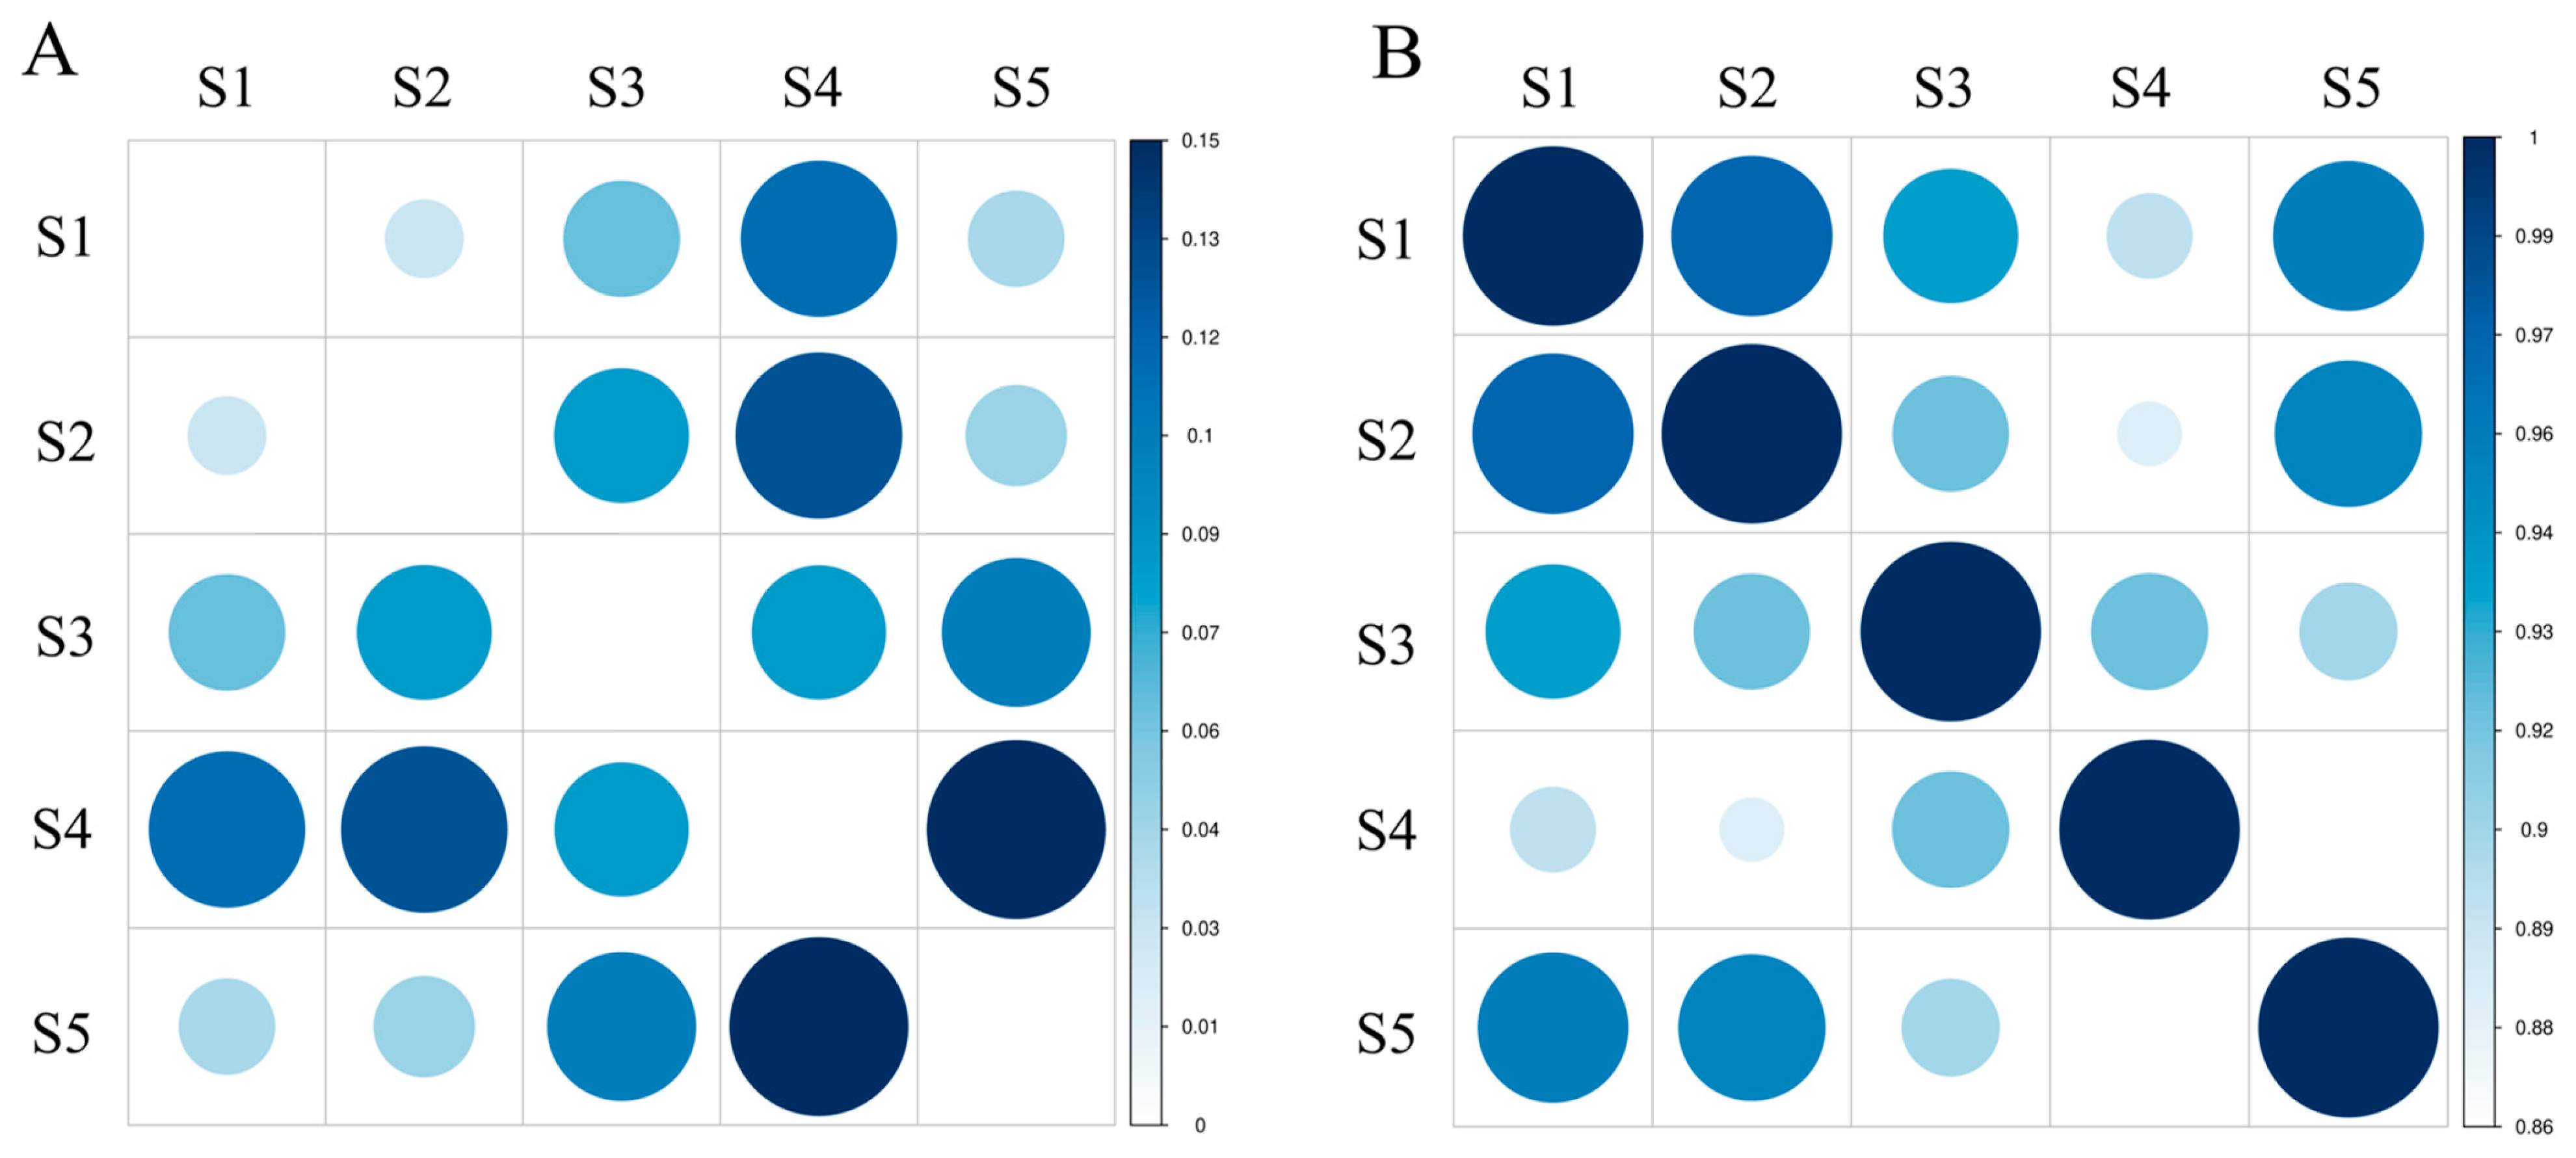
Nei’s genetic distance (D) is a measure of genetic difference among biological populations and can be measured in terms of quality traits and also with quantitative traits. The estimation of genetic distance is important for exploring the origins of cultivars, analyzing the relationships among populations, mapping phylogenetic trees and predicting heterosis, and guiding parental selection. The range of genetic identity among species was 0.8616–0.9719, calculated from 285 amplified fragments. As shown in Figure 2, S1 and S2 had the smallest genetic distance (0.0285) and the largest genetic identity (0.9719) with the closest relatives, followed by S1 and S5. S5 and S4 had the largest genetic distance (0.1490), shared the least genetic identity (0.8616), and were the most distantly related, followed by S4 and S2. The results of AMOVA indicated that most of the genetic variation (77%) occurred within species and only a small fraction (23%) occurred among species (Table 5). In addition, there were significant differences within and among groups. The mean fixation index (Fst) among five groups showed moderate genetic differentiation (Fst = 0.231).

3.4. UPGMA and PCoA Analysis

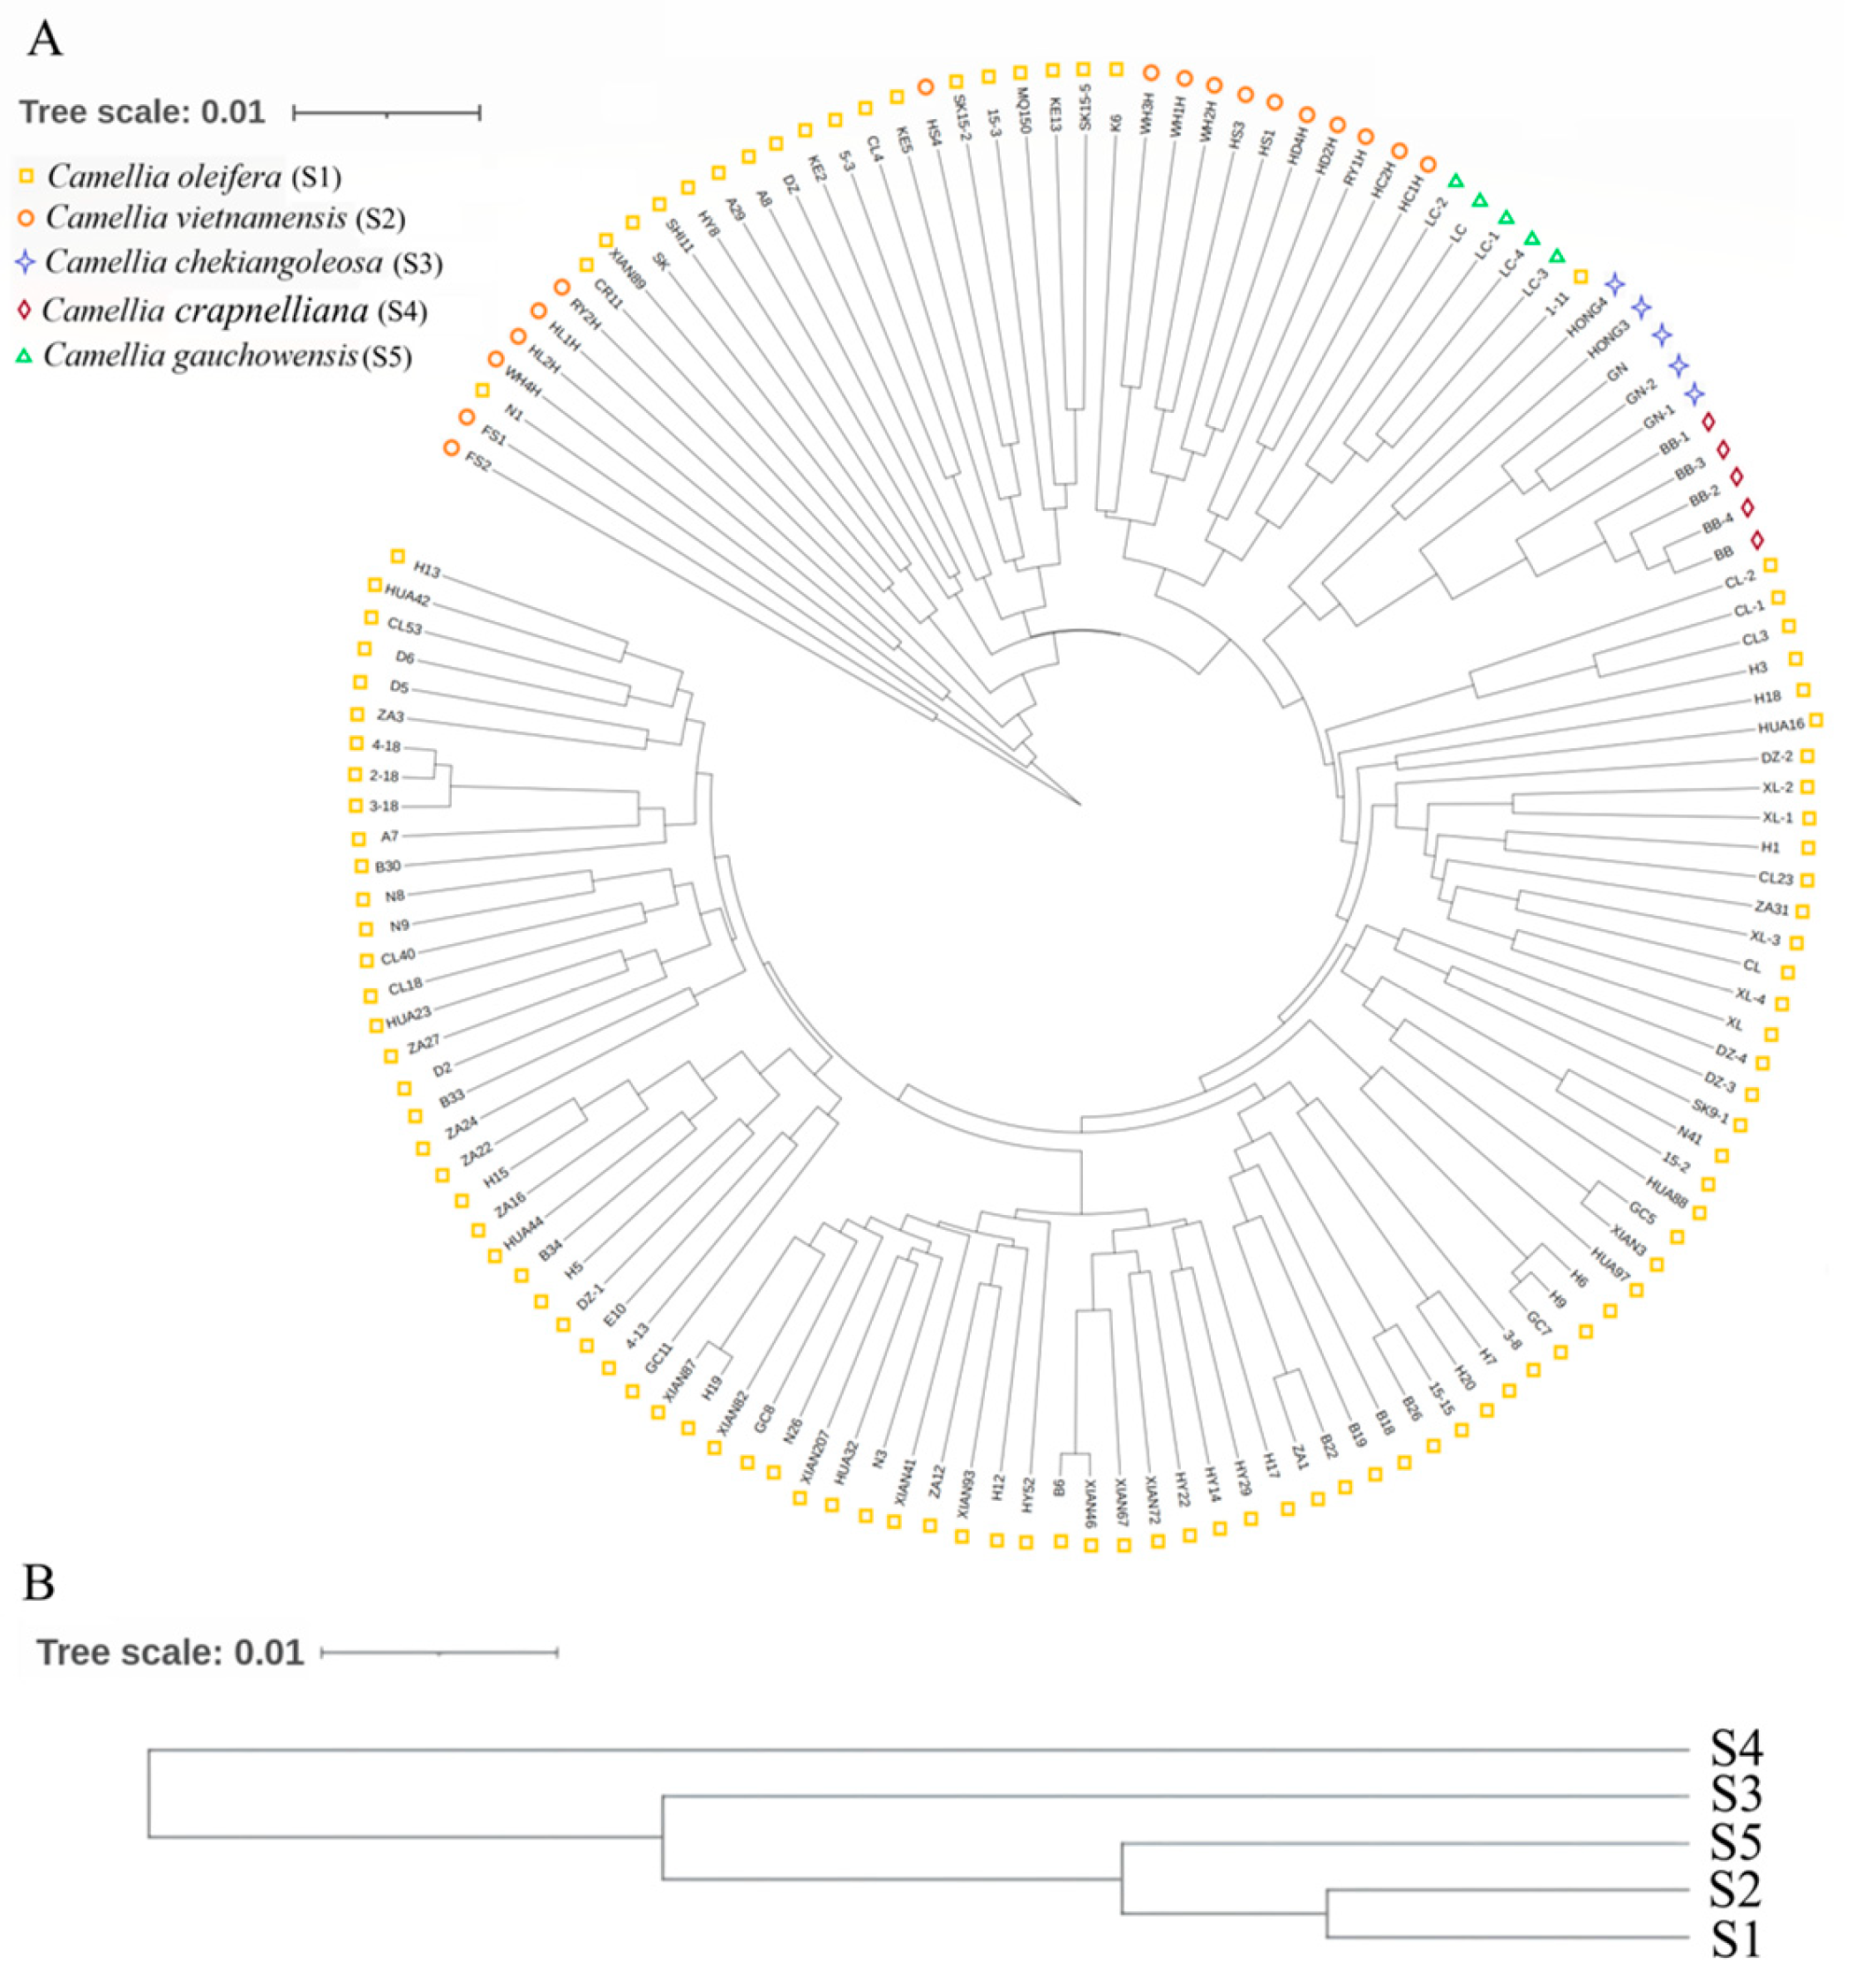
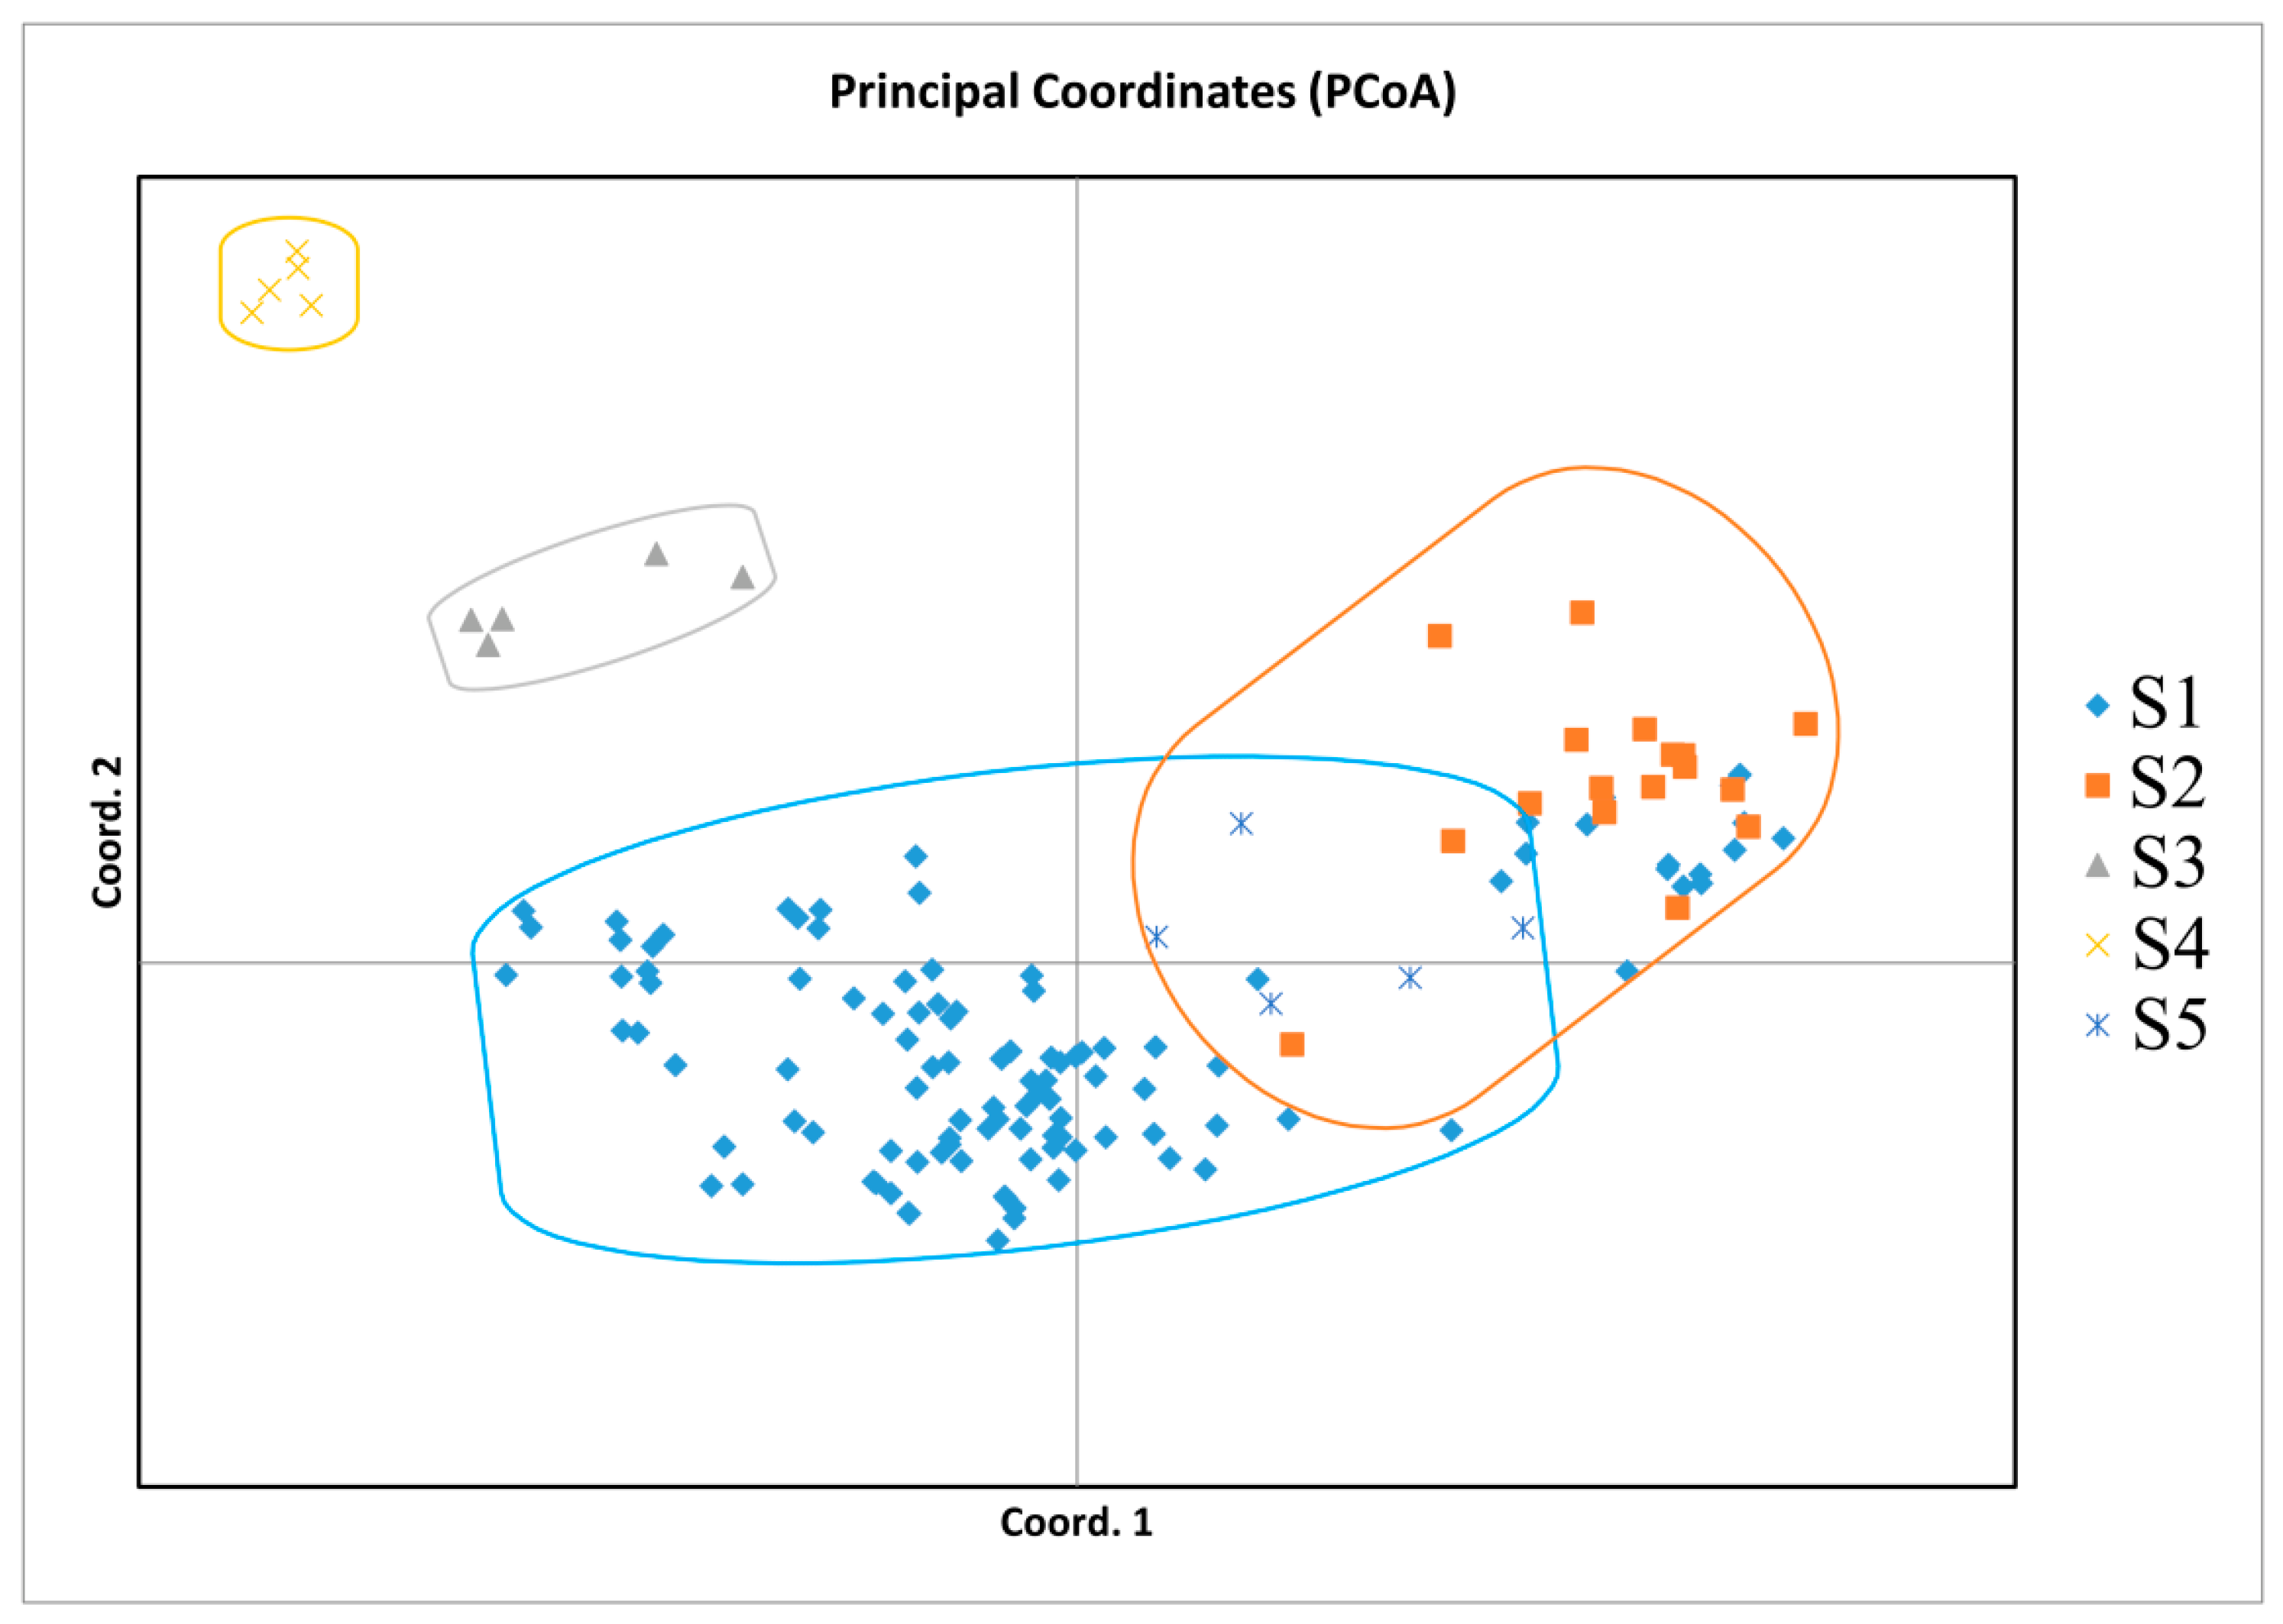
Based on Nei’s genetic distances among individuals and groups, the clustering analysis among individuals was accomplished using the aboot method of the R package poppr, by selecting Nei’s distance and bootstrapping 1000 times. Cluster analysis among populations was subjected to UPGMA trees drawn using the phylip software. According to the genetic distances, a phylogenetic tree was built (Figure 3). As can be seen in Figure 3A, most individuals from S1 grouped together; S2, S5, and a small part of S1 were clustered together; individuals of S3 and S4 grouped together. The phylogenetic tree obtained with Nei’s genetic distance classified the species into three main clades (Figure 3B). The first clades included S1, S2, and S5; the other two were S3 and S4. Among them, C. oleifera was clustered into one subclade, C. vietnamensis and C. crapnelliana were clustered into one subclade, and C. chekiangoleosa and C. gauchowensis were clustered into one subclade. In addition, some C. oleifera and C. vietnamensis were clustered into one subclade. Furthermore, two-dimensional PCoA revealed four distinct clusters on the basis of Nei’s genetic distance among individuals (Figure 4). PCoA analysis reflects the variability between two samples or two groups by an intuitive comparison of the straight-line distances between samples in the coordinate axis, which indicates whether the two samples or two groups of samples are notably divergent. PCoA of the first three axes explained 17.61% of the total variation (7.30%, 6.68%, and 3.63%, respectively). The results of PCoA were relatively similar to the individual-based phylogenetic tree. S1 (C. oleifera) samples were clustered together, S2 (C. vietnamensis) and S5 (C. gauchowensis) samples were clustered together, S3 (C. chekiangoleosa) samples were clustered together, and S4 (C. crapnelliana) samples were clustered together.

3.5. Linkage Disequilibrium Analysis and Population Structure

In linkage disequilibrium, there is a shift between the probability that a haplotype will appear and the probability that it will be randomly combined. The extent of this offset determines the extent of linkage disequilibrium. The degree of linkage disequilibrium was characterized by the square of the R value, which, when equal to 0, indicates complete linkage equilibrium—independent inheritance. When the R-squared equals 1, it indicates complete linkage disequilibrium. All 24 SSR loci were in linkage disequilibrium with each other; the a maximum R-squared was 1, and a minimum R-squared was 0.0099 (Figure 5 and Table S3).
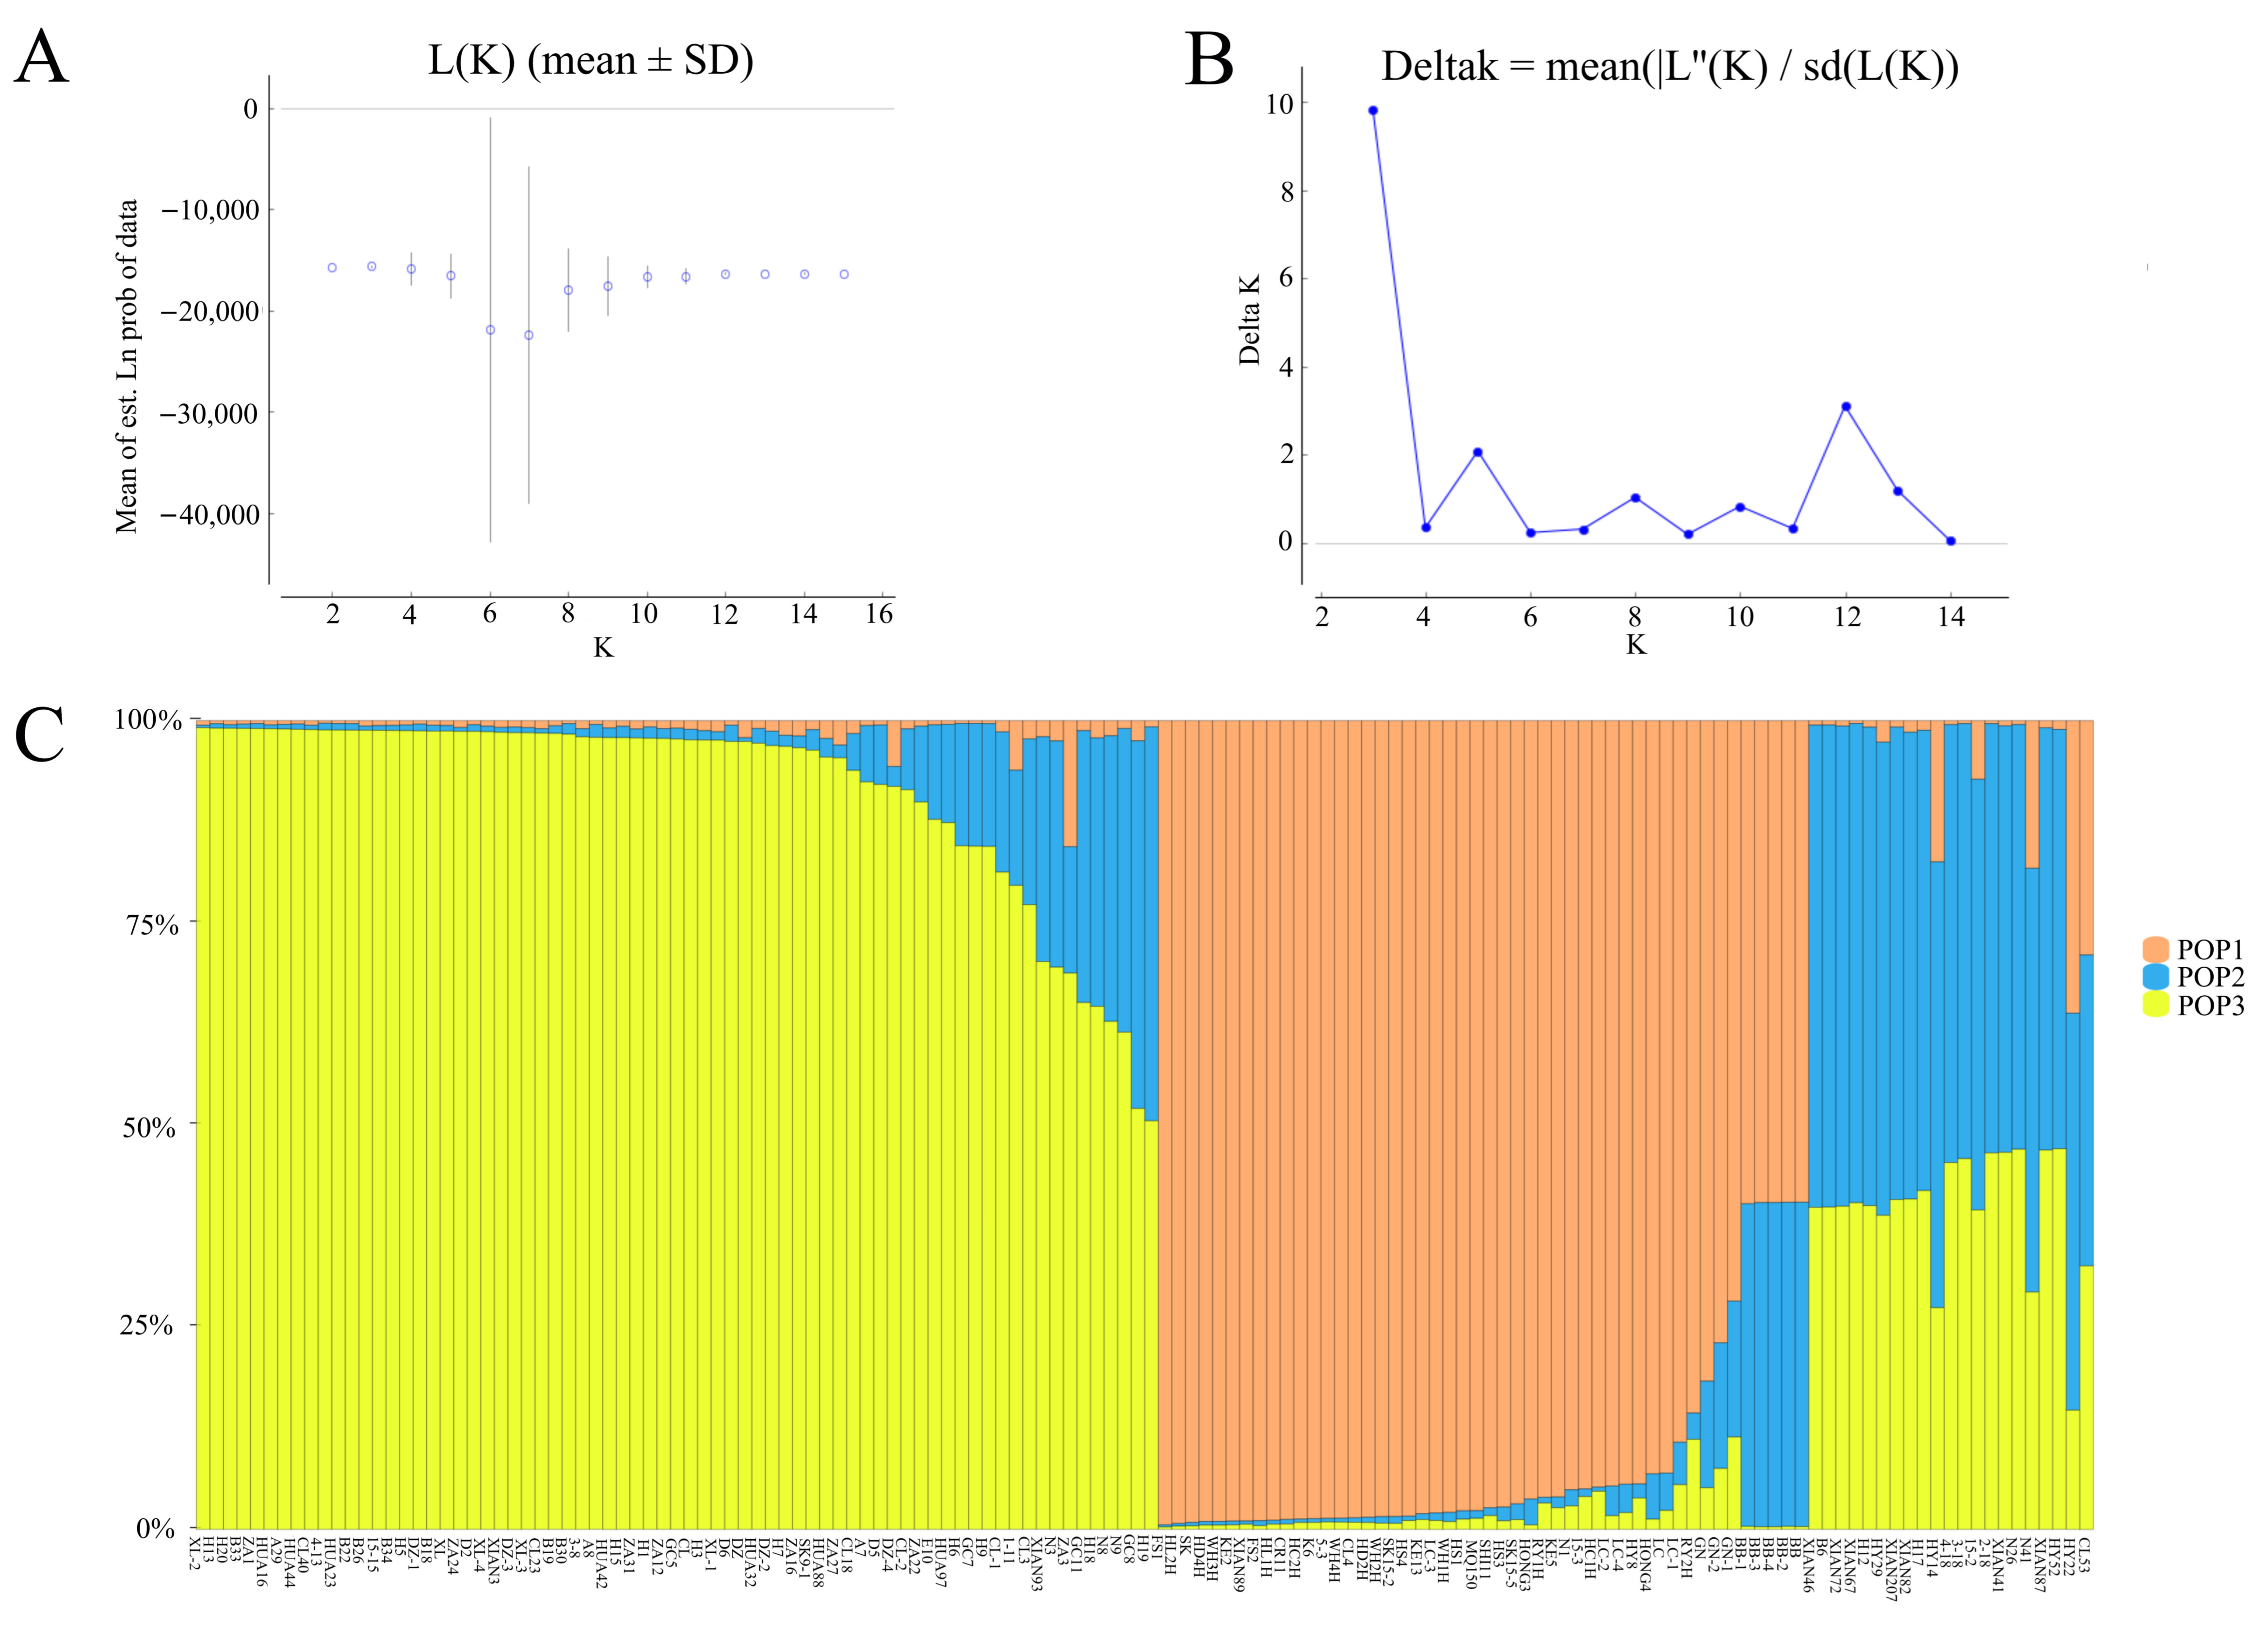
The results of STRUCTURE showed a clear maximum for Ln(PD)-derived delta K (∆K) at K = 3 (Figure 6A,B), and this was considered as a possible number for the population of oil-tea camellia. Therefore, it indicated that the studied accessions belonged to three different clusters (Figure 6C). Among them, most of C. oleifera samples were clustered in one population; a small proportion of C. oleifera samples were clustered separately; C. vietnamensis, C. gauchowensis, C. crapnelliana, and C. chekiangoleosa were another cluster. The results of population structure analysis were similar to those of UPGMA analysis (Figure 3A).

4. Discussion

In this research, the genetic diversity of five oil-tea camellia species was analyzed by using SSR markers. The range of alleles in SSR was 6–31. A total of 385 alleles were found. An average of 16.0417 alleles were found for each SSR-primer pair. At the species level, the range of Ip of oil-tea camellia was 0.041–0.214, and the range of p was 7.79–79.48% (the mean value was 34.49%), showing moderate genetic diversity. When the polymorphism information content (PIC) was less than 0.25, SSR primers showed little polymorphism; when 0.25 < PIC < 0.5, moderate polymorphism; when PIC > 0.5, high polymorphism [34]. The results from the amplification of 345 pairs of SSR primers by Shi et al. [16] indicated that the proportion of polymorphic sites (31.9%) was relatively high. Chai et al. analyzed six natural populations of C. pubipetala, and the results showed that the I value was 0.4100; the PPB (percentage of polymorphic bands) was 80.43% [35]. Although the six populations’ distribution was narrow, the genetic diversity was high. A total of 495 alleles were identified by 111 SSR loci in C. japonica, and the range of alleles was 1–12. The mean was 4.46 alleles per locus. The range of PIC was 0.15–0.86, and the average was 0.59 [15]. The mean of p in this study was 34.49%, which is similar to the above results. The ranges of Ne, h, and Ip of 24 markers in this study were 1.041–1.197, 0.027–0.128, and 0.041–0.214, respectively. The differences are larger when compared with the results of Dong et al., who used 16 SSR marker pairs for 54 oil-tea trees (including C. polyodonta, C. oleifera, C. gauchowensis, and C. semiserrata) for genetic diversity analysis. The ranges of Ne, h, and I were 1.17–1.70, 0.14–0.40, and 0.26–0.59, respectively [3]. In conclusion, the SSR primers in this study showed moderate to high levels of polymorphism, which indicates that they were suitable for genetic diversity analysis of oil-tea camellia trees.
Accurate genetic relationships among germplasm accessions are important for variety development, evolutionary studies, and resource conservation [31,36]. Three main clusters were determined by the UPGMA method on 140 samples. C. vietnamensis was clustered with C. gauchowensis, which is similar to the findings of Qi et al. [37] and Chen et al. [1]. They found that various indexes of leaf, flower, fruit, and seed morphologies of C. vietnamensis collected from Hainan Province showed high similarity to those of C. gauchowensis, whose provenance was Gaozhou in Guangdong Province [37], and C. vietnamensis and C. gauchowensis were found to be clustered together by cpDNA sequences and SSR marker analysis [1], so it could be speculated that the relative proximity of C. vietnamensis and C. gauchowensis to each other was quite near. Dai et al. analyzed the chloroplast genome trnH-psbA and matK sequences of 101 different kinds of oil-tea camellia seedlings by DNA barcoding technology [38]. They found that C. vietnamensis was clustered into one branch and C. chekiangoleosa was clustered into another, and the clustering results in this study agree strongly with these results. The findings suggest that C. vietnamensis in Hainan has a relatively close relative. Additionally, the phenomenon of self-incompatibility might occur in close relatives, which might be one of the reasons for the low seed-setting rate of C. vietnamensis in Hainan.
For a more accurate analysis of the genetic structure of oil-tea camellia, STRUCTURE was used for further analysis, and the results indicated that the 140 accessions were classified into three clusters. Among them, most of C. oleifera samples were clustered one population; a small proportion of C. oleifera were in another cluster; and C. vietnamensis, C. gauchowensis, C. crapnelliana, and C. chekiangoleosa were one cluster. There were small fractions of C. oleifera samples that clustered with other Camellia species. It was indicated that plants of the same group came not only from the same region but also from different regions. Possibly, species with different genetic backgrounds may cluster together. This indicates that the kinship of germplasm is extremely complex. The reasons for this phenomenon might be as follows. First, occasional genetic mutations and long-term natural selection have made finding the relatives of oil-tea camellia more complicated. Second, the effect of genetic drift was greater during the natural differentiation of oil-tea camellia than those of natural environmental factors, leading to the failure to divide by geographic region when clustering. Using indirect measures, the gene flow among populations was estimated by the value of Nm [28]. The Nm value (0.7666) indicated low gene flow among species and might promote population differentiation. When Nm < 1, genetic drift is thought to be a major contributor to population differentiation [26,28]. Third, the uneven number of selected samples makes the clustering result not accurate enough, and so on.
The results of genetic structure analysis indicate that the genetic variation of oil-tea camellia samples mainly appeared within species, accounting for 77% of the total variation, leaving only a small portion (23%) occurring among species. That might result from habitat fragmentation and geographical barriers. Some experts have also obtained similar results with other Camellia plants. He et al. used nine pairs of SSR primers to analyze 150 accessions of C. oleifera, and the results indicated that the genetic diversity level of C. oleifera is high [17]. In addition, Li et al. also analyzed 84 accessions of eight natural populations of C. fascicularis with fourteen pairs of primers for SSR markers [18]. The results indicated that the eight populations of C. fascicularis were roughly divided into three clusters, and the genetic variation within populations accounted for 49.95% of variation. To sum up, the results of this study indicate that the genetic variation of oil-tea camellia samples was mainly found within populations, and inbreeding occurred within the population, such as with C. vietnamensis. The degree of gene exchange among species was low.

5. Conclusions

In this research, 24 pairs of SSR primers were selected to analyze the genetic relationship and population structure of 140 oil-tea camellia accessions using fluorescence detection by capillary electrophoresis. The results indicate that genetic diversity was abundant among the 140 Camellia accessions. Based on genetic distances and clustering by UPGMA, the 140 accessions could be classified into three clusters. Most individuals from S1 grouped together, samples from S2 and S5 grouped together, and samples from S3 and S4 formed the same branch. In addition, some individuals from S1 and S2 were clustered together, which relates to the results of the PCoA. The Bayesian-model-based genetic structure analysis indicated that the studied accessions belonged to three populations. Among them, most of the C. oleifera samples were clustered into one population; a small proportion of C. oleifera were in another cluster; C. vietnamensis, C. gauchowensis, C. crapnelliana, and C. chekiangoleosa were one cluster. Taken together, the findings should be instructive for oil-tea camellia species’ introduction, breeding, germplasm preservation, and new-variety development, and provide a theoretical foundation for the classification and identification of oil-tea camellia species in southern China and the research on relatives.

Supplementary Materials

The following supporting information can be downloaded at: https://www.mdpi.com/article/10.3390/genes13112162/s1, Table S1: Genetic diversity parameters of each SSR locus; Table S2: Genetic diversity parameters of each SSR locus of each specie; Table S3: Linkage disequilibrium of 24 SSR loci.

Author Contributions

Conceptualization, J.Y. and Y.L.; methodology, Y.W. (Yougen Wu); software, H.Q.; validation, Y.W. (Yong Wang), and J.Y.; formal analysis, Y.L.; investigation, H.Y.; resources, J.C.; data curation, H.Y.; writing—original draft preparation, H.Y.; writing—review and editing, H.Q.; visualization, Y.L.; supervision, J.C.; project administration, Y.W. (Yong Wang); funding acquisition, J.Y. All authors have read and agreed to the published version of the manuscript.

Funding

This study was funded by the Open Project of Ministry of Education Key Laboratory for Ecology of Tropical Islands, Hainan Normal University, China (No. HNSF-OP-2021-2), the High-level Talents Project of Hainan Natural Science Foundation (2019RC173), the Key R&D Program of Hainan Province, China (ZDYF2022SHFZ020), and the High-level talent project of Hainan Natural Science Foundation (No. 820RC585).

Institutional Review Board Statement

Not applicable.

Informed Consent Statement

Not applicable.

Data Availability Statement

Not applicable.

Acknowledgments

The authors would like to thank Jiaming Song (Hainan Academy of Forestry) for providing nine primer pairs.

Conflicts of Interest

The authors declare no conflict of interest.

References

  1. Chen, J.; Guo, Y.J.; Hu, X.W.; Zhou, K.B. Comparison of the chloroplast genome sequences of 13 oil-tea Camellia samples and identification of an undetermined oil-tea Camellia species from Hainan province. Front. Plant Sci. 2022, 12, 798581. [Google Scholar] [CrossRef] [PubMed]
  2. Jia, B.G.; Lin, Q.; Feng, Y.Z.; Hu, X.Y.; Tan, X.F.; Shao, F.G.; Zhang, L. Development and cross-species transferability of unigene-derived microsatellite markers in an edible oil woody plant, Camellia oleifera (Theaceae). Genet. Mol. Res. 2015, 14, 6906–6916. [Google Scholar] [CrossRef] [PubMed]
  3. Dong, B.; Deng, Z.; Liu, W.; Rehman, F.; Yang, T.J.; Huang, Y.F.; Gong, H.G. Development of expressed sequence tag simple sequence repeat (EST-SSR) markers and genetic resource analysis of tea oil plants (Camellia spp.). Conserv. Genet. Resour. 2022, 14, 41–45. [Google Scholar] [CrossRef]
  4. Feng, J.L.; Yang, Z.J.; Chen, S.P.; El-Kassaby, Y.A.; Chen, H. High throughput sequencing of small RNAs reveals dynamic microRNAs expression of lipid metabolism during Camellia oleifera and C. meiocarpa seed natural drying. BMC Genom. 2017, 18, 546. [Google Scholar] [CrossRef] [PubMed]
  5. Yu, J.; Yan, H.; Wu, Y.; Wang, Y.; Xia, P. Quality Evaluation of the Oil of Camellia spp. Foods 2022, 11, 2221. [Google Scholar] [CrossRef]
  6. Yang, C.Y.; Liu, X.M.; Chen, Z.Y.; Lin, Y.S.; Wang, S.Y. Comparison of Oil Content and Fatty Acid Profifile of Ten New Camellia oleifera Cultivars. J. Lipids 2016, 2016, 3982486. [Google Scholar] [CrossRef] [Green Version]
  7. Ye, Z.C.; Wu, Y.G.; Ul Haq Muhammad, Z.; Yan, W.P.; Yu, J.; Zhang, J.F.; Yao, G.L.; Hu, X.W. Complementary transcriptome and proteome profiling in the mature seeds of Camellia oleifera from Hainan Island. PLoS ONE 2020, 15, e0226888. [Google Scholar] [CrossRef] [Green Version]
  8. Dai, J.N.; Zheng, W.; Yu, J.; Yan, H.Q.; Wang, Y.; Wu, Y.G.; Hu, X.W.; Lai, H.G. cDNA cloning, prokaryotic expression, and functional analysis of squalene synthase (SQS) in Camellia vietnamensis Huang. Protein Expres. Purif. 2022, 194, 106078. [Google Scholar] [CrossRef]
  9. Zhu, G.F.; Liu, H.; Xie, Y.C.; Liao, Q.; Lin, Y.W.; Liu, Y.H.; Liu, Y.H.; Xiao, H.W.; Cao, Z.J.; Hu, S.Z. Postharvest Processing and Storage Methods for Camellia oleifera Seeds. Food Rev. Int. 2020, 36, 319–339. [Google Scholar] [CrossRef]
  10. Zhang, W.; Zhao, Y.; Yang, G.; Peng, J.; Chen, S.; Xu, Z. Determination of the evolutionary pressure on Camellia oleifera on Hainan Island using the complete chloroplast genome sequence. PeerJ 2019, 7, e7210. [Google Scholar] [CrossRef]
  11. Ma, J.Q.; Ma, C.L.; Yao, M.Z.; Jin, J.Q.; Wang, Z.L.; Wang, X.C.; Chen, L. Microsatellite markers from tea plant expressed sequence tags (ESTs) and their applicability for cross-species/genera amplification and genetic mapping. Sci. Hortic. Amst. 2012, 134, 167–175. [Google Scholar] [CrossRef]
  12. Kalia, R.K.; Rai, M.K.; Kalia, S.; Singh, R.; Dhawan, A.K. Microsatellite markers: An overview of the recent progress in plants. Euphytica 2010, 177, 309–334. [Google Scholar] [CrossRef]
  13. Hao, L.; Zhang, G.; Lu, D.; Hu, J.; Jia, H. Analysis of the genetic diversity and population structure of Salix psammophila based on phenotypic traits and simple sequence repeat markers. PeerJ 2019, 7, e6419. [Google Scholar] [CrossRef] [Green Version]
  14. Taniguchi, F.; Fukuoka, H.; Tanaka, J. Expressed sequence tags from organ-specific cDNA libraries of tea (Camellia sinensis) and polymorphisms and transferability of EST-SSRs across Camellia species. Breed. Sci. 2012, 62, 186–195. [Google Scholar] [CrossRef] [Green Version]
  15. Li, Q.Y.; Su, X.J.; Ma, H.H.; Du, K.B.; Yang, M.; Chen, B.L.; Fu, S.; Fu, T.J.; Ciang, C.L.; Zhao, Q.; et al. Development of genic SSR marker resources from RNA-seq data in Camellia japonica and their application in the genus Camellia. Sci. Rep. 2021, 11, 9919. [Google Scholar] [CrossRef]
  16. Shi, J.; Dai, X.G.; Chen, Y.N.; Chen, J.H.; Shi, J.S.; Yin, T.M. Discovery and experimental analysis of microsatellites in an oil woody plant Camellia chekiangoleosa. Plant Syst. Evol. 2013, 299, 1387–1393. [Google Scholar] [CrossRef]
  17. He, Z.L.; Liu, C.X.; Wang, X.N.; Wang, R.; Chen, Y.Z.; Tian, Y. Assessment of genetic diversity in Camellia oleifera Abel. accessions using morphological traits and simple sequence repeat (SSR) markers. Breed. Sci. 2020, 70, 586–593. [Google Scholar] [CrossRef]
  18. Li, B.; Liu, C.; Tang, J.R.; Xin, Y.X.; Dong, Z.H.; Bai, B.; Xin, P.Y. Genetic diversity analysis of Camellia fascicularis H. T. Chang based on SSR markers. J. Appl. Res. Med. Aroma. 2022, 31, 100404. [Google Scholar] [CrossRef]
  19. Huang, Y. Population genetic structure and interspecific introgressive hybridization between Camellia meiocarpa and C. oleifera. Chin. J. Appl. Ecol. 2013, 24, 2345–2352. [Google Scholar] [CrossRef]
  20. Tang, S.; Bin, X.; Wang, L.; Zhong, Y. Genetic Diversity and Population Structure of Yellow Camellia (Camellia nitidissima) in China as Revealed by RAPD and AFLP Markers. Biochem. Genet. 2006, 44, 444. [Google Scholar] [CrossRef]
  21. Huseynov, M.; Suleymanova, Z.; Ojaghi, J.; Mammadov, A. Characterization and Phylogeny Analysis of Azerbaijan Tea (Camellia sinensis L.) Genotypes by Molecular Markers. Cytol. Genet. 2022, 56, 285–291. [Google Scholar] [CrossRef]
  22. Zhou, L.Y.; Wang, X.N.; Wang, L.P.; Chen, Y.Z.; Jiang, X.C. Genetic diversity of oil-tea camellia germplasms revealed by ISSR analysis. Int. J. Biomath. 2015, 08, 1550070. [Google Scholar] [CrossRef]
  23. Xiao, P.; Liu, H.; Wang, D.; Tang, W.; Yang, H.; Wang, C.; He, Z.; Wang, R.; Wang, X.; Lu, X.; et al. Assessment of genetic diversity in Camellia oleifera Abel. accessions using inter-simple sequence repeat (ISSR) and start codon targeted (SCoT) polymorphic markers. Genet. Resour. Crop Evol. 2020, 67, 1115–1124. [Google Scholar] [CrossRef]
  24. Yan, H.; Zheng, W.; Wang, Y.; Wu, Y.; Yu, J.; Xia, P. Integrative Metabolome and Transcriptome Analysis Reveals the Regulatory Network of Flavonoid Biosynthesis in Response to MeJA in Camellia vietnamensis Huang. Int. J. Mol. Sci. 2022, 23, 9370. [Google Scholar] [CrossRef] [PubMed]
  25. Song, J.M.; Li, X.Y.; Zhang, S.H.; Lai, H.G.; Zhou, Y.; Chen, J.M.; Wang, J.; Pang, Z.Z. Development and evaluation of Hainan Camellia SSR molecular marker basrd on transcriptome data. Mol. Plant Breed. 2022, 1–19. Available online: http://kns.cnki.net/kcms/detail/46.1068.S.20220316.2203.008.html (accessed on 27 September 2022).
  26. Gu, X.Y.; Guo, Z.H.; Ma, X.; Bai, S.Q.; Zhang, X.Q.; Zhang, C.B.; Chen, S.Y.; Peng, Y.; Yan, Y.H.; Huang, L.K.; et al. Population genetic variability and structure of Elymus breviaristatus (Poaceae: Triticeae) endemic to Qinghai–Tibetan Plateau inferred from SSR markers. Biochem. Syst. Ecol. 2015, 58, 247–256. [Google Scholar] [CrossRef]
  27. Wu, W.D.; Liu, W.H.; Sun, M.; Zhou, J.Q.; Liu, W.; Zhang, C.L.; Zhang, X.Q.; Peng, Y.; Huang, L.K.; Ma, X. Genetic diversity and structure of Elymus tangutorum accessions from Western China as unrevealed by AFLP markers. Hereditas 2019, 156, 8. [Google Scholar] [CrossRef]
  28. Peakall, R.; Smouse, P.E. GenAlEx 6.5: Genetic analysis in excel. Population genetic software for teaching and research-an update. Bioinformatics 2012, 28, 2537–2539. [Google Scholar] [CrossRef] [Green Version]
  29. Dice, L.R. Measures of the amount of ecologic association between species. J. Ecol. 1945, 26, 297–302. [Google Scholar] [CrossRef]
  30. Nei, M. Genetic Distance between Populations. Am. Nat. 1972, 106, 283–292. [Google Scholar] [CrossRef]
  31. Xiong, Y.; Liu, W.; Xiong, Y.; Yu, Q.; Ma, X.; Lei, X.; Zhang, X.; Li, D. Revelation of genetic diversity and structure of wild Elymus excelsus (Poaceae: Triticeae) collection from western China by SSR markers. PeerJ 2019, 7, e8038. [Google Scholar] [CrossRef]
  32. Evanno, G.S.; Regnaut, S.J.; Goudet, J. Detecting the number of clusters of individuals using the software STRUCTURE: A simulation study. Mol. Ecol. 2005, 14, 2611–2620. [Google Scholar] [CrossRef] [Green Version]
  33. Jakobsson, M.; Rosenberg, N.A. CLUMPP: A cluster matching and permutation program for dealing with label switching and multimodality in analysis of population structure. Bioinformatics 2007, 23, 1801–1806. [Google Scholar] [CrossRef] [Green Version]
  34. Botstein, D.; White, R.L.; Skolnick, M.; Davis, R.W. Construction of a genetic linkage map in man using restriction fragment length polymorphisms. Am. J. Hum. Genet. 1980, 32, 314–331. [Google Scholar] [CrossRef]
  35. Chai, S.F.; Zhuang, X.Y.; Zou, R.; Chen, Z.; Jiang, Y.; Wei, X. Genetic diversity analysis of endangered plant Camellia pubipetala detected by ISSR. Acta Bot. Boreali-Occident. Sin. 2014, 34, 93–98. [Google Scholar] [CrossRef]
  36. Najaphy, A.; Parchin, R.A.; Farshadfar, E. Evaluation of genetic diversity in wheat cultivars and breeding lines using inter simple sequence repeat markers. Biotechnol. Biotec. Eq. 2011, 25, 2634–2638. [Google Scholar] [CrossRef] [Green Version]
  37. Qi, H.S.; Dai, J.N.; Yang, Y.N.; Li, S.Y.; Wang, J.; Shi, L.C.; Wu, Y.G.; Lai, H.G.; Hu, X.W.; Yu, J. Identification of Camellia oleifera seed DNA barcode based on trnH-psbA and matK sequence. Mol. Plant Breed. 2019, 17, 5057–5065. [Google Scholar] [CrossRef]
  38. Dai, J.N.; Yu, J.; Qi, H.S.; Zheng, W.; Wang, J.; Wu, Y.G.; Lai, H.G.; Hu, X.W. DNA Barcoding Identification of Different Species in Camellia Based on trnH-psbA and matK Sequences. Chin. J. Trop. Crops 2021, 42, 611–619. [Google Scholar]
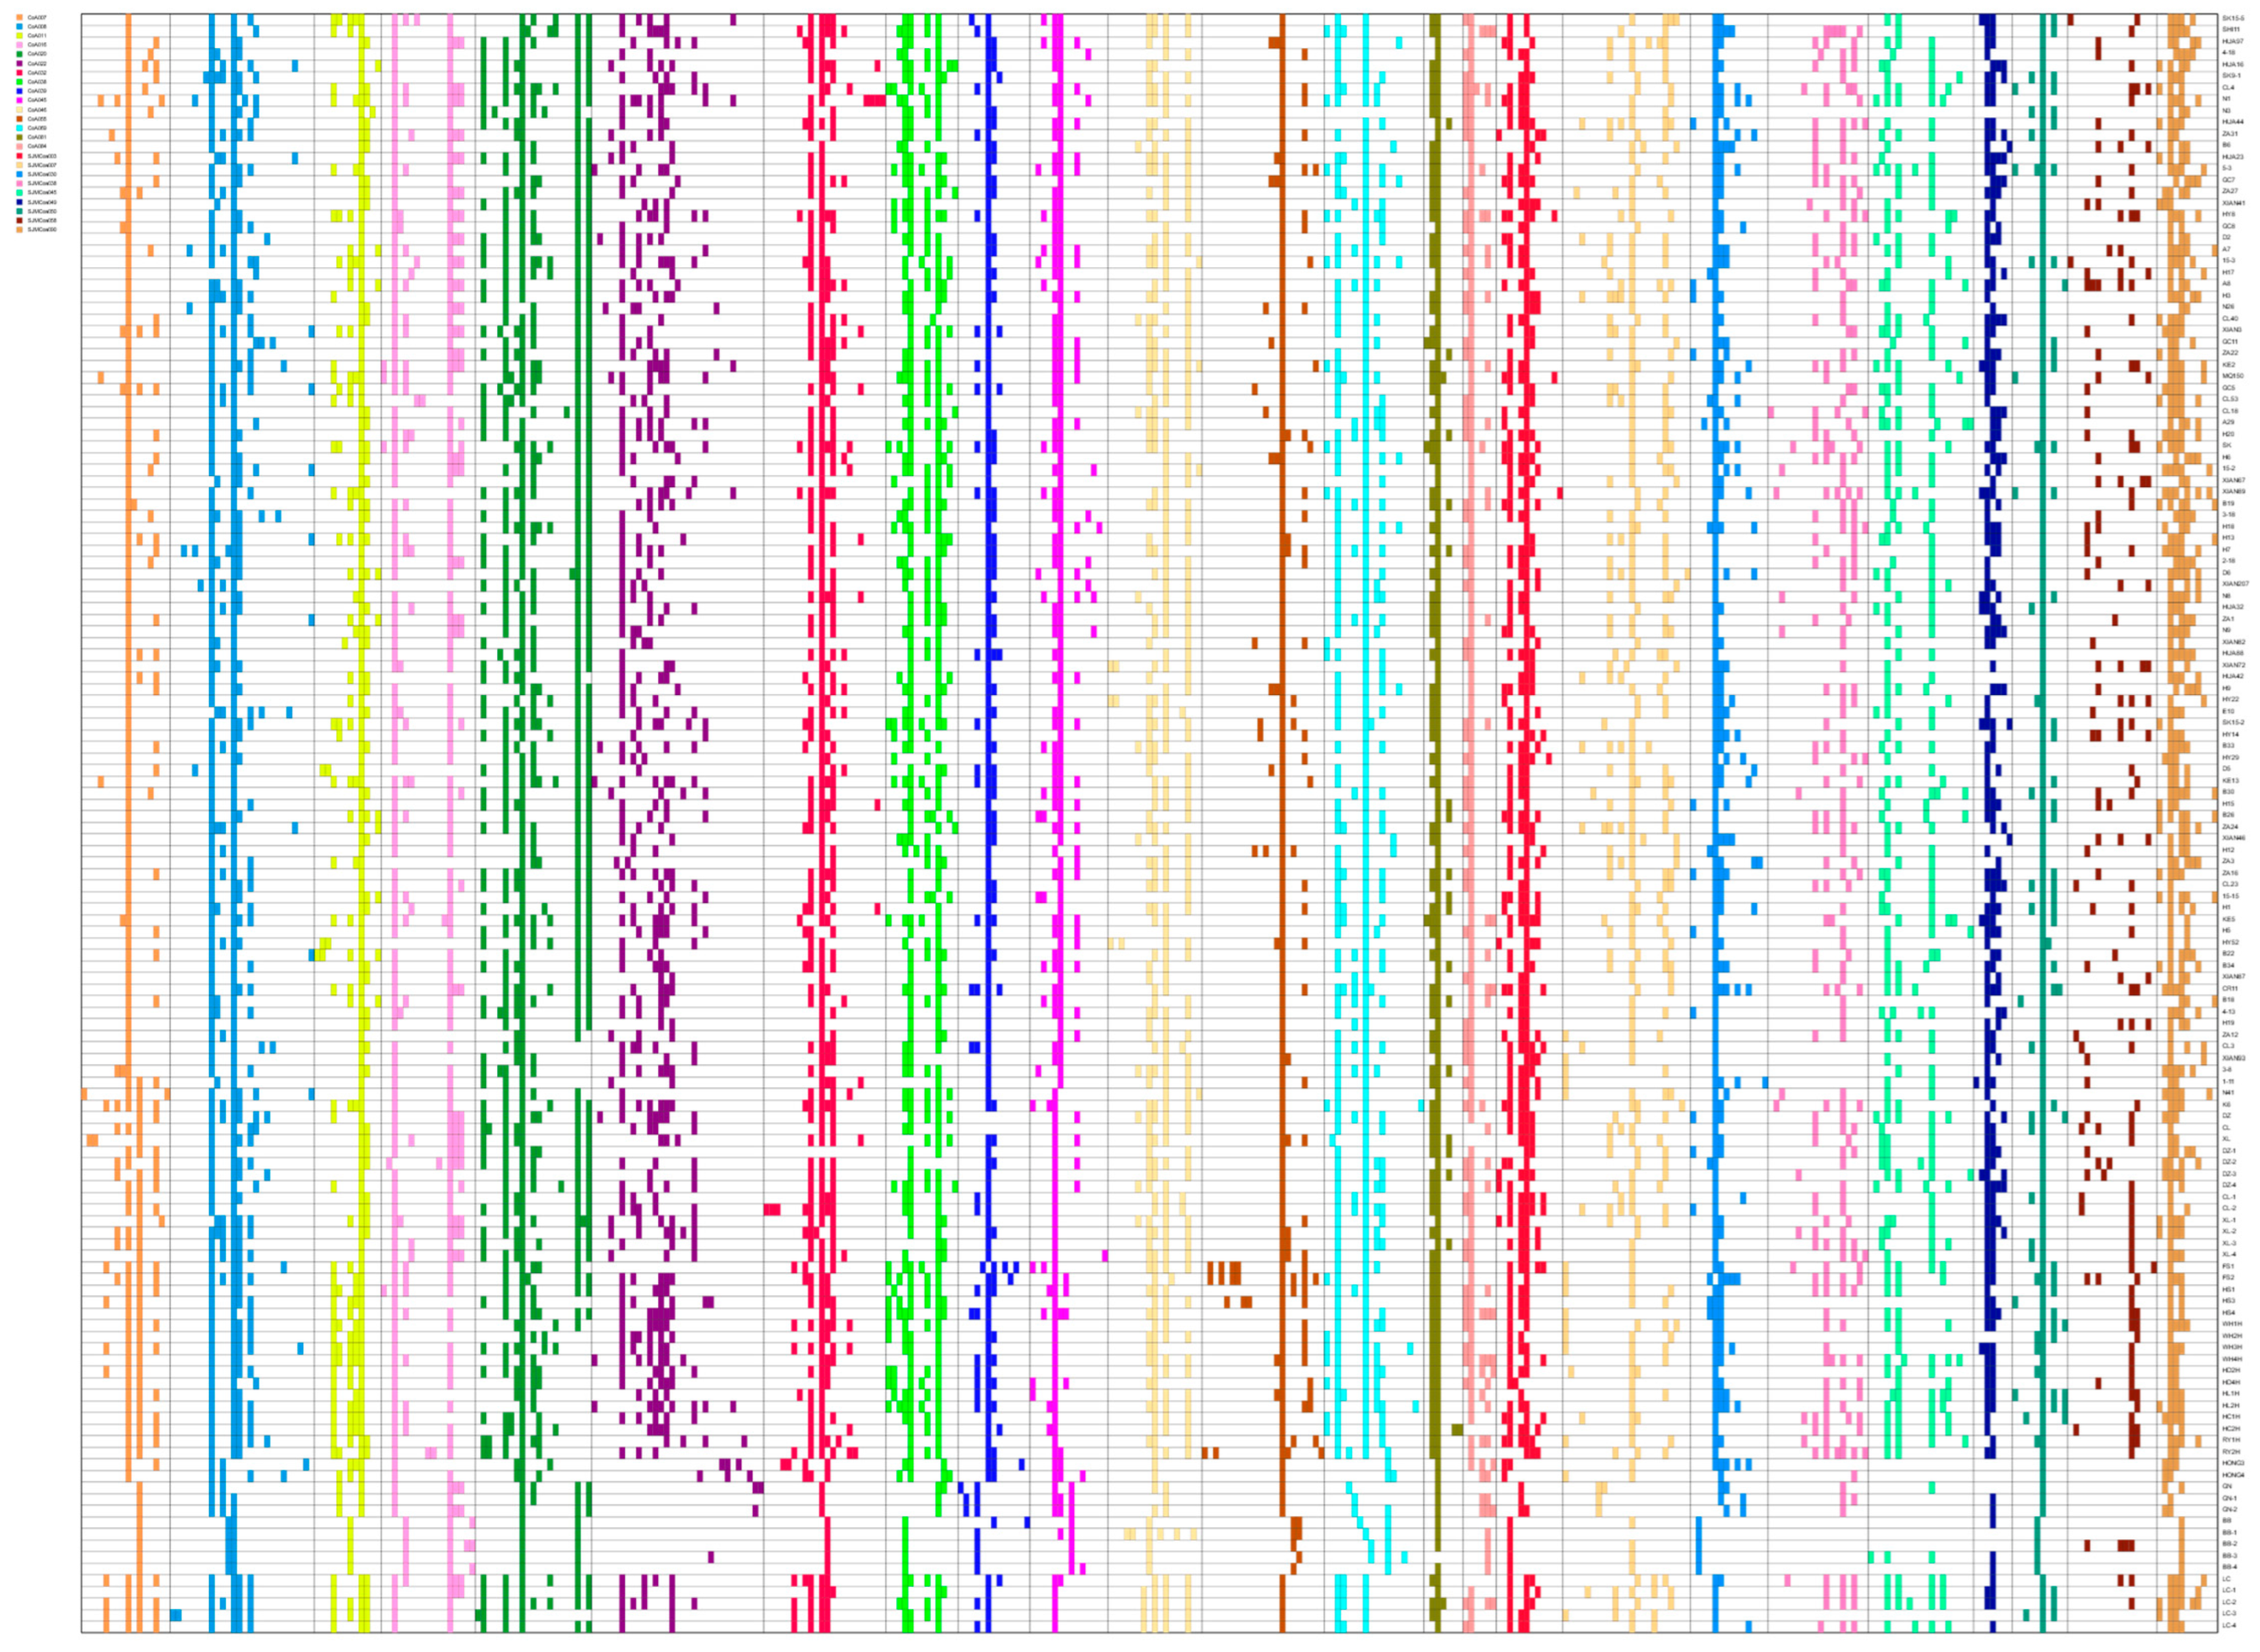
Figure 1. The fingerprinting of each allele in 140 samples.
Genes 13 02162 g001
Figure 2. Genetic distance and genetic identity among groups. (A): Nei’s genetic distance; (B): Nei’s genetic identity.
Genes 13 02162 g002
Figure 3. The UPGMA phylogenetic tree of oil-tea camellia samples based on SSR data. (A): The phylogenetic tree of 140 samples; (B): The phylogenetic tree of five Camellia species.
Genes 13 02162 g003
Figure 4. PCoA of oil-tea camellia samples based on SSR data.
Genes 13 02162 g004
Figure 5. The linkage disequilibrium of 24 SSR loci.
Genes 13 02162 g005
Figure 6. A structure analysis of 140 oil-tea camellia samples. (A): Estimated LnP(D) of K from 2 to 16. (B): ΔK according to the rate of change of LnP(D) between successive K. (C): Genetic structure of oil-tea camellia population.
Genes 13 02162 g006
Table 1. Detailed information for the 140 oil-tea camellia accessions used in this study.
No.NameTissuespeciesGroupOriginLocation
11_11LeavesC. oleiferaS1Nursery of oil-tea camellia germplasm resources, Danzhou campus, Hainan University, China109°29′45″ E, 19°30′28″ N
215_15C. oleiferaS1
315_2C. oleiferaS1
415_3C. oleiferaS1
52_18C. oleiferaS1
63_18C. oleiferaS1
73_8C. oleiferaS1
84_13C. oleiferaS1
94_18C. oleiferaS1
105_3C. oleiferaS1
11A29C. oleiferaS1
12A7C. oleiferaS1
13A8C. oleiferaS1
14B18C. oleiferaS1
15B19C. oleiferaS1
16B22C. oleiferaS1
17B26C. oleiferaS1
18B30C. oleiferaS1
19B33C. oleiferaS1
20B34C. oleiferaS1
21B6C. oleiferaS1
22CL18C. oleiferaS1
23CL23C. oleiferaS1
24CL3C. oleiferaS1
25CL40C. oleiferaS1
26CL4C. oleiferaS1
27CL53C. oleiferaS1
28CR11C. oleiferaS1
29D2C. oleiferaS1
30D5C. oleiferaS1
31D6C. oleiferaS1
32E10C. oleiferaS1
33GC11C. oleiferaS1
34GC5C. oleiferaS1
35GC7C. oleiferaS1
36GC8C. oleiferaS1
37H12C. oleiferaS1
38H13C. oleiferaS1
39H15C. oleiferaS1
40H17C. oleiferaS1
41H18C. oleiferaS1
42H19C. oleiferaS1
43H1C. oleiferaS1
44H20C. oleiferaS1
45H3C. oleiferaS1
46H5C. oleiferaS1
47H6C. oleiferaS1
48H7C. oleiferaS1
49H9C. oleiferaS1
50HUA16C. oleiferaS1
51HUA23C. oleiferaS1
52HUA32C. oleiferaS1
53HUA42C. oleiferaS1
54HUA44C. oleiferaS1
55HUA88C. oleiferaS1
56HUA97C. oleiferaS1
57HY14C. oleiferaS1
58HY22C. oleiferaS1
59HY29C. oleiferaS1
60HY52C. oleiferaS1
61HY8C. oleiferaS1
62K6C. oleiferaS1
63KE13C. oleiferaS1
64KE2C. oleiferaS1
65KE5C. oleiferaS1
66MQ150C. oleiferaS1
67N1C. oleiferaS1
68N26C. oleiferaS1
69N3C. oleiferaS1
70N41C. oleiferaS1
71N8C. oleiferaS1
72N9C. oleiferaS1
73SHI11C. oleiferaS1
74SK15-2C. oleiferaS1
75SK15-5C. oleiferaS1
76SK9-1C. oleiferaS1
77SKC. oleiferaS1
78XIAN207C. oleiferaS1
79XIAN3C. oleiferaS1
80XIAN41C. oleiferaS1
81XIAN46C. oleiferaS1
82XIAN67C. oleiferaS1
83XIAN72C. oleiferaS1
84XIAN82C. oleiferaS1
85XIAN87C. oleiferaS1
86XIAN89C. oleiferaS1
87XIAN93C. oleiferaS1
88ZA12C. oleiferaS1
89ZA16C. oleiferaS1
90ZA1C. oleiferaS1
91ZA22C. oleiferaS1
92ZA24C. oleiferaS1
93ZA27C. oleiferaS1
94ZA31C. oleiferaS1
95ZA3C. oleiferaS1
96FS1C. vietnamensisS2Fansai Village, Wuzhishan City, Hainan Province109°32′24″ E, 18°50′37″ N
97FS2C. vietnamensisS2
98HC1HC. vietnamensisS2Fushan Town, Chengmai County, Hainan Province109°54′55″ E, 19°52′20″ N
99HC2HC. vietnamensisS2
100HD2HC. vietnamensisS2Shangke Town, Qionghai City, Hainan Province110°20′39″ E, 19°04′20″ N
101HD4HC. vietnamensisS2
102HL1HC. vietnamensisS2Qiongshan Area, Haikou City, Hainan Province110°21′54″ E, 19°59′25″ N
103HL2HC. vietnamensisS2
104HS1C. vietnamensisS2Hongshan Village, Wuzhishan City, Hainan Province109°30′56″ E, 18°51′35″ N
105HS3C. vietnamensisS2
106HS4C. vietnamensisS2
107RY1HC. vietnamensisS2Wencheng Town, Wenchang City, Hainan Province110°47′38″ E, 19°33′13″ N
108RY2HC. vietnamensisS2
109WH1HC. vietnamensisS2Wanling Town, Qiongzhong County, Hainan Province109°53′48″ E, 19°08′35″ N
110WH2HC. vietnamensisS2
111WH3HC. vietnamensisS2
112WH4HC. vietnamensisS2
113HONG3C. chekiangoleosaS3Wuzhishan City, Hainan Province109°30′57″ E, 18°46′29″ N
114HONG4C. chekiangoleosaS3
115CLSeedsC. oleiferaS1Xixiangtang Area, Nanning City, Guangxi Zhuang Autonomous Region108°21′7″ E, 22°55′6″ N
116CL-1C. oleiferaS1
117CL-2C. oleiferaS1
118DZC. oleiferaS1
119DZ-1C. oleiferaS1
120DZ-2C. oleiferaS1
121DZ-3C. oleiferaS1
122DZ-4C. oleiferaS1
123XLC. oleiferaS1
124XL-1C. oleiferaS1
125XL-2C. oleiferaS1
126XL-3C. oleiferaS1
127XL-4C. oleiferaS1
128GNC. chekiangoleosaS3
129GN-1C. chekiangoleosaS3
130GN-2C. chekiangoleosaS3
131BBC. crapnellianaS4
132BB-1C. crapnellianaS4
133BB-2C. crapnellianaS4
134BB-3C. crapnellianaS4
135BB-4C. crapnellianaS4
136LCC. gauchowensisS5
137LC-1C. gauchowensisS5
138LC-2C. gauchowensisS5
139LC-3C. gauchowensisS5
140LC-4C. gauchowensisS5
Table 2. Detailed information for 24 pairs of primers in the study.
No.LocusRepeat UnitForward SequenceReverse SequencePre Experiment Size (bp)Fluorescent Dyes
1CoA007(TCT)6CCAATCTCCAAACGCAACTTCAGAGGAAATCGAGAGGCAG245FAM
2CoA008(ATAG)6CCAGCCAGCTAAGAGGTTTGCAGGTCATAGCTACCACGGA188FAM
3CoA011(CTT)5TGGGTGGCTCAATATCATCAACCGGCCATTTATATGGGTT200FAM
4CoA016(ATC)6GTAAGTCTCTGCACCGCCTCTCGATTTCGTCCAATCCTTC211FAM
5CoA020(AGG)6AGGGCATAAGAGGGAGTGGTCGACCTCGACCTTCAAGAAC207FAM
6CoA022(GA)12TAGCCAATAACATGCCCACAAGTTGTCCAACCCTTCCTCA147FAM
7CoA032(GCG)5TTATTCTTCGGGAACAACGGACACATGAAACAACGGCAAA170FAM
8CoA038(GTG)7GAGATCGGCCAGAGTTTGAGCATCAAAGCCACACTCGCTA202FAM
9CoA039(TTA)6GCAAGAGGTCTCTTTGGGTGAACCTCATGAGCTAAAGCCG113FAM
10CoA045(ACC)5TCCAAACAGGCCAACTAAGCGCTTGAGAAACCCAAAGCAG244FAM
11CoA046(TAAC)4AACCAGAGGAACATCCAACGTATCCTTGCCGCTTTGAATC196FAM
12CoA055(CAT)6TCTGGTGTGCTTCAAACTGCGCTCCAGCAAATATTCAGGC265FAM
13CoA069(TGC)6CATGGCTTGGCTTCAATCTTCAATGTTCCCAAGCGATTCT224FAM
14CoA081(CAA)5ATATGAATCGGCCAATCGACAGATGACGCCTTTCGAAGAA154FAM
15CoA084(GTG)6GACGGCTTAAACATGGAGGATTCATTTAATGGCAGGAGGC110FAM
16SJMCoa003(CAA)7ACGAAACATGTCGGACGTGAGGGAATGGACGAGACTTGGG120FAM
17SJMCoa007(TTC)6GCAGCAGCGAGAGTAACAGTGTGGGACGATTGAGCTTCCT149FAM
18SJMCoa030(CCT)10GGTGTGGTGGTGAAGCAGTATTGTCTGGATCCATAGCCGC248FAM
19SJMCoa038(TTAT)5TGCTTGGTCACTACCCAGTCTGACACCTTGGTGCCAAAGA266FAM
20SJMCoa045(AAT)5TTTGGGCGGGCAAAGATTTGACTCAAGCATGGACATCGGG276FAM
21SJMCoa049(AAT)5AAGACCCAAACTGGACTGCAACCTTGCACCATAATGGGTT254FAM
22SJMCoa050(AAT)7TGGAGCGTTAGTCTGGAGTCGGCCTCTCATCCATGTCAGG249FAM
23SJMCoa058(CCA)9GTGCCCTGTGACACCAAGTACGACGGTGGAGATTTGGTGA245FAM
24SJMCoa090(TCA)9ACAGAAGGCGTTTGAGTCAAGGCTTCTTCTTCGGAACCCA165FAM
Table 3. Genetic parameters of the SSR locus analysis.
LocusProduct Size (bp)Number of AllelesNehIGstNm
CoA007176–257161.0072–1.68800.0071–0.40760.0237–0.59760.0037–0.71330.2010–134.0618
CoA008138–230261.0072–1.75210.0071–0.42930.0237–0.62060.0037–0.79810.0029–134.0618
CoA011167–206121.0072–1.55420.0071–0.35660.0237–0.53930.0037–1.00000–134.0618
CoA016208–367171.0072–1.71830.0071–0.38330.0237–0.60880.0037–0.78530.1367–134.0618
CoA020164–256211.0072–2.00000.0071–0.50000.0237–0.69310.0037–0.64240.2783–134.0618
CoA022127–184311.0072–1.94680.0071–0.48630.0237–0.67940.0037–0.70320.2110–134.0618
CoA032130–204221.0072–1.98720.0071–0.49680.0237–0.68990.0037–0.65550.2628–134.0618
CoA038192–221131.0072–1.96190.0071–0.49030.0237–0.68340.0037–0.62200.3038–134.0618
CoA039103–126131.0073–1.52900.0072–0.34600.0240–0.49730.0162–0.61180.3172–30.4262
CoA045237–288141.0072–1.99930.0071–0.49980.0237–0.69300.0037–0.76500.1536–134.0618
CoA046169–208171.0072–1.99830.0071–0.49960.0237–0.69270.0037–0.59940.3126–134.0618
CoA055151–313221.0073–1.29040.0072–0.22500.0240–0.38490.0112–1.00000–44.0603
CoA069211–266181.0072–1.91550.0071–0.47790.0237–0.67090.0037–0.84860.1211–134.0618
CoA081150–18471.0073–1.98350.0072–0.49590.0240–0.68900.0112–0.58570.3537–44.0603
CoA084106–11961.0072–1.60580.0071–0.37730.0237–0.56480.0037–0.48160.5381–134.0618
SJMCoa003126–167121.0072–1.99710.0071–0.49930.0237–0.69240.0037–0.65960.2581–134.0618
SJMCoa007224–311231.0072–1.99890.0071–0.49970.0237–0.69290.0037–0.49721.0755–134.0618
SJMCoa030238–277141.0072–1.76390.0071–0.43310.0237–0.62460.0037–10–134.0618
SJMCoa038273–304181.0072–1.86950.0071–0.46510.0237–0.65780.0037–0.29931.1705–134.0618
SJMCoa045291–317191.0073–1.92150.0072–0.47960.0240–0.67260.0075–0.32441.0415–66.5610
SJMCoa049270–28671.0072–1.99890.0071–0.49970.0237–0.69290.0037–0.35590.9048–134.0618
SJMCoa050253–273101.0072–1.34120.0071–0.25440.0237–0.42190.0037–1.00000–134.0618
SJMCoa058197–266161.0072–1.54380.0071–0.35220.0237–0.53710.0037–0.22381.7344–134.0618
SJMCoa090173–203111.0218–1.98290.0213–0.49570.0596–0.68880.0112–0.59340.3426–44.0603
Mean 16.04171.16760.11040.18900.39480.7666
Note: Ne, Number of Effective Alleles; h, Nei’s gene diversity; I, Shannon’s Information Index; Gst, Gene differentiation coefficient; Nm, estimate of gene flow from Gst.
Table 4. The population average diversity index.
GroupNNaNeIshuhP (%)
S11081.6051.1970.2140.1280.13079.48
S2170.9691.1950.1930.1210.12245.97
S350.4341.1400.1190.0810.10120.52
S450.2001.0410.0410.0270.0337.79
S550.4681.1160.1040.0700.08718.70
Mean280.7351.1380.1340.0860.09634.49
Note: N, Sample size; Na, Number of different alleles; Ne, Number of effective alleles; Ip, intra-specie diversity; h, Nei’s gene diversity; uh, Unbiased diversity; P, Percentage of Polymorphic Loci.
Table 5. An analysis of molecular variance among and within Camellia species.
Variation SourcedfSSMSEst. Var.PMV (%)Fstp value
Among Pops4485.260121.3157.197230.2310.001
Within Pops1353240.86224.00624.00677
Total1393726.121 31.203100
Note: df, degree of freedom; SS, Square deviation; MS, Mean square deviation; Est. Var., Exist variance; PMV, Percentages of molecular variance; Fst, coefficient of genetic differentiation. p value indicated significant differences of p ≤ 0.001.
Publisher’s Note: MDPI stays neutral with regard to jurisdictional claims in published maps and institutional affiliations.