Article

Morphological Characteristics and Comparative Chloroplast Genome Analyses between Red and White Flower Phenotypes of Pyracantha fortuneana (Maxim.) Li (Rosaceae), with Implications for Taxonomy and Phylogeny

1
Jiangsu Key Laboratory for the Research and Utilization of Plant Resources, Institute of Botany, Jiangsu Province and Chinese Academy of Sciences (Nanjing Botanical Garden Memorial Sun Yat-Sen), Nanjing 210014, China
2
Core Botanical Gardens/Wuhan Botanical Garden, Chinese Academy of Sciences, Wuhan 430074, China
3
University of Chinese Academy of Sciences, Beijing 100049, China
4
College of Life Sciences, Zhejiang University, Hangzhou 310058, China
*
Author to whom correspondence should be addressed.
Genes 2022, 13(12), 2404; https://doi.org/10.3390/genes13122404
Submission received: 23 November 2022 / Revised: 12 December 2022 / Accepted: 15 December 2022 / Published: 18 December 2022
(This article belongs to the Special Issue Advances in Evolution of Plant Organelle Genome)

Abstract

:
Pyracantha fortuneana (Maxim.) Li (Rosaceae), commonly known as Chinese firethorn, is an evergreen shrub with high nutritional, medicinal, and horticultural importance. This species typically has white flowers, but a rare red flower phenotype has been found in very few wild populations in western Hubei, China, showing great ornamental potential. In this study, the complete chloroplast genome of the red flower phenotype of P. fortuneana was reported for the first time, using high-throughput sequencing technology. The complete chloroplast genome was 160,361 bp in length and showed a typical quadripartite structure with a pair of inverted repeat (IR) regions (26,350 bp) separated by a large single-copy (LSC) region (88,316 bp) and a small single-copy (SSC) region (19,345 bp). A total of 131 functional genes were annotated in this chloroplast genome, including 86 protein-coding genes (PCGs), eight rRNA genes, and 37 tRNA genes. Comparative chloroplast genome analyses revealed that high genome similarity existed not only between red and white flower phenotypes of P. fortuneana, but also among Pyracantha species. No evidence for positive selection was found in any PCG, suggesting the evolutionary conservation of Pyracantha chloroplast genomes. Furthermore, four mutational hotspots (trnG-trnR-atpA, psbZ-trnG-trnfM-rps14, ycf3-trnS-rps4, and ndhF-rpl32) with π > 0.004 were identified as potential molecular markers for Pyracantha species. Phylogenomic analysis strongly supported that the red flower phenotype of P. fortuneana was nested within the common white flower phenotype. Based on both morphological and molecular evidence, we suggest that the red flower phenotype of P. fortuneana could be considered as a new forma. Overall, the availability of these genetic resources will not only offer valuable information for further studies on molecular taxonomy, phylogeny, and population genetics of Pyracantha species but also could be used as potential genetic resources for Chinese firethorn breeding.

1. Introduction

Pyracantha M. Roem. (Rosaceae), commonly called firethorn, is composed of 10 evergreen shrub species and mainly distributed in contiguous areas from Eastern Asia to Southern Europe [1,2]. China is the most important distribution center of this genus and harbors seven species, including five endemic species [1,3]. Previous morphological and molecular phylogenetic analyses placed this genus in the subfamily Maloideae [3], or treated it as a subtribe (Pyracanthinae) within the tribe Maleae of subfamily Amygdaloideae [4,5,6]. However, Pyracantha is currently recognized as a stable monophyletic genus [7,8], differing from many paraphyletic taxa in the tribe Maleae, such as Stranvaesia Lindl., Sorbus L., Photinia Lindl., etc., which have reticulate evolutionary histories with undefined taxonomic positions [9,10,11,12].
Pyracantha fortuneana is one of the most economically important species in this genus and has great nutritional, medicinal, and horticultural properties [13]. Specifically, the fruits of P. fortuneana, rich in sugar (149.40 mg/g), proteins (105.00 mg/g), and vitamin C (0.32 mg/g), were traditionally consumed as meal replacements by local people after being ground into flour [13,14,15]. The roots, leaves, flowers, and fruits can be used as traditional Chinese medicine with various pharmacological activities, including antioxidative, immune, and anti-tumor effects [13,16]. More importantly, this species has a high ornamental value, with flourishing branches and leaves, and dense flowers and red fruits, and is now widely used as a wild evergreen shrub in China [14]. Typically, the flowers of this species are white or yellowish, while a red flower phenotype was found in very few wild populations in western Hubei, China. The petals and inner sepals of this phenotype are red (versus white in the common phenotype), and all mature leaves turn red (versus green in the common phenotype) in winter (Figure 1) [17]. Generally speaking, this rare red flower phenotype shows a higher ornamental value than the common white flower phenotype of P. fortuneana and thus could be served as a suitable parent for breeding hybrids and subsequent development of improved cultivars. However, so far, genetic and/or genomic resources for the red flower phenotype of P. fortuneana have not been developed, and the taxonomic status of this rare phenotype has not been verified.
Chloroplasts are believed to derive from a single primary endosymbiotic event involving the capture of a cyanobacterium and have their own genomes encoding many key proteins in relation to photosynthesis and other major cellular functions, including synthesis of starch, fatty acids, pigments, and amino acids [18,19,20]. A typical chloroplast genome is a double-stranded circular DNA and portrays a quadripartite structure, including a pair of inverted repeat (IR) regions separated by a large single-copy (LSC) region and a small single-copy (SSC) region [21]. Due to its independent matrilineal inheritance, the lack of genetic recombination, low levels of nucleotide substitution, and small effective population size, the chloroplast genome has been widely used for accurate species identification and phylogenetic inference in different plant lineages, especially those with a complex phenotypic evolution [22,23,24,25,26].
According to our field observation, we hypothesized that the red flower phenotype of P. fortuneana could be recognized as a rare phenotype resource of this species or be considered as a new forma. To test this hypothesis, the complete chloroplast genome of the red flower phenotype of P. fortuneana (P. fortuneana (red)) was sequenced and assembled. Combined with previously published chloroplast genomes of this genus, including two individuals of P. fortuneana with white flower phenotype (P. fortuneana-1 (white) (NC_059101) and P. fortuneana-2 (white) (MW596361)) and one individual each for Pyracantha atalantioides (Hance) Stapf (MW801001), Pyracantha coccinea M. Roem. (NC_062343), and Pyracantha angustifolia (Franch.) Schneid. (KY419957), respectively, we provided a total of six chloroplast genomes for comparative genomic and phylogenomic analyses. Our study aims were to: (1) characterize and compare the chloroplast genomes of Pyracantha species to demonstrate their evolutionary patterns; (2) screen and identify candidate DNA barcodes for species/phenotype identification within Pyracantha; (3) resolve phylogenetic relationships within the genus Pyracantha, and (4) gain insights into the taxonomy of the red flower phenotype of P. fortuneana based on both molecular and morphological evidence.

2. Materials and Methods

2.1. Sample Collection and Genome Sequencing

Young leaf materials of P. fortuneana with the red flower phenotype were collected from one wild population in western Hubei, China (29°21′15.68″ N, 108°58′16.61″ E, Alt. 750 m) and then dried with silica gel. Total genomic DNA was extracted from silica gel-dried leaf samples using a modified procedure of CTAB (cetyltrimethylammonium bromide) [27]. The purified genomic DNA was fragmented to construct short-insert libraries for low-depth whole-genome sequencing, using the Illumina paired-end technology platform (HiSeq-PE150), and about 8 Gb of raw data were obtained. Library construction and sequencing were conducted by Novogene Bioinformatics Technology Co., Ltd. (Beijing, China).

2.2. Chloroplast Genome Assembly and Annotation

The raw reads were employed to assemble the complete chloroplast genome sequence of P. fortuneana (red) using a GetOrganelle pipeline [28] with the suggested default parameters. The connection and circularity of the assembly graphs from GetOrganelle were subsequently visually checked in Bandage v.0.8.1 [29]. The Chloroplast genome annotation was performed using the Plastid Genome Annotator (PGA) program [30], with the annotated sequences of Amborella trichopoda (AJ506156) and P. fortuneana (NC_059101) as references. The draft annotation was further verified by GeSeq software v.1.4.2 [31] and checked manually. The annotated chloroplast genome sequence of P. fortuneana was deposited in GenBank (accession No.: OM793283). The circular chloroplast genomic map was drawn using the online software Chloroplot (https://irscope.shinyapps.io/Chloroplot/, accessed on 2 December 2022) [32], with subsequent manual editing.

2.3. Comparative Chloroplast Genome Analyses

The basic features of the chloroplast genome sequence of P. fortuneana (red), including the size and GC content of different regions, and gene classification were analyzed with Geneious software v.10.2.3 [33] and were compared with those in four other complete chloroplast genomes of Pyracantha, i.e., P. fortuneana-1 (white), P. fortuneana-2 (white), P. coccinea, and P. atalantioides (note: the chloroplast genome of P. angustifolia was not included in this analysis because only one copy of the IR region was kept by the GenBank submitter). The inverted repeat-single copy (IR/SC) junction characteristics of these five Pyracantha chloroplast genome sequences were drawn in Adobe Illustrator. Furthermore, all six chloroplast genome sequences (only one copy of IR included) from four Pyracantha species (i.e., P. fortuneana, P. coccinea, P. atalantioides, and P. angustifolia) were aligned to identify potentially sequence rearrangements of Pyracantha chloroplast genomes using Mauve software v.2.3.1 [34]. The genome-wide similarity of these Pyracantha species was also plotted using the online software Circoletto (http://tools.bat.infspire.org/circoletto/, accessed on 12 July 2022) [35].

2.4. Codon Usage and RNA Editing Analyses

For the codon usage bias analysis, MEGA v.7.0 [36] was used to calculate the RSCU (relative synonymous codon usage) values of coding sequences (CDSs) across all six Pyracantha chloroplast genomes. Additionally, the potential RNA editing sites in P. fortuneana chloroplast genomes were further predicted using the PREP-Cp web server (http://prep.unl.edu/cgi-bin/cp-input.pl) [37], with a cutoff value of 1.

2.5. Selection Pressure and Analysis

The selection pressure on protein-coding genes (PCGs) of six Pyracantha chloroplast genomes was evaluated using the Datamonkey web server (https://www.datamonkey.org/, accessed on 1 July 2022) [38], with FEL (Fixed Effects Likelihood) as the best-fit method according to the step tips. All 78 shared PCGs of six Pyracantha chloroplast genomes were extracted in Geneious software v.10.2.3 and aligned using the program Muscle in MEGA software v.7.0 [39]. For each gene alignment matrix, the stop codons and unaligned fragments were removed using the program Gbloks v.0.91.b [40]. Then, all these single-gene alignment matrices were concatenated into a supermatrix alignment in PhyloSuite v.1.2.2 [41]. Finally, the concatenated protein-coding sequences were uploaded to Datamonkey to perform selection pressure analysis.

2.6. Identification of SSRs and Highly Variable Regions

The MISA Perl program [42] was used to identify simple sequence repeats (SSRs) across chloroplast genome sequences of three P. fortuneana accessions (one accession of the red flower phenotype and two accessions of the white flower phenotype) and another three Pyracantha species (i.e., P. coccinea, P. atalantioides, and P. angustifolia) with the common minimum repeat settings: ten for mononucleotides, five for dinucleotides, four for trinucleotides, and three for tetranucleotides, pentanucleotides, and hexanucleotides, respectively. DnaSP software v.6.12.3 [43] was used to calculate genome-wide nucleotide diversity (Pi) of the aligned chloroplast genome sequences of Pyracantha (excluding one copy of IR), with a window length of 600 bp and a step size of 200 bp.

2.7. Genetic Distance Analyses

Pairwise genetic distances between all Pyracantha individuals were computed under the analysis of molecular variance (AMOVA) and used to construct a neighbor-joining phenogram [44] in MEGA v.7.0 [36] based on the multiple alignment of Pyracantha chloroplast genomes with MAFFT software v.7.409 [45].

2.8. Phylogenetic Analyses

To explore phylogenetic relationships within the genus Pyracantha and among the members of the tribe Maleae of Rosaceae, a total of 31 chloroplast genome sequences (only one copy of IR kept) were used to reconstruct phylogenetic trees based on the methods of maximum likelihood (ML) and Bayesian inference (BI). Except for P. fortuneana (red), the other 30 chloroplast genome sequences were downloaded from the NCBI database (five accessions of the subtribe Pyracanthinae, five accessions of the subtribe Vauqueliniinae, five accessions of the subtribe Lindleyinae, 13 accessions of the subtribe Mespilinae, and two outgroups (Gillenia stipulata and Gillenia trifoliata)) (Table S1). All 31 chloroplast genome sequences were aligned using MAFFT software v.7.409 [45], and then the best-fit models for the ML and BI methods were selected according to the Bayesian information criterion (BIC) using the ModelFinder program [46] in Phylosuite v.1.2.2 [41]. ML analysis was implemented in IQ-TREE v.2.1.2 [47] with 1000 bootstrap replications under the best fit model TVM + I + G2 + F. The BI tree was constructed using MrBayes software v.3.2.6 [48], under the best-fit model GTR + F + I + G4. The Markov chain Monte Carlo (MCMC) algorithm was run for two independent runs of 1 × 10⁶ generations, with four independent Markov chain Monte Carlo (MCMC) chains each (i.e., one cold and three heated) and a sampling frequency of 1000 trees. The initial 25% of sampled trees were discarded as burn-in. The ML and BI trees were then combined in TreeGraph software v.2 [49], based on the consistent topological structures, and the combined phylogenetic tree was visualized using Figtree software v.1.4.4 (http://tree.bio.ed.ac.uk/software/figtree/, accessed on 31 July 2022).
A total of 30 nrDNA ITS sequences from two flower phenotypes of P. fortuneana and related species were also used for constructing phylogenetic trees following the same described methods as above for chloroplast genomes. Among these sequences, the ITS sequences of P. fortuneana (red), P. fortuneana-2 (white) and P. coccinea were generated from raw sequence data (NCBI SRA accession nos. SRR21976475, SRR17631715, and SRR13004386 for these three accessions, respectively) using GetOrganelle v.1.7.4 [28], while the other 27 ITS sequences (P. fortuneana-1 (white), four accessions of the subtribe Vauqueliniinae, four accessions of the subtribe Lindleyinae, 16 accessions of the subtribe Mespilinae, and two outgroups (G. stipulata and G. trifoliata)) were downloaded from the NCBI database (see details in Table S2).

3. Results

3.1. Chloroplast Genome Characteristics

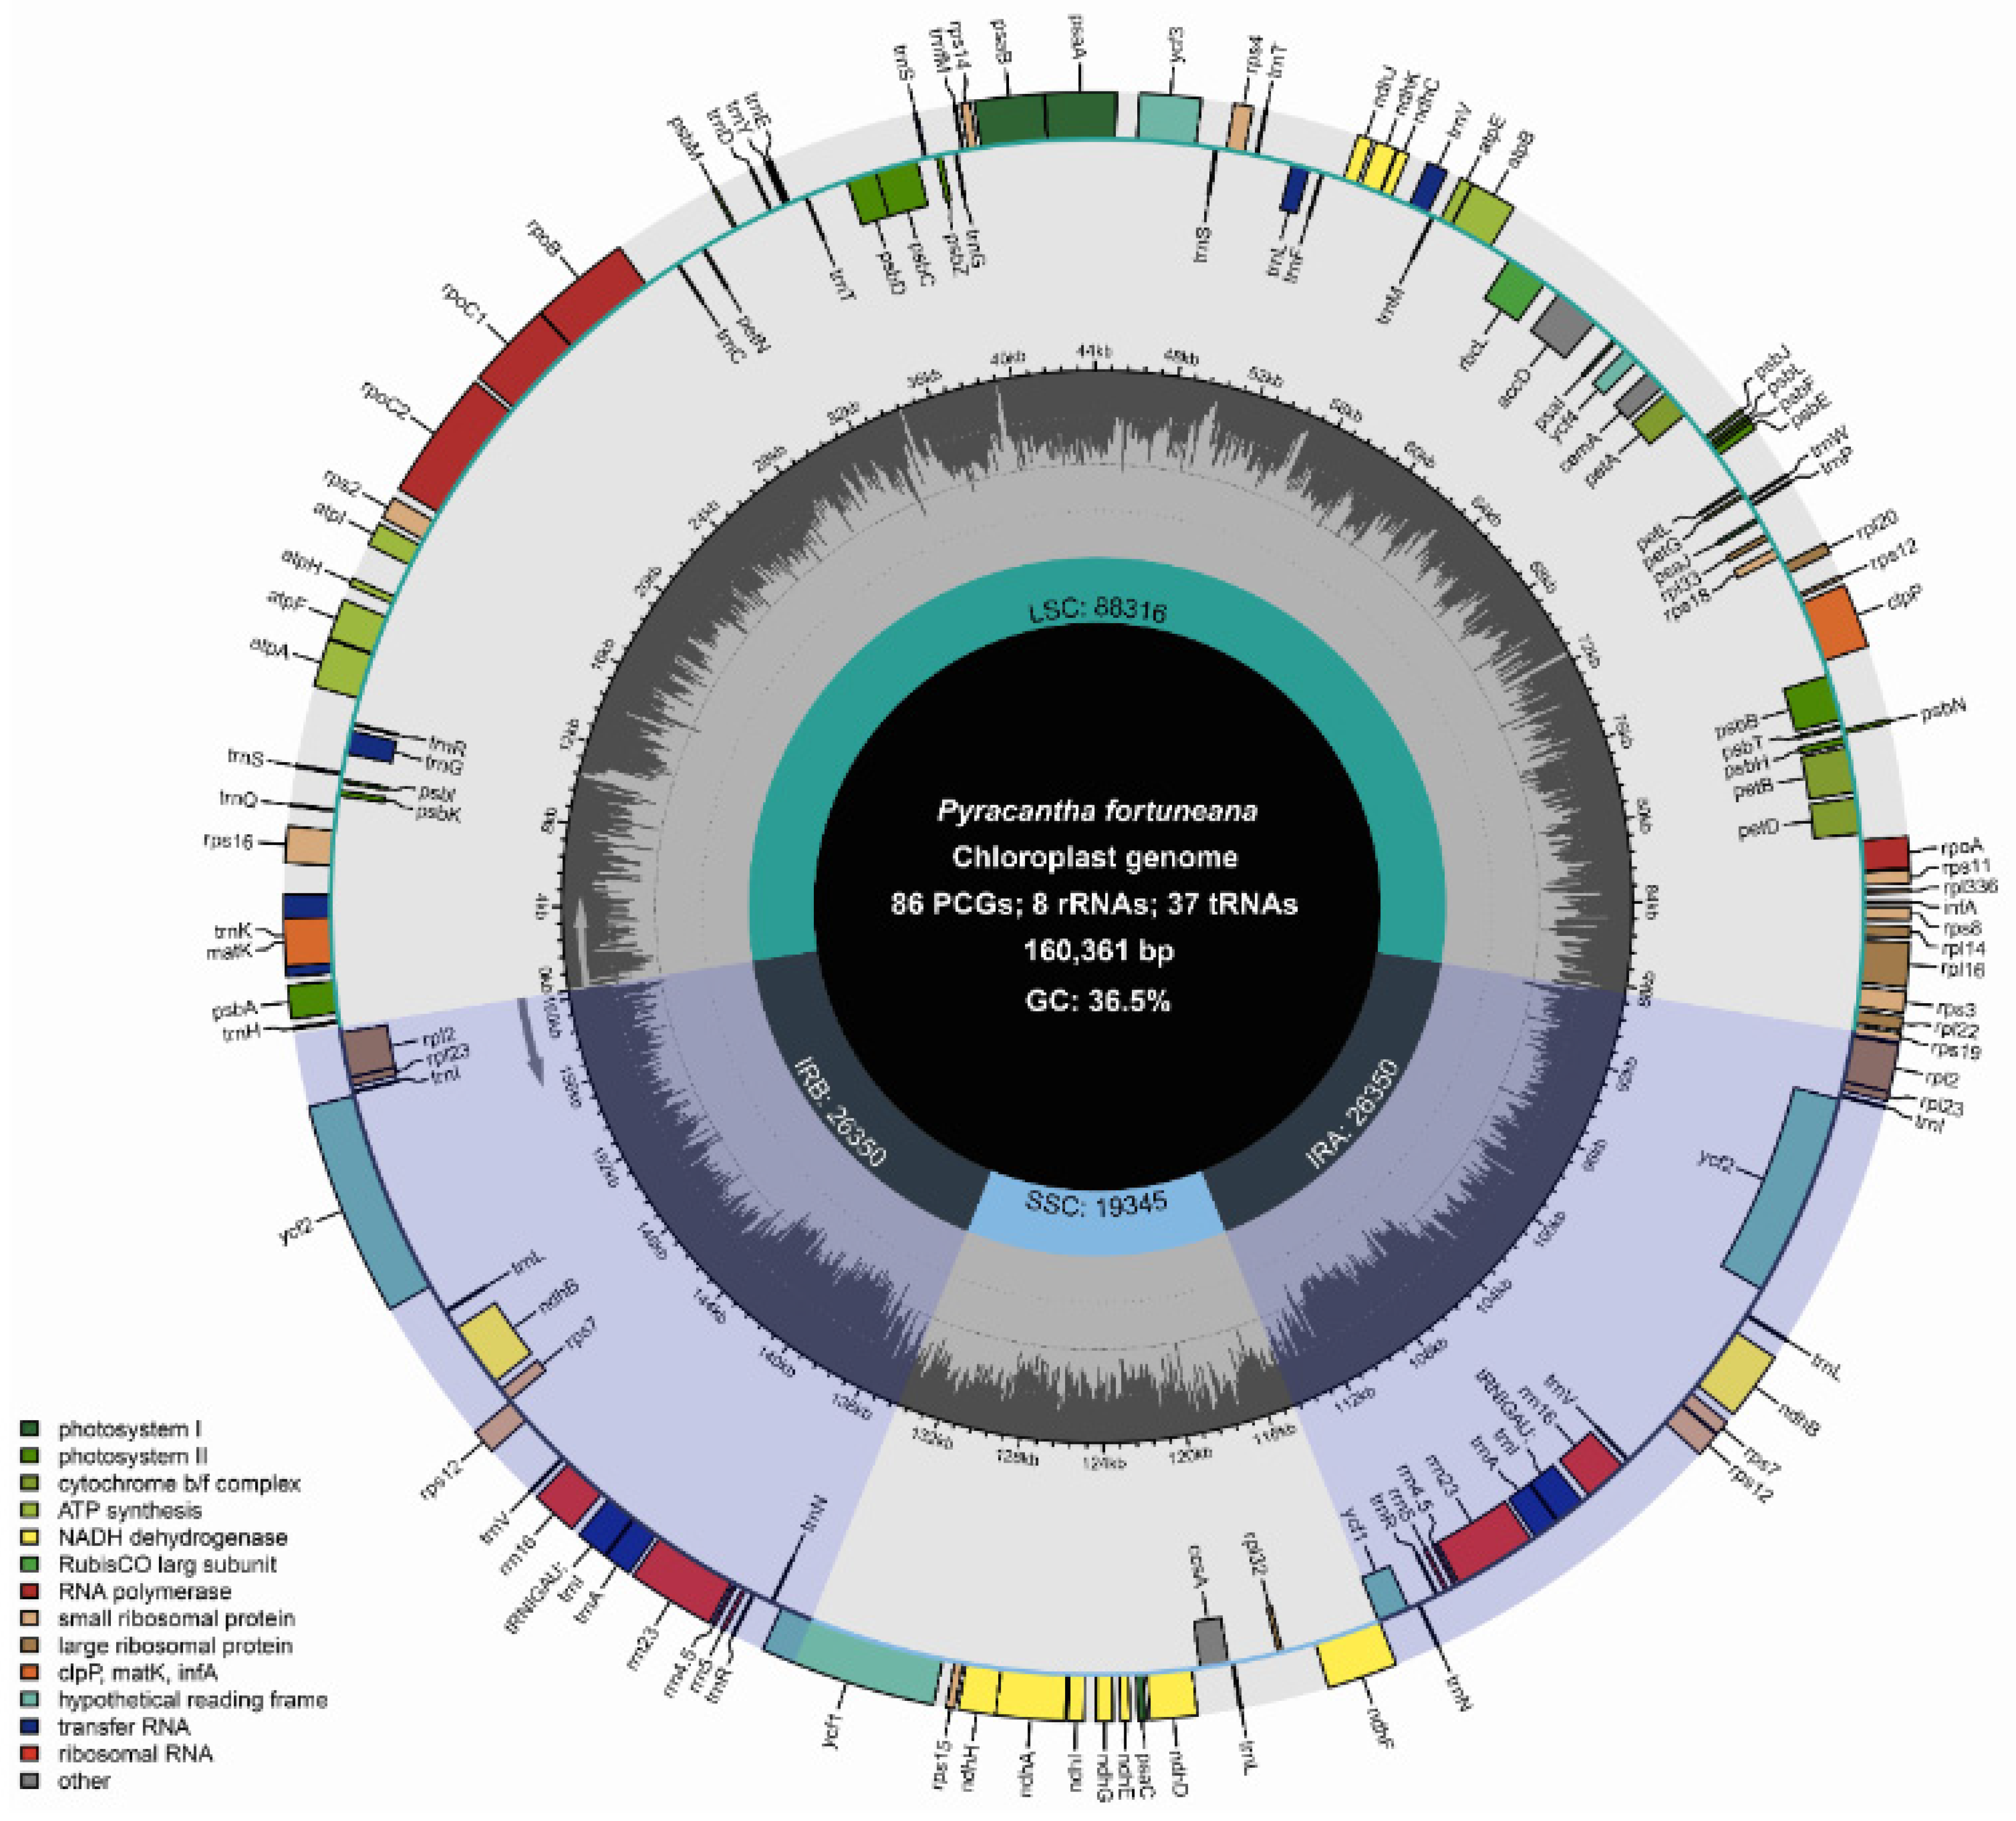
The complete chloroplast genome of P. fortuneana (red) was 160,361 bp in length and retained the typical quadripartite structure, comprising a large single-copy (LSC) region of 88,316 bp, a small single-copy (SSC) region of 19,345 bp, and a pair of inverted repeat (IR) regions of 26,350 bp (Figure 2). The overall GC content of the whole genome was 36.5%, and the corresponding values of the LSC, SSC, and IR regions were 34.1%, 30.4%, and 42.7%, respectively. Among the five Pyracantha chloroplast genomes, i.e., P. fortuneana (red), P. fortuneana-1 (white), P. fortuneana-2 (white), P. coccinea, and P. atalantioides, whole-chloroplast-genome sizes varied from 160,361 bp (P. fortuneana (red)) to 160,803 bp (P. atalantioides), with LSC from 88,316 bp (P. fortuneana (red)) to 88,698 bp (P. atalantioides), SSC from 19,344 bp (P. fortuneana-2 (white)) to 19,438 bp (P. coccinea), and IR from 26,342 bp (P. coccinea) to 26,355 bp (P. fortuneana-1 (white)) (Table 1). The length variations among the three individuals (two flower phenotypes) of P. fortuneana were much less than those among the three Pyracantha species. Furthermore, GC content in the LSC, SSC, and IR regions as well as whole genome sequences were almost the same among these five Pyracantha chloroplast genomes (Table 1).
A total of 131 functional genes, including 86 protein-coding genes (PCGs), 37 tRNA genes, and eight rRNA genes were annotated in the chloroplast genome of P. fortuneana (red), which could be further divided into four categories (Table 2). Among them, 18 genes were duplicated in IR regions, including seven PCGs (ndhB, ycf2, ycf15, rpl2, rpl23, rps7, and rps12), seven tRNAs (trnA-UGC, trnI-CAU, trnI-GAU, trnL-CAA, trnN-GUU, trnR-ACG, and trnV-GAC), and four rRNAs (rrn4.5, rrn5, rrn16, and rrn23) (Table 2). Ten PCGs (atpF, ndhA, ndhB, petB, petD, rpl2, rpl16, rps12, rps16, and rpoC1) and six tRNAs (trnA-UGC, trnG-UCC, trnI-GAU, trnK-UUU, trnL-UAA, and trnV-UAC) contained a single intron, while two PCGs (clpP and ycf3) had two introns (Table 2). Additionally, the infA gene has been entirely lost in the chloroplast of P. fortuneana (red), and the start codon of the psbL gene has mutated to noncanonical ACG instead of the most common AUG. The gene number and gene content in the chloroplast genome of P. fortuneana (red) were totally identical with those in P. fortuneana (white), P. coccinea, and P. atalantioides.

3.2. Whole-Chloroplast-Genome Comparison

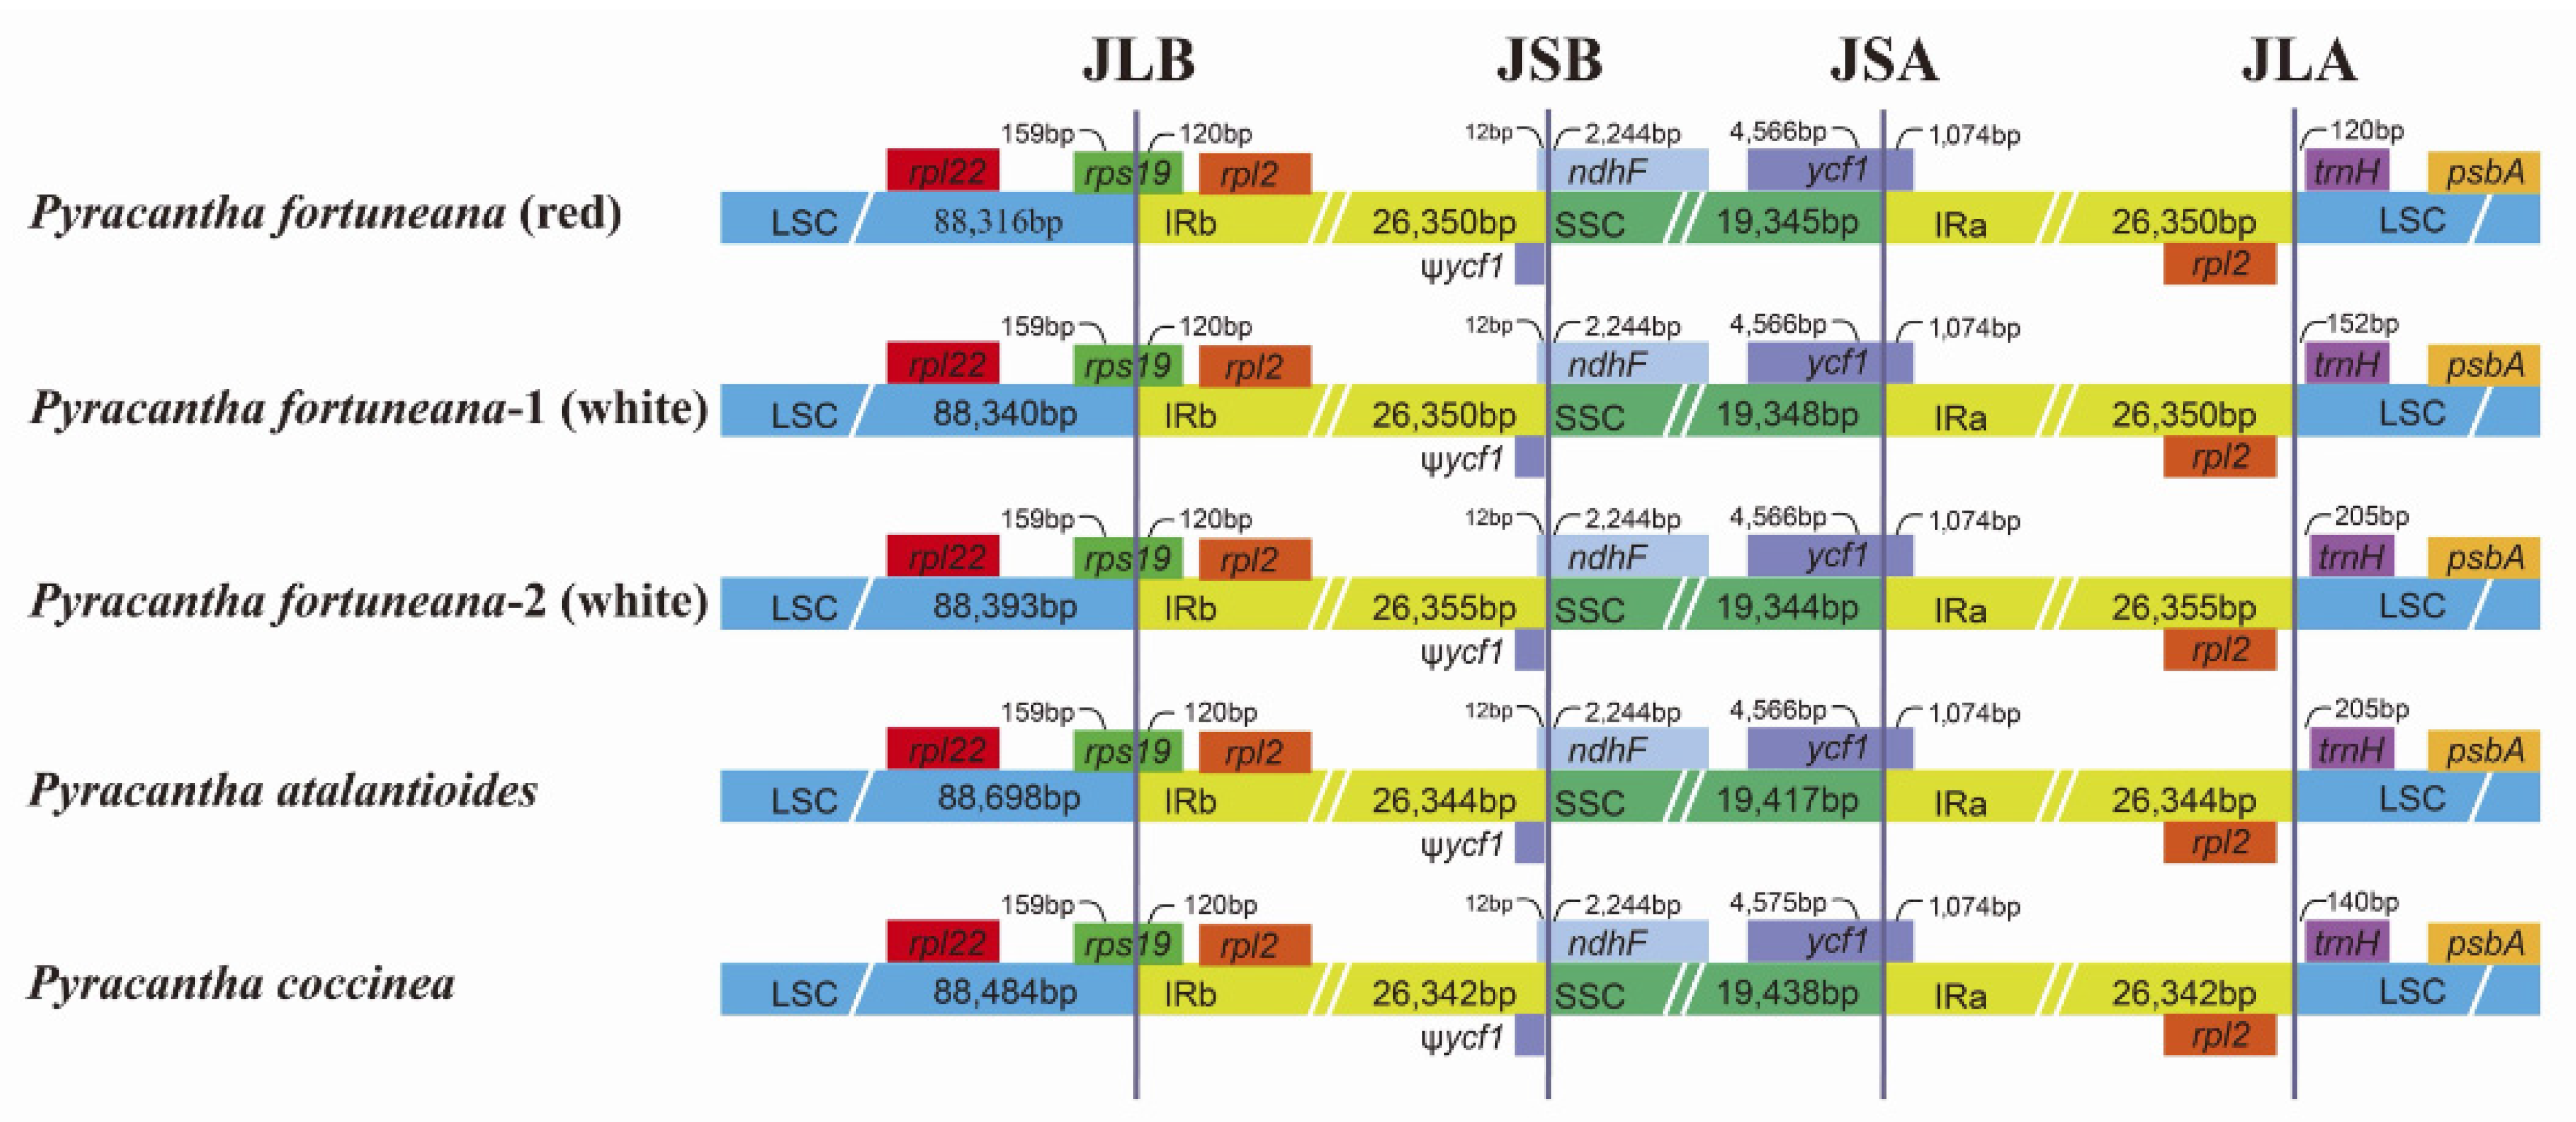
The IR/SC junction characteristics of chloroplast genomes were almost the same not only between P. fortuneana (red) and P. fortuneana (white) but also even between P. fortuneana and three other Pyracantha species (Figure 3). The rps19 gene of these five chloroplast genomes extended 120 bp into the IRb region at the junction of the LSC/IRb (JLB), creating a duplicated pseudogene at the IRa region (pseudogene not shown). Similarly, the ycf1 gene crossed the SSC/IRa (JSA), and the pseudogene fragment was located at the IRb region with 1074 bp (pseudogene not shown). The gene trnH-GUG was completely located in the LSC region, with a length of 120–205 bp away from the LSC/IRa (JLA) boundary (Figure 3). Additionally, structural comparison of Pyracantha chloroplast genomes revealed that there were high levels of syntenic similarity between P. fortuneana (including two flower phenotypes) and three other Pyracantha species (Figure S1), with no significant rearrangements detected (Figure S2).

3.3. Codon Usage Bias and RNA Editing Sites

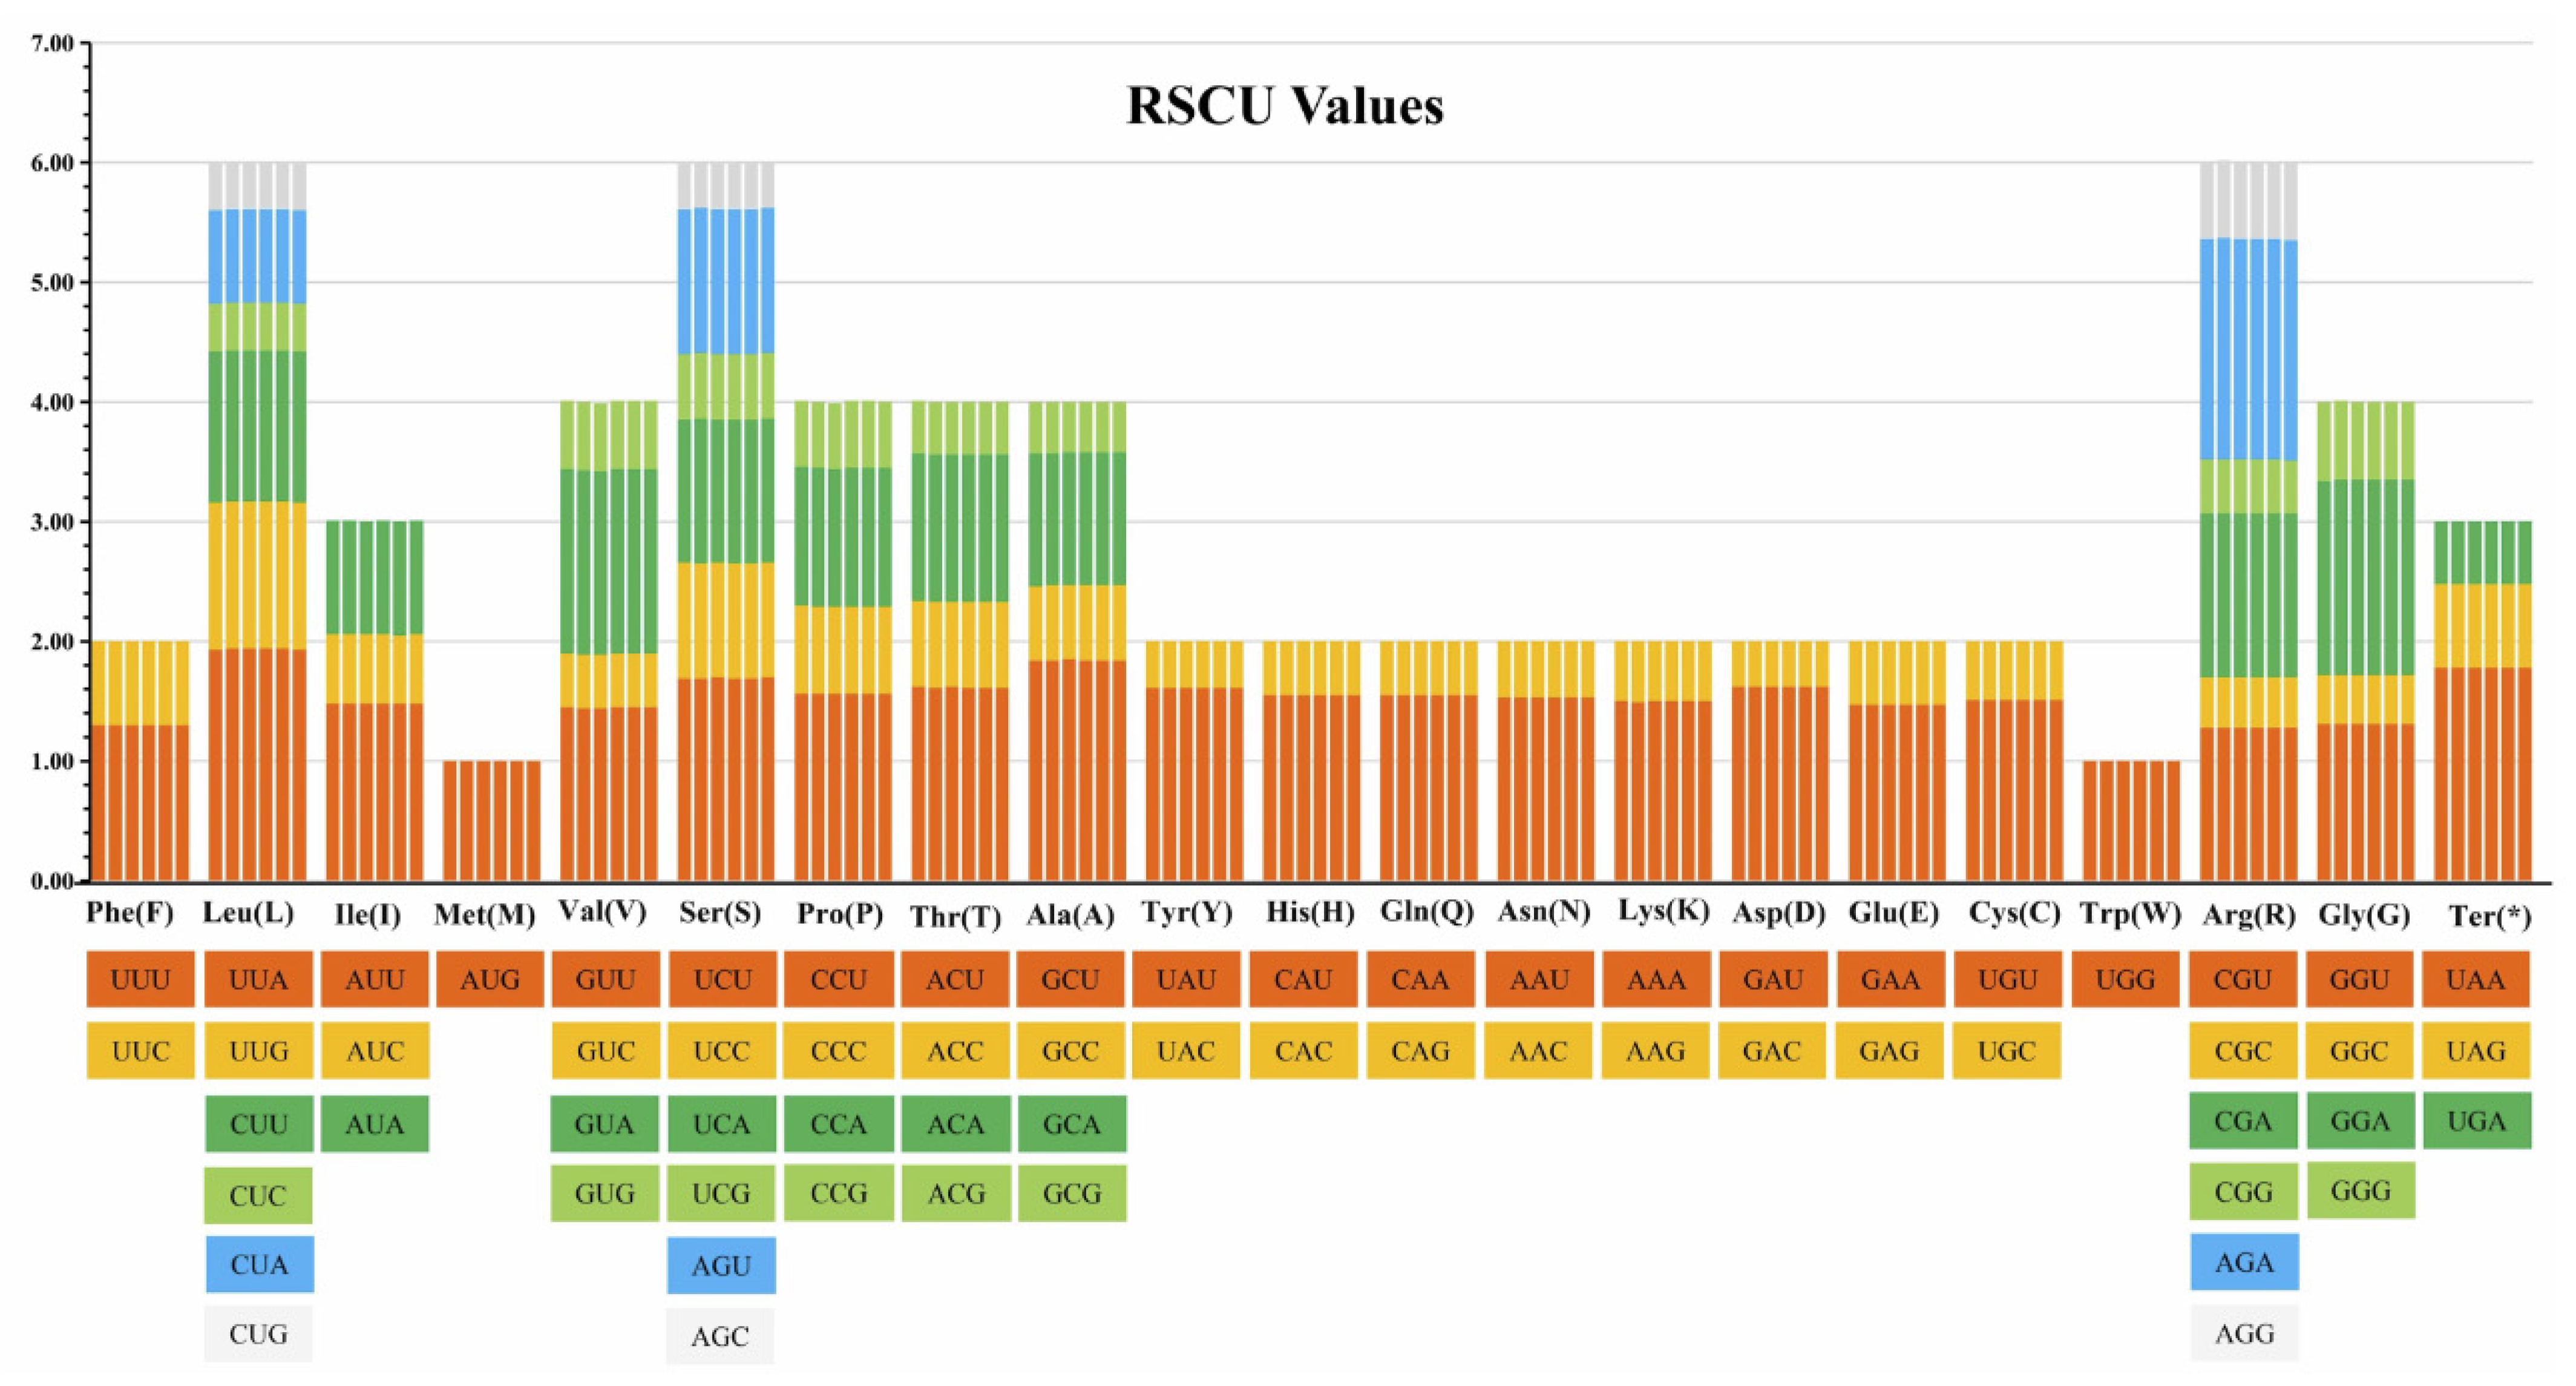
A total of 26,292 codons were identified in the chloroplast genome of P. fortuneana (red) (Table S3). Among all amino acids, tryptophan and methionine were the only two amino acids translated by one codon (UGG and AUG, respectively), while the remaining amino acids were translated by two to six codons. The most frequently used codon was UUA (1.93%, leucine), while the least abundant codon was AGC (0.38%, serine). Meanwhile, the three most frequent amino acids were serine (6.00%), arginine (6.00%), and leucine (5.99%), whereas the two least frequent amino acids were methionine (1.00%) and tryptophan (1.00%) (Table 3). It is also important to note that nearly all (30/32) C/G-ending codons had RSCU values lower than 1, while nearly all (29/32) A/U-ending codons had RSCU values higher than 1, indicating that most of the amino acids tended to use A/U-ending codons rather than C/G-ending codons (Table 3). Among all six Pyracantha chloroplast genomes, the total number of codons ranged from 26,288 (P. atalantioides) to 26,317 (P. angustifolia), with a slight difference between three accessions of P. fortuneana and two other Pyracantha species (Table S3). The RSCU values of the same codons were highly identical in six Pyracantha chloroplast genomes, and for each kind of amino acid, the sum of RSCU values of all codons involved in its encoding was also equal (Figure 4).
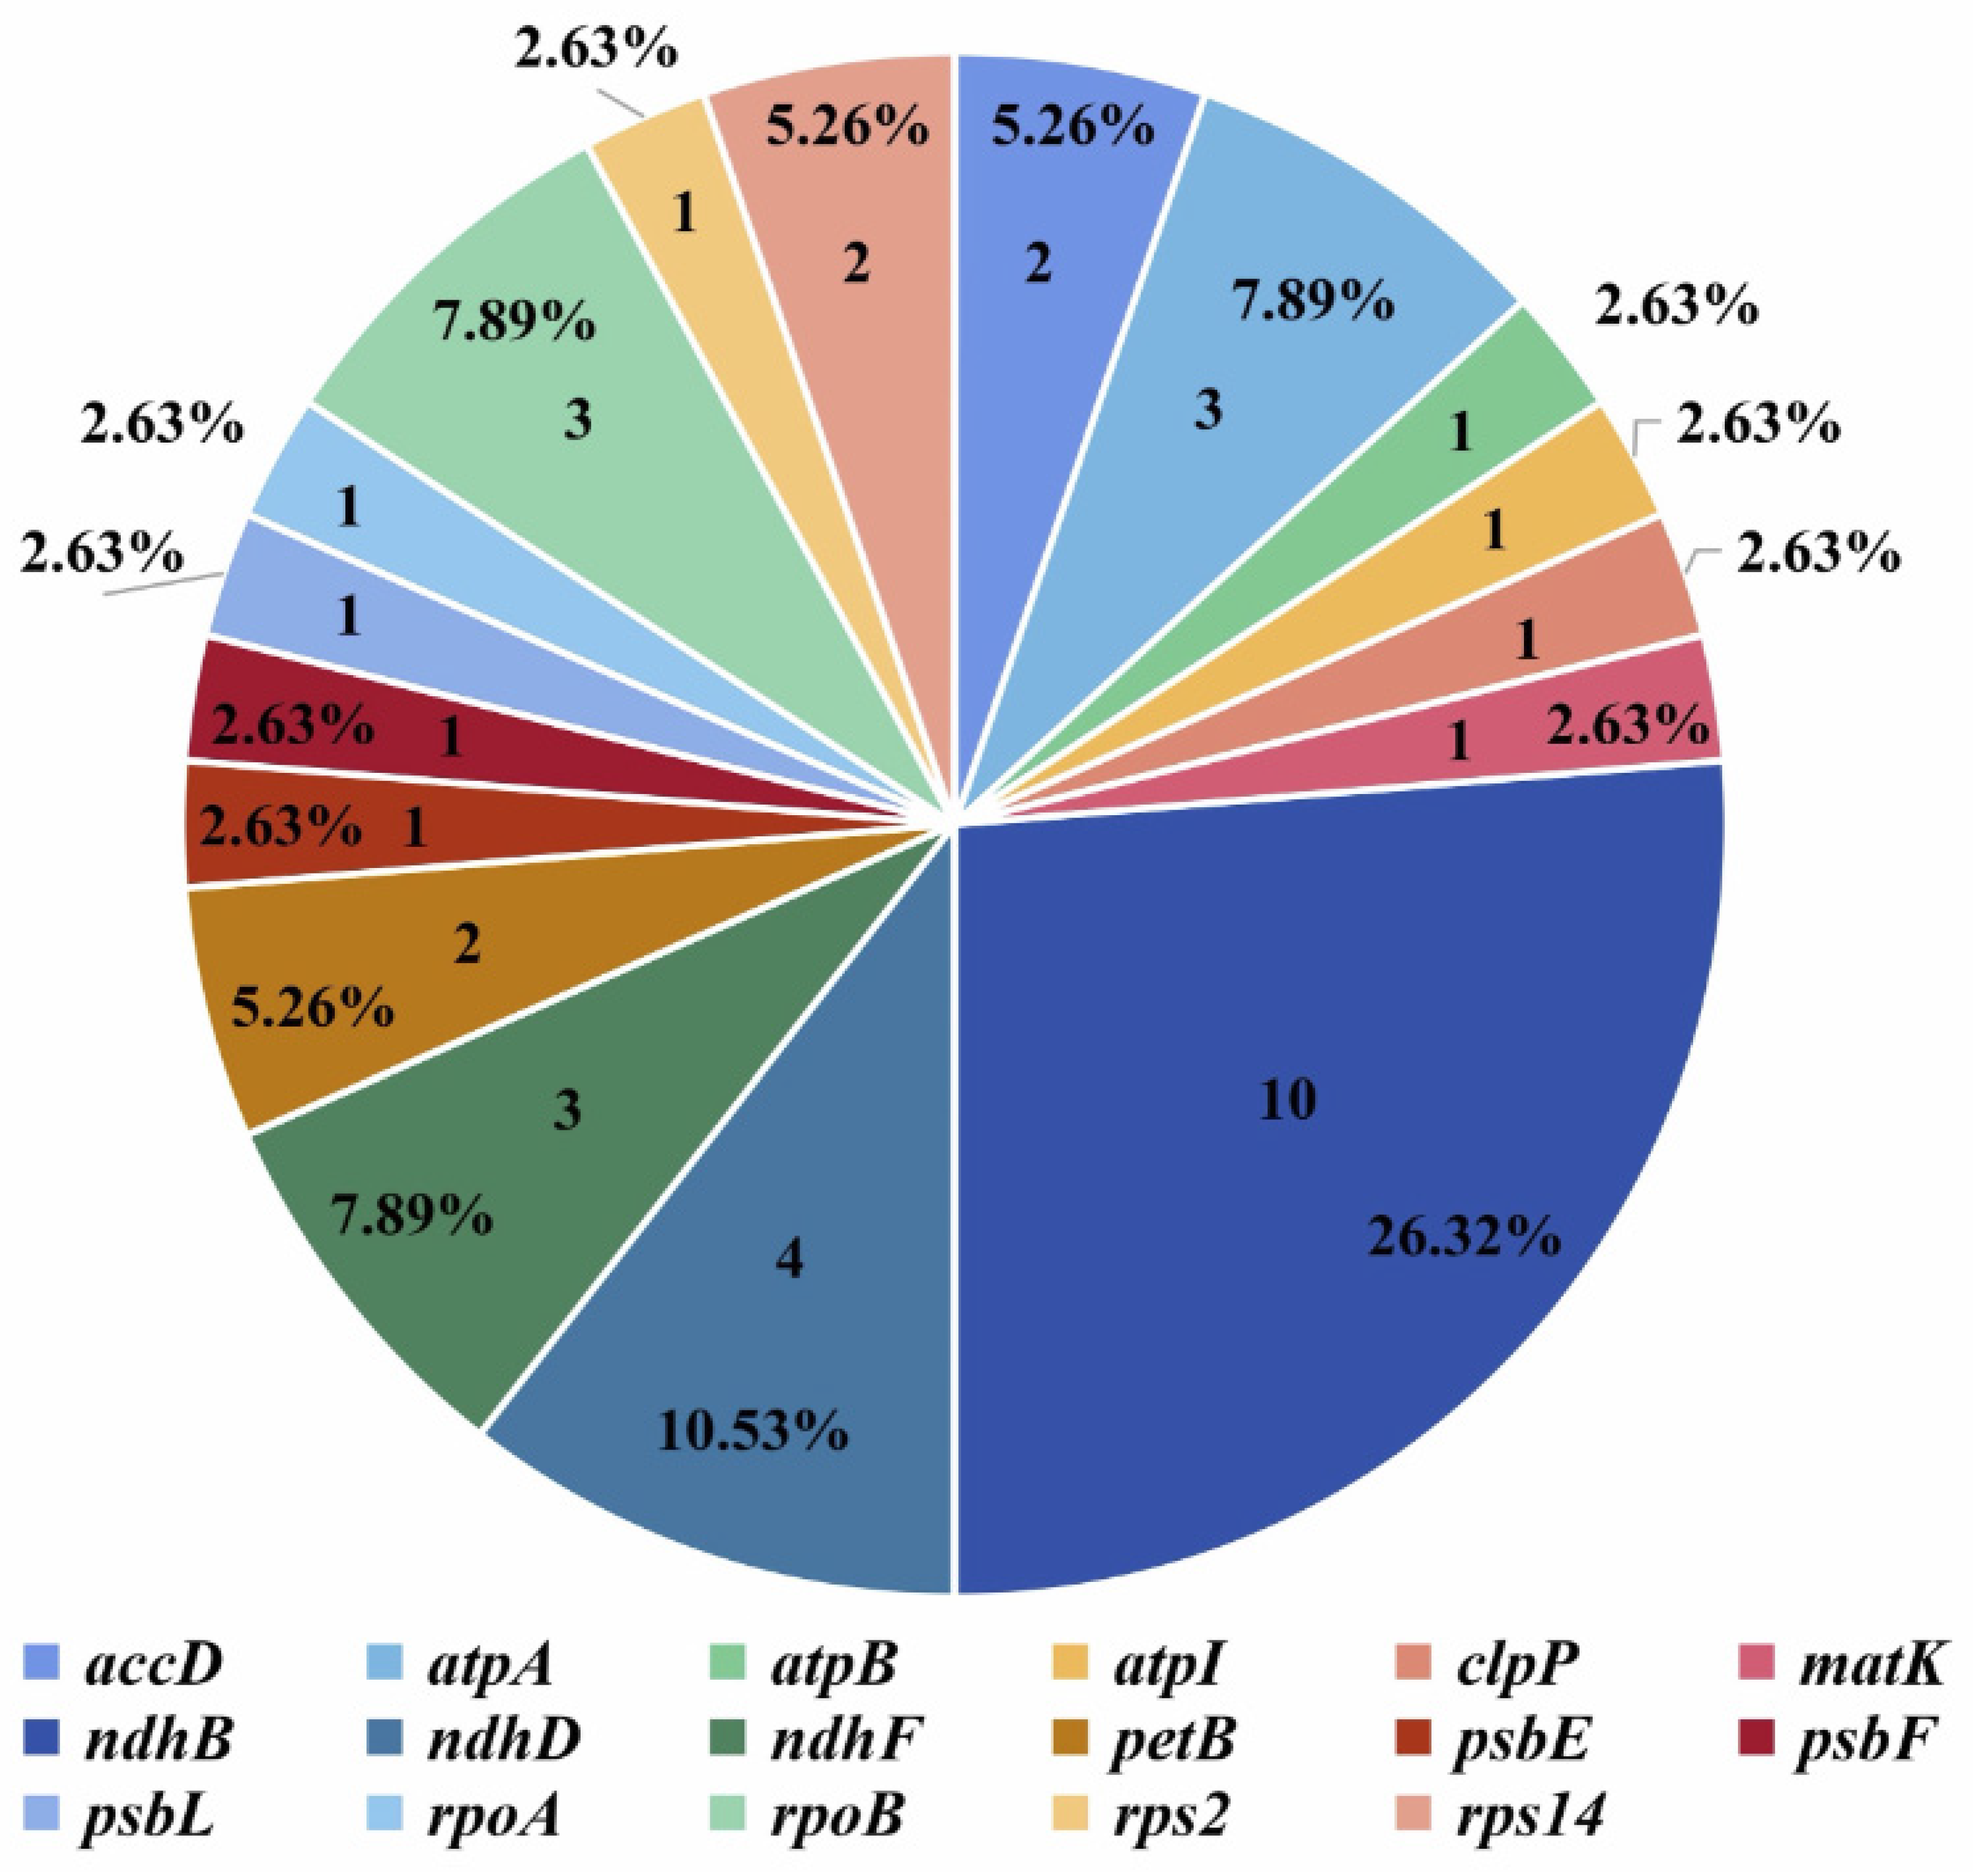
The three P. fortuneana chloroplast genomes (one accession with the red flower phenotype and two accessions with the white flower phenotype) shared the same 38 potential RNA editing sites, which were distributed on 17 PCGs associated with NADH-dehydrogenase (ndhB, ndhD, and ndhF), ATP synthase (atpA, atpB, and atpI), photosystem II (psbE, psbF, and psbL), the small subunit of ribosome (rps2 and rps14), RNA polymerase subunits (rpoA and rpoB), subunits of cytochrome (petB), and other functional genes (clpP, accD, and matK) (Figure 5, Table S4). Among these genes, the gene ndhB had the highest number of RNA editing sites (10 sites), followed by genes ndhD (four sites), ndhF (three sites), rpoB (three sites), atpA (three sites), accD (two sites), petB (two sites), and rps14 (two sites), while all the others had only one RNA editing site (Figure 5). The conversion of these sites was all from “C” to “T”, and most of the converted sites occurred in the second base of the codon, accounting for 76.31% of all sites (29/38). Of 38 RNA editing sites, the most frequent conversion of RNA editing sites was from TCA (serine) to TTA (leucine) (13), followed by CCA (proline) to CTA (leucine) (6), CTT (serine) to TCA (phenylalanine) (4), CAT (histidine) to TAT (tyrosine) (3) (Table S4). Correspondingly, the most frequent conversion of amino acids was from serine to leucine (15), followed by proline to leucine (7), serine to phenylalanine (5), and histidine to tyrosine (4) (Table S4).

3.4. Selection Pressure

The selection pressure analysis revealed that no CDSs across all six Pyracantha chloroplast genomes experienced positive selection (dN/dS ratio > 1), while at least 10 CDSs, mainly involved in NADH-dehydrogenase (ndhD, ndhF, and ndhH), ATP synthase (atpI), photosystem II (psbM), RNA polymerase subunits (rpoC1), small subunit of ribosome (rps18), and other functional genes (ccsA, matK, and rbcL) had at least one site under purifying selection (Table 4), thus presumably had conserved function. In addition, a total of 42 neutral selected sites (dN/dS ratio = 1) were identified in 27 CDSs, most of which were involved in NADH-dehydrogenase (five genes, 12 sites), RNA polymerase subunits (two genes, three sites), the small subunit of ribosome (four genes, four sites), the large subunit of ribosome (three genes, three sites), photosystem II (three genes, three sites), subunits of cytochrome (two genes, three sites), photosystem I (one genes, three sites), ATP synthase (one gene, two sites) (Table S6).

3.5. SSRs and Highly Divergent Regions

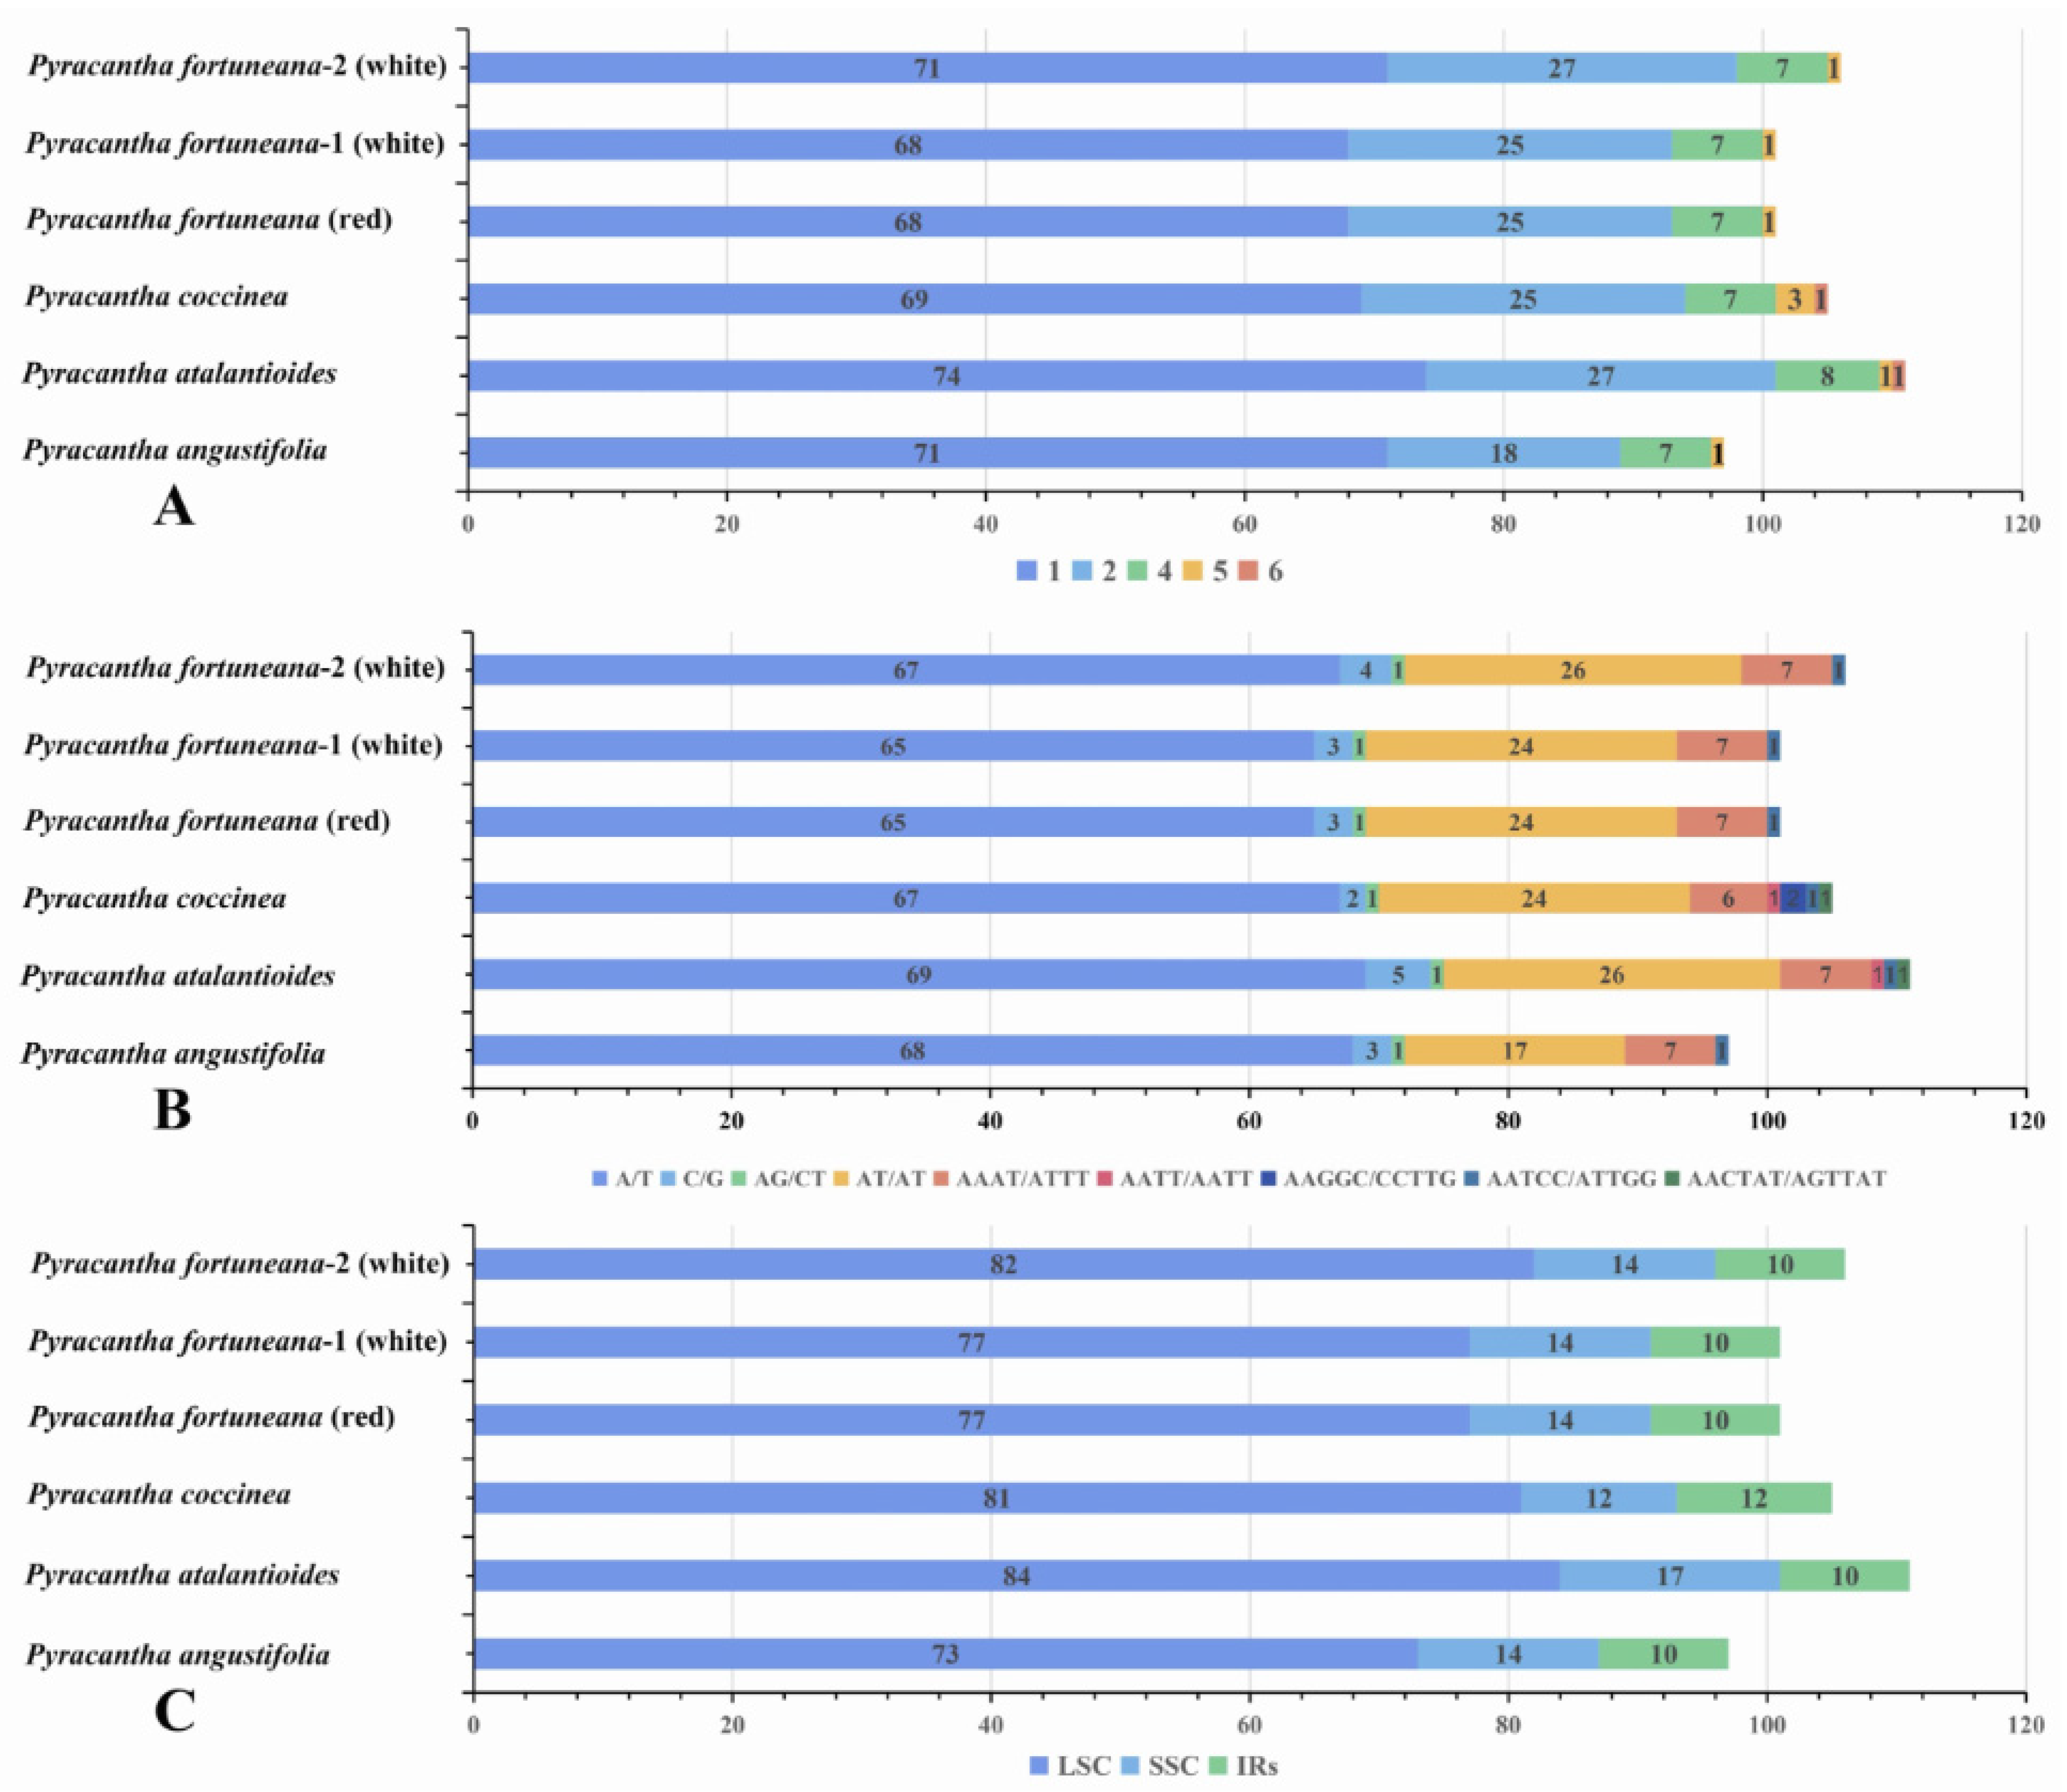
A total of 101 SSRs were identified in the chloroplast genome of P. fortuneana (red), including 68 mononucleotides (67.33%), 25 dinucleotides (24.75%), seven tetranucleotides (6.93%), and one pentanucleotide (0.99%) (Figure 6A, Table S5). The most common motifs found in this chloroplast genome were A/T (95.6%) for mono-, AT/AT (100%) for dinucleotides, while pentanucleotides and hexanucleotides were rarely observed in the chloroplast genome of P. fortuneana (red) (Figure 6A,B). Within P. fortuneana, P. fortuneana-2 (white) harbored more mononucleotides and dinucleotides than P. fortuneana (red) and P. fortuneana-1 (white) in the LSC regions (Figure 6A–C). At the inter-species level, P. atalantioides contained the most SSRs, followed by P. fortuneana-2 (white), P. coccinea, P. fortuneana-1 (white), and P. fortuneana (red), while P. angustifolia contained the least (Figure 6A–C, Table S5).
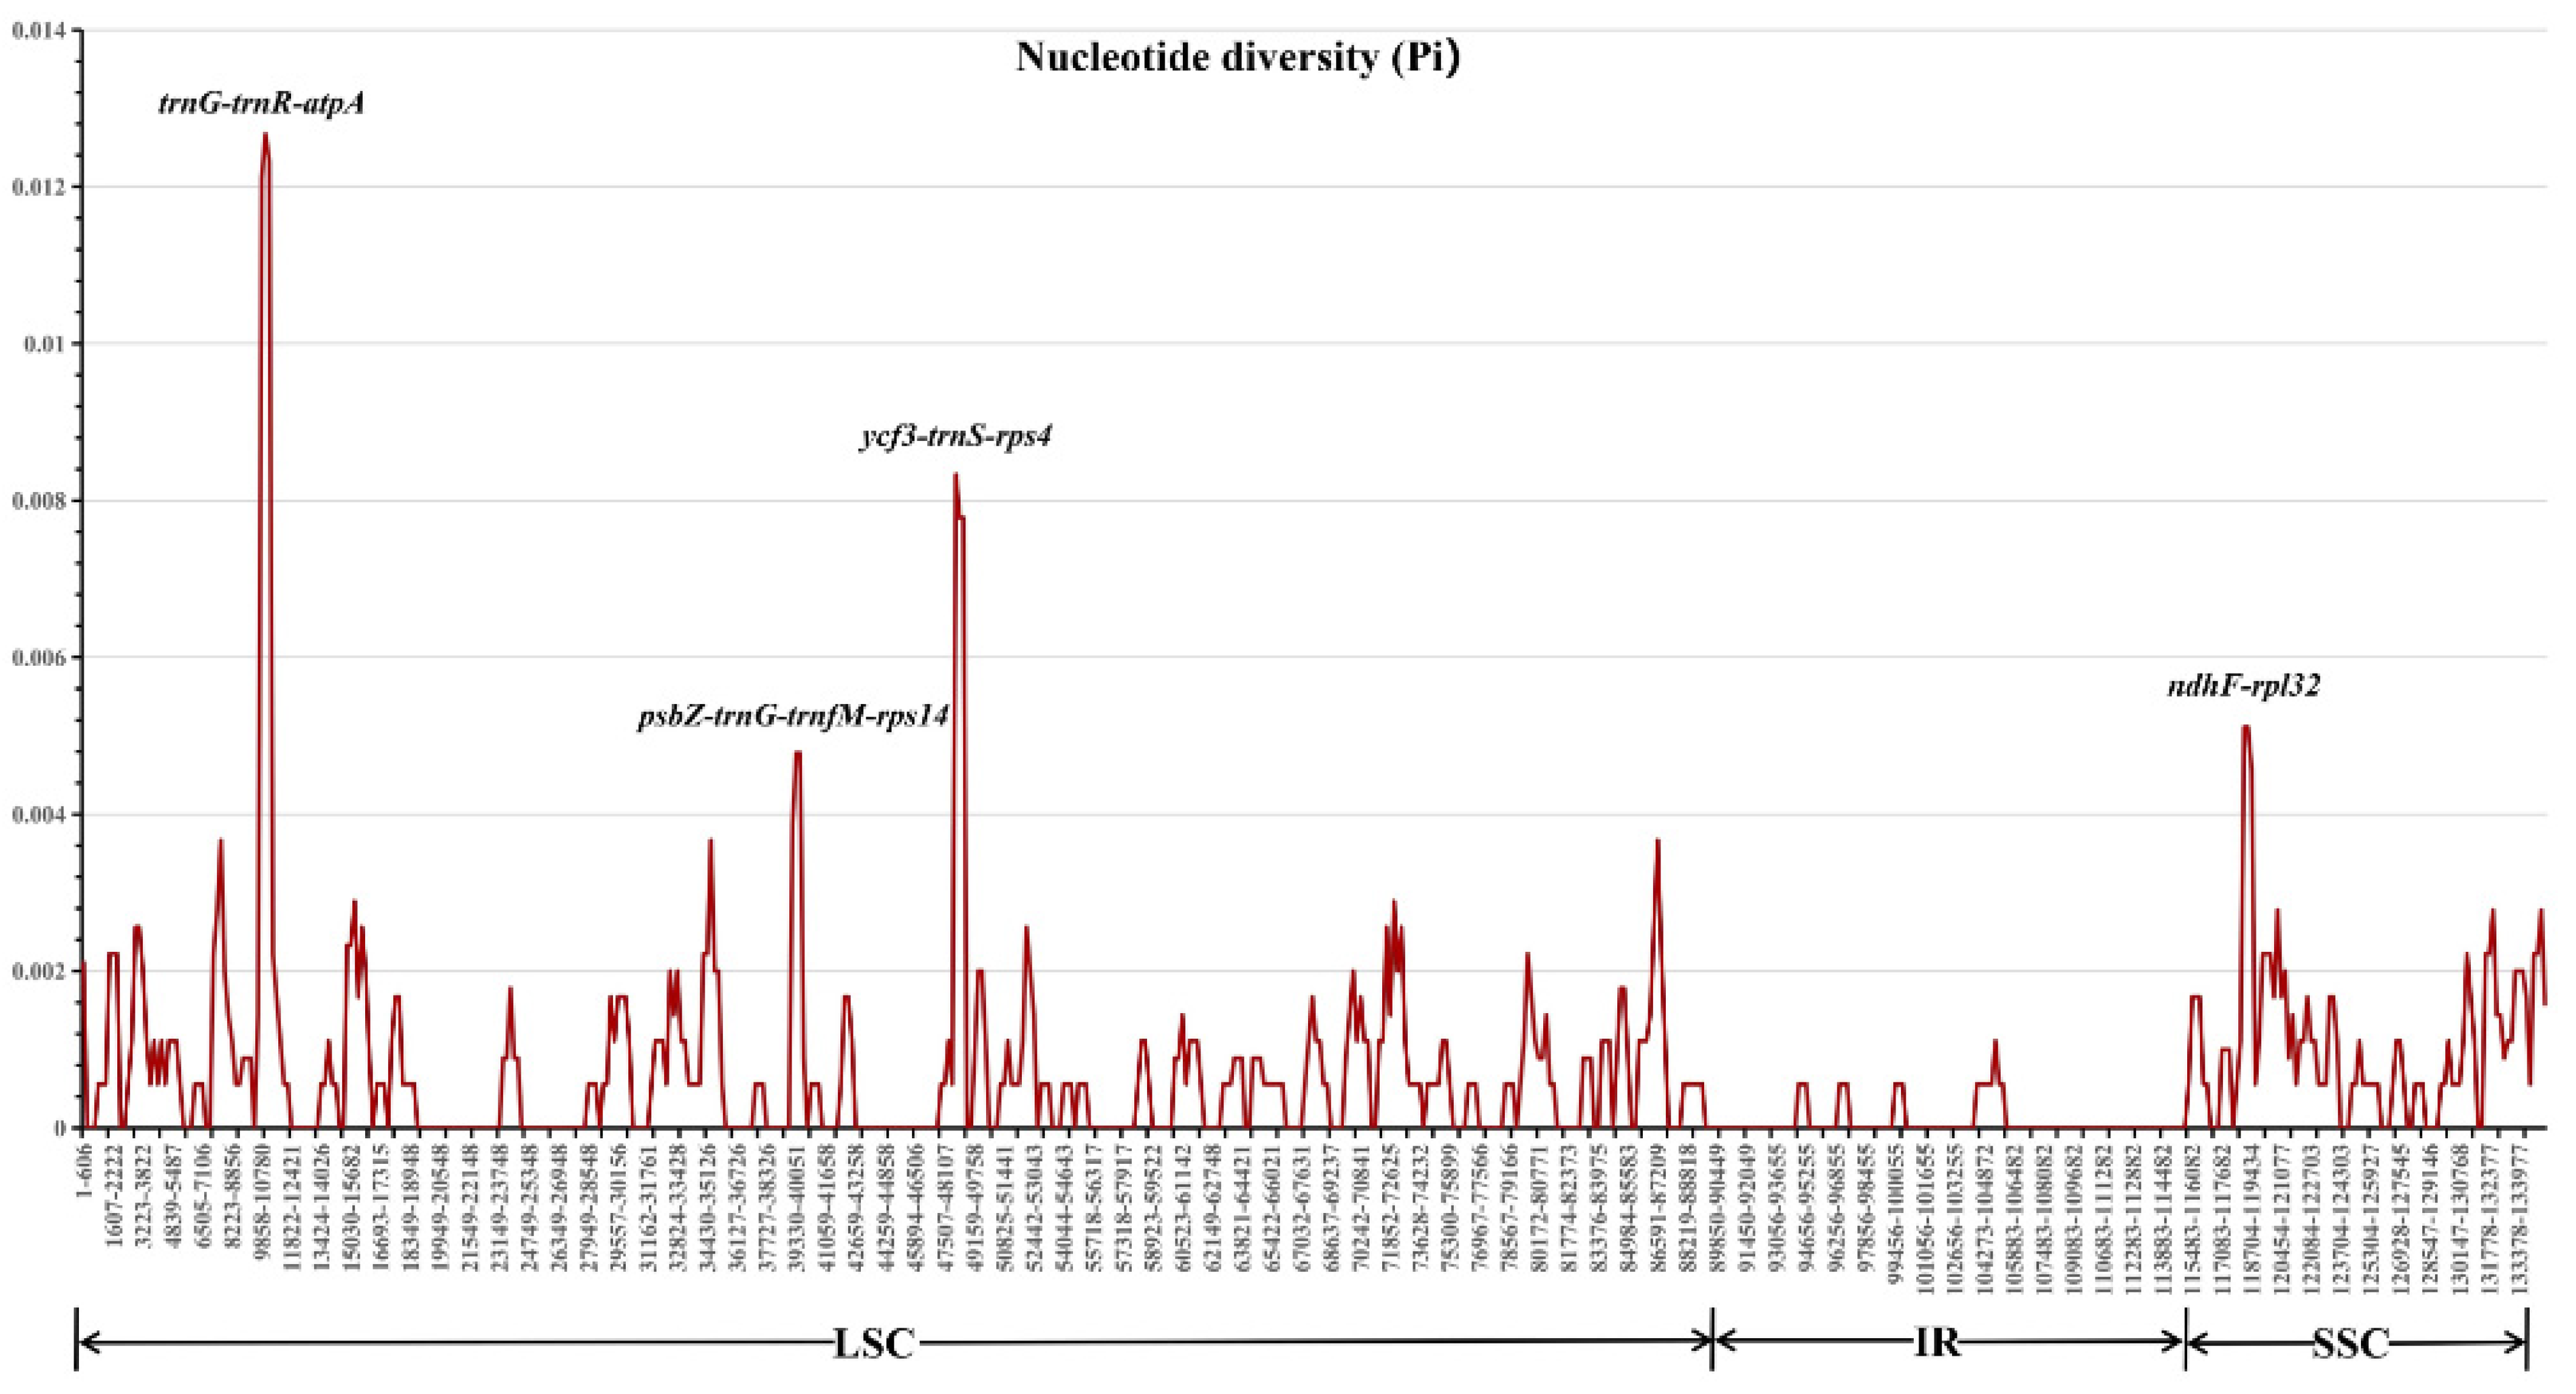
The nucleotide diversity (Pi) for each sliding window was calculated to detect highly variable regions of Pyracantha chloroplast genomes. The Pi values for each window varied from 0 to 0.01267, with an average value of 0.00068. The LSC (average Pi = 0.00077) and SSC (average Pi = 0.00108) regions displayed higher sequence divergences than the IR (average Pi = 0.00008) regions (Figure 7). A total of four highly variable regions, i.e., trnG-trnR-atpA, psbZ-trnG-trnfM-rps14, ycf3-trnS-rps4, and ndhF-rpl32 with Pi > 0.004 were detected (Figure 7), which could be used as DNA barcodes in this genus. Among these highly variable regions, ycf3-trnS-rps4 can be expected to successfully distinguish individuals with the red flower phenotype from those with the white flower phenotype.

3.6. Genetic Distance

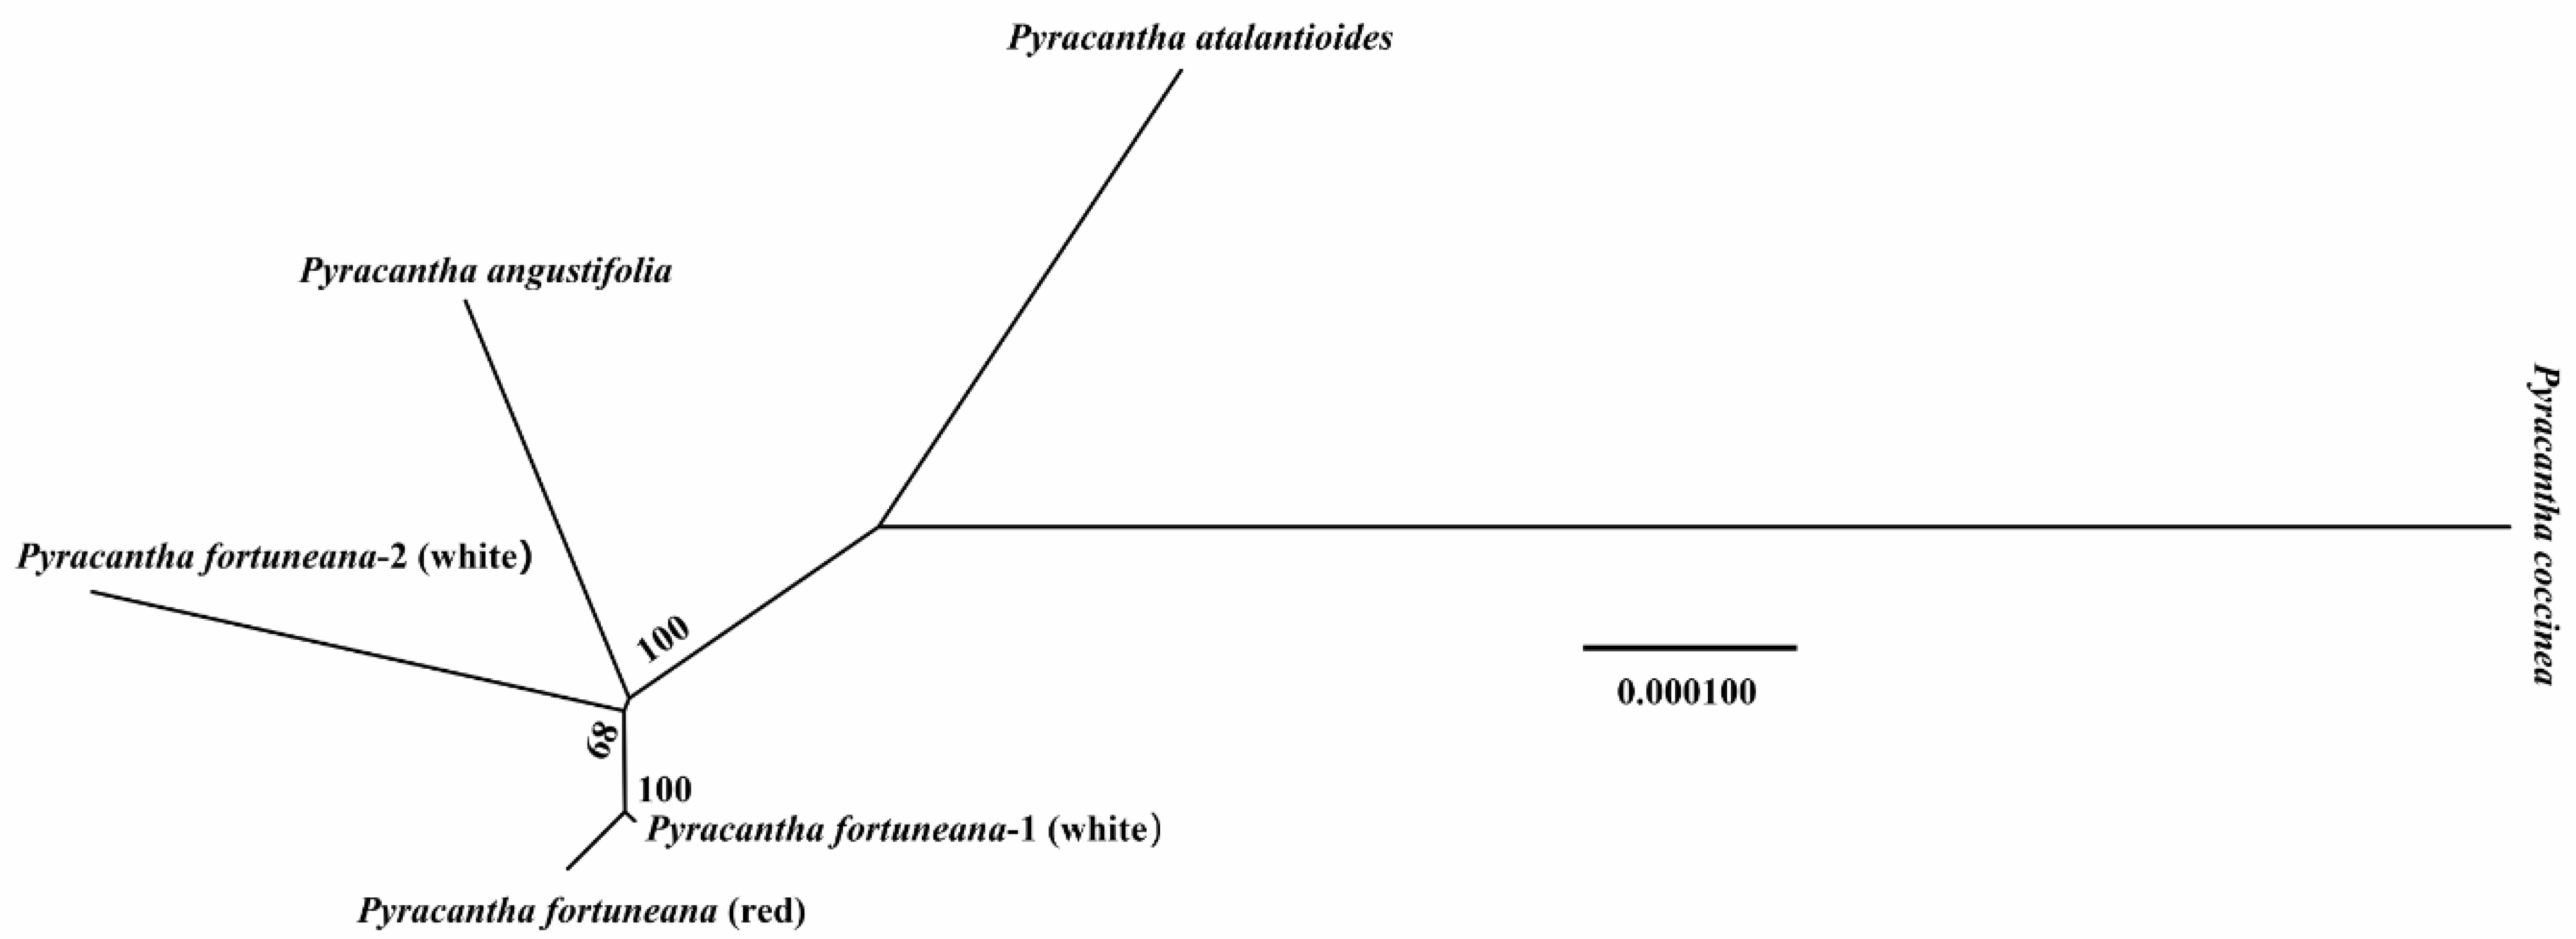
AMOVA analysis revealed that there was almost no genetic difference among three P. fortuneana individuals (two flower color phenotype) and between Pyracantha two species (P. fortuneana and P. angustifolia). The genetic differences mainly occurred between P. coccinea and the rest of five Pyracantha individuals (Table 5). Furthermore, the visualized neighbor-joining tree also showed that the genetic distances were short among three P. fortuneana individuals and between P. fortuneana and P. angustifolia, while longer genetic distances were observed between P. coccinea and five other Pyracantha individuals (Figure 8).

3.7. Phylogenetic Relationships

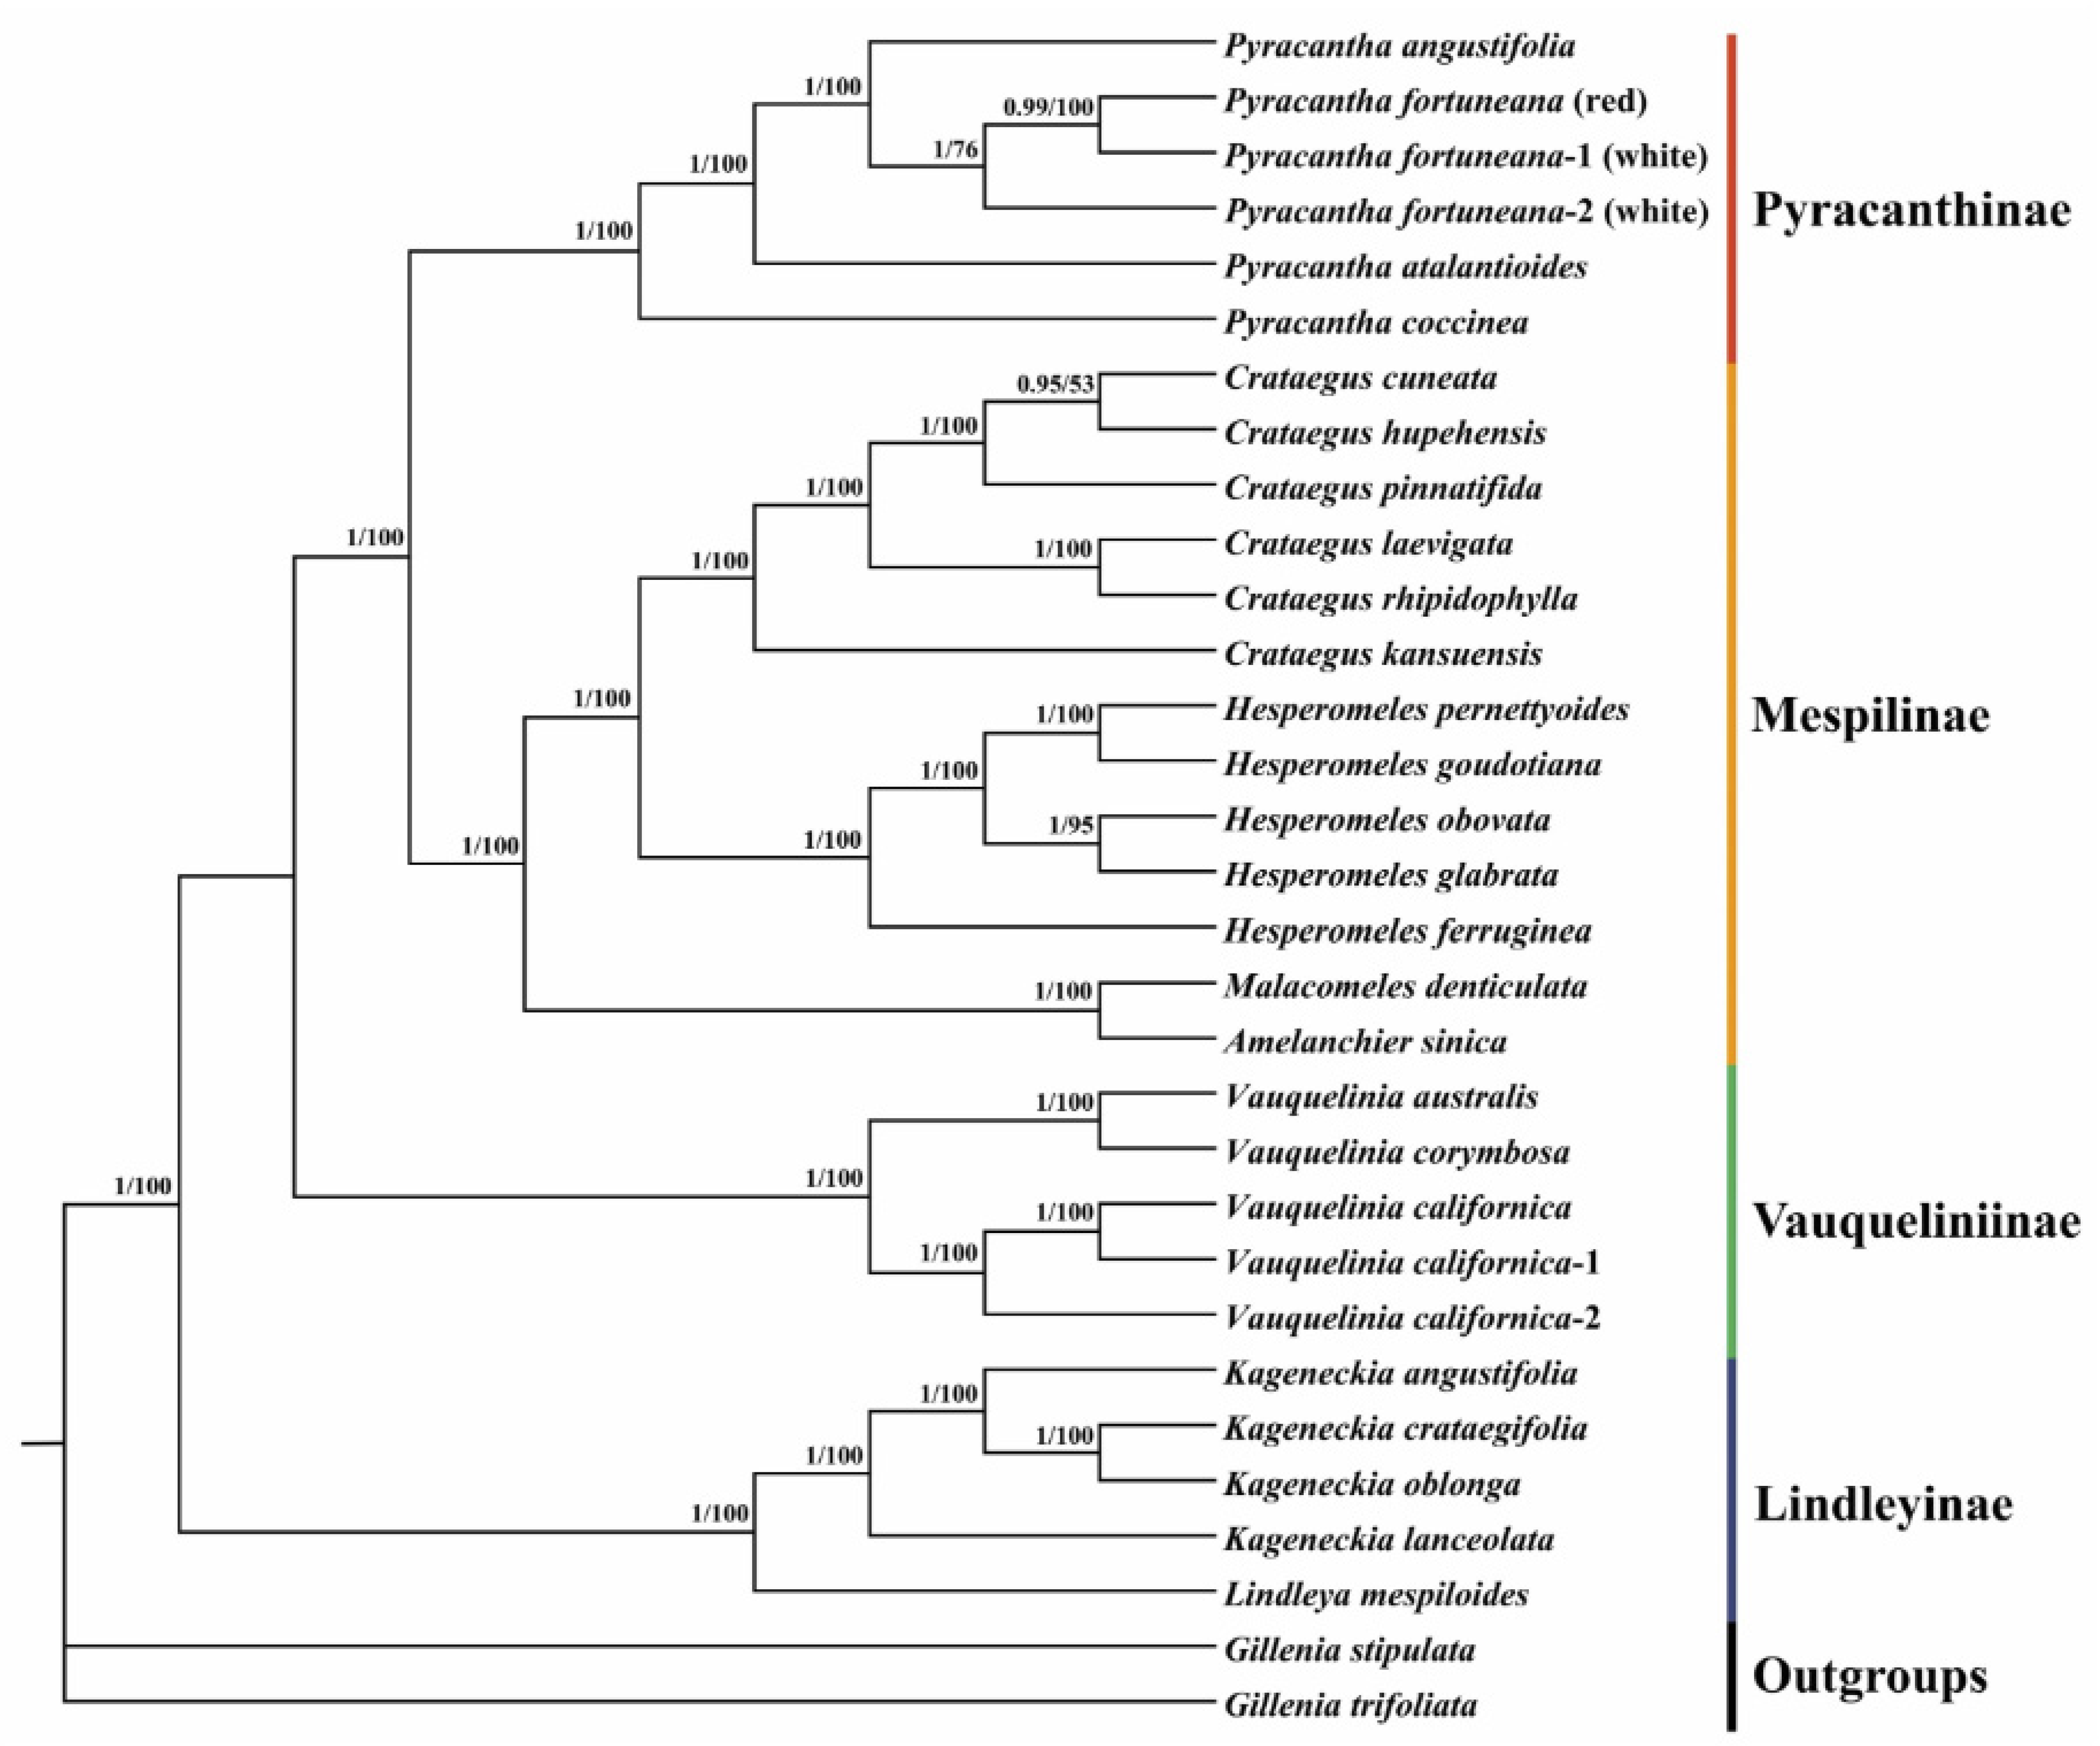
The phylogenetic tree based on chloroplast genome sequences strongly supported that the genus Pyracantha was monophyletic and was also the only genus in the subtribe Pyracanthinae. This genus was further recovered as sister to the subtribe Mespilinae, comprising the genera Crataegus, Hesperomeles, Amelanchier, and Malacomeles. Within Pyracantha, the accession with the red flower phenotype of P. fortuneana (P. fortuneana (red)) was nested within the accessions with the white flower phenotype (P. fortuneana (white)), rather than formed a sister relationship to P. fortuneana (white) (Figure 9). Phylogenetic relationships within the genus Pyracantha and among the members of the tribe Maleae of Rosaceae inferred from ITS sequences (Figure S3) were highly similar to those inferred from chloroplast genome sequences.

4. Discussion

4.1. Chloroplast Genome Features

Chloroplast genomes within a species are highly conserved in terms of genomic structure, gene content, gene order, and GC content [50,51], with P. fortuneana being no exception in this regard. All three individuals of P. fortuneana (two flower phenotypes) possessed the typical quadripartite structure of land plant chloroplast genomes, with a pair of IR regions (26,350–26,355 bp) separating LSC (88,316–88,393 bp) and SSC (19,344–19,348 bp) regions, and encoded 113 identical unique genes, including 79 PCGs, 30 tRNAs, and four rRNAs (Figure 2, Table 1 and Table 2). All three chloroplast genomes also shared the same overall GC content (36.5%), higher than that in LSC (34.1%) and SSC (30.4%) regions, but lower than that in IR regions (42.7%) (Table 1), likely due to the high GC content of the four rRNAs. The high GC content in IR regions may also contribute to the stability of their chloroplast genomes [52,53,54]. Moreover, the location of the IR/SC boundaries were nearly identical either within P. fortuneana or in comparison to P. atalantioides, P. coccinea, and P. angustifolia, and no gene arrangements were detected in Pyracantha chloroplast genomes (Figure 3 and Figure S3). At a broader taxonomic scale, the genome size, GC content, and gene number of Pyracantha chloroplast genomes also resembled those of previously published Maleae species [55,56]. As an example, the gene for the translation initiation factor, infA, which was found to be lost in Pyracantha chloroplast genomes, was also widely absent in the chloroplast genomes of the tribe Maleae and Fabaceae and may have been transferred to the nuclear genome or replaced with other related genes [57].
RNA editing is a post-transcriptional process on the target transcripts by base insertion, deletion, or replacement [58]. It mainly occurs in chloroplast and mitochondrial genomes, and the number of editing sites varies in terrestrial plants [59]. In this study, however, the RNA editing sites and codon usage bias were completely identical not only between red and white flower phenotypes of P. fortuneana but also even among Pyracantha species (Figure 4 and Figure 5), strongly supporting the functional conservation of RNA editing and translation in Pyracantha chloroplast genomes. In addition, the ratio of nonsynonymous to synonymous substitutions (dN/dS) has been widely applied to evaluate the selection pressure sites and nucleotide evolution rates in coding sequences [60]. It is worth noting that only purifying and neutral selected sites were detected in Pyracantha chloroplast genomes (Table 4 and Table S6), indicating the conserved functions of these chloroplast genes in their evolutionary history [61]. Together, these findings provided further evidence on the conserved nature of Pyracantha chloroplast genomes.
Comparative chloroplast genome analyses revealed that most of the sequence variations were found in the LSC and SSC regions, while the IR regions exhibited comparatively fewer sequence variations (Figure 7). The lower sequence divergence was observed in the IRs than the LSC and SSC regions, which may be due to copy correction between IR sequences by gene conversion [61]. Furthermore, a total of four highly variable regions, i.e., trnG-trnR-atpA, psbZ-trnG-trnfM-rps14, ycf3-trnS-rps4, and ndhF-rpl32 (Pi > 0.004) (Figure 7) identified in this study could be served as molecular markers for future phylogenetic, population genetic and phylogeographic studies of Pyracantha.

4.2. Morphology, Phylogeny, and Taxonomy of the Red Flower Phenotype of P. fortuneana

Morphologically, the red flower phenotype of P. fortuneana is evergreen or semi-evergreen shrubs (mature leaves turn red in winter), up to 3 m tall. Lateral branches are short, and their apex is thornlike. Young branchlets are densely rusty pubescent, and mature branchlets are dark brown and glabrous. Buds are small and cover pubescent in the outer. Leaves mainly grow on the short branches, and petioles are glabrous or slightly pubescent when young. Leaf blades are obovate or obovate-oblong and glabrous in both surfaces, 1.5–5.5 cm long, 0.5–2 cm wide. Leaf base is cuneate to wide round, and the serrations of leaf margin are conspicuous or inconspicuous. Leaf apex is obtuse or emarginate. Dense flowers are clustered into loose compound corymbs, ca. 25 cm in diameter. Peduncles are nearly glabrous and caducous bracts are lanceolate. Pedicels are nearly glabrous, ca. 1 cm long. The color of flowers is red to pink, ca. 1 cm in diameter. Calyx tubes are campanulate and their outer surfaces are glabrous. Sepals are triangular to triangular-ovate and glabrous, 1–1.5 mm long, with entire margin and blunt apex. Petals are red to pink and nearly round, ca. 4 × 3 mm long, and apex is rounded or blunt. Stamens are 20 and filaments are red to pink, 3–4 mm long. Ovaries are densely white pubescent on the upper part and styles are red to pink, 3–4 mm long. Pome is orange-red to dark red and subglobose, ca. 5 mm long. Fruit pedicels are short, 2–5 mm long. Sepals are persistent in fruit apex and erect. The florescence is from April to May, and the fruiting period is from August to November [1,3].
Although P. fortuneana individuals with the red flower phenotype can be conspicuously distinguished from those with the white flower phenotype, by their pink to red floral parts, including inner sepals, petals, styles and filaments, and red mature leaves (Figure 1, Table 6), most vegetative morphological traits between red and white flower phenotype individuals are always the same. For example, both of them have short, thornlike lateral branches, rusty-pubescent young branchlets, dark brown and glabrous mature branchlets, obovate or obovate-oblong leaf blades, short, glabrous and pubescent petioles [1,3,13]. Although Wang [17] proposed that P. fortuneana individuals with the red flower phenotype appear to have a wide round leaf base and conspicuous serrations, different from the characteristics of cuneate leaf base and inconspicuous serrations in individuals with the white flower phenotype, our field observations showed that the red flower phenotype individuals also harbored the above traits in white flower phenotype individuals (Figure 1). Thus, except for flower color, individuals with these two flower phenotypes are not clearly distinguished. Furthermore, in terms of geographical distribution, P. fortuneana individuals with the red flower phenotypes were only found in the Enshi Tujia and Miao Autonomous Prefecture, western Hubei, China, and have a scatted distribution in thickets, stream sides, and roadsides at altitudes of 750–1500 m, mixed with the white flower phenotype individuals. Precisely because red and white phenotypes individuals shared the same habitat, we ruled out the possibility of the elements of calcium and phosphorus causing the difference in flower color [62,63].
Phylogenetically, chloroplast genome and ITS trees are identical, both of which strongly supported the monophyly of the species P. fortuneana, and P. fortuneana (red) was nested within P. fortuneana (white) (Figure 9 and Figure S3), undoubtedly supporting that the red flower phenotype of P. fortuneana should belong to the species of P. fortuneana. Moreover, comparative chloroplast genome analyses between red and white flower phenotypes of P. fortuneana also revealed there is a very close genetic relationship between them. Based on above evidence, we thus suggested that the red flower phenotype of P. fortuneana could be recognized as a rare phenotype resource of this species, conforming to the initial view of the first discoverer [17], or be considered as a new forma.

4.3. Limitations and Future Directions

In conclusion, the findings obtained in this study will not only provide new insights into chloroplast genome evolution and phylogeny of Pyracantha, and the taxonomic status of red flower phenotype of P. fortuneana, but also be useful for breeding, cultivation and utilization of this economically important species. However, at least two limitations of our study should be acknowledged. First, current sampling is too sparse for the red flower phenotype of P. fortuneana (only one individual), thus additional sampling is needed to resolve intra-specific relationships and to evaluate how well species delimitations based primarily on morphology coincide with chloroplast genome lineages. Second, although previous studies have reported that flower color in Rosaceae is mainly attributed to anthocyanin accumulation, and controlled by the transcription factor classes of MYB, bHLH, and WD40, e.g., [64,65], the genomic/genetic data currently available for these two flower phenotypes of P. fortuneana are inadequate to uncover the exact molecular mechanism underlying the flower color variations in this species. Thus, the family classic genetic techniques, along with transcriptome profiling, gene expression and population genetic data and/or approaches, are needed to identify putative loss-of-function mutations and/or gene expression changes that generate rare, red flowers instead of the common, white color in P. fortuneana. Finally, it is also worth emphasizing that within-population flower color variation is relatively uncommon, the population of P. fortuneana from the Enshi Tujia and Miao Autonomous Prefecture, western Hubei, China provides an ideal system to explore the possible mechanisms that maintain flower color variation within populations, which will be useful in understanding fundamental evolutionary processes that create and maintain trait variation [66].

Supplementary Materials

The following supporting information can be downloaded at: https://www.mdpi.com/article/10.3390/genes13122404/s1, Figure S1: Synteny comparison among the chloroplast genomes of P. fortuneana and three other Pyracantha species. The colored blocks outside the sequences refer to the score/max bit core ration, with red > 0.75, orange > 0.50, green > 0.25, and blue ≤ 0.25. Figure S2: The structural rearrangement analysis of six Pyracantha chloroplast genomes using the mauve multiple alignment algorithm. Figure S3: The phylogenetic tree of the genus Pyracantha based on 30 nrDNA ITS sequences using both ML and BI methods. The BI posterior probabilities / ML bootstrap values are displayed above the lines (“-” stands for the value less than 0.5/50). Table S1: Sample list of chloroplast genomes used in this study. Table S2: Sample list of rDNA ITS sequences used in this study. Table S3: The codon number in six Pyracantha chloroplast genomes. Table S4: List of the potential RNA editing sites in the chloroplast protein-coding genes of P. fortuneana (red) and two individuals of P. fortuneana (white). Table S5: Summary of SSRs in six Pyracantha chloroplast genomes. Table S6: The neutral selected sites detected in the 78 CDSs of six Pyracantha chloroplast genomes.

Author Contributions

Conceptualization, R.-S.L.; methodology, S.-X.D. and R.-S.L.; software, J.-C.L., K.H., Z.-J.H. and S.-X.D.; validation, J.-C.L., K.H. and Z.-J.H.; formal analysis, K.H.; resources, S.-X.D.; data curation, S.-X.D.; writing—original draft preparation, S.-X.D.; writing—review and editing, R.-S.L.; funding acquisition, R.-S.L. All authors have read and agreed to the published version of the manuscript.

Funding

This research was funded by the Jiangsu Innovative and Enter-preneurial Talent Programme (JSSCBS20211311), the Jiangsu Key Laboratory for the Research and Utilization of Plant Resources (JSPKLB202206), and the Jiangsu Institute of Botany Talent Fund (JIBTF202102).

Institutional Review Board Statement

Not applicable.

Informed Consent Statement

Not applicable.

Data Availability Statement

The chloroplast genome sequence and rDNA ITS sequence of P. fortuneana (red) can be found in the GenBank (https://www.ncbi.nlm.nih.gov/genbank/) under accession numbers OM793283 and OP821228, respectively. Raw Illumina data were deposited at NCBI SRA (no. SRR21976475).

Acknowledgments

We gratefully acknowledge helpful comments from Fredrick Munyao Mutie and anonymous reviewers on earlier versions of this manuscript.

Conflicts of Interest

The authors declare no conflict of interest.

References

  1. Yu, D.J.; Jiang, W.F. Rosaceae. In Flora Reipublicae Popularis Sinicae, 2nd ed.; Yu, D.J., Ed.; Science Press: Beijing, China, 1974; Volume 3, pp. 179–186. [Google Scholar]
  2. Govaerts, R.; Lughadha, E.N.; Black, N.; Turner, R.; Paton, A. The world checklist of vascular plants, a continuously updated resource for exploring global plant diversity. Sci. Data 2021, 8, 215. [Google Scholar] [CrossRef] [PubMed]
  3. Gu, C.Z.; Stephen, A.S. Rosaceae. In Flora of China, 2nd ed.; Wu, Z.Y., Raven, P.H., Eds.; Science Press: Beijing, China; Missouri Botanical Garden Press: St. Louis, MI, USA, 2003; Volume 9, pp. 108–111. [Google Scholar]
  4. Morgan, D.R.; Soltis, D.E.; Robertson, K.R. Systematic and evolutionary implications of rbcL sequence variation in Rosaceae. Am. J. Bot. 1994, 81, 890–903. [Google Scholar] [CrossRef]
  5. Potter, D.; Eriksson, T.; Evans, R.C.; Oh, S.; Smedmark, J.E.E.; Morgan, D.R.; Kerr, M.; Robertson, K.R.; Arsenault, M.; Dickinson, T.A.; et al. Phylogeny and classification of Rosaceae. Plant Syst. Evol. 2007, 266, 5–43. [Google Scholar] [CrossRef]
  6. Liu, B.; Ye, J.F.; Liu, S.; Wang, Y.; Yang, Y.; Lai, Y.J.; Zeng, G.; Lin, Q. Families and genera of Chinese angiosperms: A synoptic classification based on APG III. Biodivers. Sci. 2015, 23, 225–231. [Google Scholar] [CrossRef]
  7. Chen, Z.D.; Lu, A.M.; Liu, B.; Ye, J.F. Tree of Life for Chinese Vascular Plants; Science Press: Beijing, China, 2020. [Google Scholar]
  8. Li, D.Z. The Families and Genera of Chinese Vascular Plants; Science Press: Beijing, China, 2020. [Google Scholar]
  9. Liu, B.B.; Hong, D.Y.; Zhou, S.L.; Xu, C.; Dong, W.P.; Johnson, G.; Wen, J. Phylogenomic analyses of the Photinia complex support the recognition of a new genus Phippsiomeles and the resurrection of a redefined Stranvaesia in Maleae (Rosaceae). J. Syst. Evol. 2019, 57, 678–694. [Google Scholar] [CrossRef] [Green Version]
  10. Liu, B.B.; Liu, G.N.; Hong, D.Y.; Wen, J. Eriobotrya belongs to Rhaphiolepis (Maleae, Rosaceae): Evidence from chloroplast genome and nuclear ribosomal DNA data. Front. Plant Sci. 2019, 10, 1731. [Google Scholar] [CrossRef] [Green Version]
  11. Liu, B.B.; Campbell, C.S.; Hong, D.Y.; Wen, J. Phylogenetic relationships and chloroplast capture in the Amelanchier-Malacomeles-Peraphyllum clade (Maleae, Rosaceae): Evidence from chloroplast genome and nuclear ribosomal DNA data using genome skimming. Mol. Phylogenet. Evol. 2020, 147, 106784. [Google Scholar] [CrossRef]
  12. Liu, B.B.; Ren, C.; Kwak, M.; Hodel, R.G.; Xu, C.; He, J.; Zhou, W.B.; Huang, C.H.; Ma, H.; Qian, G.Z.; et al. Phylogenomic conflict analyses in the apple genus Malus s.l. reveal widespread hybridization and allopolyploidy driving diversification, with insights into the complex biogeographic history in the Northern Hemisphere. J. Integr. Plant Biol. 2022, 64, 1020–1043. [Google Scholar] [CrossRef]
  13. Lingyu, W.; Li, R.; Zhang, Q.; Jia, L.; Ting, T.; Ting, Z.; Wu, C.J.; Qiang, R.; Xufeng, P.; Peng, W. Pyracantha fortuneana (Maxim.) Li: A comprehensive review of its phytochemistry, pharmacological properties, and product development. Front. Sustain. Food Syst. 2022, 6, 940900. [Google Scholar]
  14. Zhao, C.F.; Li, S.; Song, G.H.; Yu, L.J.; Zhang, H. Extraction optimization approach to improve accessibility of functional fraction based on combination of total polyphenol, chromatographic profiling and antioxidant activity evaluation: Pyracantha fortuneana fruit as an example. J. Func. Foods 2013, 5, 715–728. [Google Scholar] [CrossRef]
  15. Han, W.Q.; Zhang, G.F. Study on nutritional components and antioxidant activity of total flavonoids in Pyracantha fruit. Agric. Sci. 2019, 9, 399–404. [Google Scholar]
  16. Chen, K.; Tan, Q.Q. Analysis of nutrient components of Pyracantha fruit. Chin. Food Saf. Mag. 2021, 15, 94–96. [Google Scholar]
  17. Wang, L.R. Red flower phenotype of Chinese firethorn was found in western Hubei. Life World 1987, 4, 2. (In Chinese) [Google Scholar]
  18. Neuhaus, H.E.; Emes, M.J. Nonphotosynthetic metabolism in plastids. Annu. Rev. Plant Physiol. Plant Mol. Biol. 2000, 51, 111–140. [Google Scholar] [CrossRef] [PubMed]
  19. Green, B.R. Chloroplast genomes of photosynthetic eukaryotes. Plant J. 2011, 66, 34–44. [Google Scholar] [CrossRef] [PubMed]
  20. Daniell, H.; Lin, C.S.; Yu, M.; Chang, W.J. Chloroplast genomes: Diversity, evolution, and applications in genetic engineering. Genome Biol. 2016, 17, 134. [Google Scholar] [CrossRef] [PubMed] [Green Version]
  21. Bendich, A.J. Circular chloroplast chromosomes: The grand illusion. Plant Cell 2004, 16, 1661–1666. [Google Scholar] [CrossRef] [PubMed] [Green Version]
  22. Li, X.; Yang, Y.; Henry, R.J.; Rossetto, M.; Wang, Y.; Chen, S. Plant DNA barcoding: From gene to genome. Biol. Rev. 2015, 90, 157–166. [Google Scholar] [CrossRef]
  23. Tonti-Filippini, J.; Nevill, P.G.; Dixon, K.; Small, I. What can we do with 1000 plastid genomes? Plant J. 2017, 90, 808–818. [Google Scholar] [CrossRef] [PubMed] [Green Version]
  24. Gitzendanner, M.A.; Soltis, P.S.; Yi, T.S.; Li, D.Z.; Soltis, D.E. Plastome phylogenetics: 30 years of inferences into plant evolution. Adv. Bot. Res. 2018, 85, 293–313. [Google Scholar]
  25. Wicke, S.; Naumann, J. Molecular evolution of plastid genomes in parasitic flowering plants. Adv. Bot. Res. 2018, 85, 315–347. [Google Scholar]
  26. Fu, C.N.; Wu, C.S.; Ye, L.J.; Mo, Z.Q.; Liu, J.; Chang, Y.W.; Li, D.Z.; Chaw, S.M.; Gao, L.M. Prevalence of isomeric plastomes and effectiveness of plastome super-barcodes in yews (Taxus) worldwide. Sci. Rep. 2019, 9, 2773. [Google Scholar] [CrossRef] [PubMed] [Green Version]
  27. Li, J.L.; Wang, S.; Yu, J.; Wang, L.; Zhou, S.L. A modified CTAB protocol for plant DNA extraction. Chin. Bull. Bot. 2013, 48, 72–78. [Google Scholar]
  28. Jin, J.J.; Yu, W.B.; Yang, J.B.; Song, Y.; DePamphilis, C.W.; Yi, T.S.; Li, D.Z. GetOrganelle: A fast and versatile toolkit for accurate de novo assembly of organelle genomes. Genome Biol. 2020, 21, 241. [Google Scholar] [CrossRef]
  29. Wick, R.R.; Schultz, M.B.; Zobel, J.; Holt, K.E. Bandage: Interactive visualization of de novo genome assemblies. Bioinformatics 2015, 31, 3350–3352. [Google Scholar] [CrossRef] [PubMed] [Green Version]
  30. Qu, X.J.; Moore, M.J.; Li, D.Z.; Yi, T.S. PGA: A software package for rapid, accurate, and flexible batch annotation of plastomes. Plant Methods 2019, 15, 50. [Google Scholar] [CrossRef] [PubMed] [Green Version]
  31. Tillich, M.; Lehwark, P.; Pellizzer, T.; Ulbricht-Jones, E.S.; Fischer, A.; Bock, R.; Greiner, S. GeSeq—Versatile and accurate annotation of organelle genomes. Nucleic Acids Res. 2017, 45, W6–W11. [Google Scholar] [CrossRef]
  32. Zheng, S.; Poczai, P.; Hyvonen, J.; Tang, J.; Amiryousefi, A. Chloroplot an online program for the versatile plotting of organelle genomes. Front. Genet. 2020, 11, 576124. [Google Scholar] [CrossRef]
  33. Kearse, M.; Moir, R.; Wilson, A.; Stones-Havas, S.; Cheung, M.; Sturrock, S.; Buxton, S.; Cooper, A.; Markowitz, S.; Duran, C.; et al. Geneious basic: An integrated and extendable desktop software platform for the organization and analysis of sequence data. Bioinformatics 2012, 28, 1647–1649. [Google Scholar] [CrossRef] [Green Version]
  34. Darling, A.C.; Mau, B.; Blattner, F.R.; Perna, N.T. Mauve: Multiple alignment of conserved genomic sequence with rearrangements. Genome Res. 2004, 14, 1394–1403. [Google Scholar] [CrossRef] [Green Version]
  35. Darzentas, N. Circoletto: Visualizing sequence similarity with Circos. Bioinformatics 2010, 26, 2620–2621. [Google Scholar] [CrossRef] [PubMed] [Green Version]
  36. Kumar, S.; Stecher, G.; Tamura, K. MEGA7: Molecular evolutionary genetics analysis version 7.0 for bigger datasets. Mol. Biol. Evol. 2016, 33, 1870–1874. [Google Scholar] [CrossRef] [PubMed] [Green Version]
  37. Mower, J.P. The PREP suite: Predictive RNA editors for plant mitochondrial genes, chloroplast genes and user-defined alignments. Nucleic Acids Res. 2009, 37, W253–W259. [Google Scholar] [CrossRef] [PubMed]
  38. Weaver, S.; Shank, S.D.; Spielman, S.J.; Li, M.; Muse, S.V.; Kosakovsky Pond, S.L. Datamonkey 2.0: A modern web application for characterizing selective and other evolutionary processes. Mol. Biol. Evol. 2018, 35, 773–777. [Google Scholar] [CrossRef] [Green Version]
  39. Edgar, R.C. MUSCLE: Multiple sequence alignment with high accuracy and high throughput. Nucleic Acids Res. 2004, 32, 1792–1797. [Google Scholar] [CrossRef] [Green Version]
  40. Talavera, G.; Castresana, J. Improvement of phylogenies after removing divergent and ambiguously aligned blocks from protein sequence alignments. Syst. Biol. 2007, 56, 564–577. [Google Scholar] [CrossRef] [Green Version]
  41. Zhang, D.; Gao, F.; Jakovlić, I.; Zou, H.; Zhang, J.; Li, W.X.; Wang, G.T. PhyloSuite: An integrated and scalable desktop platform for streamlined molecular sequence data management and evolutionary phylogenetics studies. Mol. Ecol. Resour. 2020, 20, 348–355. [Google Scholar] [CrossRef]
  42. Beier, S.; Thiel, T.; Munch, T.; Scholz, U.; Mascher, M. MISA-web: A web server for microsatellite prediction. Bioinformatics 2017, 33, 2583–2585. [Google Scholar] [CrossRef] [Green Version]
  43. Librado, P.; Rozas, J. DnaSP v5: A software for comprehensive analysis of DNA polymorphism data. Bioinformatics 2009, 25, 1451–1452. [Google Scholar] [CrossRef] [Green Version]
  44. Saitou, N.; Nei, M. The neighbor-joining method: A new method for reconstructing phylogenetic trees. Mol. Biol. Evol. 1987, 4, 406–425. [Google Scholar]
  45. Katoh, K.; Standley, D.M. MAFFT multiple sequence alignment software version 7: Improvements in performance and usability. Mol. Biol. Evol. 2013, 30, 772–780. [Google Scholar] [CrossRef] [PubMed] [Green Version]
  46. Kalyaanamoorthy, S.; Minh, B.Q.; Wong, T.K.F.; von Haeseler, A.; Jermiin, L.S. ModelFinder: Fast model selection for accurate phylogenetic estimates. Nat. Methods 2017, 14, 587–589. [Google Scholar] [CrossRef] [PubMed] [Green Version]
  47. Nguyen, L.T.; Schmidt, H.A.; von Haeseler, A.; Minh, B.Q. IQ-TREE: A fast and effective stochastic algorithm for estimating maximum-likelihood phylogenies. Mol. Biol. Evol. 2015, 32, 268–274. [Google Scholar] [CrossRef] [PubMed]
  48. Ronquist, F.; Teslenko, M.; Van Der Mark, P.; Ayres, D.L.; Darling, A.; Höhna, S.; Larget, B.; Liu, L.; Suchard, M.A.; Huelsenbeck, J.P. MrBayes 3.2: Efficient Bayesian phylogenetic inference and model choice across a large model space. Syst. Biol. 2012, 61, 539–542. [Google Scholar] [CrossRef] [PubMed] [Green Version]
  49. Stover, B.C.; Muller, K.F. TreeGraph 2: Combining and visualizing evidence from different phylogenetic analyses. BMC Bioinform. 2010, 11, 7. [Google Scholar] [CrossRef] [PubMed] [Green Version]
  50. Muraguri, S.; Xu, W.; Chapman, M.; Muchugi, A.; Oluwaniyi, A.; Oyebanji, O.; Liu, A. Intraspecific variation within Castor bean (Ricinus communis L.) based on chloroplast genomes. Ind. Crop. Prod. 2020, 155, 112779. [Google Scholar] [CrossRef]
  51. Lu, R.; Chen, M.; Feng, Y.; Yuan, N.; Zhang, Y.; Cao, M.; Liu, J.; Wang, Y.; Hang, Y.; Sun, X. Comparative plastome analyses and genomic resource development in wild rice (Zizania spp., Poaceae) using genome skimming data. Ind. Crop. Prod. 2022, 186, 115244. [Google Scholar] [CrossRef]
  52. Strauss, S.H.; Palmer, J.D.; Howe, G.T.; Doerksen, A.H. Chloroplast genomes of two conifers lack a large inverted repeat and are extensively rearranged. Proc. Natl. Acad. Sci. USA 1988, 85, 3898–3902. [Google Scholar] [CrossRef]
  53. Necsulea, A.; Lobry, J.R. A new method for assessing the effect of replication on DNA base composition asymmetry. Mol. Biol. Evol. 2007, 24, 2169–2179. [Google Scholar] [CrossRef] [Green Version]
  54. Wu, C.S.; Chaw, S.M. Highly rearranged and size-variable chloroplast genomes in conifers II clade (cupressophytes): Evolution towards shorter intergenic spacers. Plant Biotechnol. J. 2014, 12, 344–353. [Google Scholar] [CrossRef]
  55. Nowicki, M.; Huff, M.L.; Staton, M.E.; Trigiano, R.N. Chloroplast genome of the invasive Pyrus calleryana underscores the high molecular diversity of the species. J. Appl. Genet. 2022, 63, 463–467. [Google Scholar] [CrossRef] [PubMed]
  56. Yang, J.; Kim, S.H.; Pak, J.H.; Kim, S.C. Infrageneric plastid genomes of Cotoneaster (Rosaceae): Implications for the plastome evolution and origin of C. wilsonii on Ulleung Island. Genes 2022, 13, 728. [Google Scholar] [CrossRef] [PubMed]
  57. Millen, R.S.; Olmstead, R.G.; Adams, K.L.; Palmer, J.D.; Lao, N.T.; Heggie, L.; Kavanagh, T.A.; Hibberd, J.M.; Gray, J.C.; Morden, C.W.; et al. Many parallel losses of infA from chloroplast DNA during angiosperm evolution with multiple independent transfers to the nucleus. Plant Cell 2001, 13, 645–658. [Google Scholar] [CrossRef] [PubMed] [Green Version]
  58. Zhu, L.; Xian, F.; Zhang, Q.; Hu, J. Research progress of RNA editing. Biotechnol. Bull. 2022, 38, 1–14. [Google Scholar]
  59. He, P.; Huang, S.; Xiao, G.; Zhang, Y.; Yu, J. Abundant RNA editing sites of chloroplast protein-coding genes in Ginkgo biloba and an evolutionary pattern analysis. BMC Plant Biol. 2016, 16, 1–12. [Google Scholar] [CrossRef] [Green Version]
  60. Yang, Z.; Nielsen, R. Estimating synonymous and nonsynonymous substitution rates under realistic evolutionary models. Mol. Biol. Evol. 2000, 17, 32–43. [Google Scholar] [CrossRef] [Green Version]
  61. Khakhlova, O.; Bock, R. Elimination of deleterious mutations in plastid genomes by gene conversion. Plant J. 2006, 46, 85–94. [Google Scholar] [CrossRef]
  62. Cai, S.Y. Effects of GA3, Ca2+ on Anthocyanin and Phenylalanine Amonia Lyase in Stem of Anthurium andraeanum. Acta Hortic. Sin. 2004, 31, 343–346. [Google Scholar]
  63. Ma, X.Y. Effects of Different Application Rates of Nitrogen, Phosphorus and Potassium on Leaf and Fruit Quality of Blue Honeysuckle (Lonicera caerulea L.). Master’s Thesis, Northeast Agricultural University, Harbin, China, 2021. [Google Scholar]
  64. Cui, D.; Zhao, S.; Xu, H.; Allan, A.C.; Zhang, X.; Fan, L.; Chen, L.; Su, J.; Shu, Q.; Li, K. The interaction of MYB, bHLH and WD40 transcription factors in red pear (Pyrus pyrifolia) peel. Plant Mol. Biol. 2021, 106, 407–417. [Google Scholar] [CrossRef]
  65. Wen, J.X.; Wang, C.L.; Feng, H.; Li, S.S.; Wang, L.S.; Hua, W.R.; Wei, Z.S. Research progress on flower color of rose. Acta Horticulturae Sinica 2021, 48, 2044–2056. [Google Scholar]
  66. Sapir, Y.; Gallagher, M.K.; Senden, E. What maintains flower colour variation within populations? Trends Ecol. Evol. 2021, 36, 507–519. [Google Scholar] [CrossRef] [PubMed]
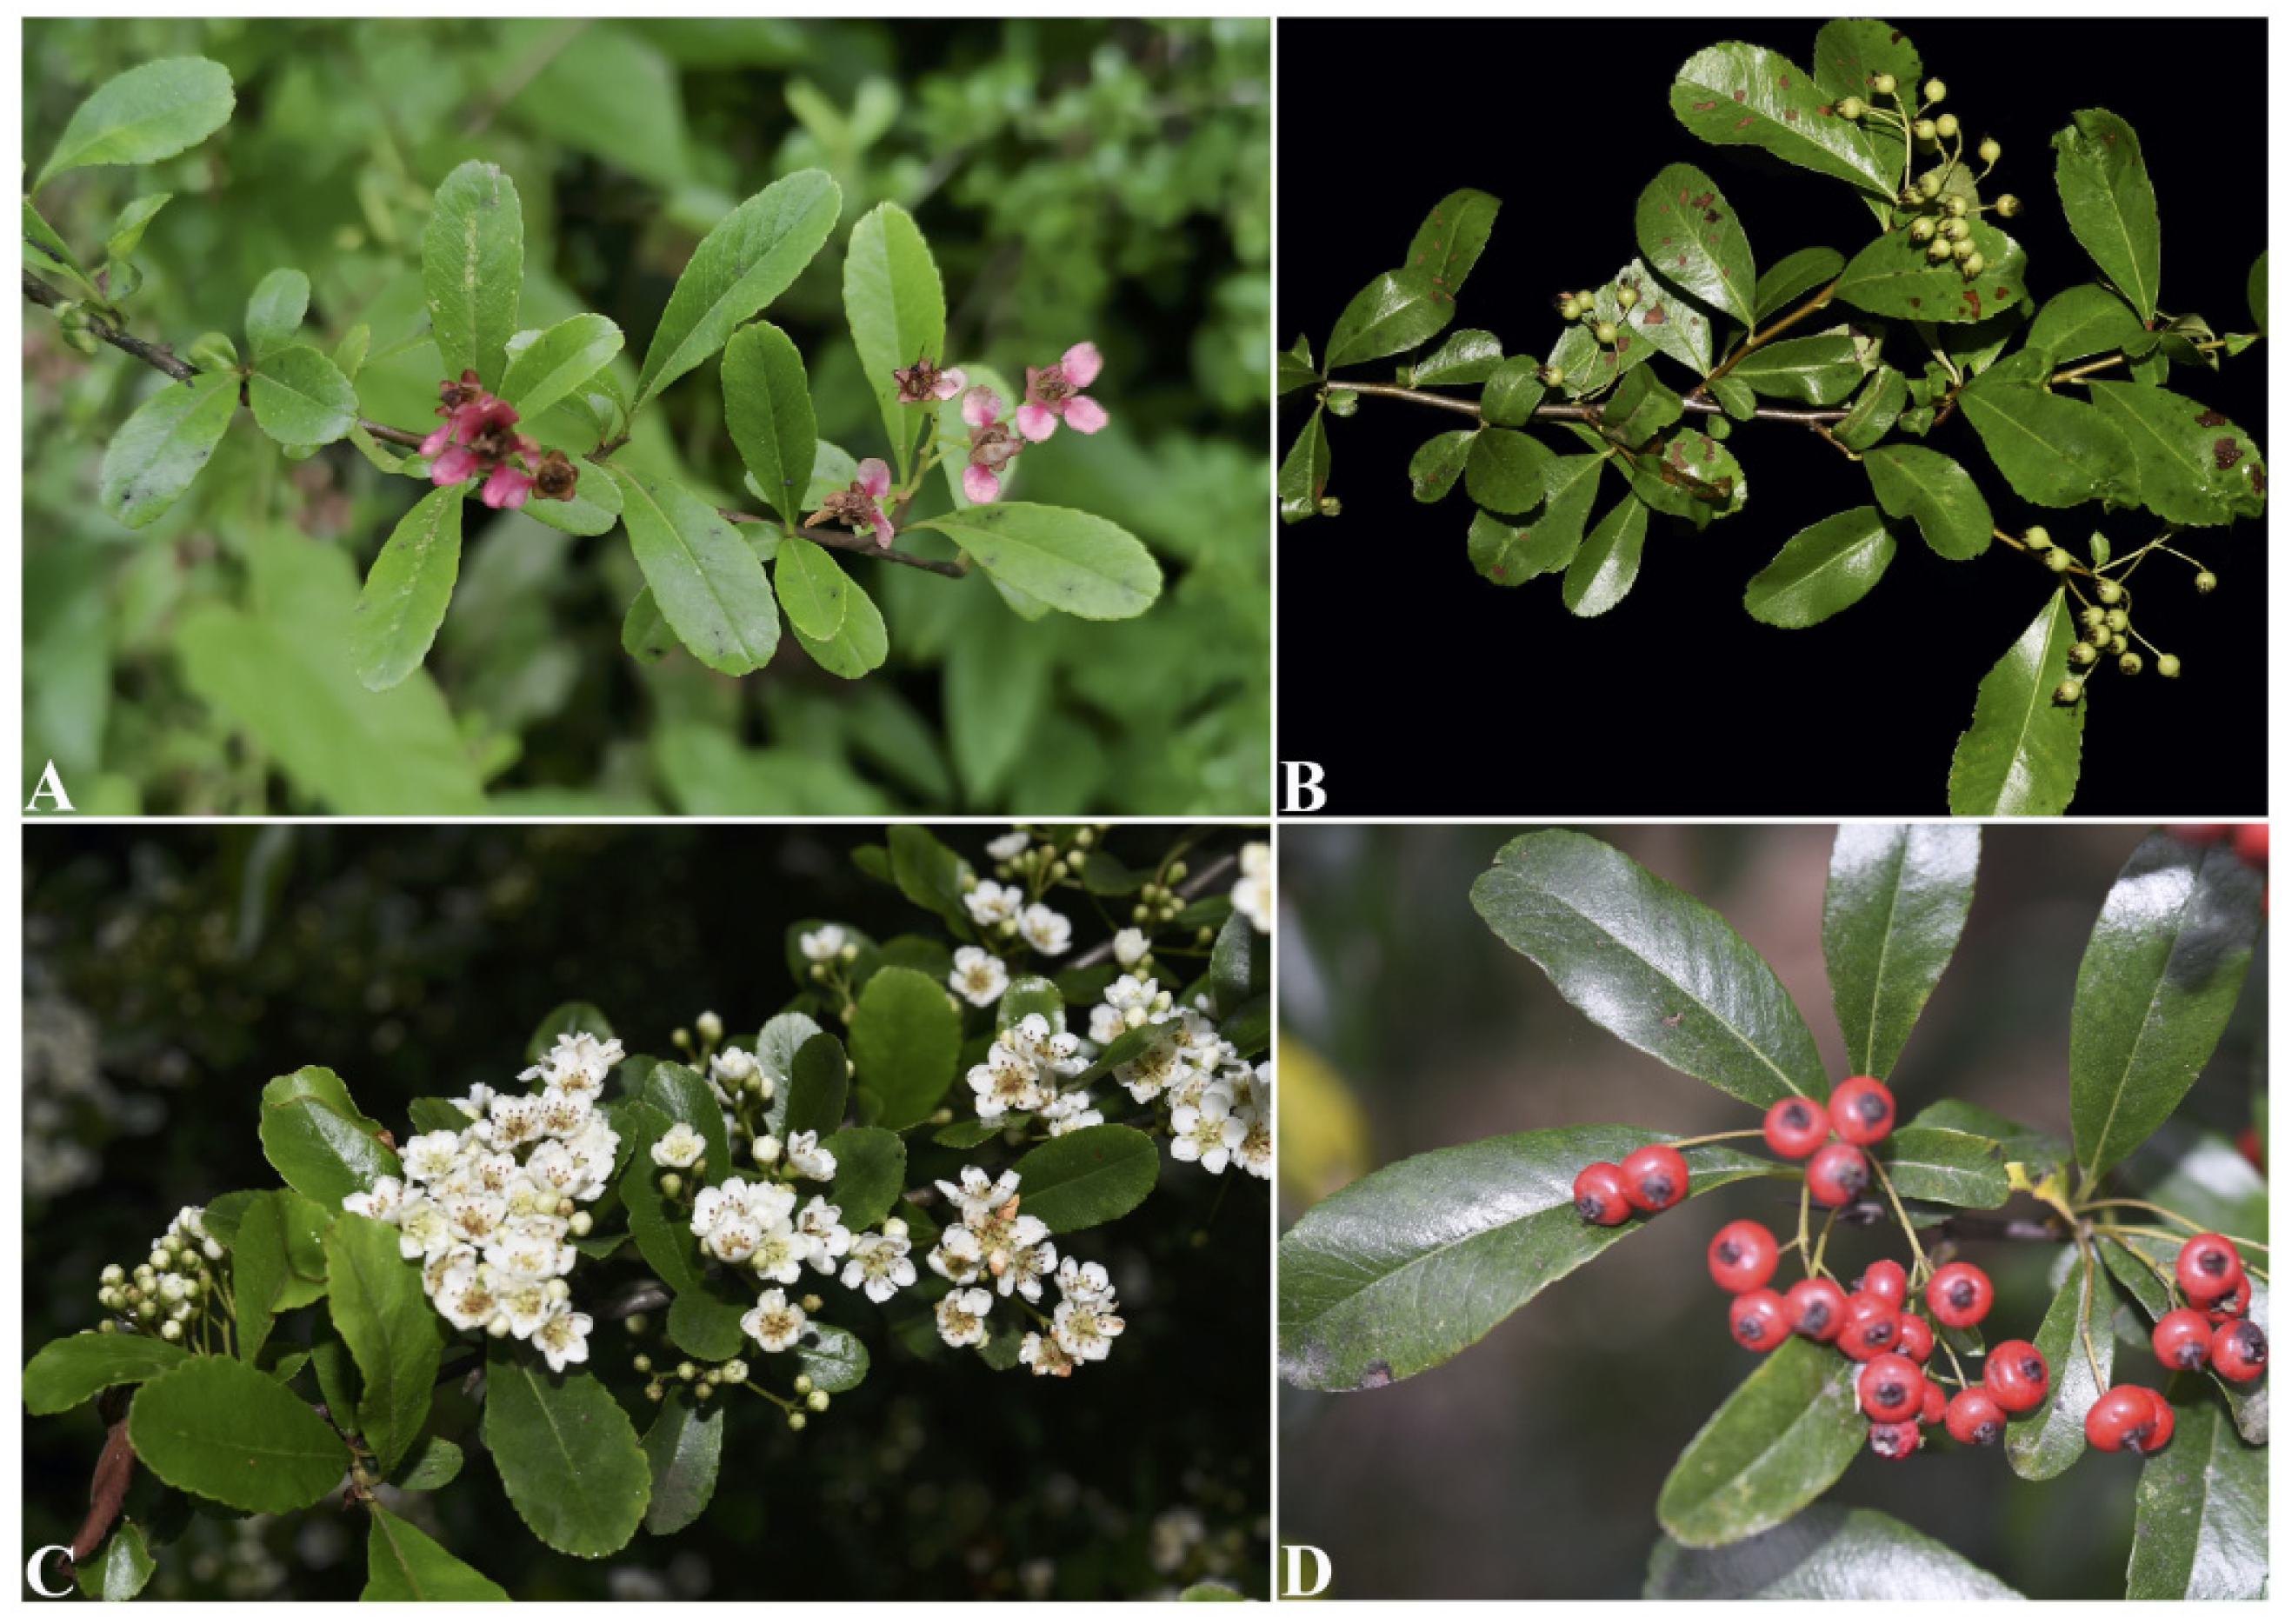
Figure 1. Morphological comparison between red and white flower phenotypes of P. fortuneana. (A) (B) the flowers and young fruits of individual with the red flower phenotype; (C,D) the flowers and mature fruits of individual with the white flower phenotype (photographed by Shi-Xiong Ding).
Genes 13 02404 g001
Figure 2. The circular chloroplast genome map of P. fortuneana (red). The genes drawn inside the circle are transcribed counterclockwise while those outside are transcribed clockwise. Different functional genes are differently colored on the outer circle. The dashed darker gray area in the inner circle denotes GC content, and the lighter gray area corresponds to AT content.
Genes 13 02404 g002
Figure 3. Comparative junction characteristics of LSC, SSC, and IR regions of chloroplast genomes between three accessions of P. fortuneana and two other Pyracantha species. JLB, JSB, JSA, and JLA represent four different junction regions in the chloroplast genome boundaries.
Genes 13 02404 g003
Figure 4. Comparative analysis plots of RSCU values for the six Pyracantha chloroplast genomes. Each amino acid corresponds to six histograms, and their heights represent the RSCU value. The histograms from left to right are P. atalantioides, P. angustifolia, P. coccinea, P. fortuneana (red), P. fortuneana-1 (white), and P. fortuneana-2 (white).
Genes 13 02404 g004
Figure 5. The predicted RNA editing sites in protein-coding genes of P. fortuneana chloroplast genomes.
Genes 13 02404 g005
Figure 6. Analyses of SSRs in six Pyracantha chloroplast genomes. (A) Frequency of SSR types. (B) Frequency of different SSR units. (C) Frequency of SSRs in LSC, SSC, and IR regions.
Genes 13 02404 g006
Figure 7. The nucleotide diversity (Pi) of six Pyracantha chloroplast genomes.
Genes 13 02404 g007
Figure 8. Distance-based NJ tree of the genus Pyracantha inferred from chloroplast genome sequences.
Genes 13 02404 g008
Figure 9. The phylogenetic tree of the genus Pyracantha inferred from chloroplast genome sequences based on the methods of maximum likelihood (ML) and Bayesian inference (BI). The BI posterior probabilities/ML bootstrap values are displayed above the lines.
Genes 13 02404 g009
Table 1. The basic characteristics of five Pyracantha chloroplast genomes.
SpeciesP. fortuneana (red) *P. fortuneana-1 (white)P. fortuneana-2 (white)P. coccineaP. atalantioides
NCBI AccessionOM793283NC_059101MW596361NC_062343MW801001
Size (bp)Whole160,361160,388160,447160,606160,803
LSC88,31688,34088,39388,48488,698
SSC19,34519,34819,34419,43819,417
IR26,35026,35026,35526,34226,344
GC content (%)Whole36.536.536.536.536.4
LSC34.134.134.134.134
SSC30.430.430.430.330.4
IR42.742.742.742.742.7
Total genes131131131131131
Genes (Duplicated)PCGs86 (7)86 (7)86 (7)86 (7)86 (7)
tRNA37 (7)37 (7)37 (7)37 (7)37 (7)
rRNA8 (4)8 (4)8 (4)8 (4)8 (4)
*, newly sequenced chloroplast genome.
Table 2. Gene composition of the P. fortuneana (red) chloroplast genome.
CategoryGroups of GenesName of Genes
Self-replicationRibosomal RNArrn4.5 (2×), rrn5 (2×), rrn16 (2×), rrn23 (2×)
Transfer RNAtrnA-UGC 1(2×), trnC-GCA, trnD-GUC, trnE-UUC, trnF-GAA, trnG-GCC, trnG-UCC1, trnH-GUG, trnI-CAU (2×), trnI-GAU 1, (2×), trnK-UUU 1, trnL-CAA (2×), trnL-UAA 1, trnL-UAG, trnM-CAU, trnfM-CAU, trnN-GUU (2×), trnP-UGG, trnQ-UUG, trnR-UCU, trnR-ACG (2×), trnS-UGA, trnS-GCU, trnS-GGA, trnT-GGU, trnT-UGU, trnV-UAC 1, trnV-GAC (2×), trnW-CCA, trnY-GUA
Small subunit of ribosomerps2, rps3, rps4, rps7 (2×), rps8, rps11, rps12 1,(2×), rps14, rps15, rps16 1, rps18, rps19
Large subunit of ribosomerpl21,(2×), rpl14, rpl161, rpl20, rpl22, rpl23 (2×), rpl32, rpl33, rpl36
RNA polymerase subunitsrpoA, rpoB, rpoC11, rpoC2
PhotosynthesisPhotosystem IpsaA, psaB, psaC, psaI, psaJ
Photosystem IIpsbA, psbB, psbC, psbD, psbE, psbF, psbH, psbI, psbJ, psbK, psbL, psbM, psbN, psbT, psbZ
Subunits of cytochromepetA, petB1, petD1, petG, petL, petN
ATP synthaseatpA, atpB, atpE, atpF1, atpH, atpI
NADH-dehydrogenasendhA1, ndhB1,, ndhC, ndhD, ndhE, ndhF, ndhG, ndhH, ndhI, ndhJ, ndhK
Other genesRubisco large subunitrbcL
Maturase KmatK
Envelope membrane proteincemA
Acetyl-CoA carboxylaseaccD
ProteolysisclpP2
Cytochrome c biogenesisccsA
UnknownConserved open reading framesycf1, ycf2 (2×), ycf3 2, ycf4, ycf15 (2×)
1, genes with one intron; 2, genes with two introns; (2×), two genes copied in IR regions.
Table 3. Codon usage in the chloroplast genome of P. fortuneana (red).
Amino AcidsCodonsCountRSCUAmino AcidsCodonsCountRSCU
LeucineUUA(L)8911.93PhenylalanineUUU(F)9661.3
UUG(L)5681.23UUC(F)5210.7
CUU(L)5801.26TyrosineUAU(Y)7901.61
CUC(L)1840.4UAC(Y)1910.39
CUA(L)3590.78HistidineCAU(H)4911.55
CUG(L)1810.39CAC(H)1410.45
IsoleucineAUU(I)11131.48GlutamineCAA(Q)7291.55
AUC(I)4330.58CAG(Q)2130.45
AUA(I)7110.95AsparagineAAU(N)9731.53
MethionineAUG(M)6221AAC(N)3000.47
ValineGUU(V)5141.45LysineAAA(K)10491.5
GUC(V)1590.45AAG(K)3530.5
GUA(V)5471.54Aspartic AcidGAU(D)8811.62
GUG(V)2020.57GAC(D)2070.38
SerineUCU(S)5721.7Glutamic AcidGAA(E)10141.47
UCC(S)3220.96GAG(E)3610.53
UCA(S)4051.2CysteineUGU(C)2261.51
UCG(S)1860.55UGC(C)740.49
AGU(S)4081.21TryptophanUGG(W)4521
AGC(S)1290.38ArginineCGU(R)3391.28
ProlineCCU(P)4201.56CGC(R)1110.42
CCC(P)1950.73CGA(R)3631.37
CCA(P)3111.16CGG(R)1180.44
CCG(P)1490.55AGA(R)4901.84
ThreonineACU(T)5441.61AGG(R)1730.65
ACC(T)2430.72GlycineGGU(G)5821.31
ACA(T)4161.23GGC(G)1810.41
ACG(T)1490.44GGA(G)7211.63
AlanineGCU(A)6421.84GGG(G)2900.65
GCC(A)2180.63Stop codonUAA(*)511.78
GCA(A)3851.11UAG(*)200.7
GCG(A)1480.42UGA(*)150.52
Table 4. The purifying selected sites detected in the 78 CDSs of six Pyracantha chloroplast genomes.
CodonGeneRegionSynonymous Substitution RateNon-Synonymous Substitution Ratep-ValueTotal Branch Length
YatpILSC4368.6060.0670.06940.401
NccsASSC4368.6060.0670.04030.238
AmatKLSC680.5920.0680.0990.300
PndhDSSC628.8590.0690.08740.210
P628.8590.0690.08740.210
KndhFSSC1327.4520.0700.05650.376
AndhHSSC1526.2020.0680.03520.500
YpsbMLSC1687.80800.07380.448
GrbcLLSC970.75700.09530.288
PrpoC1LSC1822.72500.07150.317
Krps18LSC2081.35900.05380.339
T1168.65900.09420.348
Table 5. The genetic distance among six Pyracantha chloroplast genomes.
Species123456
1P. fortuneana (red)
2P. fortuneana-1 (white)0.000
3P. fortuneana-2 (white)0.0000.000
4P. angustifolia0.0000.0000.000
5P. atalantioides0.0000.0000.0010.001
6P. coccinea0.0010.0010.0010.0010.001
Table 6. Morphological, habit, and habitat differences between P. fortuneana individuals with red and white flower phenotypes.
CharactersRed Flower PhenotypeWhite Flower Phenotype
Plant habitevergreen or semi-evergreen shrub, mature leaves turn red in winterevergreen shrub, mature leaves keep green in winter
Leafleaf blade obovate to obovate-oblong, base cuneate to wide roundleaf blade obovate-oblong, base cuneate, extending down to the petiole
Serrationsserrations conspicuous or inconspicuousserrations obtuse or inconspicuous
Inflorescencecompound corymb, loose, fewer flowerscompound corymb, dense, more flowers
Calyx lobesinner sepals red to pinkinner sepals white
Flowerpetals, styles and filaments red to pinkpetals, styles and filaments white
Phenologyfl. Mar–May, fr. Aug–Novfl. Mar–June, fr. Aug–Nov
HabitatAlt. 750–1500 mAlt. 500–2800 m
Publisher’s Note: MDPI stays neutral with regard to jurisdictional claims in published maps and institutional affiliations.