
Single-Cell Transcriptome and Network Analyses Unveil Key Transcription Factors Regulating Mesophyll Cell Development in Maize

 , and
, and 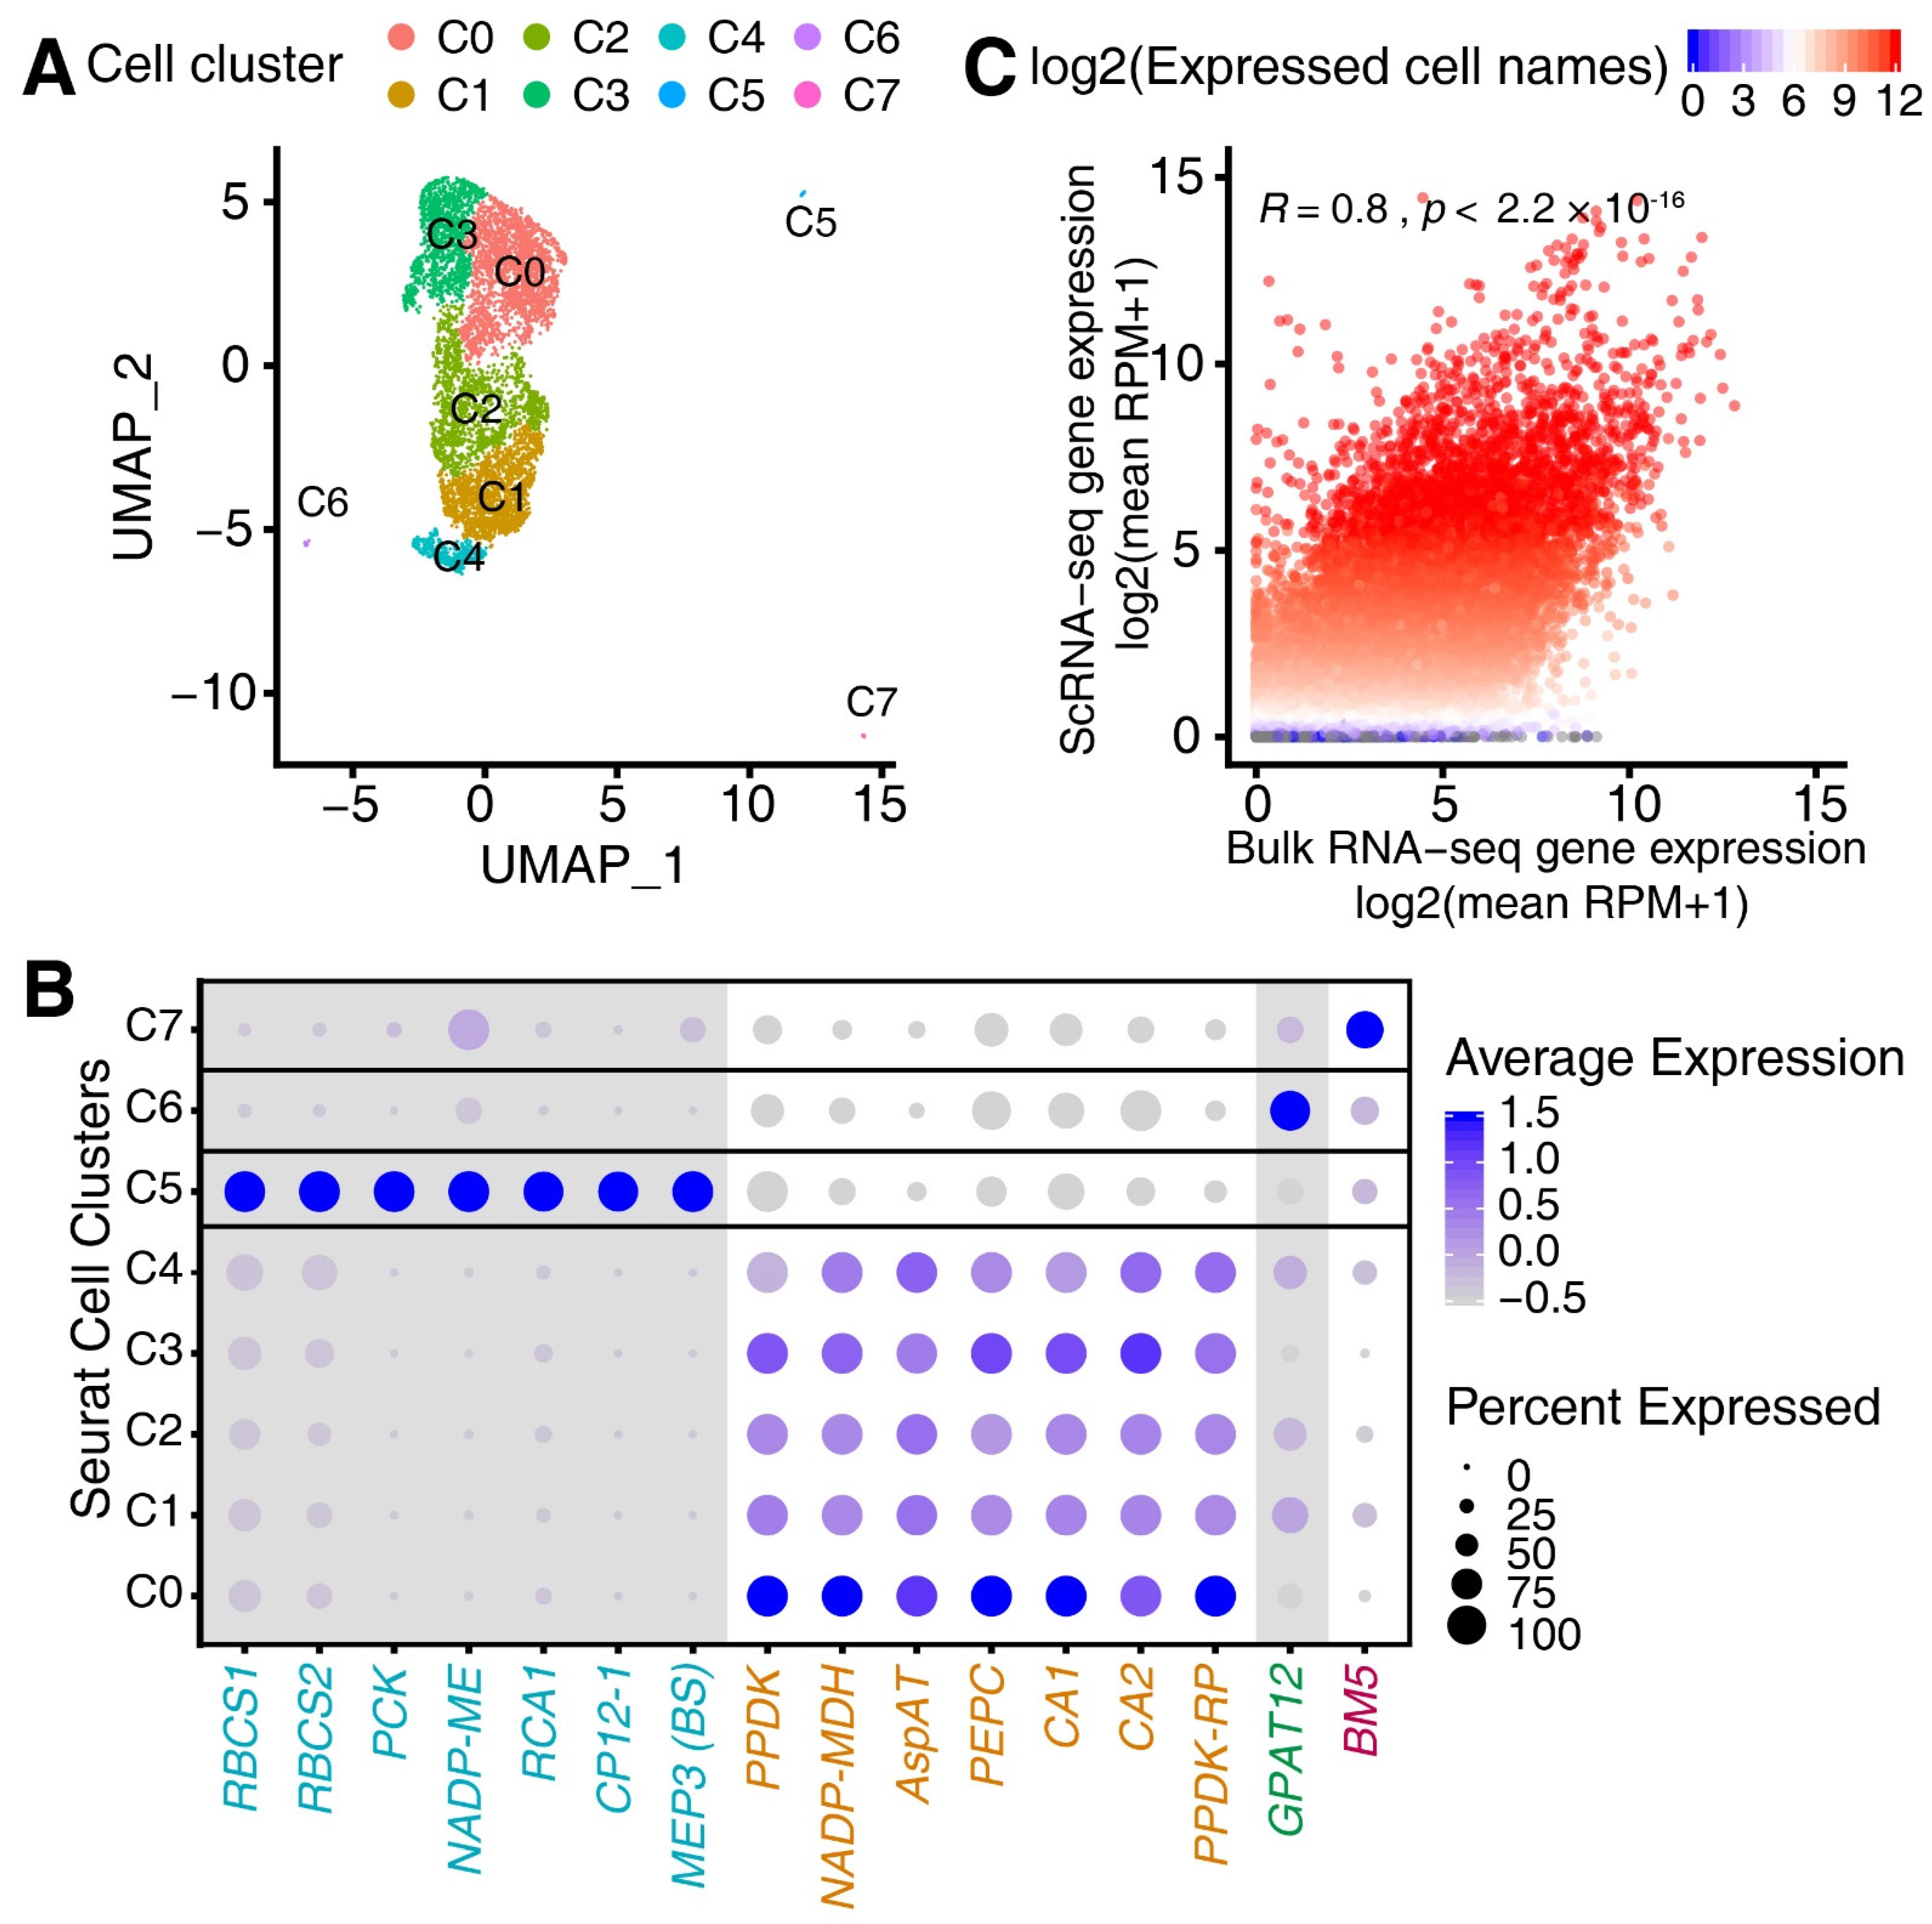
Abstract
:1. Introduction
2. Materials and Methods
2.1. Plant Growth
2.2. Preparation of M and BS Cells
2.3. Reverse Transcription and Quantitative RT-PCR (qRT-PCR) Assay
2.4. ChIP-qPCR Assays of Genes Regulated by the HSF1 and COL8 Transcription Factors
2.5. Validation of the HSF1-Binding Motif
2.6. Bulk RNA-Seq and Data Analyses
2.7. ChIP-Seq and MH-Seq Data Analyses
2.8. Single-Cell RNA-Seq (scRNA-Seq)
2.9. Preprocess of scRNA-Seq Data
2.10. Pseudo-Time Analyses
2.11. Motif Analyses
2.12. Weighted Coexpression Network Analysis (WGCNA)
2.13. Construction of TF Regulatory Network Using SCODE
2.14. Construction of Gene Regulatory Network
2.15. GO-Term Enrichment Analyses
2.16. Visualization of H3K4me3 HiChIP Network
2.17. General Bioinformatics Software
3. Results
3.1. Single-Cell RNA (scRNA) Sequencing of the Maize Leaf
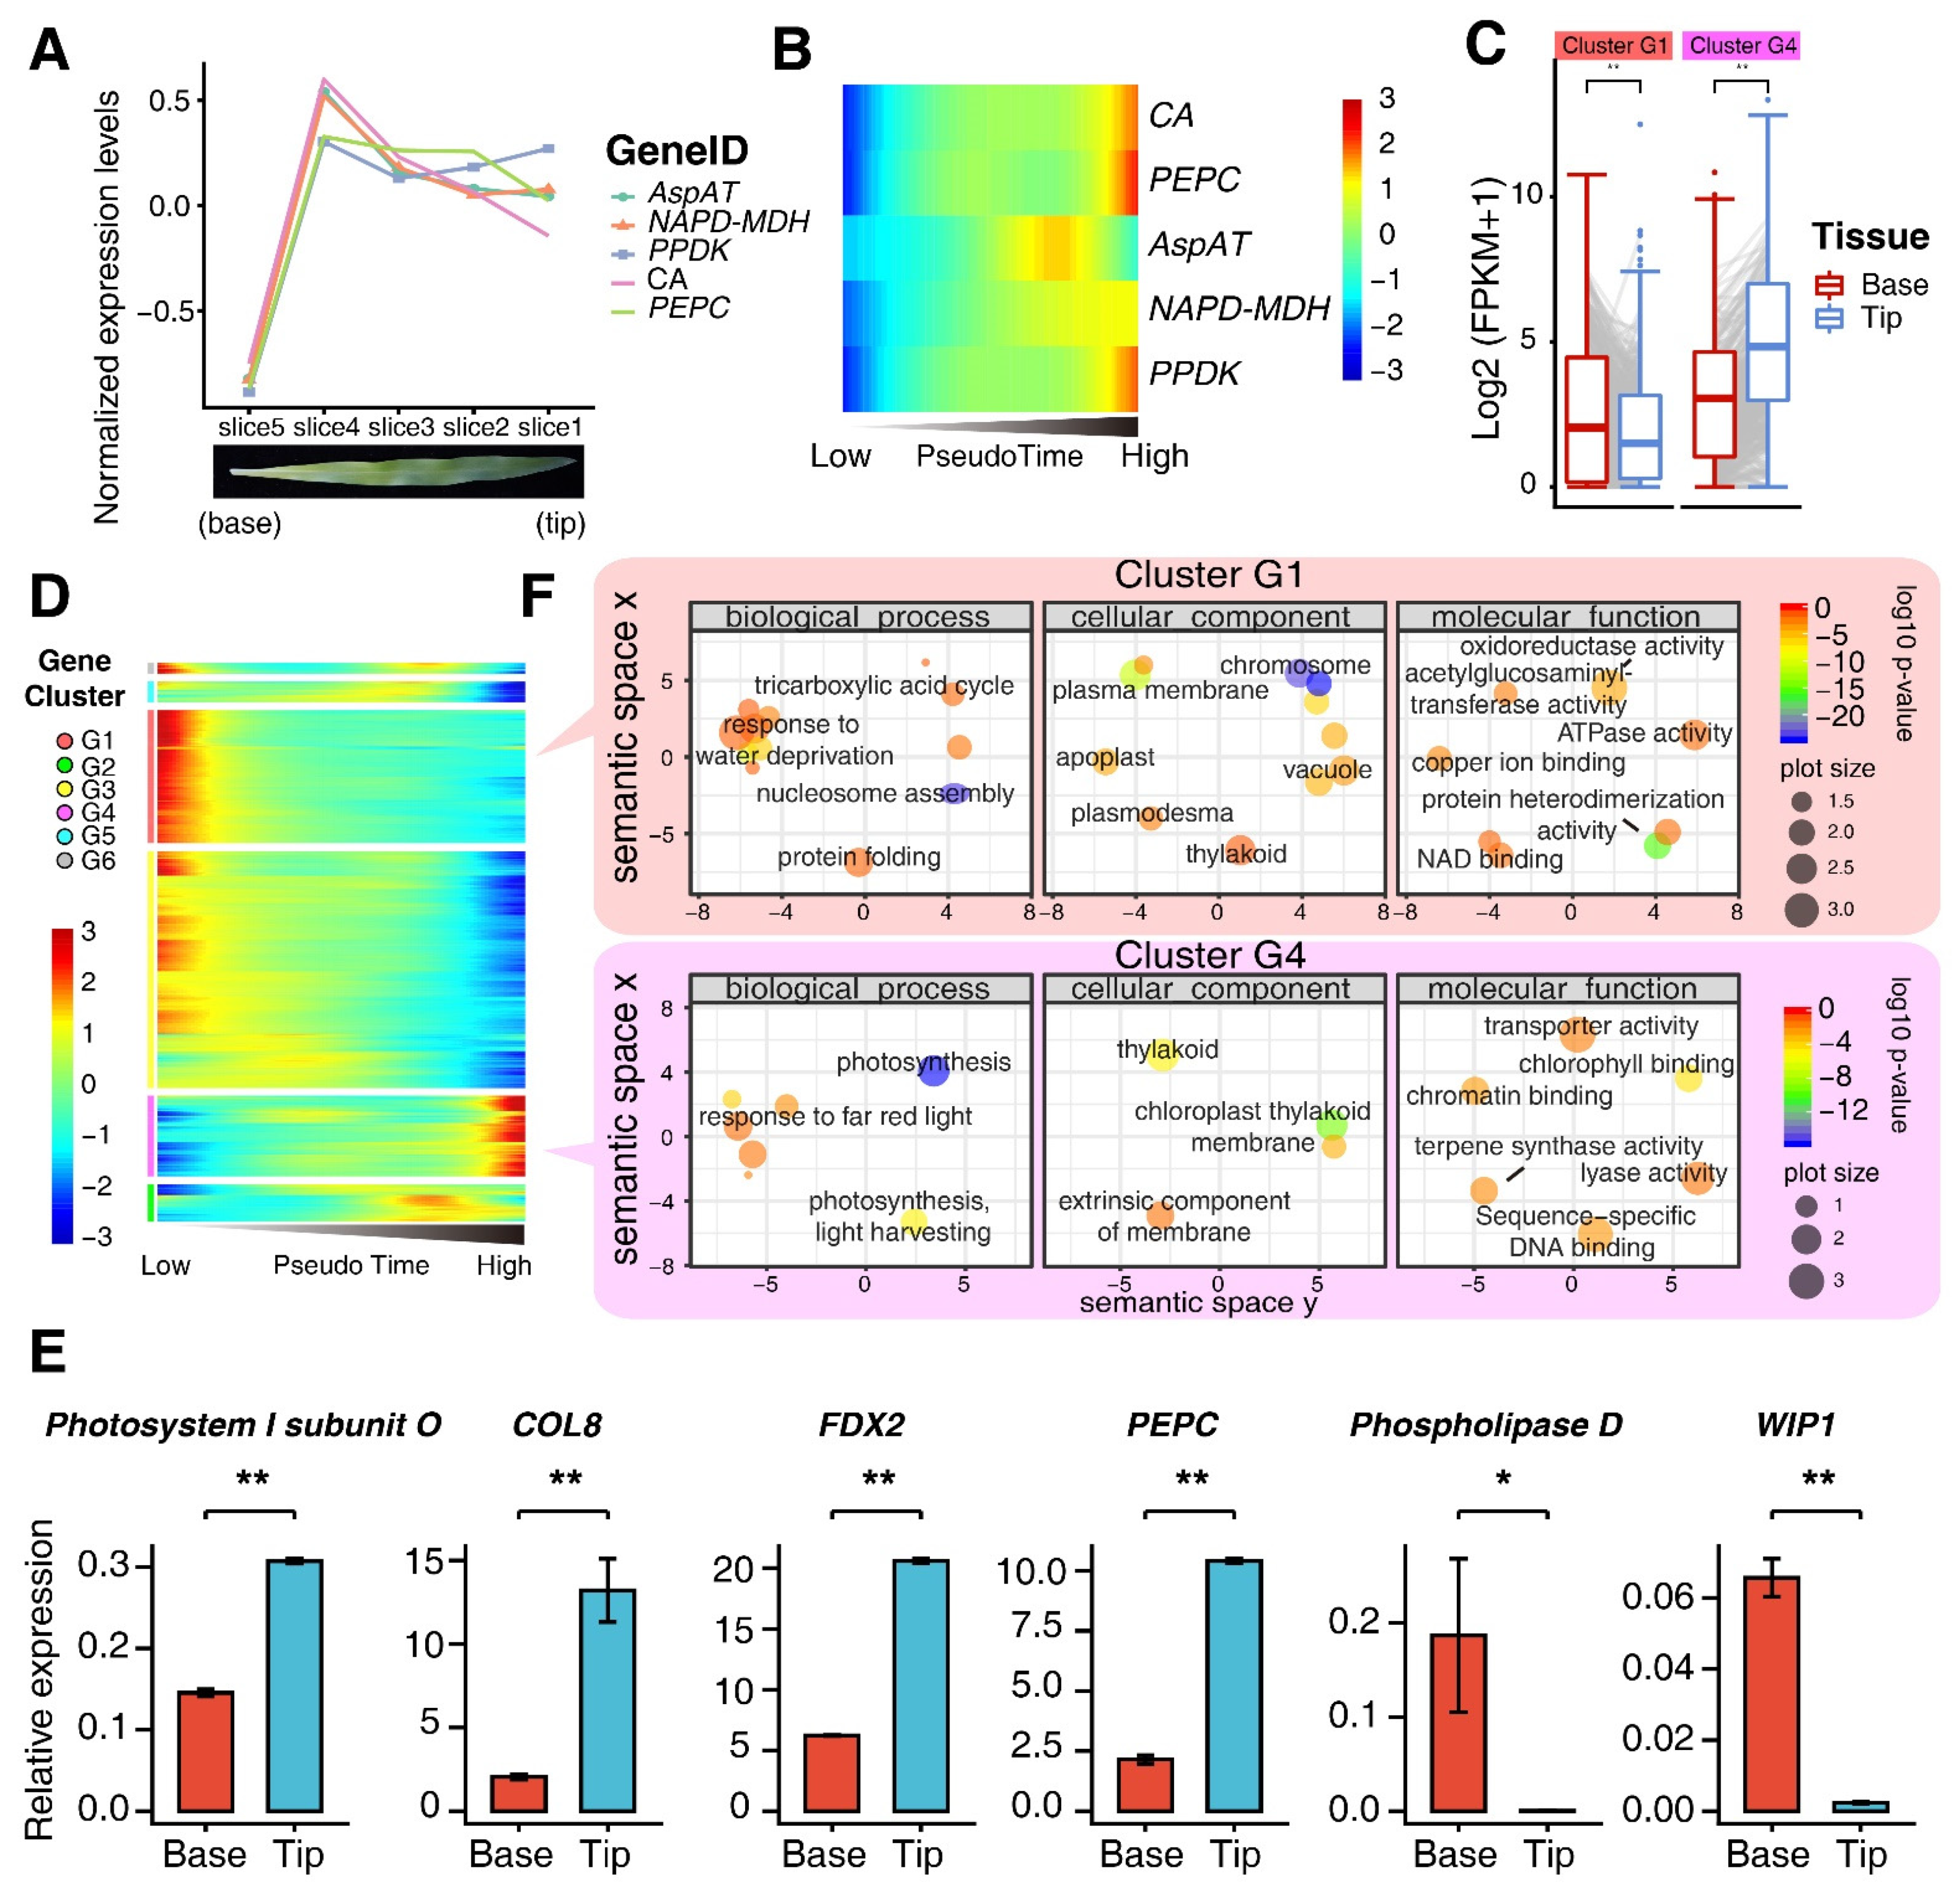
3.2. Characterization of Developmental Stage of M Cells Using Pseudo-Time Trajectory Analyses
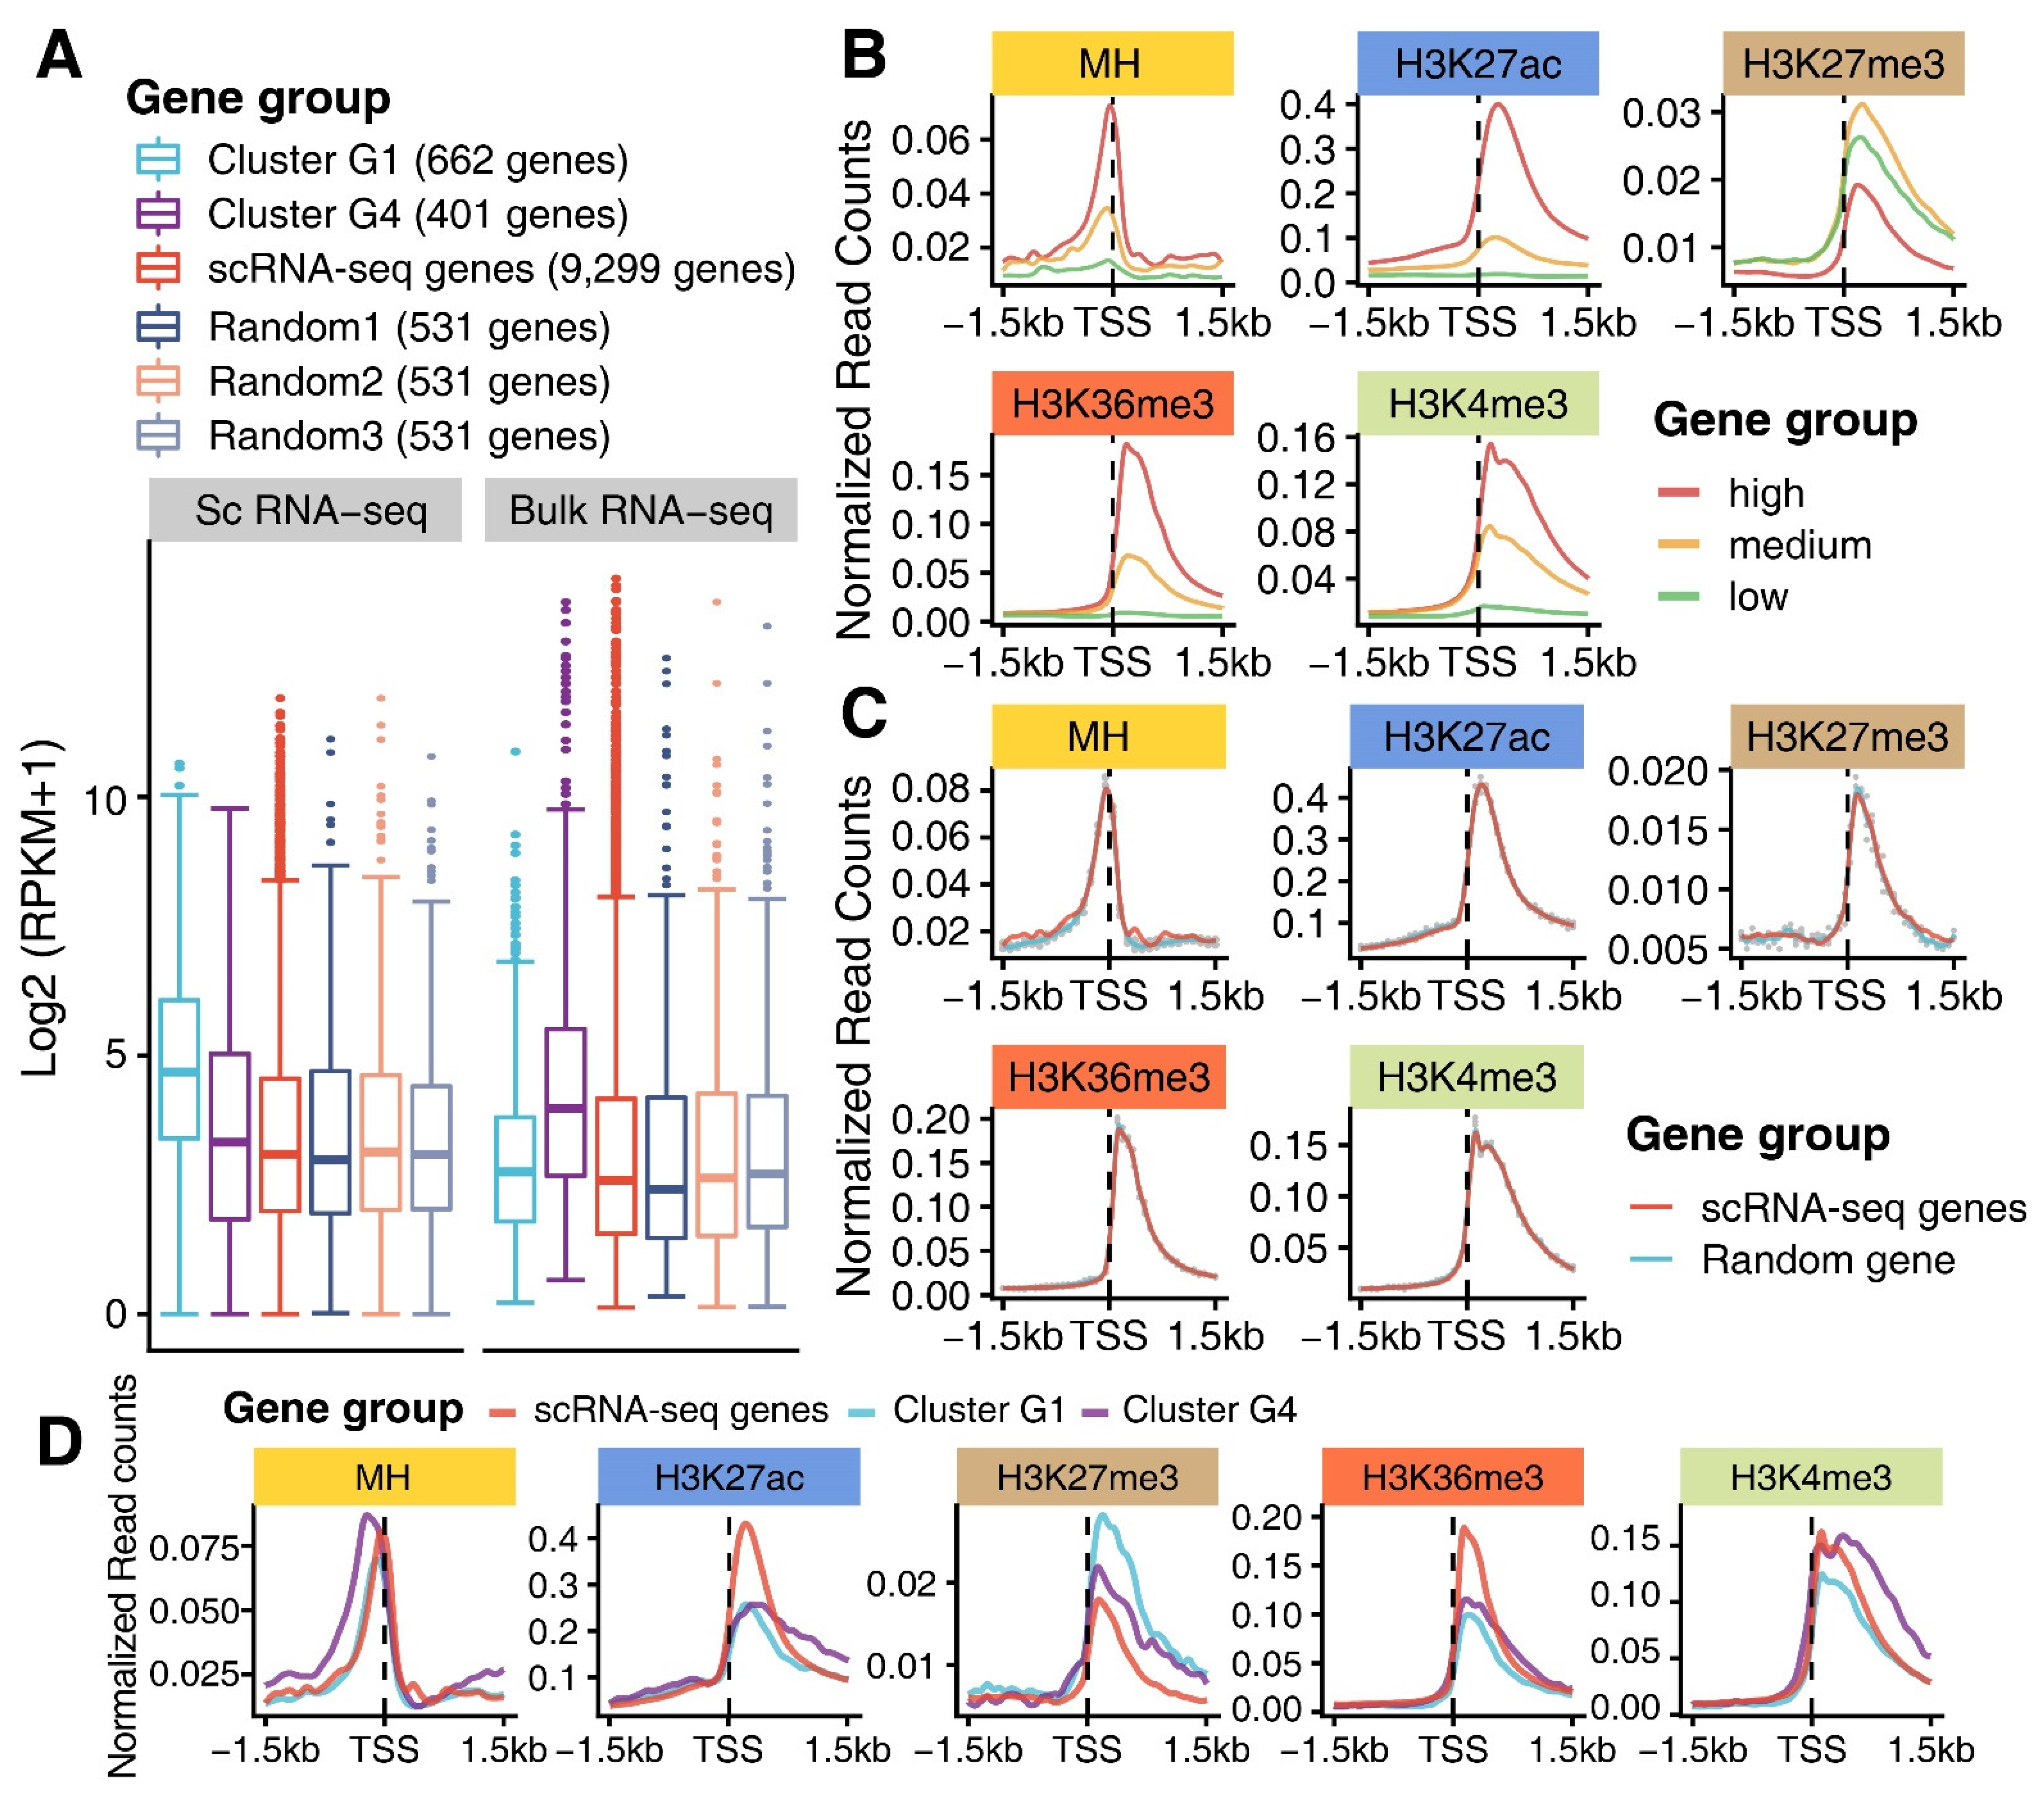
3.3. Epigenomic Signatures of Genes in G1 and G4
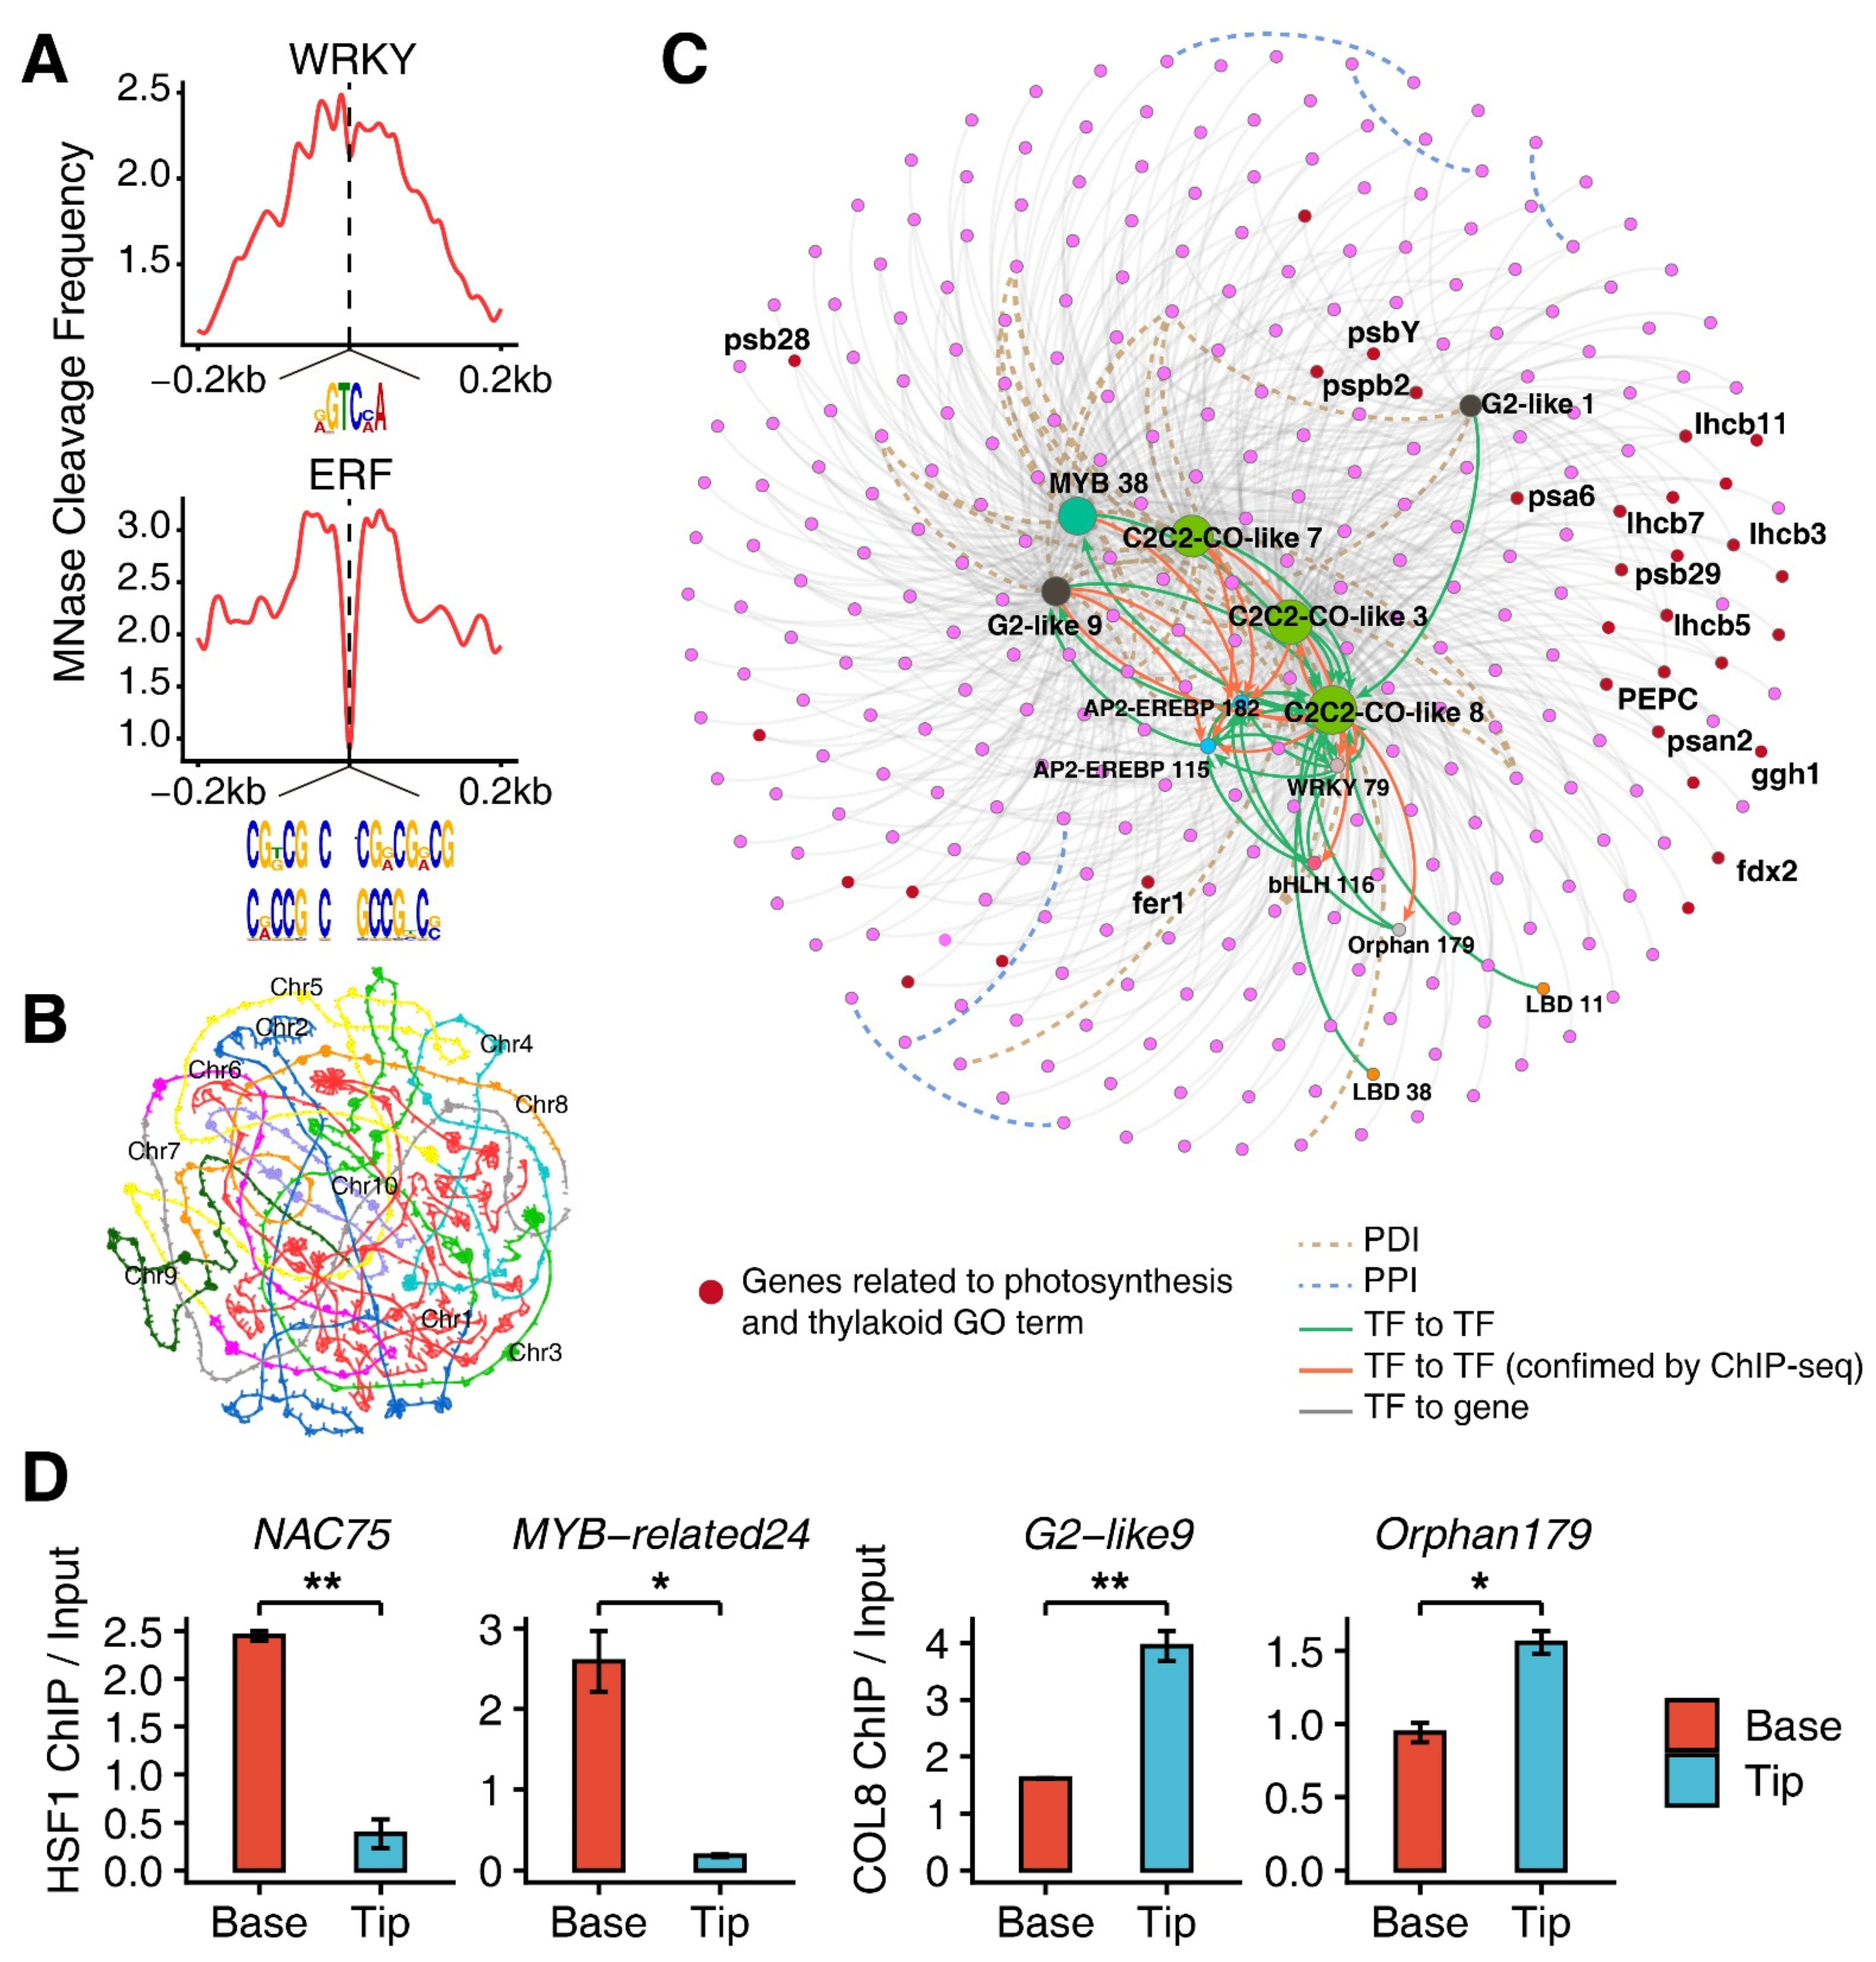
3.4. Construction of Transcription Factor (TF) Regulatory Network
3.5. Involvement of TF-Regulatory Network in the M-Cell Development
3.6. Functions of HSF1 and COL8 Alone or Coordinated with Each Other in Regulating M-Cell Development
4. Discussion
4.1. Subfunctional Differentiation among Functionally Specialized M Cells
4.2. Key Transcriptional Factors in Regulation of M-Cell Development
5. Conclusions
Supplementary Materials
Author Contributions
Funding
Institutional Review Board Statement
Informed Consent Statement
Data Availability Statement
Acknowledgments
Conflicts of Interest
References
- Jensen, R.G. Photosynthesis: C3, C4. Mechanisms, and cellular and environmental regulation, of photosynthesis. Science 1983, 222, 1009. [Google Scholar] [CrossRef] [PubMed]
- Chollet, R. Photosynthetic carbon metabolism in isolated maize bundle sheath strands. Plant Physiol. 1973, 51, 787–792. [Google Scholar] [CrossRef] [PubMed] [Green Version]
- Majeran, W.; Friso, G.; Ponnala, L.; Connolly, B.; Huang, M.; Reidel, E.; Zhang, C.; Asakura, Y.; Bhuiyan, N.H.; Sun, Q.; et al. Structural and metabolic transitions of C4 leaf development and differentiation defined by microscopy and quantitative proteomics in maize. Plant Cell 2010, 22, 3509–3542. [Google Scholar] [CrossRef] [PubMed] [Green Version]
- Majeran, W.; Cai, Y.; Sun, Q.; van Wijk, K.J. Functional differentiation of bundle sheath and mesophyll maize chloroplasts determined by comparative proteomics. Plant Cell 2005, 17, 3111–3140. [Google Scholar] [CrossRef] [PubMed] [Green Version]
- Bellasio, C.; Griffiths, H. The operation of two decarboxylases, transamination, and partitioning of C4 metabolic processes between mesophyll and bundle sheath cells allows light capture to be balanced for the maize C4 pathway. Plant Physiol. 2014, 164, 466–480. [Google Scholar] [CrossRef] [Green Version]
- Li, P.; Ponnala, L.; Gandotra, N.; Wang, L.; Si, Y.; Tausta, S.L.; Kebrom, T.H.; Provart, N.; Patel, R.; Myers, C.R.; et al. The developmental dynamics of the maize leaf transcriptome. Nat. Genet. 2010, 42, 1060–1067. [Google Scholar] [CrossRef]
- Chang, Y.M.; Liu, W.Y.; Shih, A.C.; Shen, M.N.; Lu, C.H.; Lu, M.Y.; Yang, H.W.; Wang, T.Y.; Chen, S.C.; Chen, S.M.; et al. Characterizing regulatory and functional differentiation between maize mesophyll and bundle sheath cells by transcriptomic analysis. Plant Physiol. 2012, 160, 165–177. [Google Scholar] [CrossRef] [Green Version]
- Huang, C.F.; Chang, Y.M.; Lin, J.J.; Yu, C.P.; Lin, H.H.; Liu, W.Y.; Yeh, S.; Tu, S.L.; Wu, S.H.; Ku, M.S.; et al. Insights into the regulation of C4 leaf development from comparative transcriptomic analysis. Curr. Opin. Plant Biol. 2016, 30, 1–10. [Google Scholar] [CrossRef]
- Pick, T.R.; Brautigam, A.; Schluter, U.; Denton, A.K.; Colmsee, C.; Scholz, U.; Fahnenstich, H.; Pieruschka, R.; Rascher, U.; Sonnewald, U.; et al. Systems analysis of a maize leaf developmental gradient redefines the current C4 model and provides candidates for regulation. Plant Cell 2011, 23, 4208–4220. [Google Scholar] [CrossRef] [Green Version]
- Yu, C.P.; Chen, S.C.; Chang, Y.M.; Liu, W.Y.; Lin, H.H.; Lin, J.J.; Chen, H.J.; Lu, Y.J.; Wu, Y.H.; Lu, M.Y.; et al. Transcriptome dynamics of developing maize leaves and genomewide prediction of cis elements and their cognate transcription factors. Proc. Natl. Acad. Sci. USA 2015, 112, E2477–E2486. [Google Scholar] [CrossRef] [Green Version]
- Wang, L.; Czedik-Eysenberg, A.; Mertz, R.A.; Si, Y.; Tohge, T.; Nunes-Nesi, A.; Arrivault, S.; Dedow, L.K.; Bryant, D.W.; Zhou, W.; et al. Comparative analyses of C(4) and C(3) photosynthesis in developing leaves of maize and rice. Nat. Biotechnol. 2014, 32, 1158–1165. [Google Scholar] [CrossRef] [PubMed]
- Heimann, L.; Horst, I.; Perduns, R.; Dreesen, B.; Offermann, S.; Peterhansel, C. A Common histone modification code on C4 genes in maize and its conservation in Sorghum and Setaria italica. Plant Physiol. 2013, 162, 456–469. [Google Scholar] [CrossRef] [PubMed] [Green Version]
- Hibberd, J.M.; Covshoff, S. The regulation of gene expression required for C4 photosynthesis. Annu. Rev. Plant Biol. 2010, 61, 181–207. [Google Scholar] [CrossRef] [PubMed]
- Burgess, S.J.; Reyna-Llorens, I.; Stevenson, S.R.; Singh, P.; Jaeger, K.; Hibberd, J.M. Genome-Wide Transcription Factor Binding in Leaves from C3 and C4 Grasses. Plant Cell 2019, 31, 2297–2314. [Google Scholar] [CrossRef] [Green Version]
- Belcher, S.; Williams-Carrier, R.; Stiffler, N.; Barkan, A. Large-scale genetic analysis of chloroplast biogenesis in maize. Biochim. Biophys. Acta 2015, 1847, 1004–1016. [Google Scholar] [CrossRef] [PubMed] [Green Version]
- Zheng, D.; Wang, L.; Chen, L.; Pan, X.; Lin, K.; Fang, Y.; Wang, X.E.; Zhang, W. Salt-Responsive Genes are Differentially Regulated at the Chromatin Levels Between Seedlings and Roots in Rice. Plant Cell Physiol. 2019, 60, 1790–1803. [Google Scholar] [CrossRef]
- Zhao, H.; Zhang, W.; Chen, L.; Wang, L.; Marand, A.P.; Wu, Y.; Jiang, J. Proliferation of Regulatory DNA Elements Derived from Transposable Elements in the Maize Genome. Plant Physiol. 2018, 176, 2789–2803. [Google Scholar] [CrossRef] [Green Version]
- Kim, D.; Langmead, B.; Salzberg, S.L. HISAT: A fast spliced aligner with low memory requirements. Nat. Methods 2015, 12, 357–360. [Google Scholar] [CrossRef] [Green Version]
- Pertea, M.; Pertea, G.M.; Antonescu, C.M.; Chang, T.C.; Mendell, J.T.; Salzberg, S.L. StringTie enables improved reconstruction of a transcriptome from RNA-seq reads. Nat. Biotechnol. 2015, 33, 290–295. [Google Scholar] [CrossRef] [Green Version]
- Love, M.I.; Huber, W.; Anders, S. Moderated estimation of fold change and dispersion for RNA-seq data with DESeq2. Genome Biol. 2014, 15, 550. [Google Scholar] [CrossRef] [Green Version]
- Zhao, H.; Zhang, W.; Zhang, T.; Lin, Y.; Hu, Y.; Fang, C.; Jiang, J. Genome-wide MNase hypersensitivity assay unveils distinct classes of open chromatin associated with H3K27me3 and DNA methylation in Arabidopsis thaliana. Genome Biol. 2020, 21, 24. [Google Scholar] [CrossRef] [PubMed]
- Chen, S.; Zhou, Y.; Chen, Y.; Gu, J. fastp: An ultra-fast all-in-one FASTQ preprocessor. Bioinformatics 2018, 34, i884–i890. [Google Scholar] [CrossRef] [PubMed]
- Langmead, B.; Salzberg, S.L. Fast gapped-read alignment with Bowtie 2. Nat. Methods 2011, 9, 357–359. [Google Scholar] [CrossRef] [PubMed] [Green Version]
- Yong, Z.; Tao, L.; Meyer, C.A.; Eeckhoute, J.; Johnson, D.S.; Bernstein, B.E.; Nusbaum, C.; Myers, R.M.; Brown, M.; Wei, L. Model-based Analysis of ChIP-Seq (MACS). Genome Biol. 2008, 9, R137. [Google Scholar]
- Stuart, T.; Butler, A.; Hoffman, P.; Hafemeister, C.; Papalexi, E.; Mauck, W.M., 3rd; Hao, Y.; Stoeckius, M.; Smibert, P.; Satija, R. Comprehensive Integration of Single-Cell Data. Cell 2019, 177, 1888–1902. [Google Scholar] [CrossRef]
- Trozzi, F.; Wang, X.; Tao, P. UMAP as a Dimensionality Reduction Tool for Molecular Dynamics Simulations of Biomacromolecules: A Comparison Study. J. Phys. Chem. B 2021, 125, 5022–5034. [Google Scholar] [CrossRef]
- Trapnell, C.; Cacchiarelli, D.; Grimsby, J.; Pokharel, P.; Li, S.; Morse, M.; Lennon, N.J.; Livak, K.J.; Mikkelsen, T.S.; Rinn, J.L. The dynamics and regulators of cell fate decisions are revealed by pseudotemporal ordering of single cells. Nat. Biotechnol. 2014, 32, 381–386. [Google Scholar] [CrossRef] [Green Version]
- Langfelder, P.; Horvath, S. WGCNA: An R package for weighted correlation network analysis. BMC Bioinform. 2008, 9, 559. [Google Scholar] [CrossRef] [Green Version]
- Matsumoto, H.; Kiryu, H.; Furusawa, C.; Ko, M.S.H.; Ko, S.B.H.; Gouda, N.; Hayashi, T.; Nikaido, I.; Bar-Joseph, Z. SCODE: An efficient regulatory network inference algorithm from single-cell RNA-Seq during differentiation. Bioinformatics 2017, 33, 2314–2321. [Google Scholar] [CrossRef]
- Shannon, P.; Markiel, A.; Ozier, O.; Baliga, N.S.; Wang, J.T.; Ramage, D.; Amin, N.; Schwikowski, B.; Ideker, T. Cytoscape: A software environment for integrated models of biomolecular interaction networks. Genome Res. 2003, 13, 2498–2504. [Google Scholar] [CrossRef]
- Tu, X.; Mejía-Guerra, M.K.; Valdes Franco, J.A.; Tzeng, D.; Chu, P.-Y.; Shen, W.; Wei, Y.; Dai, X.; Li, P.; Buckler, E.S.; et al. Reconstructing the maize leaf regulatory network using ChIP-seq data of 104 transcription factors. Nat. Commun. 2020, 11, 5089. [Google Scholar] [CrossRef] [PubMed]
- Ricci, W.A.; Lu, Z.; Ji, L.; Marand, A.P.; Ethridge, C.L.; Murphy, N.G.; Noshay, J.M.; Galli, M.; Mejía-Guerra, M.K.; Colomé-Tatché, M. Widespread long-range cis-regulatory elements in the maize genome. Nat. Plants 2019, 5, 1237–1249. [Google Scholar] [CrossRef] [PubMed]
- Ran, X.; Zhao, F.; Wang, Y.; Liu, J.; Zhuang, Y.; Ye, L.; Qi, M.; Cheng, J.; Zhang, Y. Plant Regulomics: A data-driven interface for retrieving upstream regulators from plant multi-omics data. Plant J. 2020, 101, 237–248. [Google Scholar] [CrossRef] [PubMed]
- Supek, F.; Bošnjak, M.; Škunca, N.; Šmuc, T. REVIGO summarizes and visualizes long lists of Gene Ontology terms. PLoS ONE 2011, 6, e21800. [Google Scholar] [CrossRef] [Green Version]
- Bezrutczyk, M.; Zollner, N.R.; Kruse, C.P.S.; Hartwig, T.; Lautwein, T.; Kohrer, K.; Frommer, W.B.; Kim, J.Y. Evidence for phloem loading via the abaxial bundle sheath cells in maize leaves. Plant Cell 2021, 33, 531–547. [Google Scholar] [CrossRef]
- Nelson, T.; Langdale, J.A. Developmental Genetics of C4 Photosynthesis. Annu. Rev. Plant Physiol. Plant Mol. Biol. 1992, 43, 25–47. [Google Scholar] [CrossRef]
- Denton, A.K.; Ma, J.; Külahoglu, C.; Lercher, M.J.; Br?utigam, A.; Weber, A.P.M. Freeze-quenched maize mesophyll and bundle sheath separation uncovers bias in previous tissue-specific RNA-Seq data. J. Exp. Bot. 2017, 68, 147–160. [Google Scholar] [CrossRef] [Green Version]
- Vercruysse, J.; Van Bel, M.; Osuna-Cruz, C.M.; Kulkarni, S.R.; Storme, V.; Nelissen, H.; Gonzalez, N.; Inze, D.; Vandepoele, K. Comparative transcriptomics enables the identification of functional orthologous genes involved in early leaf growth. Plant Biotechnol. J. 2020, 18, 553–567. [Google Scholar] [CrossRef] [Green Version]
- Dong, P.; Tu, X.; Chu, P.Y.; Lã¼, P.; Zhu, N.; Grierson, D.; Du, B.; Li, P.; Zhong, S. 3D Chromatin Architecture of Large Plant Genomes Determined by Local A/B Compartments. Mol. Plant 2017, 10, 1497–1509. [Google Scholar] [CrossRef] [Green Version]
- Kulkarni, S.R.; Jones, D.M.; Vandepoele, K. Enhanced Maps of Transcription Factor Binding Sites Improve Regulatory Networks Learned from Accessible Chromatin Data. Plant Physiol. 2019, 181, 412–425. [Google Scholar] [CrossRef] [Green Version]
- Bailey, T.L.; Boden, M.; Buske, F.A.; Frith, M.; Grant, C.E.; Clementi, L.; Ren, J.; Li, W.W.; Noble, W.S. MEME SUITE: Tools for motif discovery and searching. Nucleic Acids Res. 2009, 37, W202–W208. [Google Scholar] [CrossRef] [PubMed]
- O’Malley, R.C.; Huang, S.C.; Song, L.; Lewsey, M.G.; Bartlett, A.; Nery, J.R.; Galli, M.; Gallavotti, A.; Ecker, J.R. Cistrome and Epicistrome Features Shape the Regulatory DNA Landscape. Cell 2016, 165, 1280–1292. [Google Scholar] [CrossRef] [PubMed] [Green Version]
- Mumbach, M.R.; Rubin, A.J.; Flynn, R.A.; Dai, C.; Khavari, P.A.; Greenleaf, W.J.; Chang, H.Y. HiChIP: Efficient and sensitive analysis of protein-directed genome architecture. Nat. Methods 2016, 13, 919–922. [Google Scholar] [CrossRef] [PubMed] [Green Version]
- Ré, D.; Capella, M.; Bonaventure, G.; Chan, R.L. Arabidopsis AtHB7 and AtHB12 evolved divergently to fine tune processes associated with growth and responses to water stress. BMC Plant Biol. 2014, 14, 150. [Google Scholar] [CrossRef] [PubMed] [Green Version]
- Simpson, K.; Quiroz, L.F.; Rodriguez-Concepcion, M.; Stange, C.R. Differential Contribution of the First Two Enzymes of the MEP Pathway to the Supply of Metabolic Precursors for Carotenoid and Chlorophyll Biosynthesis in Carrot (Daucus carota). Front. Plant Sci. 2016, 7, 1344. [Google Scholar] [CrossRef] [PubMed] [Green Version]
- Song, S.K.; Clark, S.E. POL and related phosphatases are dosage-sensitive regulators of meristem and organ development in Arabidopsis. Dev. Biol. 2005, 285, 272–284. [Google Scholar] [CrossRef] [Green Version]
- Zhu, X.; Thalor, S.K.; Takahashi, Y.; Berberich, T.; Kusano, T. An inhibitory effect of the sequence-conserved upstream open-reading frame on the translation of the main open-reading frame of HsfB1 transcripts in Arabidopsis. Plant Cell Environ. 2012, 35, 2014–2030. [Google Scholar] [CrossRef]
- Merchant, S.; Dreyfuss, B.W. Posttranslational Assembly of Photosynthetic Metalloproteins. Annu. Rev. Plant Physiol. Plant Mol. Biol. 1998, 49, 25–51. [Google Scholar] [CrossRef] [Green Version]
- Lobreaux, S.; Briat, J.F. Ferritin accumulation and degradation in different organs of pea (Pisum sativum) during development. Biochem. J. 1991, 274, 601–606. [Google Scholar] [CrossRef] [Green Version]
- Voss, I.; Koelmann, M.; Wojtera, J.; Holtgrefe, S.; Scheibe, R. Knockout of major leaf ferredoxin reveals new redox-regulatory adaptations in Arabidopsis thaliana. Physiol. Plant 2008, 133, 584–598. [Google Scholar] [CrossRef]
- Lin, D.; Zhang, L.; Mei, J.; Chen, J.; Piao, Z.; Lee, G.; Dong, Y. Mutation of the rice TCM12 gene encoding 2,3-bisphosphoglycerate-independent phosphoglycerate mutase affects chlorophyll synthesis, photosynthesis and chloroplast development at seedling stage at low temperatures. Plant Biol. 2019, 21, 585–594. [Google Scholar] [CrossRef] [PubMed]
- Lundquist, P.K.; Rosar, C.; Brautigam, A.; Weber, A.P. Plastid signals and the bundle sheath: Mesophyll development in reticulate mutants. Mol. Plant 2014, 7, 14–29. [Google Scholar] [CrossRef] [PubMed] [Green Version]
- Hwang, S.M.; Kim, D.W.; Woo, M.S.; Jeong, H.S.; Son, Y.S.; Akhter, S.; Choi, G.J.; Bahk, J.D. Functional characterization of Arabidopsis HsfA6a as a heat-shock transcription factor under high salinity and dehydration conditions. Plant Cell Environ. 2014, 37, 1202–1222. [Google Scholar] [CrossRef]
- Bienz, M.; Pelham, H.R. Mechanisms of heat-shock gene activation in higher eukaryotes. Adv. Genet. 1987, 24, 31–72. [Google Scholar] [PubMed]
- Broglie, R.; Coruzzi, G.; Keith, B.; Chua, N.H. Molecular biology of C4 photosynthesis in Zea mays: Differential localization of proteins and mRNAs in the two leaf cell types. Plant Mol. Biol. 1984, 3, 431–444. [Google Scholar] [CrossRef] [PubMed]
- Sheen, J.Y.; Bogorad, L. Differential expression of C4 pathway genes in mesophyll and bundle sheath cells of greening maize leaves. J. Biol. Chem. 1987, 262, 11726–11730. [Google Scholar] [CrossRef]
- Schuster, G.; Ohad, I.; Martineau, B.; Taylor, W.C. Differentiation and development of bundle sheath and mesophyll thylakoids in maize. Thylakoid polypeptide composition, phosphorylation, and organization of photosystem II. J. Biol. Chem. 1985, 260, 11866–11873. [Google Scholar] [CrossRef]
- Ngernprasirtsiri, J.; Chollet, R.; Kobayashi, H.; Sugiyama, T.; Akazawa, T. DNA methylation and the differential expression of C4 photosynthesis genes in mesophyll and bundle sheath cells of greening maize leaves. J. Biol. Chem. 1989, 264, 8241–8248. [Google Scholar] [CrossRef]
- Reeves, G.; Grange-Guermente, M.J.; Hibberd, J.M. Regulatory gateways for cell-specific gene expression in C4 leaves with Kranz anatomy. J. Exp. Bot. 2017, 68, 107–116. [Google Scholar] [CrossRef]
- Perduns, R.; Horst-Niessen, I.; Peterhansel, C. Photosynthetic Genes and Genes Associated with the C4 Trait in Maize Are Characterized by a Unique Class of Highly Regulated Histone Acetylation Peaks on Upstream Promoters. Plant Physiol. 2015, 168, 1378–1388. [Google Scholar] [CrossRef]
- Guo, J.; Grow, E.J.; Yi, C.; Mlcochova, H.; Maher, G.J.; Lindskog, C.; Murphy, P.J.; Wike, C.L.; Carrell, D.T.; Goriely, A.; et al. Chromatin and Single-Cell RNA-Seq Profiling Reveal Dynamic Signaling and Metabolic Transitions during Human Spermatogonial Stem Cell Development. Cell Stem Cell 2017, 21, 533–546. [Google Scholar] [CrossRef] [PubMed] [Green Version]
- Jia, G.; Preussner, J.; Chen, X.; Guenther, S.; Yuan, X.; Yekelchyk, M.; Kuenne, C.; Looso, M.; Zhou, Y.; Teichmann, S.; et al. Single cell RNA-seq and ATAC-seq analysis of cardiac progenitor cell transition states and lineage settlement. Nat. Commun. 2018, 9, 4877. [Google Scholar] [CrossRef] [PubMed] [Green Version]
- Zhang, T.Q.; Xu, Z.G.; Shang, G.D.; Wang, J.W. A Single-Cell RNA Sequencing Profiles the Developmental Landscape of Arabidopsis Root. Mol. Plant 2019, 12, 648–660. [Google Scholar] [CrossRef] [PubMed]
- Denyer, T.; Ma, X.; Klesen, S.; Scacchi, E.; Nieselt, K.; Timmermans, M.C.P. Spatiotemporal Developmental Trajectories in the Arabidopsis Root Revealed Using High-Throughput Single-Cell RNA Sequencing. Dev. Cell 2019, 48, 840–852. [Google Scholar] [CrossRef] [Green Version]
- Shulse, C.N.; Cole, B.J.; Ciobanu, D.; Lin, J.; Yoshinaga, Y.; Gouran, M.; Turco, G.M.; Zhu, Y.; O’Malley, R.C.; Brady, S.M.; et al. High-Throughput Single-Cell Transcriptome Profiling of Plant Cell Types. Cell Rep. 2019, 27, 2241–2247. [Google Scholar] [CrossRef] [PubMed] [Green Version]
- Yanagisawa, S. Dof1 and Dof2 transcription factors are associated with expression of multiple genes involved in carbon metabolism in maize. Plant J. 2000, 21, 281–288. [Google Scholar] [CrossRef] [PubMed]
- Kausch, A.P.; Owen, T.P., Jr.; Zachwieja, S.J.; Flynn, A.R.; Sheen, J. Mesophyll-specific, light and metabolic regulation of the C4 PPCZm1 promoter in transgenic maize. Plant Mol. Biol. 2001, 45, 1–15. [Google Scholar] [CrossRef]
- Wang, P.; Kelly, S.; Fouracre, J.P.; Langdale, J.A. Genome-wide transcript analysis of early maize leaf development reveals gene cohorts associated with the differentiation of C4 Kranz anatomy. Plant J. 2013, 75, 656–670. [Google Scholar] [CrossRef]
- Guo, M.; Liu, J.H.; Ma, X.; Luo, D.X.; Gong, Z.H.; Lu, M.H. The Plant Heat Stress Transcription Factors (HSFs): Structure, Regulation, and Function in Response to Abiotic Stresses. Front. Plant Sci. 2016, 7, 114. [Google Scholar] [CrossRef] [Green Version]
- Guo, X.L.; Yuan, S.N.; Zhang, H.N.; Zhang, Y.Y.; Zhang, Y.J.; Wang, G.Y.; Li, Y.Q.; Li, G.L. Heat-response patterns of the heat shock transcription factor family in advanced development stages of wheat (Triticum aestivum L.) and thermotolerance-regulation by TaHsfA2-10. BMC Plant Biol. 2020, 20, 364. [Google Scholar] [CrossRef]
- Tang, M.; Xu, L.; Wang, Y.; Cheng, W.; Luo, X.; Xie, Y.; Fan, L.; Liu, L. Genome-wide characterization and evolutionary analysis of heat shock transcription factors (HSFs) to reveal their potential role under abiotic stresses in radish (Raphanus sativus L.). BMC Genom. 2019, 20, 772. [Google Scholar] [CrossRef] [PubMed] [Green Version]
- Bi, H.; Zhao, Y.; Li, H.; Liu, W. Wheat Heat Shock Factor TaHsfA6f Increases ABA Levels and Enhances Tolerance to Multiple Abiotic Stresses in Transgenic Plants. Int. J. Mol. Sci. 2020, 21, 3121. [Google Scholar] [CrossRef] [PubMed]
- Hu, X.J.; Chen, D.; Lynne Mclntyre, C.; Fernanda Dreccer, M.; Zhang, Z.B.; Drenth, J.; Kalaipandian, S.; Chang, H.; Xue, G.P. Heat shock factor C2a serves as a proactive mechanism for heat protection in developing grains in wheat via an ABA-mediated regulatory pathway. Plant Cell Environ. 2018, 41, 79–98. [Google Scholar] [CrossRef] [PubMed]
- Sezgin Muslu, A.; Kadioglu, A. Role of abscisic acid, osmolytes and heat shock factors in high temperature thermotolerance of Heliotropium thermophilum. Physiol. Mol. Biol. Plants 2021, 27, 861–871. [Google Scholar] [CrossRef]
- Li, Z.; Zhang, L.; Wang, A.; Xu, X.; Li, J. Ectopic overexpression of SlHsfA3, a heat stress transcription factor from tomato, confers increased thermotolerance and salt hypersensitivity in germination in transgenic Arabidopsis. PLoS ONE 2013, 8, e54880. [Google Scholar] [CrossRef] [Green Version]
- Liu, A.L.; Zou, J.; Liu, C.F.; Zhou, X.Y.; Zhang, X.W.; Luo, G.Y.; Chen, X.B. Over-expression of OsHsfA7 enhanced salt and drought tolerance in transgenic rice. BMB Rep. 2013, 46, 31–36. [Google Scholar] [CrossRef] [Green Version]
- Constan, D.; Froehlich, J.E.; Rangarajan, S.; Keegstra, K. A stromal Hsp100 protein is required for normal chloroplast development and function in Arabidopsis. Plant Physiol. 2004, 136, 3605–3615. [Google Scholar] [CrossRef] [Green Version]
- Myouga, F.; Motohashi, R.; Kuromori, T.; Nagata, N.; Shinozaki, K. An Arabidopsis chloroplast-targeted Hsp101 homologue, APG6, has an essential role in chloroplast development as well as heat-stress response. Plant J. 2006, 48, 249–260. [Google Scholar] [CrossRef]
- Paupiere, M.J.; Tikunov, Y.; Schleiff, E.; Bovy, A.; Fragkostefanakis, S. Reprogramming of Tomato Leaf Metabolome by the Activity of Heat Stress Transcription Factor HsfB1. Front. Plant Sci. 2020, 11, 610599. [Google Scholar] [CrossRef]


Publisher’s Note: MDPI stays neutral with regard to jurisdictional claims in published maps and institutional affiliations. |
© 2022 by the authors. Licensee MDPI, Basel, Switzerland. This article is an open access article distributed under the terms and conditions of the Creative Commons Attribution (CC BY) license (https://creativecommons.org/licenses/by/4.0/).
Share and Cite
Tao, S.; Liu, P.; Shi, Y.; Feng, Y.; Gao, J.; Chen, L.; Zhang, A.; Cheng, X.; Wei, H.; Zhang, T.; et al. Single-Cell Transcriptome and Network Analyses Unveil Key Transcription Factors Regulating Mesophyll Cell Development in Maize. Genes 2022, 13, 374. https://doi.org/10.3390/genes13020374
Tao S, Liu P, Shi Y, Feng Y, Gao J, Chen L, Zhang A, Cheng X, Wei H, Zhang T, et al. Single-Cell Transcriptome and Network Analyses Unveil Key Transcription Factors Regulating Mesophyll Cell Development in Maize. Genes. 2022; 13(2):374. https://doi.org/10.3390/genes13020374
Chicago/Turabian StyleTao, Shentong, Peng Liu, Yining Shi, Yilong Feng, Jingjing Gao, Lifen Chen, Aicen Zhang, Xuejiao Cheng, Hairong Wei, Tao Zhang, and et al. 2022. "Single-Cell Transcriptome and Network Analyses Unveil Key Transcription Factors Regulating Mesophyll Cell Development in Maize" Genes 13, no. 2: 374. https://doi.org/10.3390/genes13020374