Article

Genome-Wide Identification of the SAMS Gene Family in Upland Cotton (Gossypium hirsutum L.) and Expression Analysis in Drought Stress Treatments

1
State Key Laboratory of Cotton Biology, Institute of Cotton Research of the Chinese Academy of Agricultural Sciences, Anyang 455000, China
2
Research Institute of Economic Crops, Xinjiang Academy of Agricultural Sciences, Urumqi 830091, China
3
Xinjiang Academy of Agricultural Sciences Kuqa County Upland Cotton Test Station, Xinjiang Academy of Agricultural Sciences, Kuqa 842000, China
*
Authors to whom correspondence should be addressed.
Genes 2022, 13(5), 860; https://doi.org/10.3390/genes13050860
Submission received: 9 April 2022 / Revised: 6 May 2022 / Accepted: 9 May 2022 / Published: 12 May 2022
(This article belongs to the Section Bioinformatics)

Abstract

:
Cotton is an important commercial crop whose growth and yield are severely affected by drought. S-adenosylmethionine (SAM) is widely involved in the plant stress response and growth regulation; however, the role of the S-adenosylmethionine synthase (SAMS) gene family in this process is poorly understood. Here, we systematically analyzed the expression of SAMS genes in Upland Cotton (Gossypium hirsutum L.). A total of 16 SAMS genes were identified, each with a similar predicted structure. A large number of cis-acting elements involved in the response to abiotic stress were predicted based on promoter analysis, indicating a likely important role in abiotic stress responses. The results of qRT-PCR validation showed that GhSAMS genes had different expression patterns after drought stress and in response to drought stress. Analysis of a selected subset of GhSAMS genes showed increased expression in cultivar Xinluzhong 39 (drought resistant) when compared to cultivar Xinluzao 26 (drought-sensitive) upland cotton. This study provides important relevant information for further study of SAMS genes in drought resistance research of upland cotton, which is helpful for drought-resistance improvement of upland cotton.

1. Introduction

When crops are subjected to drought stress, yield is reduced, and crop growth, development and metabolism are severely affected [1,2]. During the long-term evolution of crops, related defense mechanisms and metabolites were formed to cope with drought stress [3]. S-adenosylmethionine synthase is an important protein involved in plant stress response and is the only enzyme that catalyzes the synthesis of S-adenosylmethionine (SAM) [4]. SAM enzymes are widely involved in plant stress response, growth and development regulation [5,6]. Studies have reported that SAM is involved in methylation reactions, which mainly regulate gene expression and maintain genome functions [7]. In recent years, researchers have excavated and identified many SAMS genes [8,9]. There are four SAMS genes in Arabidopsis thaliana, among which, AtSAMS3 is mainly expressed in pollen [8,9]. In rice, there are three SAMS genes [10]. Related studies have shown that SAMS is involved in plant abiotic stress response. In tomato, Espartero et al. found that SAMS was differentially expressed in tomato after salt stress [11]. In cucumber, SAMS was induced to express after salt stress and participated in related regulation [12,13]. Interestingly, soybean SAMS was differentially expressed under drought and waterlogging stress, but not sensitive to NaCl and low-temperature treatments [14,15].
At present, upland cotton gene sequencing has been completed. With the development of sequencing technology, genome-wide analysis data provide us with important information on cotton response to drought stress when conducting related gene family analysis, and provide us with a theoretical basis for related research [16].
Although SAMS genes have been reported in crops such as Arabidopsis, rice and tomato, there are few related studies on the SAMS gene family in cotton, especially the role of SAMS genes in drought tolerance [10,17]. Therefore, identification of drought-resistance-related genes is helpful for drought-resistance improvement and breeding of upland cotton, and can provide candidate genes related to drought resistance. This also has important implications for the study of SAMS genes. For the first time, we performed the whole gene identification and analysis of the SAMS gene family in upland cotton. In this study, a total of 16 SAMS genes were identified in upland cotton, and the phylogenetic analysis, gene structure and chromosome distribution analysis of the upland cotton SAMS gene family were completed. In addition, the gene expression data of the GhSAMS gene in different tissues from the cotton database were extracted, and the expression patterns in different tissues were analyzed. At the same time, the response of the GhSAMS gene to drought stress in materials with different drought resistance was analyzed. In this study, the GhSAMS gene family was systematically analyzed, and the expression pattern under drought stress was analyzed to provide a relevant theoretical basis for future research on the cotton SAMS gene family.

2. Materials and Methods

2.1. Sequence Identification of SAMS Proteins

The upland cotton (Gossypium hirsutum L., ZJU v2.0) genome sequence for this study was downloaded from CottonFGD (http://cottonfgd.org/ accessed on 8 April 2022) [18]. The genomic data of Arabidopsis thaliana (Arabidopsis thaliana L.) were downloaded from the Phytozome v12 database (http://phytozome.jgi.doe.gov/pz/portal.html accessed on 8 April 2022) [19].
The Hidden Markov Model (HMM) (PF02772, PF02773, PF00438) of S-adenosylmethionine synthase with the keyword “S-adenosylmethionine synthase” was downloaded from the Pfam database (https://pfam.xfam.org/ accessed on 8 April 2022) [20], and the S-adenosylmethionine synthase protein sequence was obtained by BLAST alignment in the local protein database by HMMER3.0 software (e-value 10−5) (//hmmer.org) [21]. The conserved domain of “S-adenosylmethionine synthase” was further examined by Pfam 32.0 (http://pfam.xfam.org/ accessed on 8 April 2022) and NCBI-CDD (http://www.ncbi.nlm.nih.gov/cdd accessed on 8 April 2022) [22], and other redundant sequences were manually removed. Physicochemical properties of SAMS proteins were calculated and subcellular localization predictions obtained using ProtParam (https://web.expasy.org/protparam/ accessed on 8 April 2022) [23] and CELLO RESULTS (http://cello.life.nctu.edu.tw/ accessed on 8 April 2022) online software [24]. In addition, the hydrophilicity (GRAVY) of SAMS protein was analyzed using ProtParam online tool (http://web.expasy.org/protparam accessed on 8 April 2022). Selected SAMS genes were named by their chromosomal location (bp) on the At subgenomic chromosome and the Dt subgenomic chromosome.

2.2. Analysis of Phylogenetic, Gene Structure and Conserved Motif Characteristics

The sequences of SAMS proteins of three plant species, cotton, Arabidopsis and rice, were analyzed using MEGA7.0 [25], and ClustalX [26] was used for multiple sequence alignment after importing the sequences. Neighbor-joining (NJ) methods and maximum similarity (ML) were used in the analysis, both with 1000 bootstrap replicates [27,28]. The exon–intron structure of the SAMS genes was analyzed using GSDS 2.0 (http://gsds.cbi.pku.edu.cn/ accessed on 8 April 2022) [29]. Conserved domains of SAMS proteins were analyzed by MEME (http://meme.sdsc.edu/meme/cgi-bin/meme.cgi accessed on 8 April 2022) [30].

2.3. Chromosomal Location, Collinearity and Promoter Analysis

Chromosome-specific positions of SAMS genes were obtained by setting default search criteria in the Phytozome database and cottonFGD database. The upland cotton SAMS genes showed different specific distributions on the chromosomes of the At subgenome and the Dt subgenome, and then according to their specific physical locations (bp), the distribution map of the SAMS genes on the upland cotton chromosomes was drawn in the TBtools software. [31]. Collinearity of homologous genes of SAMS proteins in upland cotton and Arabidopsis was analyzed by MCScanX (http://chibba.pgml.uga.edu/mcscan2/ accessed on 8 April 2022) [32], and gene duplication events between the two were visualized using TBtools. The 2000 bp promoter sequence of the upland cotton SAMS genes was downloaded from cottonFGD database. PLACE (http://www.dna.affrc.go.jp/PLACE accessed on 8 April 2022) was used to analyze the promoter sequences of upland cotton SAMS genes [33].

2.4. Digital Expression Analysis of SAMs Genes in Cotton

The FPKM (fragments per kilobase per million reads) values for the transcriptome data of six tissues (Sepal, Leaf, Pistil, Root, Stem, and Torus) of the upland cotton SAMS gene were downloaded from the cottonFGD database. At the same time, the gene expression data of GhSAMS gene under stress such as drought and salinity were obtained. The obtained data were finally visualized and the heat map was mapped by the TBtools software.

2.5. Drought Treatment and PCR (qRT-PCR) Analysis of Cotton Drought Resistant Materials

After sterilizing upland cotton seeds (Xinluzhong 39 (drought resistant) and Xinluzao 26 (drought-sensitive) with 75% ethanol for 5 min, the surfaces were re-sterilized with 0.5% sodium hypochlorite (NaClO), and then the surfaces were rinsed again with sterile water. [32,34,35]. The seeds were then placed in a Petri dish lined with moistened filter paper and transferred to an incubator until germination. Seedlings of uniform size were then grown in sterile soil to the three true leaf stages at 25 °C and a 16/8 h (light/dark) photoperiod [32,35]. The soil drought stress test treatment was carried out at the stage of growing to three true leaves, and cotton roots, stems and leaves were collected at 0, 1, 3, 6, 12 and 24 h, respectively (the stress treatment lasted 24 h). the collected sample material was stored in an ultra-low temperature freezer at −80 °C.
The total RNA of the drought stress experimental samples was extracted using an RNA kit (TIANGEN Biotech, Beijing, China), and the first-strand cDNA was synthesized by reverse transcription. The final PCR amplification product was verified by 2% agarose gel electrophoresis. The qRT-PCR assay was performed in ABI Prism7500, the internal reference control gene was UBQ7, and each sample was replicated 3 times (including biological replicates). Finally, the 2−ΔΔCt method was used to analyze the expression of cotton SAMS genes [36].

2.6. Protein Interaction Network Analysis of GhSAMS

Through protein homology analysis in the Arabidopsis information resource database (https://www.arabidopsis.org/ accessed on 8 April 2022), the homologous genes of GhSAMS were screened out and submitted to the STRING (https://string-db.org/ accessed on 8 April 2022) database together. The relationship between the Arabidopsis protein–protein interaction network and the cotton protein–protein interaction network was obtained through the STRING database, respectively. Finally, through the comparison of Arabidopsis interaction genes, the homologous genes of upland cotton were screened, the interaction network of GhSAMS was analyzed in combination with the interaction genes of upland cotton, and the Cytoscape-3.8.2 software was used for visualization [37,38].

3. Results

3.1. Identification of SAMS Genes in Upland Cotton

Different transcripts and redundant sequences of the same gene were manually checked and deleted by screening the B-box domain. Ultimately, a total of 16 SAMS sequences were identified in upland cotton (Table 1). A sequential numbering was performed according to the order of the GhSAMS genes in the chromosomal location (Table 1).
The physicochemical properties of all the upland cotton SAMS proteins were further analyzed, and the results showed that all the upland cotton SAMS proteins were very different in terms of protein length, protein molecular weight (MW) and isoelectric point (pI). Upland cotton SAMS proteins have an average length of 383 amino acids and vary in length from 256 (GhSAMS3) to 393 (GhSAMS1) amino acids (Table 1). The isoelectric point (pI) values and molecular weights of the upland cotton SAMS protein sequences ranged from 5.48 to 8.73 and 28,120.07 to 43,090.84 Da, respectively. Subcellular localization prediction results showed that the localization predictions of 16 SAMS proteins were all displayed in the cytoplasm. The overall mean of the hydrophilicity (GRAVY) scores for all SAMS proteins was negative, indicating that SAMS proteins are hydrophilic and likely localized in the cytosol, which is consistent with predictions of subcellular localization (Table 1).

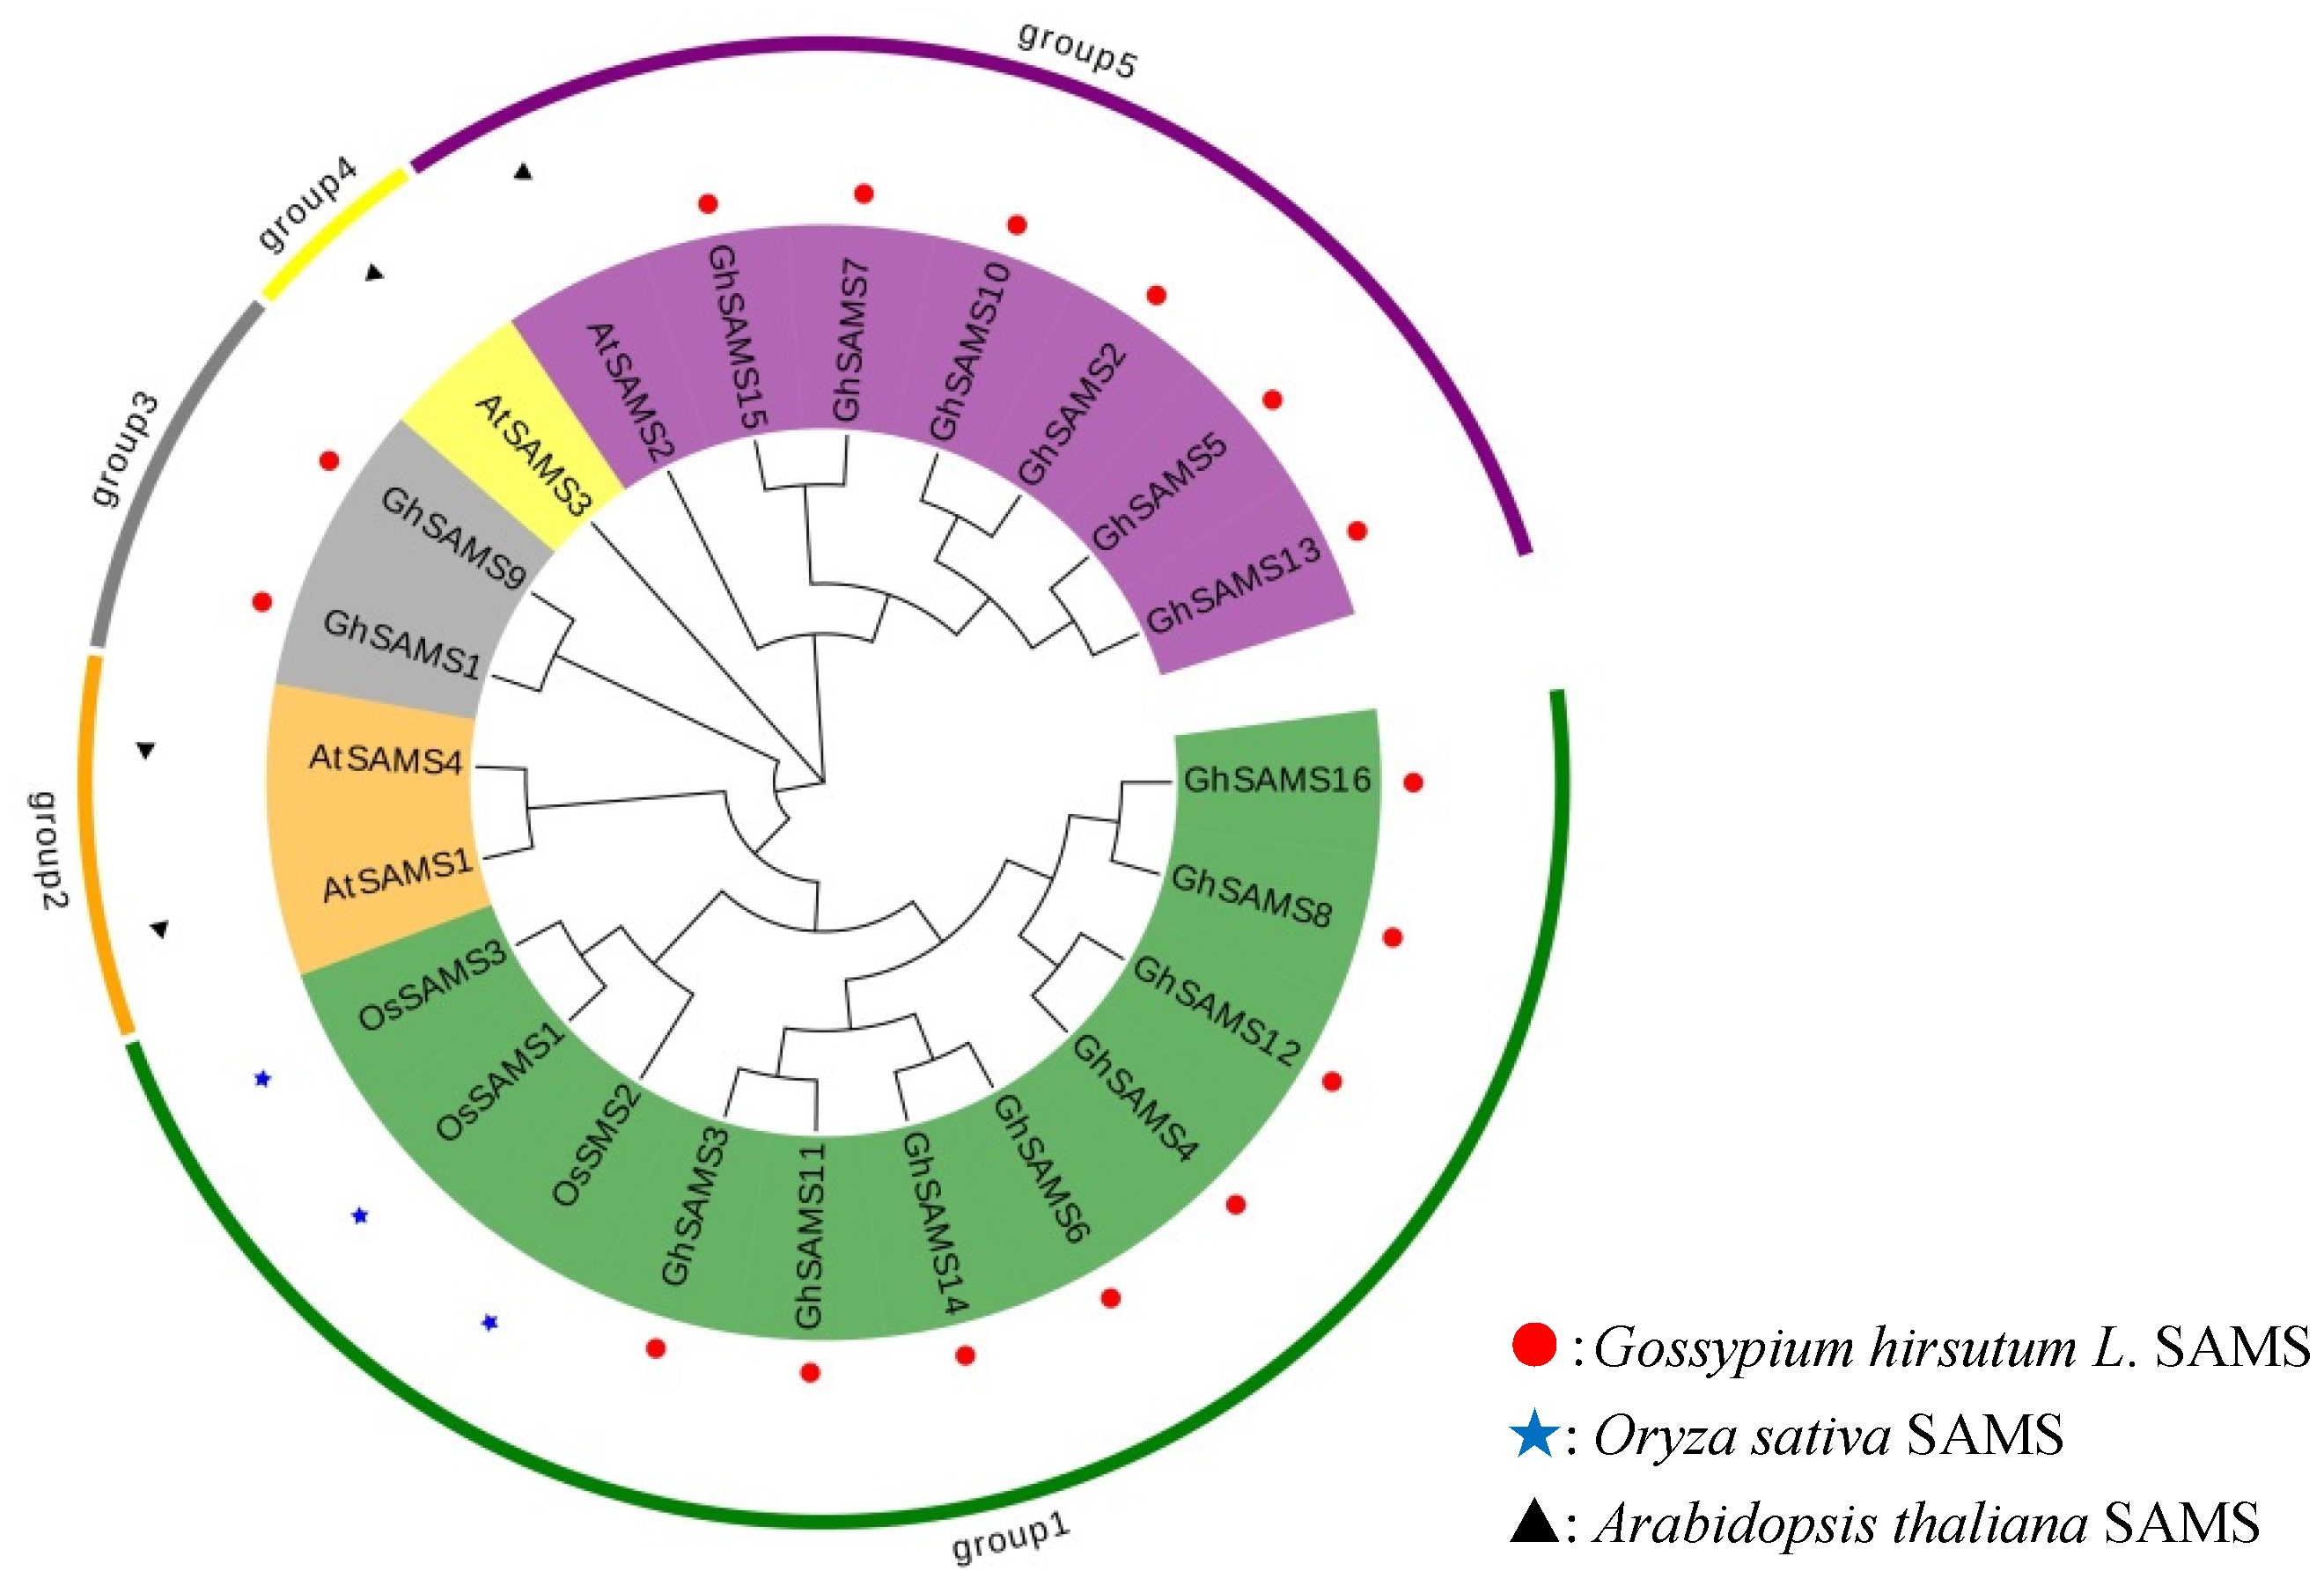
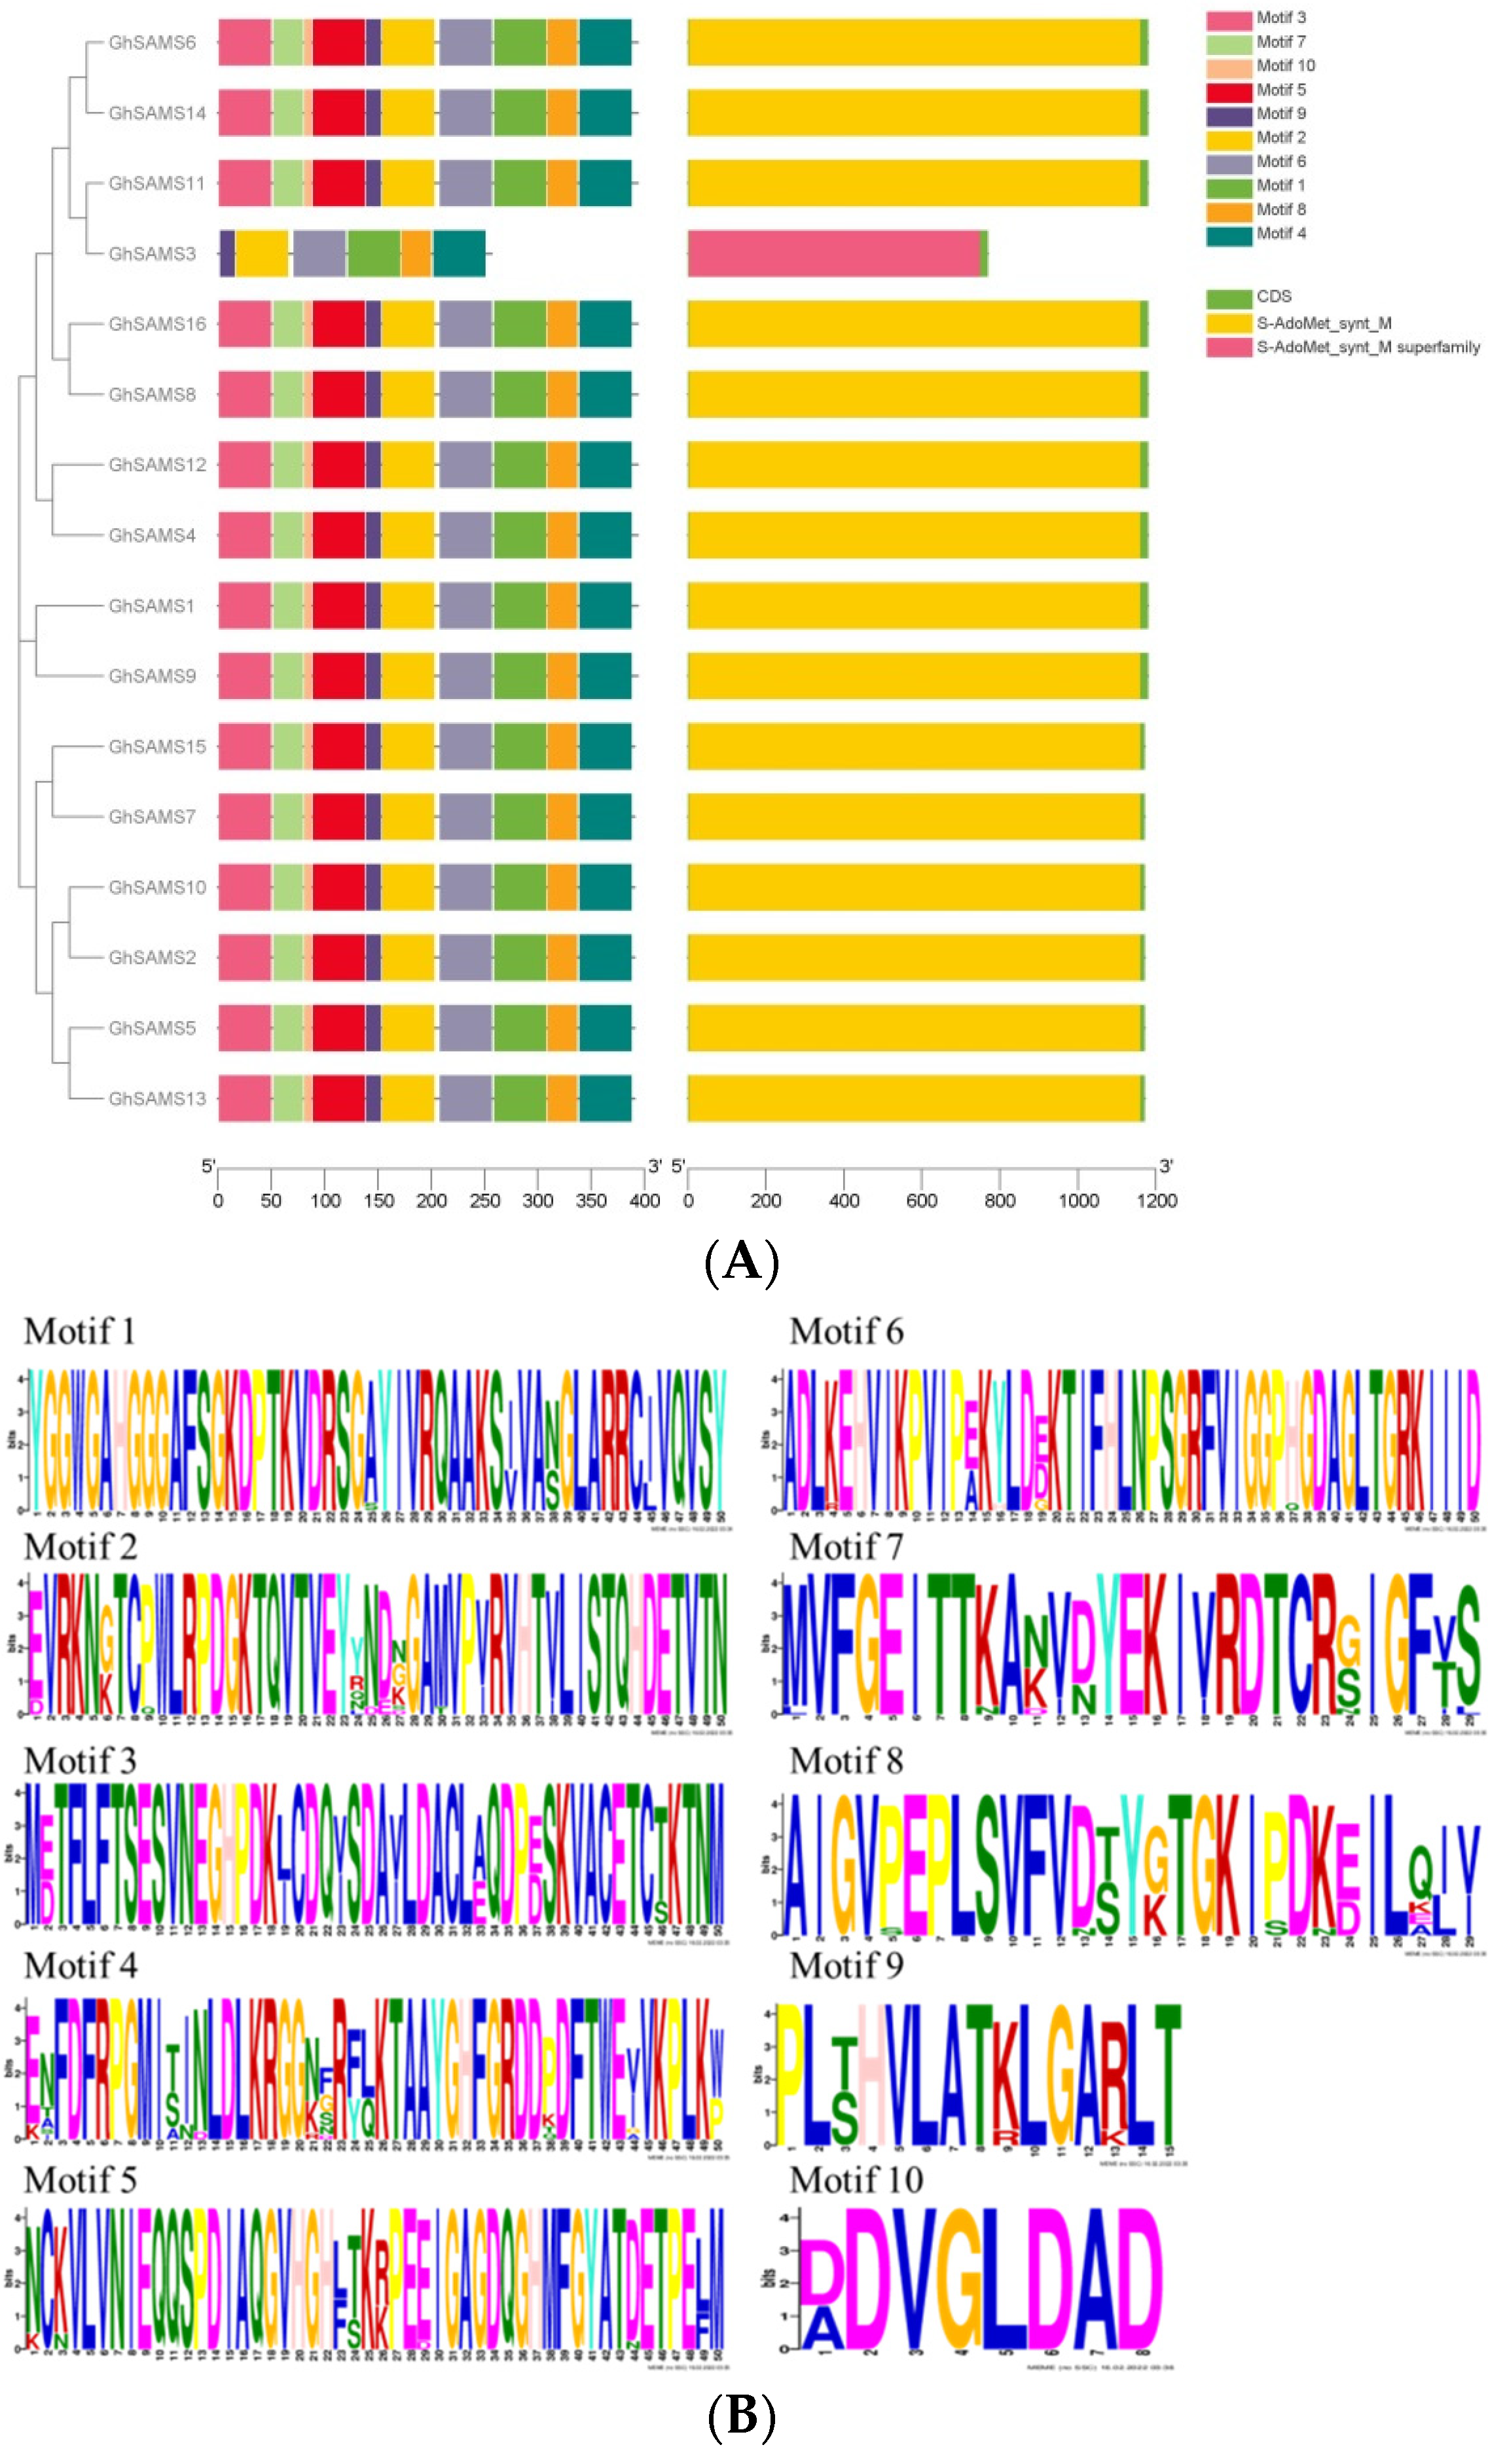
3.2. Phylogenetic, Gene Structure and Motif Identification of Upland Cotton SAMS Genes

To analyze the evolutionary relationship of SAMS genes, we performed a phylogenetic analysis of the conserved sequences of 21 different SAMS proteins. These include 16 upland cotton SAMS sequences, 3 rice SAMS sequences and 5 Arabidopsis sequences. The phylogenetic tree in this study divided SAMS proteins into five categories and the results are shown in Figure 1. The first group includes 11 members, including 8 members of cotton and 3 members of rice; the second group includes 2 members, mainly Arabidopsis thaliana sequences; the third group includes 2 members of cotton; the fourth group includes 1 member of Arabidopsis; and the fifth group includes 6 members of cotton and 1 member of Arabidopsis (Figure 1).
Analysis of the cotton SAMS gene structure reveals a rare distribution of exonic regions; the key evolutionary changes in SAMS genes in the cotton genome are shown. Among them, the shortest gene among all SAMS genes is GhSAMS3 with a length of only 771 bp, while the longest identified is GhSAMS1 with a genome sequence of 1182 bp (Table 1). The clustering among all genes of cotton SAMS showed a highly similar gene structure, and the gene structure was almost the same with little difference (Figure 2A).
The S-adenosylmethionine synthase domain is about 300 amino acid residues long and is considered a key element. Motifs of SAMS were predicted by the MEME program, and ten different motifs were identified based on the alignment of conserved domains in GhSAMS (Figure 2) where the conservation of SAMS protein sequence positions is represented by the cumulative height of all letters, and the frequency of amino acids is represented by the height of the letters. The details of the motifs are listed in Table S1. The predicted structure of SAMS proteins can be divided into two categories through the results of prediction analysis, which are different in upland cotton. It contains two types, namely, GhSAMS3 is an S-AdoMet_synt_M superfamily, and the rest are AdoMet_synt_M types (Figure 2A). The distributed and relative positions of motifs in conserved regions of GhSAMS proteins are relatively consistent and may be decisive for the development of specific phenotypes.

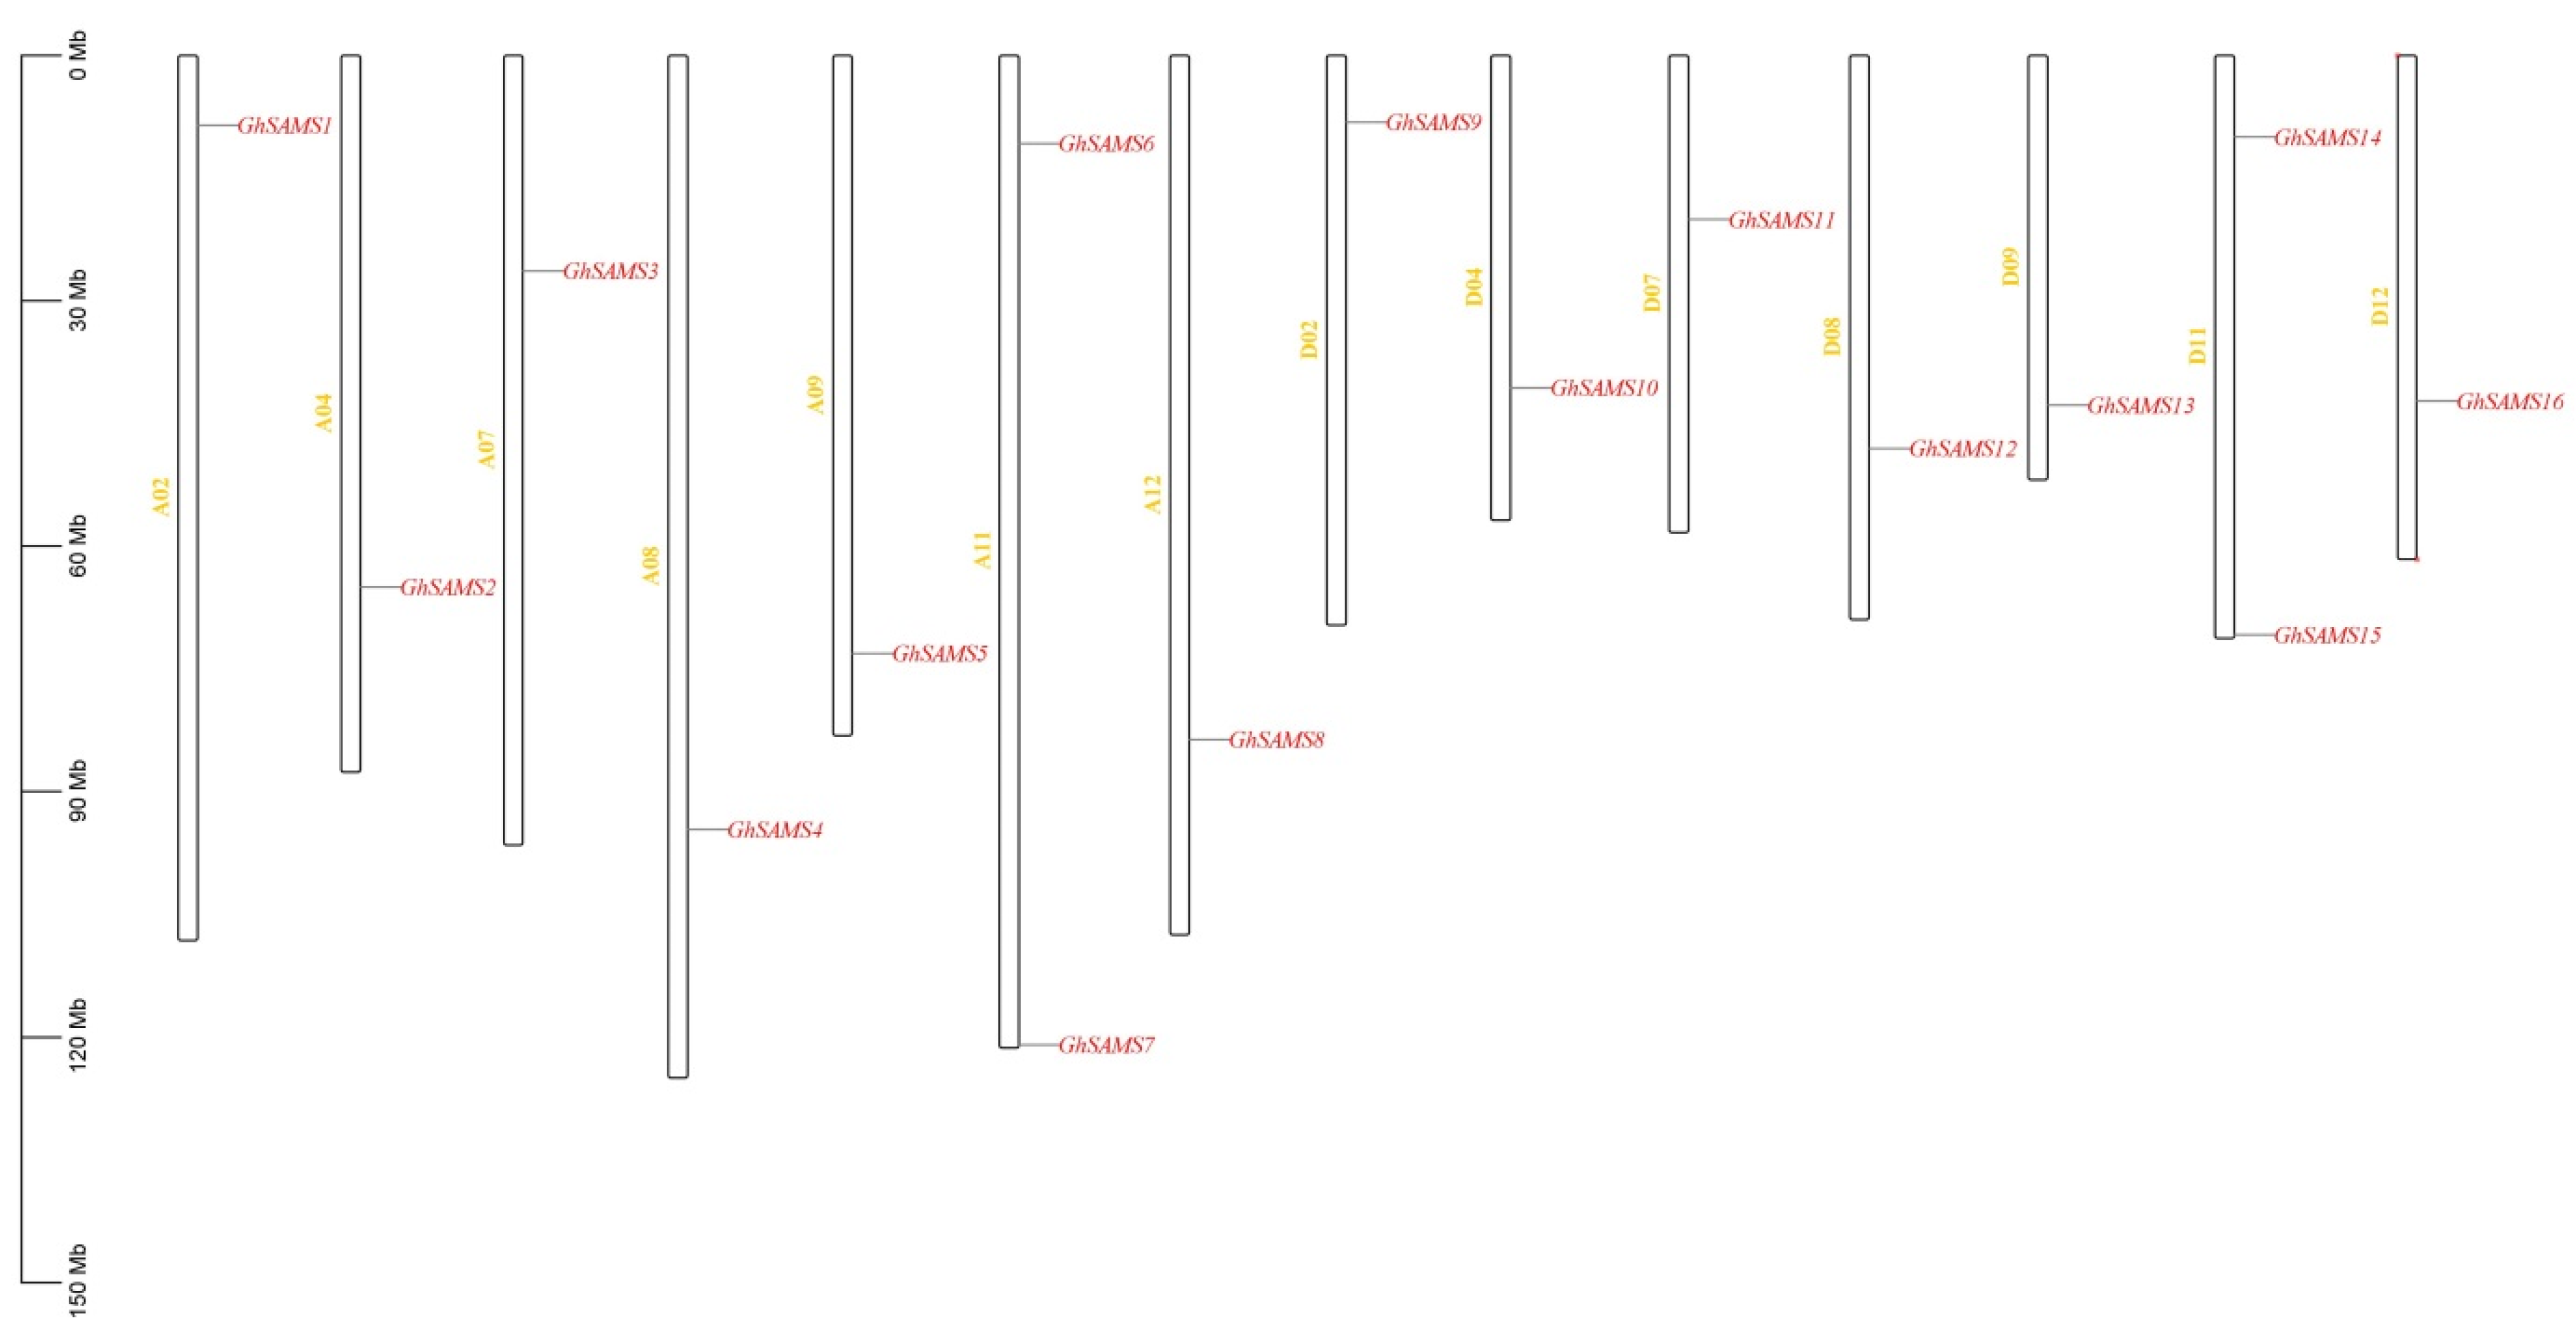
3.3. Chromosomal Location, Collinearity and Promoter Analysis of the SAMS Genes of Upland Cotton

Mapping cotton SAMS genes to their chromosomes, the results showed that 16 SAMS genes were evenly distributed on 14 chromosomes. Meanwhile, the exact position (in bp) of each cotton SAMS gene on the cotton chromosome is given in Table 1. Each chromosome contains only one gene (Figure 3), and the location of each cotton SAMS gene also varies. Interestingly, the mapping results showed that the numbers of GhSAMS genes in the At subgenome and Dt subgenome of upland cotton were basically the same; this shows that there is no obvious preference for the retention and loss of GhSAMS genes on homologous chromosomes between subgenomes. On different chromosomes, most of the GhSAMS genes are located at opposite ends of the chromosome (upper or lower end). (Figure 3). However, the GhSAMS genes were evenly distributed on the two homologous chromosomes in the two subgenomes of the tetraploid upland cotton, but the distribution on chromosomes was uneven, and uneven distribution is independent of chromosome length. (Figure 3).
To fully understand the collinearity between cotton and Arabidopsis SAMS gene families, combinatorial analysis of cotton and Arabidopsis SAMS genes was performed. The results of collinearity analysis showed that there were 14 (87.5%) collinear gene pairs in the upland cotton and Arabidopsis genomes. We draw a collinearity comparison plot between cotton and Arabidopsis and listed the details of the homologous gene pairs in Table S2. There were 14 pairs of homologous SAMS genes between upland cotton and Arabidopsis, of which 6 pairs were shown between the A genome of upland cotton and the Arabidopsis genome, and 8 pairs were shown between the D genome and the Arabidopsis genome (Figure 4). The results of the collinearity analysis revealed that the main expansion mechanism of the SAMS gene family is WGD/segmented and scattered duplication events, rather than proximal and tandem duplication events.
Analysis of cis-acting elements in the SAMS genes promoter region using PLACE can predict the relevant functions of the SAMS genes in upland cotton. Fourteen cis-acting elements were mainly included in the predicted results of PLACE analysis (Figure 5). Three genes detected MYB binding sites in the promoter regions and were involved in the regulation of flavonoid biosynthesis-related genes. MYB binding sites related to drought induction were detected in the promoter region of eight genes. In addition, an enhancer-like element involved in anoxic specific inducibility was identified in the promoters of 28 genes. At the same time, cis-acting elements involved in defense and stress response and enhancer-like elements related to hypoxia-specific induction were also identified in the promoter regions of 12 genes. These data may suggest that the upland cotton SAMS genes play important roles in response to various abiotic stresses. (Figure 5).

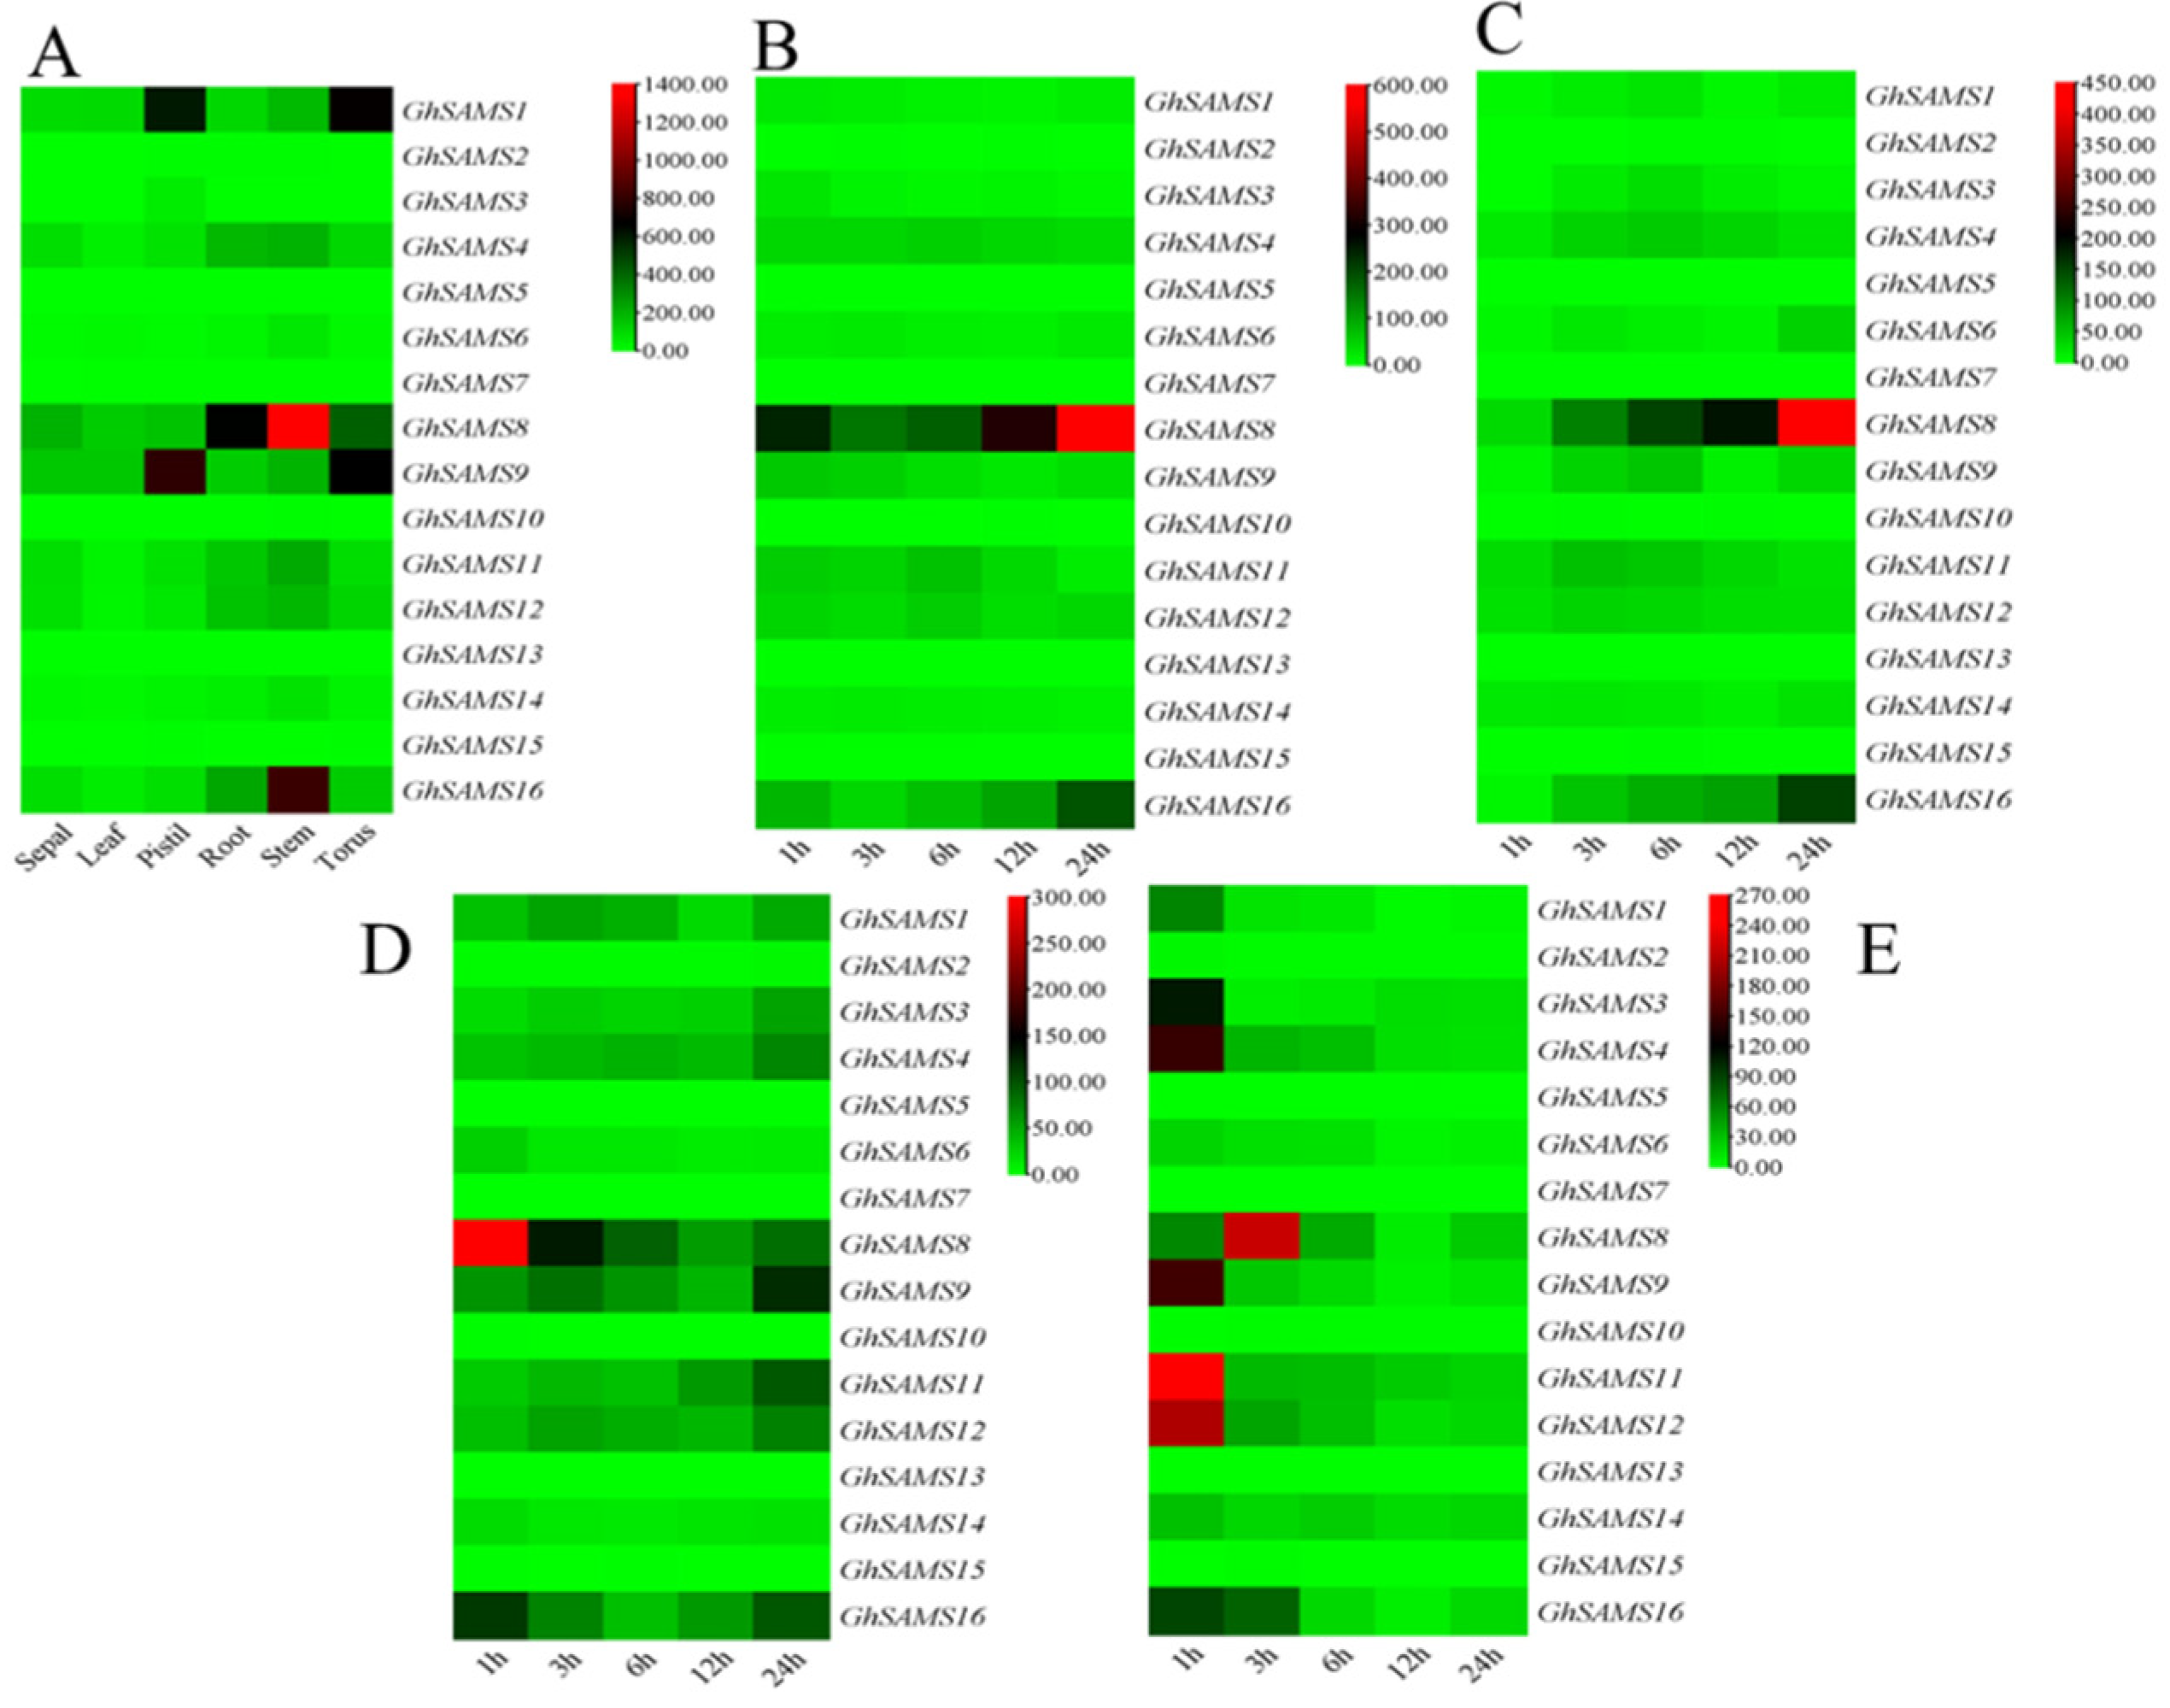
3.4. Expression Analysis of SAMS Genes in Upland Cotton

The expression levels of SAMS genes in multiple tissue types were analyzed through previously published RNA-seq data to analyze the critical role of SAMS genes in organ development in upland cotton. According to the heat map, we found that GhSAMS1 and GhSAMS9 were specifically expressed in pistils and receptacles, while GhSAMS8 and GhSAMS16 were mainly expressed in stems and roots, and to a lesser extent in other tissues. GhSAMS4, GhSAMS11 and GhSAMS12 were also specifically expressed in stems and roots (Figure 6).
The expression levels of SAMS genes under abiotic stresses such as drought, salt, heat and cold were further analyzed by RNA-seq data. The results of heat map analysis showed that GhSAMS8 and GhSAMS16 were significantly up-regulated at 24 h of stress (Figure 6). However, GhSAMS4, GhSAMS11 and GhSAMS12 were significantly up-regulated at 6 h of stress. The expression under salt stress was basically the same as that under drought stress. Under heat stress, GhSAMS8 and GhSAMS16 were significantly up-regulated at 1 h, while the expression levels of GhSAMS4, GhSAMS9, GhSAMS11 and GhSAMS12 were significantly higher at 24 h. Under low-temperature stress, all the above genes except GhSAMS8 were significantly up-regulated at 1 h of stress, while GhSAMS8 was significantly up-regulated at 3 h of stress (Figure 6).

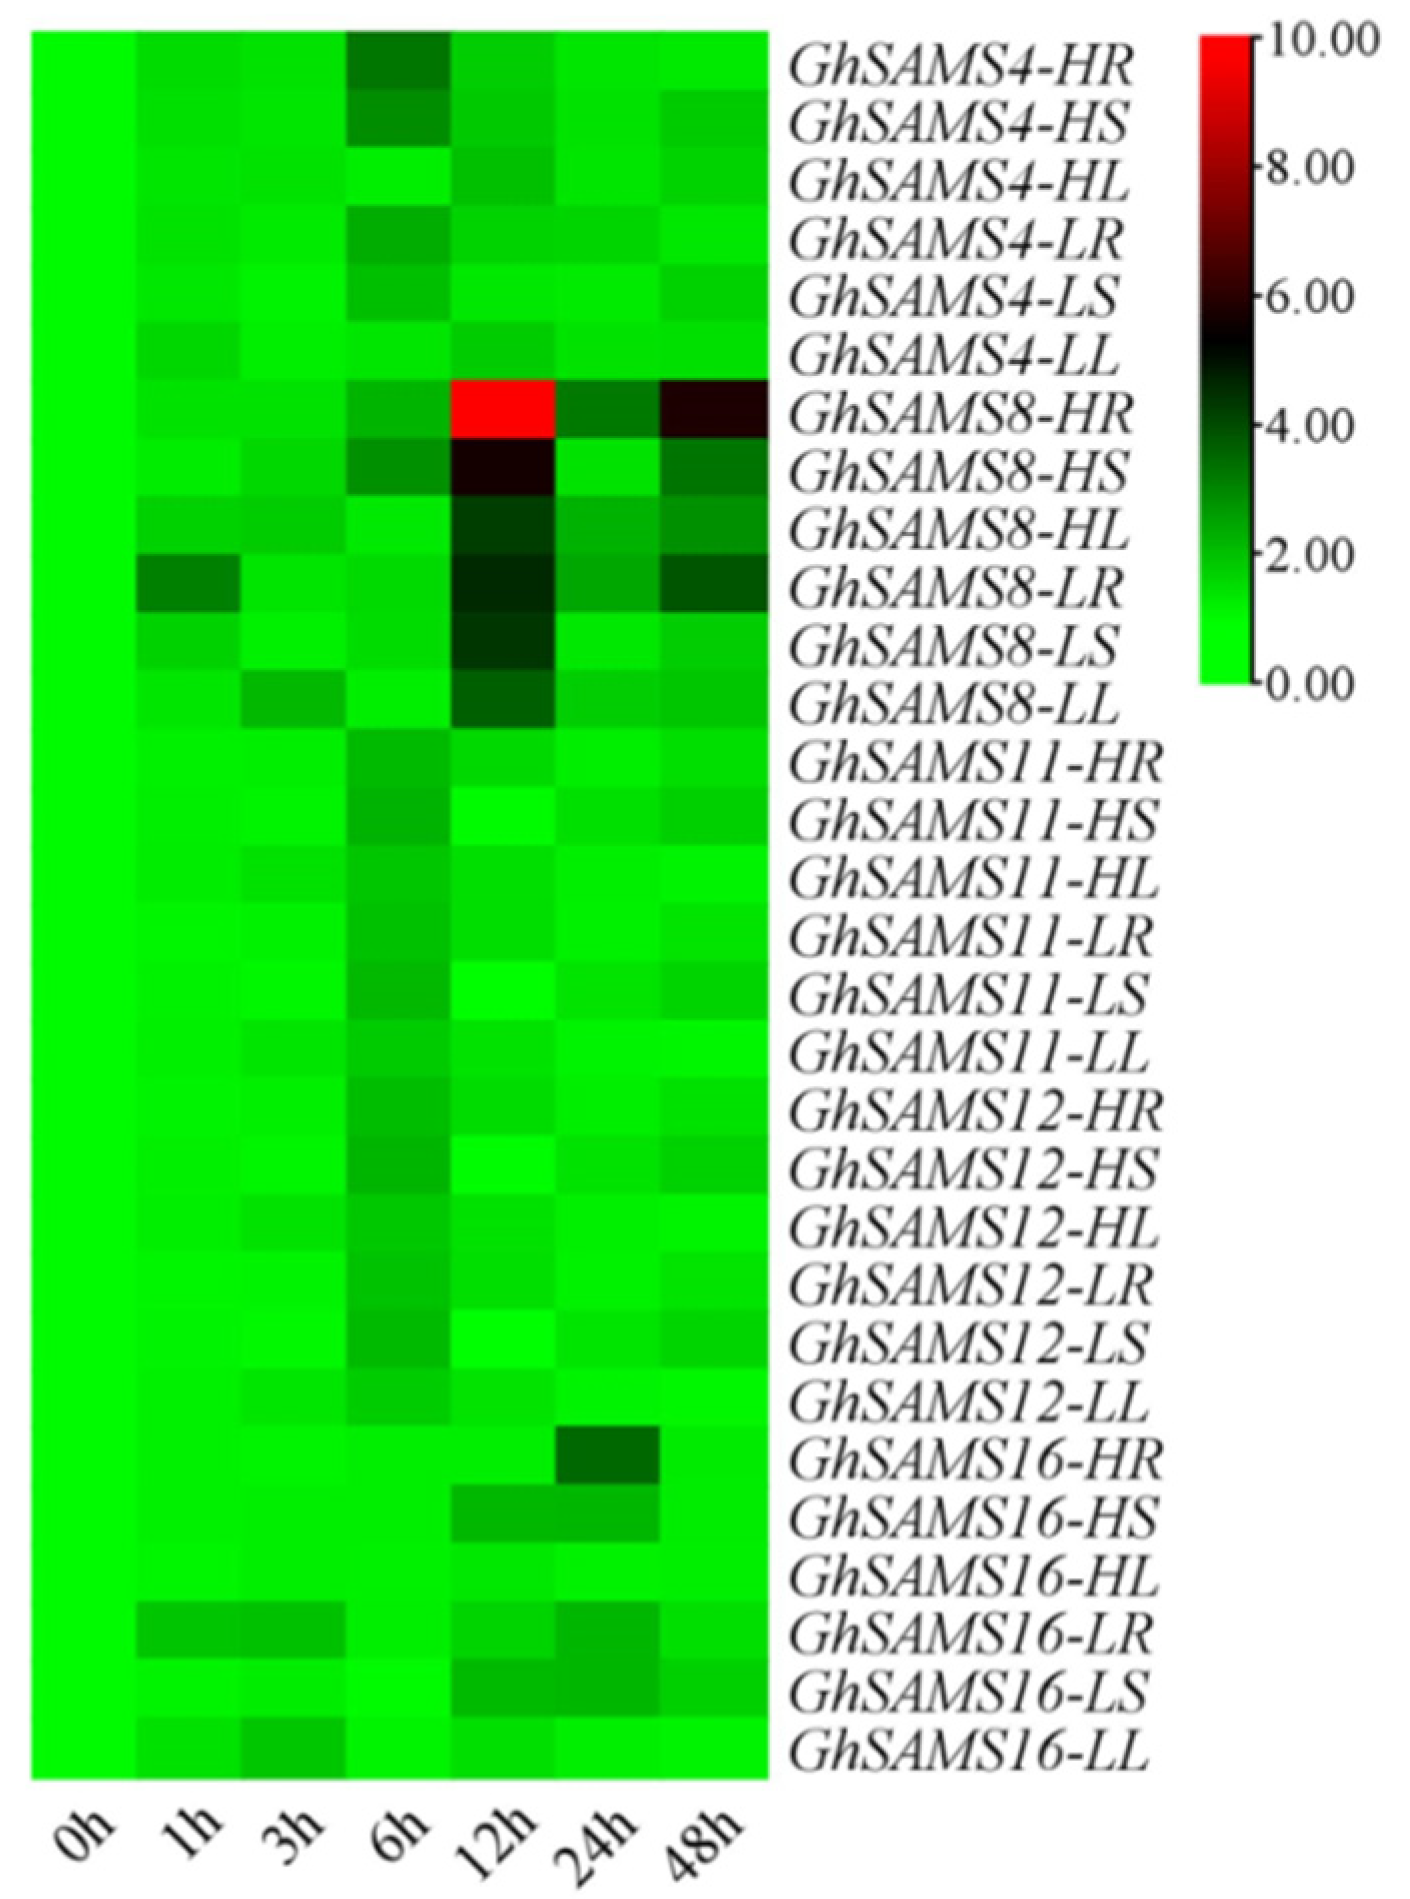
3.5. Expression Analysis of GhSAMS after Drought Stress

Information about gene function can be provided by analysis of the expression level of the gene. To analyze the role of GhSAMS genes in abiotic stress response, from the results obtained from the RNA-seq data analyzed in the previous section, five genes were selected because they may play a role in drought stress response. The expression levels of the five candidate genes were analyzed by qRT-PCR after 1 h, 3 h, 6 h, 12 h, 24 h and 48 h after drought stress in Xinluzhong 39 and Xinluzao 26 upland cotton varieties. Gene-specific primers are listed in Table S3. The results of the qRT-PCR analysis showed that these five genes responded to drought stress through changes in their expression patterns during the drought stress in Xinluzhong 39 and Xinluzao 26. Xinluzao 26 and Xinluzhong 39 showed sensitivity and resistance to drought stress, respectively, after being subjected to drought stress. The results showed that GhSAMS genes were induced at different time points after drought stress and rapidly reached the peak expression level. The results of the heat map analysis showed that the five GhSAMS genes all showed different degrees of up-regulation (>2-fold) and expression after drought stress. The results of the heat map analysis showed that the five GhSAMS genes were up-regulated (>2-fold) to varying degrees in both drought-sensitive cultivar Xinluzao 26 and drought-resistant cultivar Xinluzhong 39 after being subjected to drought stress. As shown in Figure 7, especially when drought stress was for 12 h, the expression of the GhSAMS8 gene was up-regulated (>2-fold) in drought-resistant cultivar Xinluzhong 39, and was significantly higher than that in drought-sensitive cultivar Xinluzao 26. GhSAMS4, GhSAMS11 and GhSAMS12 showed the highest expression levels in drought-resistant cultivar Xinluzhong 39 at 6 h, and were more than 1-fold higher than drought-sensitive material Xinluzao 26 at 6 h (Figure 7). The overall expression level of GhSAMS16 was the highest at 24 h, which was more than onefold higher than that of Xinluzao 26 (Figure 7). Comparative analysis of GhSAMS genes expression patterns at six time points after drought stress treatment showed that the expression levels of five genes in cultivar Xinluzhong 39 were higher than those in cultivar Xinluzao 26 (Figure 7). These results suggest that all five selected genes are induced by drought stress, even though their expression levels differed after stress.

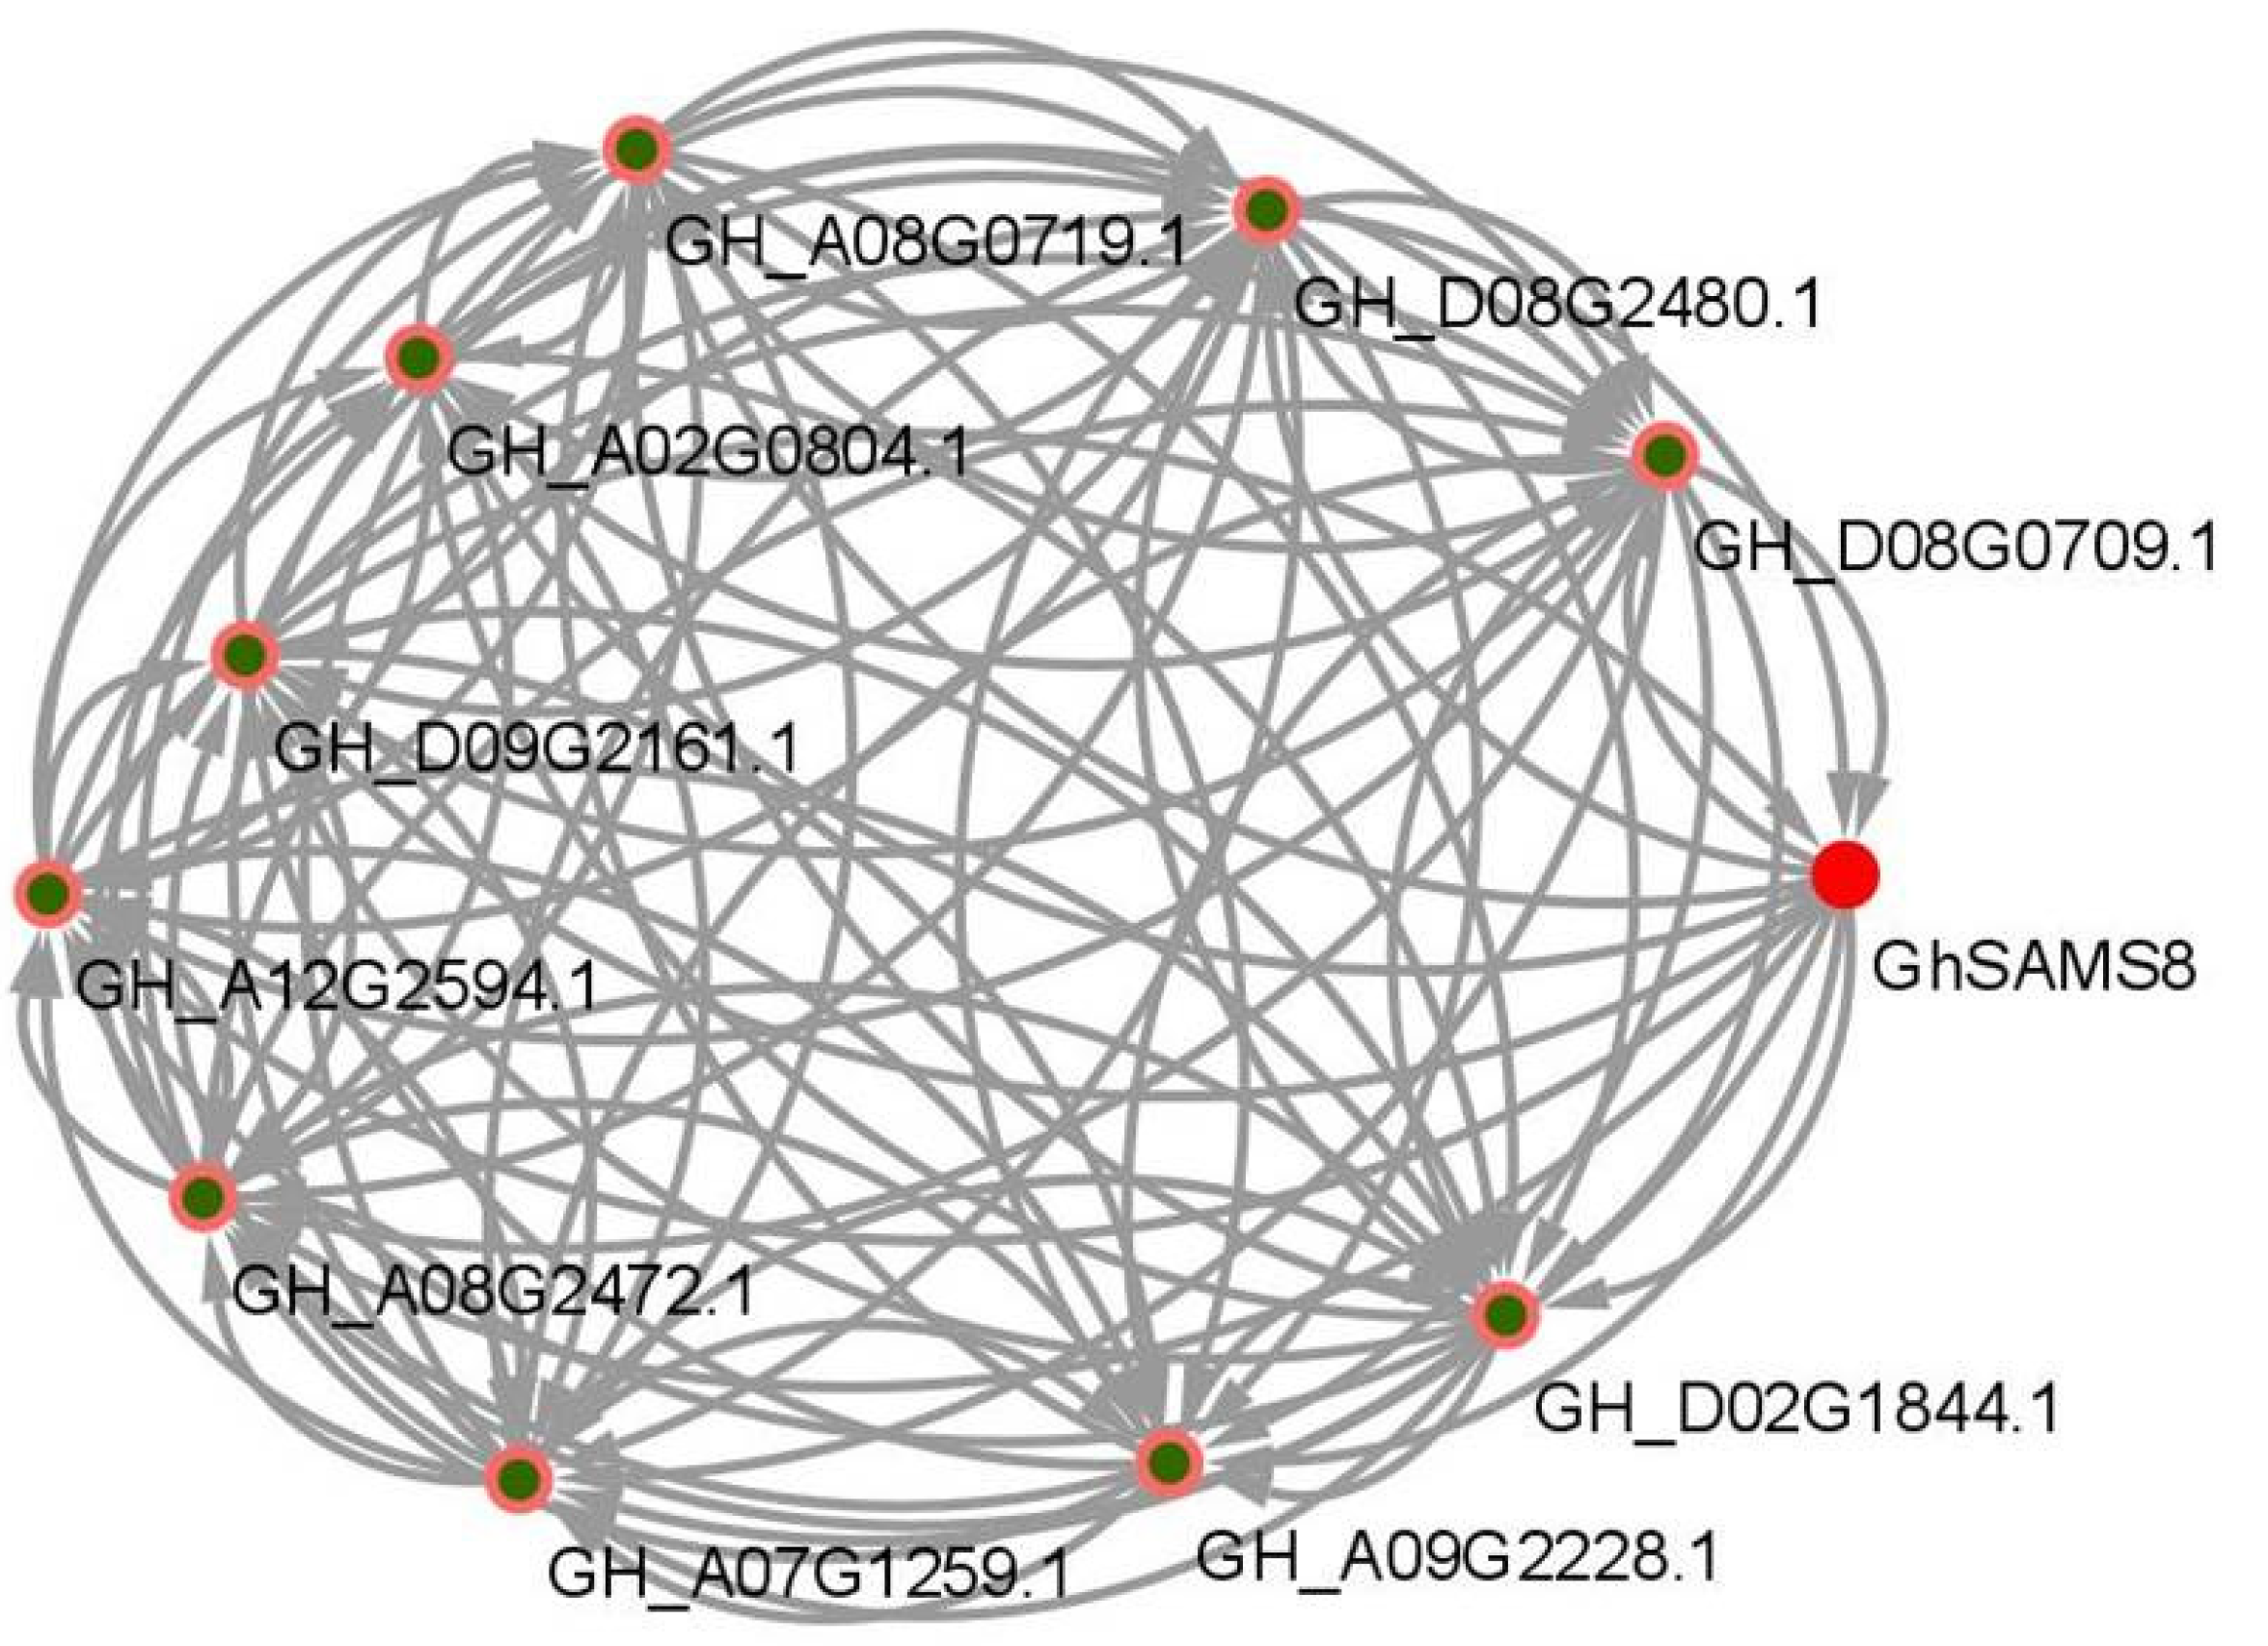
3.6. GhSAMS Protein Interaction Network Analysis

Most proteins cannot directly participate in the stress response of plants alone, and many physiological processes in plants are completed through protein–protein interactions [39]. In order to analyze and understand the molecular mechanism of drought tolerance of the GhSAMS8 gene, the interaction network between the GhSAMS8 gene protein and other upland cotton proteins was constructed based on the Arabidopsis homologous gene and its own interaction network (Figure 8). The analysis results showed that the GhSAMS8 protein interacts with 10 upland cotton proteins. Only GH_D08G0709.1, GH_D08G2480.1 and GH_D09G2161.1 were located upstream of GhSAMS8, suggesting that GH_D08G0709.1, GH_D08G2480.1 and GH_D09G2161.1 may interact with the GhSAMS8 domain. More genes were bound to the downstream S-AdoMet_synt_M domain of GhSAMS8, which further indicated the complex function of the SAMS gene family and the potential role of GhSAMS8 in response to drought stress in upland cotton (Figure 8).

4. Discussion

In this study, we identified 16 SAMS genes in upland cotton, compared with 5 and 3 reported in Arabidopsis and rice, respectively [40]. The involvement of SAMS genes in various metabolic pathways is related to stress resistance [9,41]. The number of GhSAMS genes on chromosomes is relatively small, and their distribution on chromosomes presents a certain physical location, while the number and physical regions of GhSAMS genes on chromosomes do not affect gene expression [42]. Previous reports have indicated that the distribution pattern of introns/exons in genes plays an important role in related biological functions [43]. Exon–intron loss occurs in the chromosomal rearrangement or fusion of gene families, which affects the evolution of exon–intron diversity in this process [44,45]. In this study, the exon numbers of all 16 GhSAMS genes were basically the same, and the structures of all exons were basically similar. Similar exon numbers and structures were also shown in the phylogenetic tree. In this study, the similarity of the gene structure makes the prediction results of gene motifs basically similar. Although the gene structures are similar, the encoded amino acids are different, which leads to different catalytic activities and functions.
Whole-genome duplication (WGD) events affected the expansion of the SAMS gene family in upland cotton [45,46]. In the process of plant evolution, the polyploidy of plants will cause many repetitive genes to appear in the plant genome, which results in many changes in gene expression and genome in plant tissues. [23,47,48], and these specific gene-encoding biotic and abiotic exogenous factors retain their associated structures and functions after replication [23,45]. In this study, the results of GhSAMS genes’ phylogenetic evolution, gene structure and collinearity analysis showed that the homology and gene structure of GhSAMS genes were basically consistent with the above viewpoints (Figure 1 and Figure 5). In addition, the results of the evolutionary analysis show that the GhSAMS gene family is very strict and conserved during its species expansion, which may be related to its need to maintain related functions. For example, the SAMS gene of Arabidopsis was down-regulated under abiotic stress conditions such as salt, heat and temperature stress [39]. The presence or absence of related cis-elements in the promoter of a gene has an important impact on the related functions of the gene. For example, in Arabidopsis, dehydration response elements (DREs) bind to associated transcription factors to regulate drought- and heat-responsive genes [49,50]. At present, MYB is an important transcription factor related to plant drought resistance and plays an important role in the transcriptional regulatory network of plant drought resistance [51,52]. Here, the results of our promoter prediction analysis revealed that five GhSAMS genes were upregulated after drought stress, and their promoter regions contained MYB-responsive cis-acting regulatory elements (Figure 5).
The tissue expression pattern analysis of RNA-seq data provides an important theoretical basis for the functional analysis of GhSAMS genes after drought stress. According to the results of qRT-PCR analysis, these five genes were significantly up-regulated (>2-fold) in Xinluzhong 39 and Xinluzao 26 materials (Figure 7). These five genes were significantly induced and expressed by drought stress treatment, and initially mainly contributed to the drought stress response. The results of differential expression analysis of these five genes showed that the GhSAMS genes were highly expressed in the roots of cotton under drought stress, which mainly affected the physiological process of the roots and improved their tolerance to drought stress. High expression of these genes in roots helped alleviate drought stress (Figure 7).

5. Conclusions

In this study, 16 SAMS genes were identified in upland cotton by genome-wide analysis, and these GhSAMS genes were divided into five main groups, in total, by phylogenetic analysis. A large number of abiotic stress-related cis-acting elements in promoters were predicted to show their role in abiotic stress tolerance. The expression pattern of GhSAMS genes after drought stress was analyzed by qRT-PCR, and the results showed that GhSAMS gene expression was induced by drought stress. The analysis of the cotton SAMS gene family will help us understand the role of SAMS genes in drought stress and to provide a theoretical basis for further analysis of the function of the GhSAMS gene family and its potential in the genetic improvement of cotton drought resistance.

Supplementary Materials

The following supporting information can be downloaded at: https://www.mdpi.com/article/10.3390/genes13050860/s1, Table S1. Multilevel consensus sequences of motifs in GhSAMS, Table S2: Orthologous and paralogous SAMS gene pairs among upland cotton, and Arabidopsis. Table S3: Primers used in this study.

Author Contributions

Conceived and designed the experiments, F.S. and Y.Y.; Formal Analysis, J.M.; Resources, Y.Y. and P.W.; Writing—Original Draft Preparation, F.S.; Revised the paper, Y.Y. All authors have read and agreed to the published version of the manuscript.

Funding

The work was supported by the Mining and screening of fiber strength-related genes in cotton high-quality land-sea introgression lines by RNA-Seq (xjnkq-2022001). Using BSR-seq to mine QTL related to fiber quality of cotton sea-land Introgression lines (2021D01B62).

Conflicts of Interest

The authors declare no conflict of interest.

References

  1. Liu, C.Y.; Yang, Z.Y.; Hu, Y.G. Drought resistance of wheat alien chromosome addition lines evaluated by membership function value based on multiple traits and drought resistance index of grain yield. Field Crops Res. 2015, 179, 103–112. [Google Scholar] [CrossRef]
  2. Nagy, Z.; Németh, E.; Guóth, A.; Bona, L.; Wodala, B.; Pécsváradi, A. Metabolic indicators of drought stress tolerance in wheat: Glutamine synthetase isoenzymes and Rubisco. Plant Physiol. Biochem. 2013, 67, 48–54. [Google Scholar] [CrossRef] [PubMed]
  3. Zhang, X.; Li, X.; Fang, H.; Guo, F.; Li, F.; Chen, A.; Huang, S. Flavonoids as inducers of white adipose tissue browning and thermogenesis: Signalling pathways and molecular triggers. Nutr. Metab. 2019, 16, 47. [Google Scholar] [CrossRef] [PubMed] [Green Version]
  4. Pajares, M.A.; Markham, G.D. Methionine adenosyltransferase (S-adenosylmethionine synthetase). Adv. Enzym. Relat. Areas Mol. Biol. 2011, 78, 449–521. [Google Scholar]
  5. Gallardo, K.; Job, C.; Groot, S.P.; Puype, M.; Demol, H.; Vandekerckhove, J.; Job, D. Importance of methionine biosynthesis for Arabidopsis seed germination and seedling growth. Physiol. Plant. 2002, 116, 238–247. [Google Scholar] [CrossRef] [PubMed]
  6. Sanchez-Aguayo, I.; Rodriguez-Galan, J.M.; Garcia, R.; Torreblanca, J.; Pardo, J.M. Salt stress enhances xylem development and expression of S-adenosyl-L-methionine synthase in lignifying tissues of tomato plants. Planta 2004, 220, 278–285. [Google Scholar] [CrossRef]
  7. Jone, P.A. Functions of DNA methylation: Islands, start sites, gene bodies and beyond. Nat. Rev. Genet. 2012, 13, 484–492. [Google Scholar] [CrossRef]
  8. Loraine, A.E.; Mccormick, S.; Estrada, A.; Patel, K.; Qin, P. RNA-Seq of Arabidopsis pollen uncovers novel transcription and alternative splicing. Plant Physiol. 2013, 162, 1092–1109. [Google Scholar] [CrossRef] [Green Version]
  9. Chen, Y.; Zou, T.; Mccormick, S. S-adenosylmethionine synthetase 3 is important for pollen tube growth. Plant Physiol. 2016, 172, 244–253. [Google Scholar] [CrossRef] [Green Version]
  10. Li, W.X.; Han, Y.Y.; Tao, F.; Chong, K. Knockdown of SAMS genes encoding S-adenosyl-L-methionine synthetases causes methylation alterations of DNAs and histones and leads to late flowering in rice. J. Plant Physiol. 2011, 168, 1837–1843. [Google Scholar] [CrossRef]
  11. Espartero, J.; Pintor-Toro, J.A.; Pardo, J.M. Differential accumulation of S-adenosylmethionine synthetase transcripts in response to salt stress. Plant Mol. Biol. 1994, 25, 217–227. [Google Scholar] [CrossRef] [PubMed]
  12. Du, C.X.; Fan, H.F.; Guo, S.R.; Tezukab, T.; Li, J. Proteomic analysis of cucumber seedling roots subjected to salt stress. Phytochemistry 2010, 71, 1450–1459. [Google Scholar] [CrossRef] [PubMed]
  13. Li, B.; He, L.Z.; Guo, S.R.; Li, J.; Yang, Y.J.; Yan, B.; Sun, J.; Li, J. Proteomics reveal cucumber Spd-responses under normal condition and salt stress. Plant Physiol. Biochem. 2013, 67, 7–14. [Google Scholar] [CrossRef] [PubMed]
  14. Oh, M.W.; Komatsu, S. Characterization of proteins in soybean roots under flooding and drought stresses. J. Proteom. 2015, 114, 161–181. [Google Scholar] [CrossRef] [PubMed]
  15. Wang, X.; Oh, M.W.; Komatsu, S. Characterization of S-adenosylmethionine syntiietases in soybean under flooding and drought stresses. Biologia Plantarum. 2016, 60, 69–278. [Google Scholar] [CrossRef]
  16. Yang, Z.E.; Gong, Q.; Qin, W.Q.; Yang, Z.R.; Cheng, Y.; Lu, L.L.; Ge, X.Y.; Zhang, C.J.; Wu, Z.X.; Li, F.G. Genome-wide analysis of WOX genes in upland cotton and their expression pattern under different stresses. BMC Plant Biol. 2017, 17, 113. [Google Scholar] [CrossRef] [PubMed]
  17. Yadav, A.; Lingwan, M.; Yadukrishnan, P.; Masakapalli, S.K.; Datta, S. BBX31 promotes hypocotyl growth, primary root elongation and UV-B tolerance in Arabidopsis. Plant Signal. Behav. 2019, 14, e1588672. [Google Scholar] [CrossRef]
  18. Zhu, T.; Liang, C.; Meng, Z.; Sun, G.; Meng, Z.; Guo, S.; Zhang, R. CottonFGD: An integrated functional genomics database for cotton. BMC Plant Biol. 2017, 17, 101. [Google Scholar] [CrossRef] [Green Version]
  19. Goodstein, D.M.; Shu, S.; Howson, R.; Neupane, R.; Hayes, R.D.; Fazo, J.; Mitros, T.; Dirks, W.; Hellsten, U.; Putnam, N.; et al. Phytozome: A comparative platform for green plant genomics. Nucleic Acids Res. 2012, 40, D1178–D1186. [Google Scholar] [CrossRef]
  20. El-Gebali, S.; Mistry, J.; Bateman, A.; Eddy, S.R.; Luciani, A.; Potter, S.C.; Qureshi, M.; Richardson, L.J.; Salazar, G.A.; Smart, A.; et al. The Pfam protein families database in 2019. Nucleic Acids Res. 2019, 47, D427–D432. [Google Scholar] [CrossRef]
  21. Finn, R.D.; Clements, J.; Eddy, S.R. HMMER web server: Interactive sequence similarity searching. Nucleic Acids Res. 2011, 39, W29–W37. [Google Scholar] [CrossRef] [PubMed] [Green Version]
  22. Marchler-Bauer, A.; Bryant, S.H. CD-Search: Protein domain annotations on the fly. Nucleic Acids Res. 2004, 32, W327–W331. [Google Scholar] [CrossRef] [PubMed]
  23. Zu, Q.L.; Qu, Y.Y.; Ni, Z.Z.; Zheng, K.; Chen, Q.; Chen, Q.J. The Chalcone Isomerase Family in Cotton: Whole-Genome Bioinformatic and Expression Analyses of the Gossypium barbadense L. Response to FusariumWilt Infection. Genes. 2019, 10, 1006. [Google Scholar] [CrossRef] [PubMed]
  24. Yu, C.S.; Chen, Y.C.; Lu, C.H.; Hwang, J.K. Prediction of protein subcellular localization. Proteins Struct. Funct. Bioinform. 2006, 64, 643–651. [Google Scholar] [CrossRef]
  25. Kumar, S.; Stecher, G.; Tamura, K. MEGA7: Molecular Evolutionary Genetics Analysis version 7.0 for bigger datasets. Mol. Biol. Evol. 2016, 33, 1870–1874. [Google Scholar] [CrossRef] [Green Version]
  26. Larkin, M.A.; Blackshields, G.; Brown, N.P.; Chenna, R.; McGettigan, P.A.; McWilliam, H.; Valentin, F.; Wallace, I.M.; Wilm, A.; Lopez, R.; et al. Clustal W and Clustal X version 2.0. Bioinformatics 2007, 23, 2947–2948. [Google Scholar] [CrossRef] [Green Version]
  27. Berri, S.; Abbruscato, P.; Faivre-Rampant, O.; Brasileiro, A.C.; Fumasoni, I.; Satoh, K.; Kikuchi, S.; Mizzi, L.; Morandini, P.; Pè, M.E.; et al. Characterization of WRKY co-regulatory networks in rice and Arabidopsis. BMC Plant Biol. 2009, 9, 120. [Google Scholar] [CrossRef] [Green Version]
  28. Tamura, K.; Stecher, G.; Peterson, D.; Filipski, A.; Kumar, S. MEGA6: Molecular Evolutionary Genetics Analysis version 6.0. Mol. Biol. Evol. 2013, 30, 2725–2729. [Google Scholar] [CrossRef] [Green Version]
  29. Hu, B.; Jin, J.; Guo, A.Y.; Zhang, H.; Luo, J.; Gao, G. GSDS 2.0: An upgraded gene feature visualization server. Bioinformatics 2014, 31, 1296–1297. [Google Scholar] [CrossRef] [Green Version]
  30. Bailey, T.L.; Baker, M.E.; Elkan, C.P. An artificial intelligence approach to motif discovery in protein sequences: Application to steroid dehydrogenases. J. Steroid Biochem. Mol. Biol. 1997, 62, 29–44. [Google Scholar] [CrossRef]
  31. Chen, C.; Chen, H.; Zhang, Y.; Thomas, H.R.; Frank, M.H.; He, Y.; Xia, R. TBtools: An integrative toolkit developed for interactive analyses of big biological data. Mol. Plant. 2020, 13, 1194–1202. [Google Scholar] [CrossRef] [PubMed]
  32. Liu, X.Q.; Zhang, H.; Ma, L.; Wang, Z.; Wang, K. Genome-Wide Identification and Expression Profiling Analysis of the Trihelix Gene Family under Abiotic Stresses in Medicago truncatula. Genes. 2020, 11, 1389. [Google Scholar] [CrossRef] [PubMed]
  33. Higo, K.; Ugawa, Y.; Iwamoto, M.; Korenaga, T. Plant cis-acting regulatory DNA elements (PLACE) database: 1999. Nucleic Acids Res. 1999, 27, 297–300. [Google Scholar] [CrossRef] [Green Version]
  34. Sun, F.; Qu, Y.; Chen, Q.; Gao, W. Comprehensive evaluation of cotton drought tolerance indexes and gray relational analysis. Agric. Res. Arid Areas. 2019, 37, 233–239. [Google Scholar]
  35. Wang, W.; Cheng, Y.; Chen, D.; Liu, D.; Hu, M.; Dong, J.; Zhang, X.; Song, L.; Shen, F. The Catalase Gene Family in Cotton: Genome-Wide Characterization and Bioinformatics Analysis. Cells 2019, 8, 86. [Google Scholar] [CrossRef] [PubMed] [Green Version]
  36. Livak, K.J.; Schmittgen, T.D. Analysis of relative gene expression data using real time quantitative PCR and the 2−∆∆CT method. Methods 2001, 25, 402–408. [Google Scholar] [CrossRef]
  37. Franceschini, A.; Szklarczyk, D.; Frankild, S.; Kuhn, M.; Simonovic, M.; Roth, A.; Lin, J.; Minguez, P.; Bork, P.; Mering, C.; et al. STRING v9.1: Protein-protein interaction networks, with increased coverage and integration. Nucleic Acids Res. 2013, 41, D808–D815. [Google Scholar] [CrossRef] [PubMed] [Green Version]
  38. Otasek, D.; Morris, J.H.; Bouças, J.; Pico, A.R.; Demchak, B. Cytoscape Automation: Empowering workflow-based network analysis. Genome Biol. 2019, 20, 185. [Google Scholar] [CrossRef] [Green Version]
  39. Zhao, J.Y.; Wang, P.; Gao, W.J.; Long, Y.L.; Wang, Y.X.; Geng, S.W.; Su, X.N.; Jiao, Y.; Chen, Q.J.; Qu, Y.Y. Genome-wide identification of the DUF668 gene family in cotton and expression profiling analysis of GhDUF668 in Gossypium hirsutum under adverse stress. BMC Genomics. 2021, 22, 395. [Google Scholar] [CrossRef]
  40. Heidari, P.; Mazloomi, F.; Nussbaumer, T.; Barcaccia, G. Insights into the SAM Synthetase Gene Family and Its Roles in Tomato Seedlings under Abiotic Stresses and Hormone Treatments. Plants 2020, 9, 586. [Google Scholar] [CrossRef]
  41. Sauter, M.; Moffatt, B.; Saechao, M.C.; Hell, R.; Wirtz, M. Methionine salvage and S-adenosylmethionine: Essential links between sulfur, ethylene and polyamine biosynthesis. Biochem. J. 2013, 451, 145–154. [Google Scholar] [CrossRef] [PubMed] [Green Version]
  42. Belak, Z.R.; Pickering, J.A.; Gillespie, Z.E.; Audette, G.F.; Eramian, M.; Mitchell, J.A.; Bridger, J.M.; Kusalik, A.; Eskiw, C.H. Genes responsive to rapamycin and serum deprivation are clustered on chromosomes and undergo re-organization within local chromatin environments. Biochem. Cell Biol. 2020, 98, 178–190. [Google Scholar] [CrossRef] [PubMed]
  43. Xu, G.; Guo, C.; Shan, H.; Kong, H. Divergence of duplicate genes in exon-intron structure. Proc. Natl. Acad. Sci. USA 2012, 109, 1187–1192. [Google Scholar] [CrossRef] [PubMed] [Green Version]
  44. Xiao, X.H.; Tang, C.R.; Fang, Y.J.; Yang, M.; Zhou, B.H.; Qi, J.Y.; Zhang, Y. Structure and expression profile of the sucrose synthase gene family in the rubber tree: Indicative of roles in stress response and sucrose utilization in the laticifers. FEBS J. 2014, 281, 291–305. [Google Scholar] [CrossRef] [PubMed] [Green Version]
  45. Murat, F.; Xu, J.H.; Tannier, E.; Abrouk, M.; Guilhot, N.; Pont, C.; Messing, J.; Salse, J. Ancestral grass karyotype reconstruction unravels new mechanisms of genome shuffling as a source of plant evolution. Genome Res. 2012, 20, 1545–1557. [Google Scholar] [CrossRef] [PubMed] [Green Version]
  46. Krendel, M.; Mooseker, M.S. Myosins: Tails (and heads) of functional diversity. Physiology 2005, 20, 239–251. [Google Scholar] [CrossRef] [Green Version]
  47. Otto, S.P.; Whitton, J. Polyploid incidence and evolution. Annu. Rev. Genet. 2000, 34, 401–437. [Google Scholar] [CrossRef] [Green Version]
  48. Adams, K.L. Evolution of duplicate gene expression in polyploid and hybrid plants. J. Hered. 2007, 98, 136–141. [Google Scholar] [CrossRef] [Green Version]
  49. Cheng, M.C.; Hsieh, E.J.; Chen, J.H.; Chen, H.Y.; Lin, T.P. Arabidopsis RGLG2, functioning as a RING E3 ligase, interacts with AtERF53 and negatively regulates the plant drought stress response. Plant Physiol. 2012, 158, 363–375. [Google Scholar] [CrossRef] [Green Version]
  50. Shen, Y.G.; Zhang, W.K.; He, S.J.; Zhang, J.S.; Liu, Q.; Chen, S.Y. An EREBP/AP2-type protein in Triticum aestivum was a DRE-binding transcription factor induced by cold, dehydration and ABA stress. Theor. Appl. Genet. 2003, 106, 923–930. [Google Scholar] [CrossRef]
  51. Leng, P.; Zhao, J. Transcription factors as molecular switches to regulate drought adaptation in maize. Theor. Appl. Genet. 2020, 133, 1455–1465. [Google Scholar] [CrossRef] [PubMed]
  52. Baldoni, E.; Genga, A. Plant MYB transcription factors: Their role in drought response mechanisms. Int. J. Mol. Sci. 2015, 16, 15811–15851. [Google Scholar] [CrossRef] [PubMed] [Green Version]
Figure 1. Phylogenetic analysis of SAMS genes in cotton, Arabidopsis and Oryza sativa.
Genes 13 00860 g001
Figure 2. Sequence conservation analysis of SAMS proteins: (A) Alignment of the conserved domains of SAMS proteins and genomic exon–intron structures in upland cotton. (B) Ten conserved motifs.
Genes 13 00860 g002
Figure 3. Chromosome distribution of upland cotton SAMS genes.
Genes 13 00860 g003
Figure 4. Collinearity analysis and comparison of the SAMS genes between upland cotton) and Arabidopsis.
Genes 13 00860 g004
Figure 5. Predictive analysis of cis-acting regulatory elements in the promoter region of GhSAMS.
Genes 13 00860 g005
Figure 6. (A) Expression analysis of GhSAMS gene (log2(FPKM)). (B) Expression analysis of GhSAMS gene after drought stress. (C) Expression analysis of GhSAMS gene after salt stress. (D) Changes in GhSAMS gene expression in different periods after cold stress. (E) Changes in GhSAMS gene expression in different time periods after heat stress.
Genes 13 00860 g006
Figure 7. The expression of GhSAMS under drought stresses (log2(FPKM)).
Genes 13 00860 g007
Figure 8. Interaction network of GhSAMS8 proteins in upland cotton.
Genes 13 00860 g008
Table 1. A catalog of 16 cotton SAMS proteins.
NIPGR ID.Cotton IdentifierChromosomeStart PositionEnd PositionProtein (aa)pIMolecular Weight (Da)CDS (bp)Predicted Subcellular LocationGRAVY
GhSAMS1GH_A02G0616.1AD1-A028,514,1708,515,351 393 5.680 43,060.86 1182Cytoplasmic−0.308
GhSAMS2GH_A04G0904.1AD1-A0465,039,231 65,040,403 390 6.510 42,854.92 1173Cytoplasmic−0.326
GhSAMS3GH_A07G1419.1AD1-A0726,342,235 26,343,005 256 8.730 28,120.07 771Cytoplasmic−0.326
GhSAMS4GH_A08G1451.1AD1-A0894,661,115 94,662,296 393 5.590 43,090.84 1182Cytoplasmic−0.325
GhSAMS5GH_A09G1633.1AD1-A0973,132,352 73,133,524 390 6.640 42,609.68 1173Cytoplasmic−0.299
GhSAMS6GH_A11G1106.1AD1-A1110,728,104 10,729,285 393 5.480 43,025.52 1182Cytoplasmic−0.360
GhSAMS7GH_A11G3695.1AD1-A11120,911,380 120,912,552 390 6.320 42,681.58 1173Cytoplasmic−0.332
GhSAMS8GH_A12G1381.1AD1-A1283,660,094 83,661,275 393 5.490 43,070.68 1182Cytoplasmic−0.335
GhSAMS9GH_D02G0631.1AD1-D018,142,070 8,143,251 393 5.650 43,043.83 1182Cytoplasmic−0.300
GhSAMS10GH_D04G1227.1AD1-D0440,645,773 40,646,945 390 6.500 42,811.94 1173Cytoplasmic−0.306
GhSAMS11GH_D07G1411.1AD1-D0720,066,986 20,068,167 393 5.490 43,038.68 1182Cytoplasmic−0.328
GhSAMS12GH_D08G1473.1AD1-D0848,053,425 48,054,606 393 5.520 43,039.75 1182Cytoplasmic−0.338
GhSAMS13GH_D09G1576.1AD1-D0942,758,795 42,759,967 390 6.640 42,694.79 1173Cytoplasmic−0.294
GhSAMS14GH_D11G1137.1AD1-D119,955,464 9,956,645 393 5.490 43,061.63 1182Cytoplasmic−0.358
GhSAMS15GH_D11G3723.1AD1-D1170,868,476 70,869,648 390 6.320 42,615.56 1173Cytoplasmic−0.320
GhSAMS16GH_D12G1397.1AD1-D1242,290,014 42,291,195 393 5.490 43,041.68 1182Cytoplasmic−0.321
Publisher’s Note: MDPI stays neutral with regard to jurisdictional claims in published maps and institutional affiliations.

