
First Report of Complete Mitochondrial Genome in the Tribes Coomaniellini and Dicercini (Coleoptera: Buprestidae) and Phylogenetic Implications


Abstract
:1. Introduction
2. Materials and Methods
2.1. Sampling and DNA Extraction
2.2. Sequence Assembly, Annotation, and Analysis
2.3. Phylogenetic Analysis
3. Results and Discussion
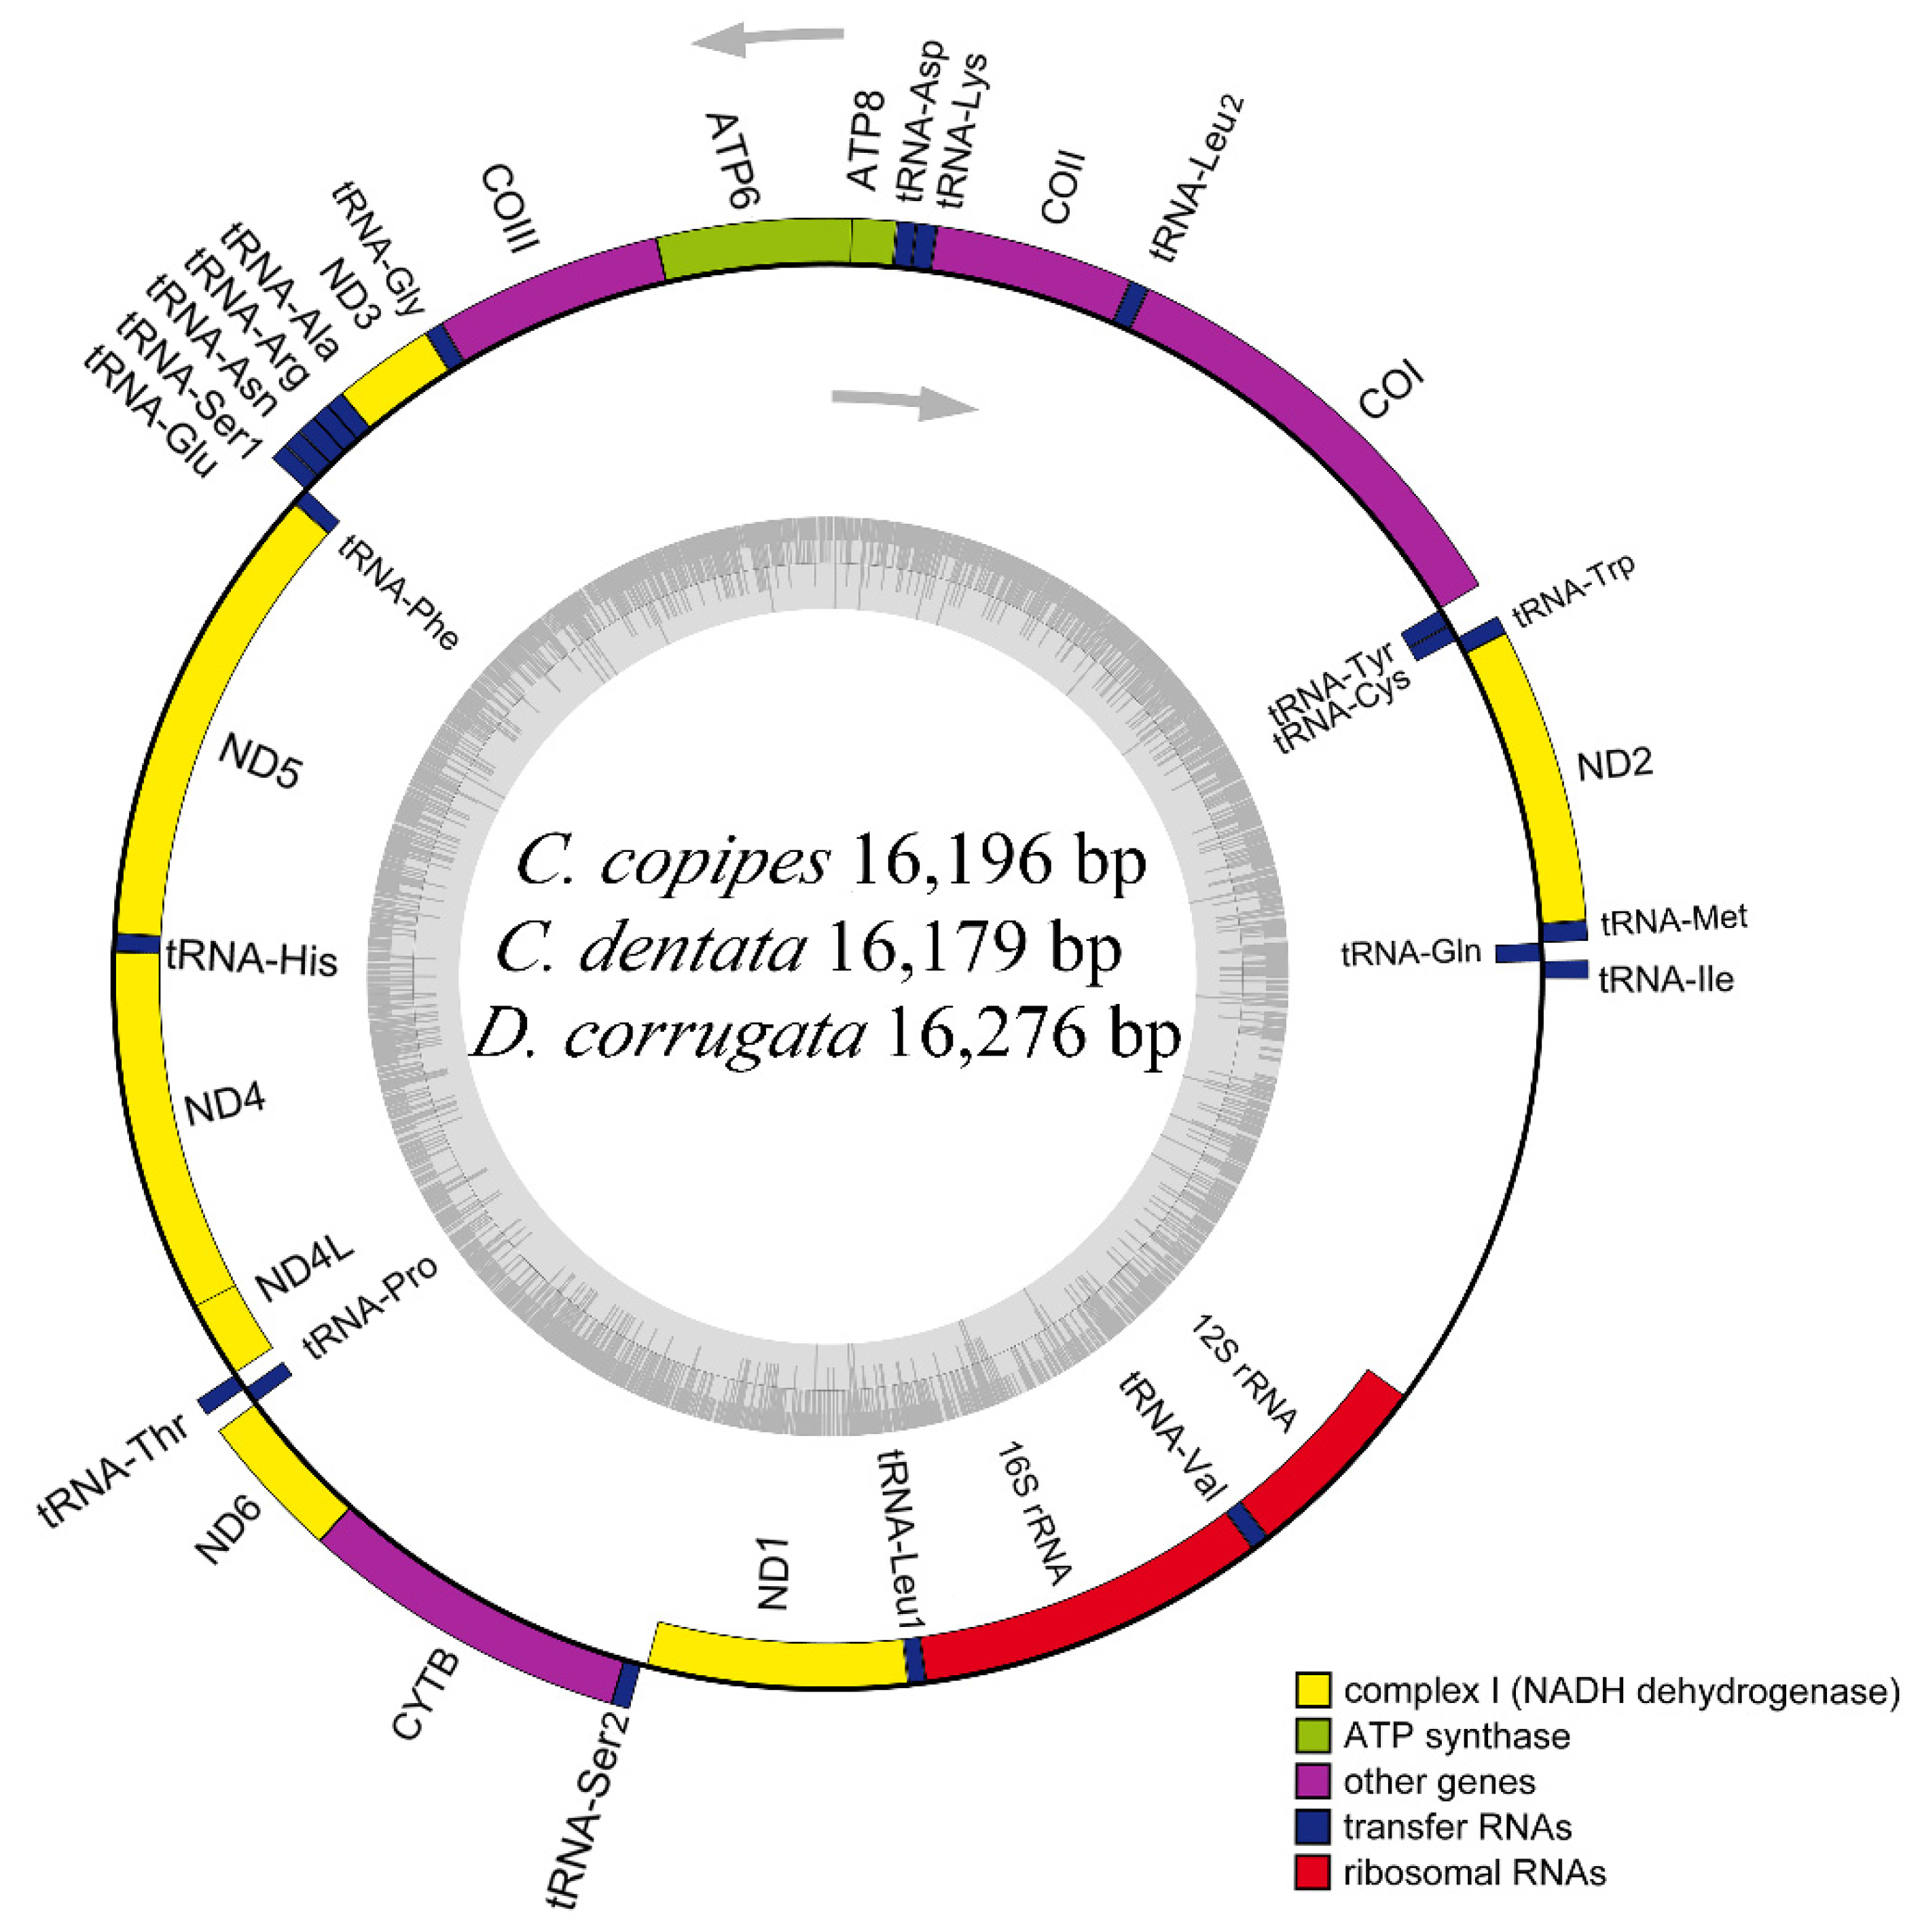
3.1. Genome Organization and Base Composition
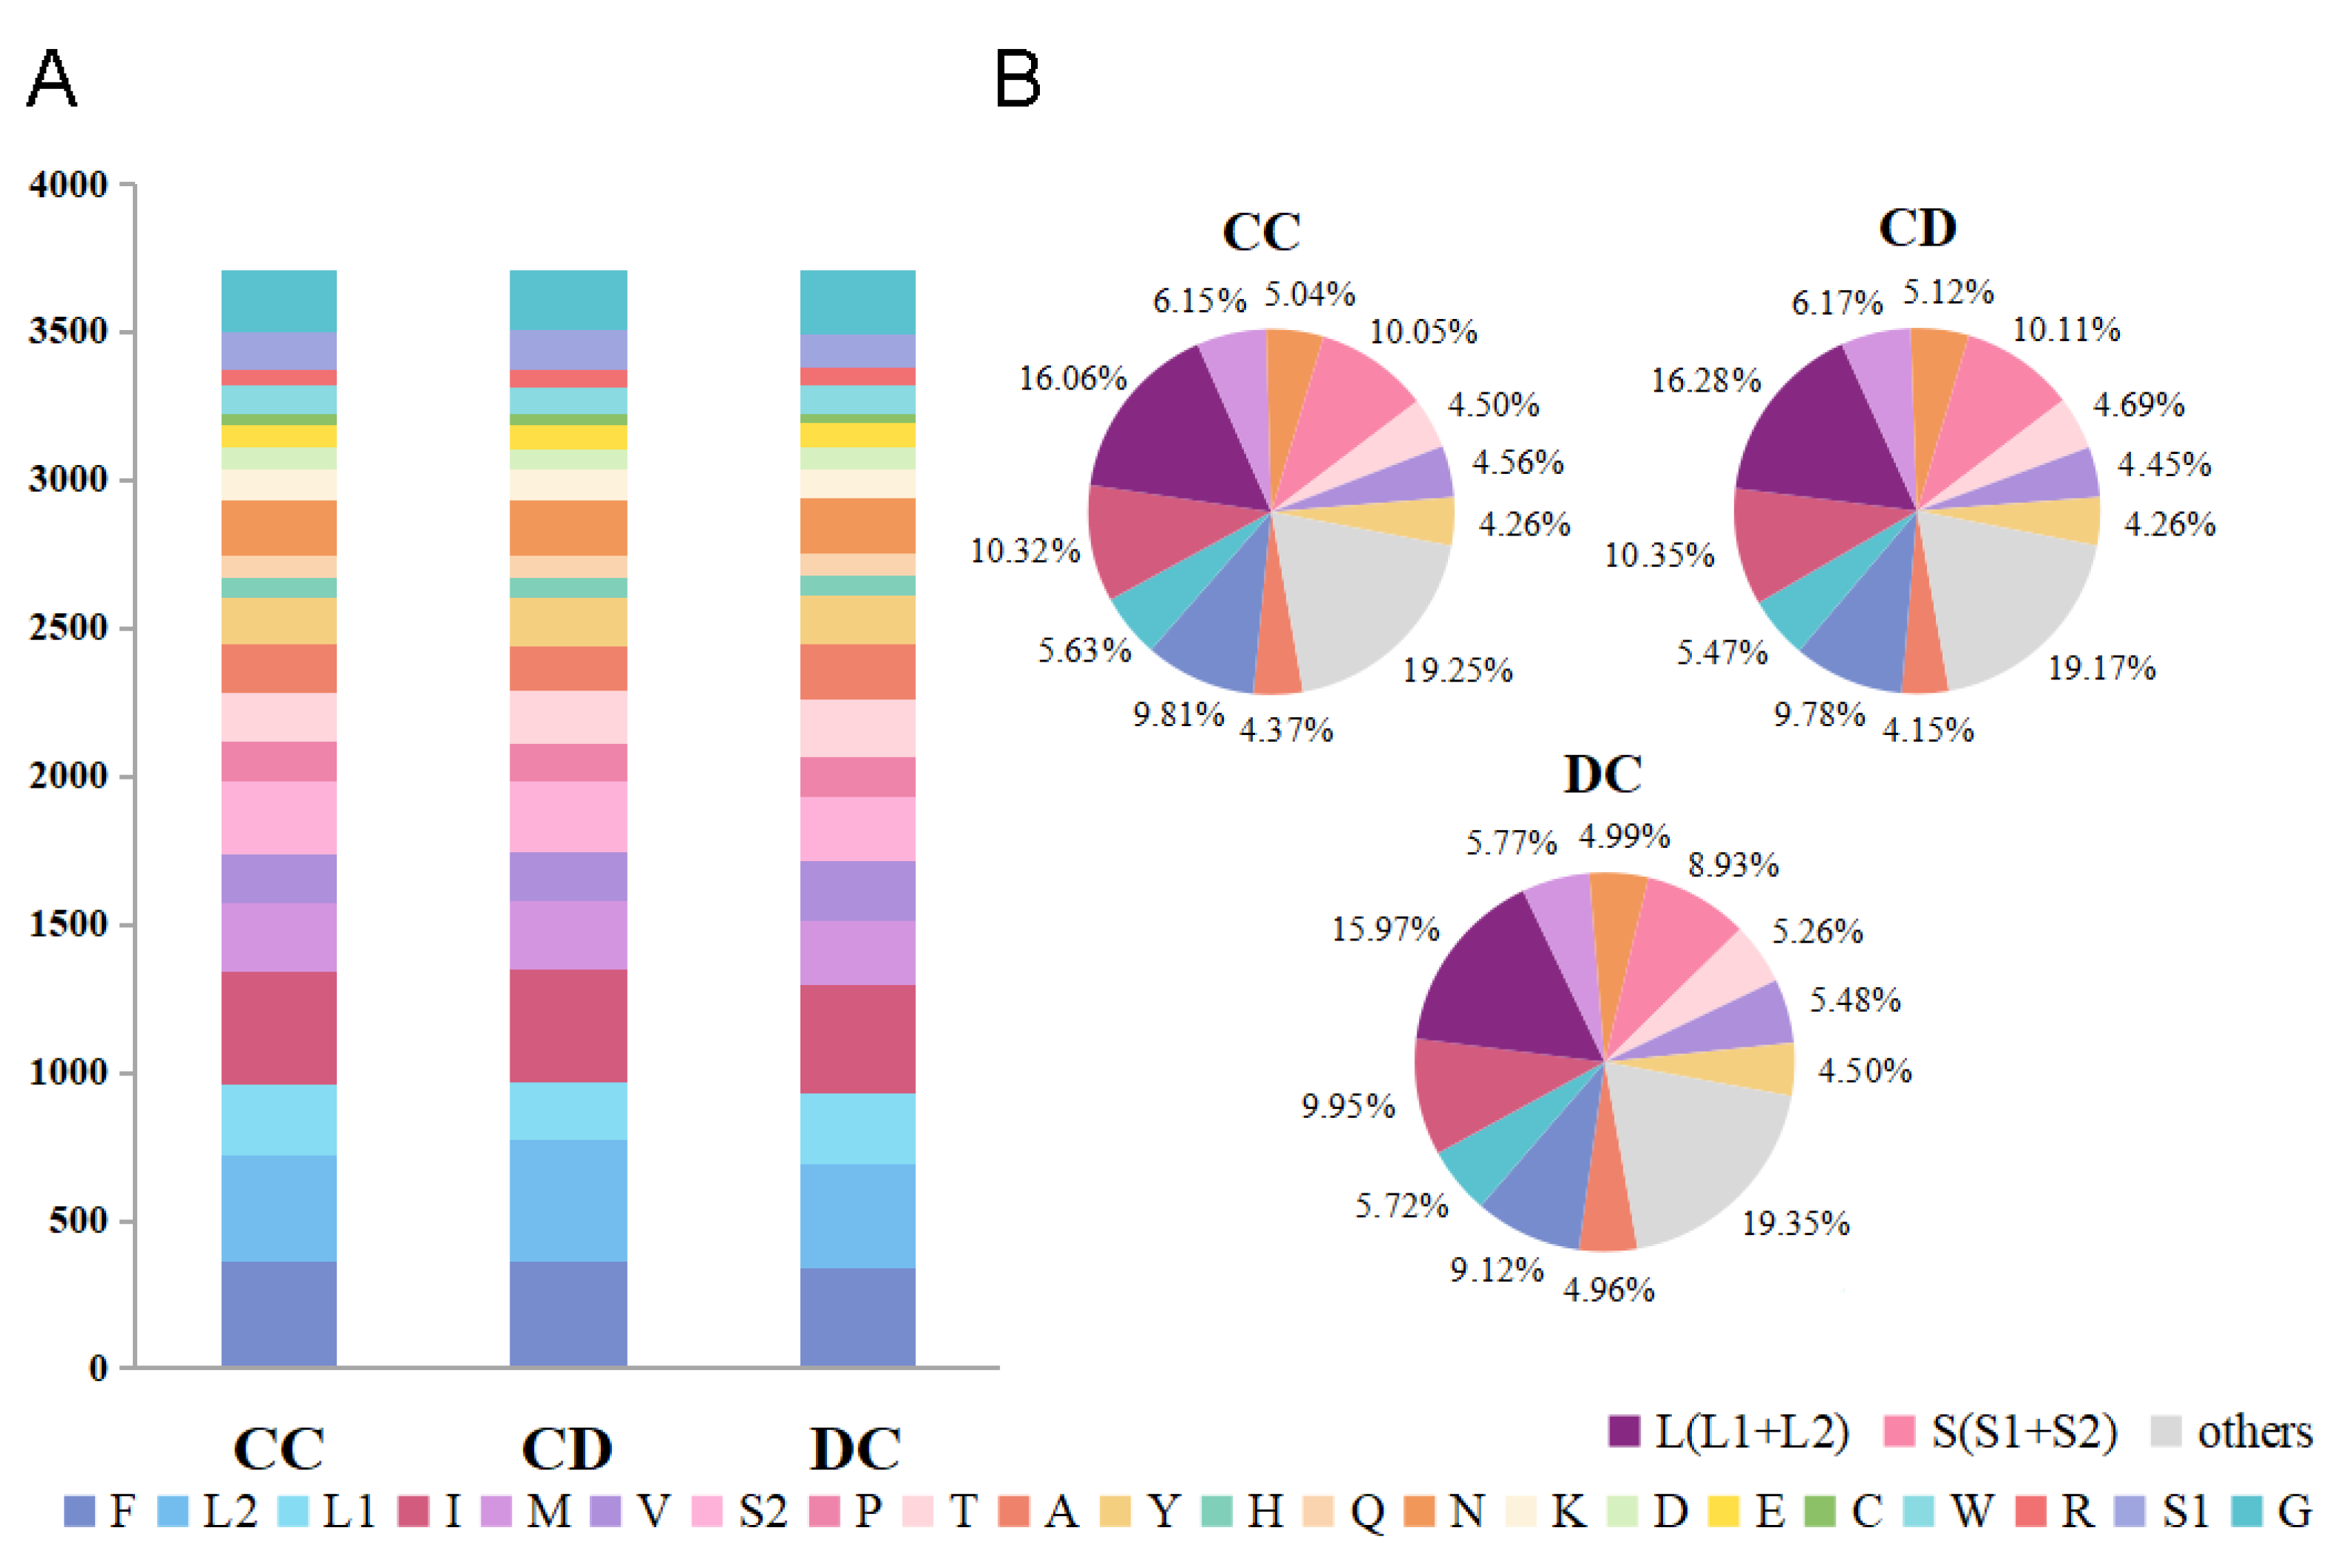
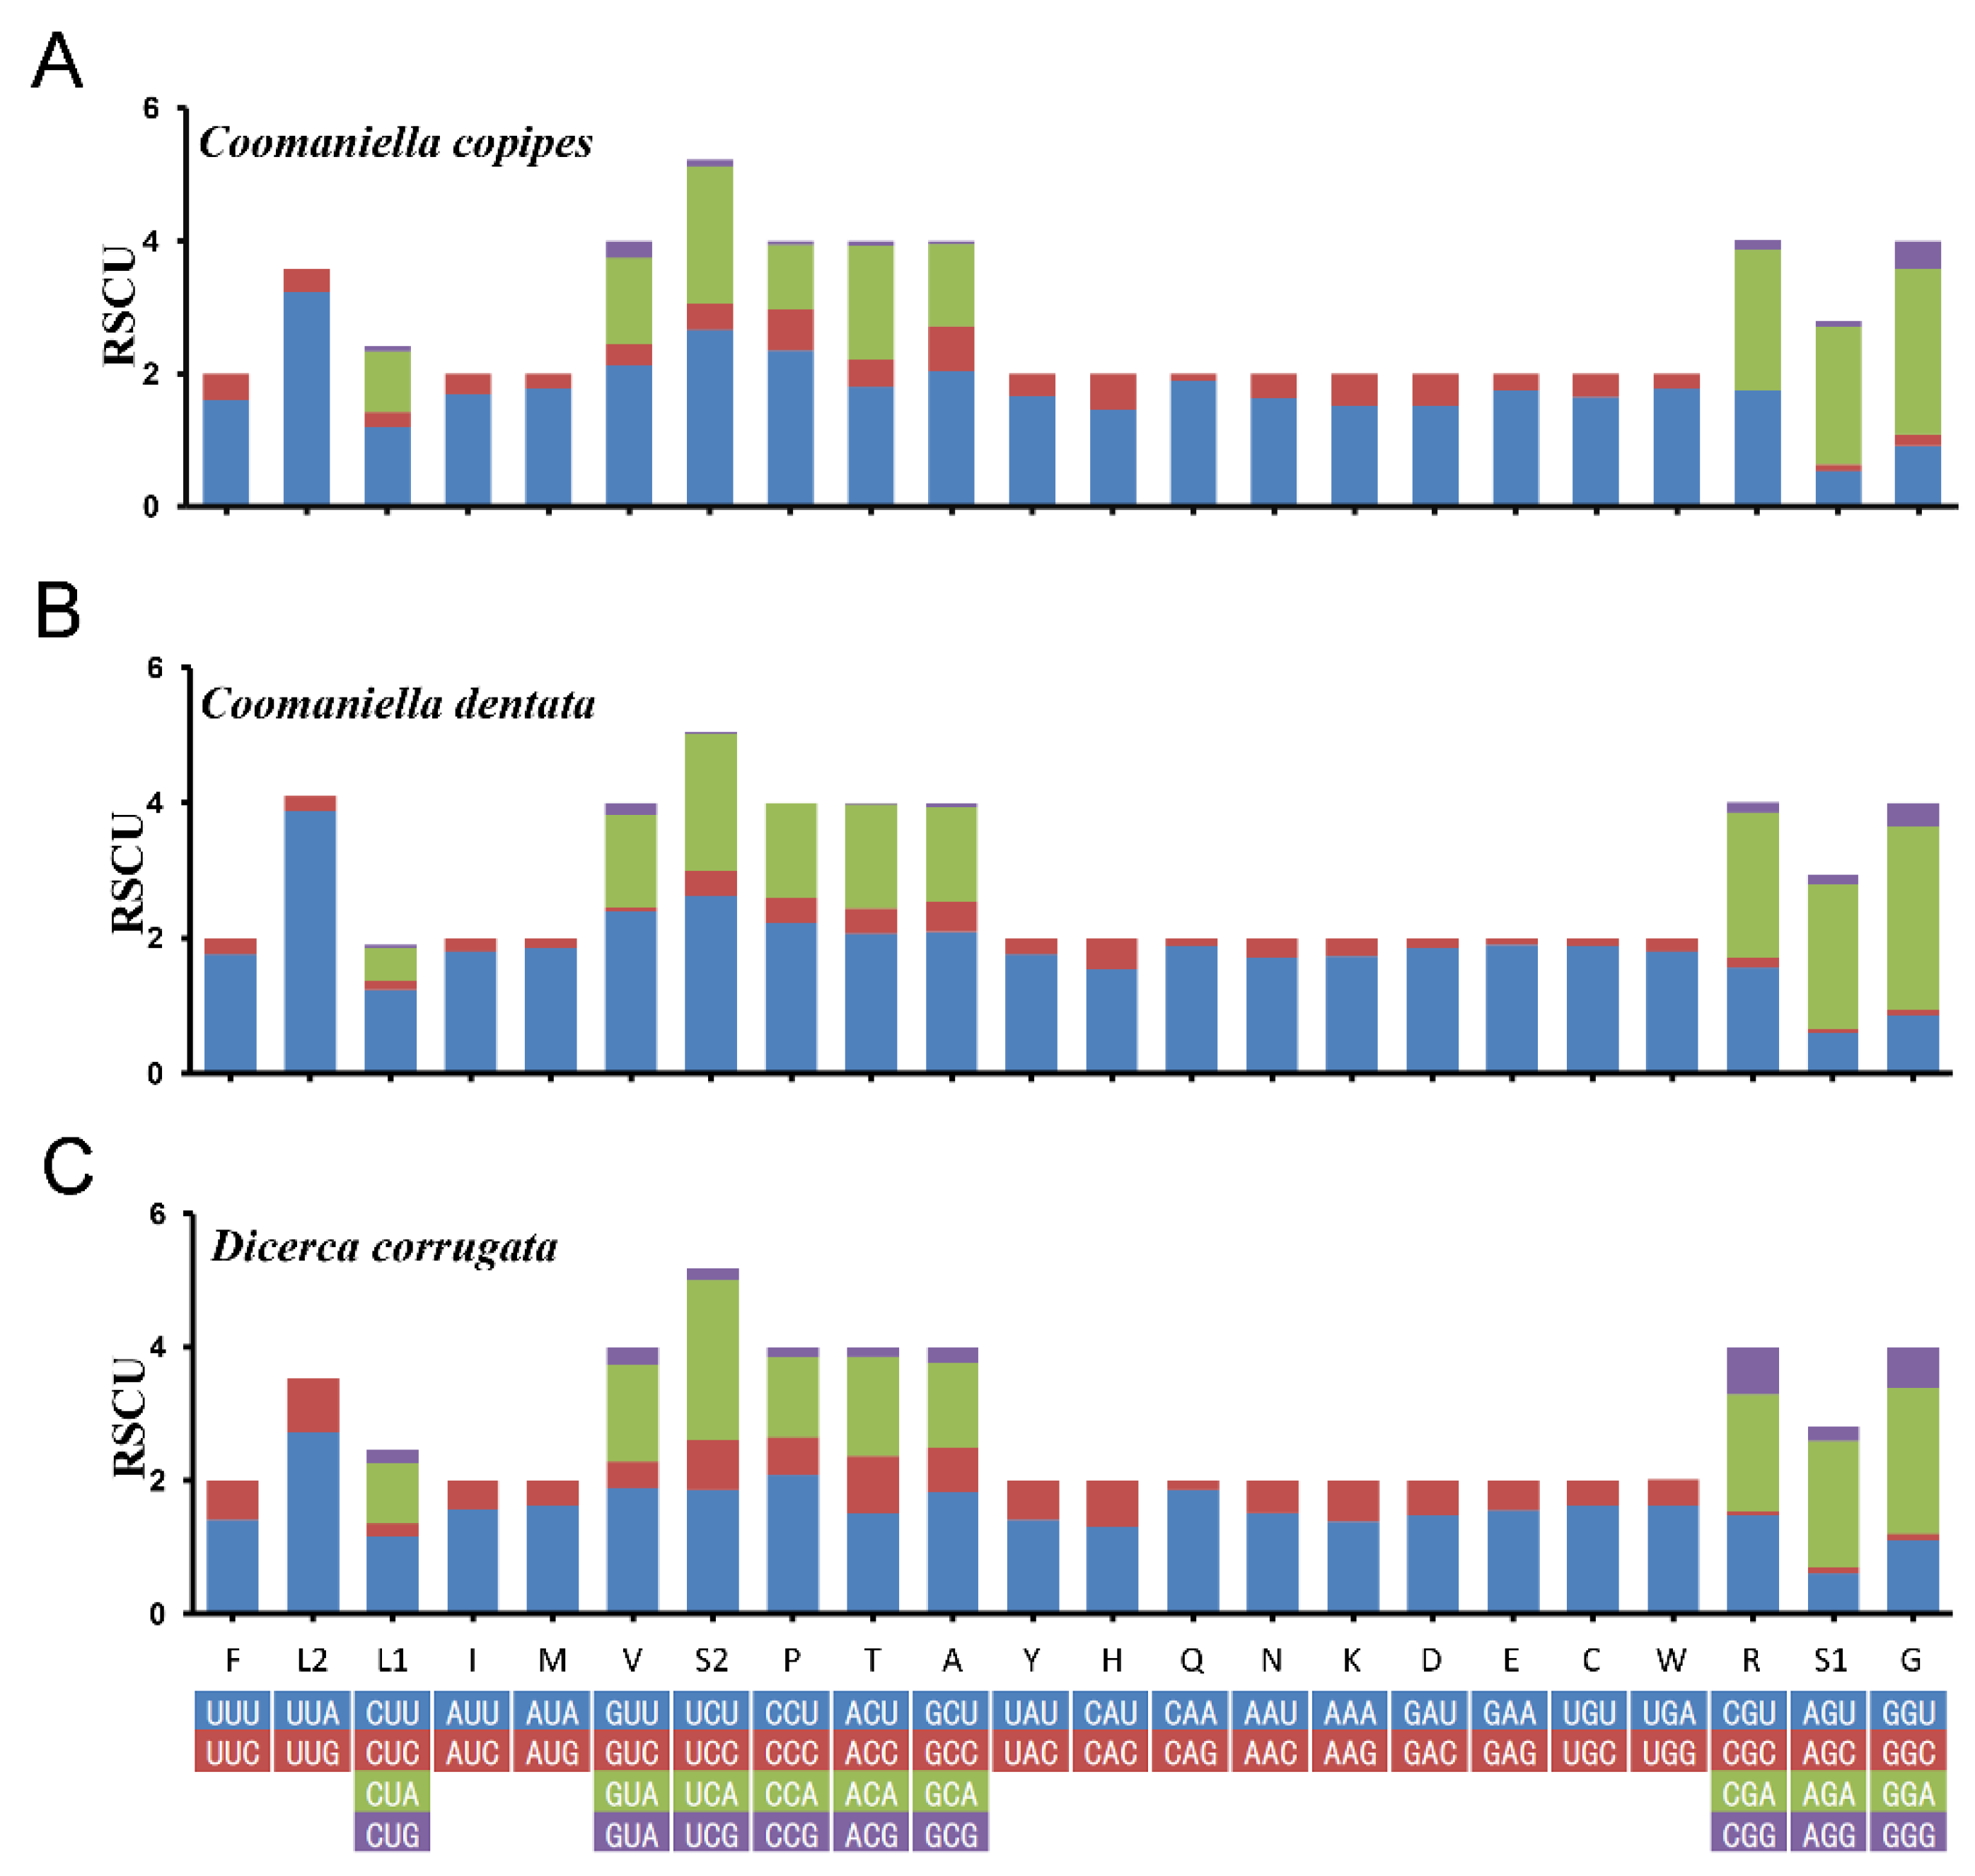
3.2. Protein-Coding Regions, Codon Usage and Nucleotide Diversity
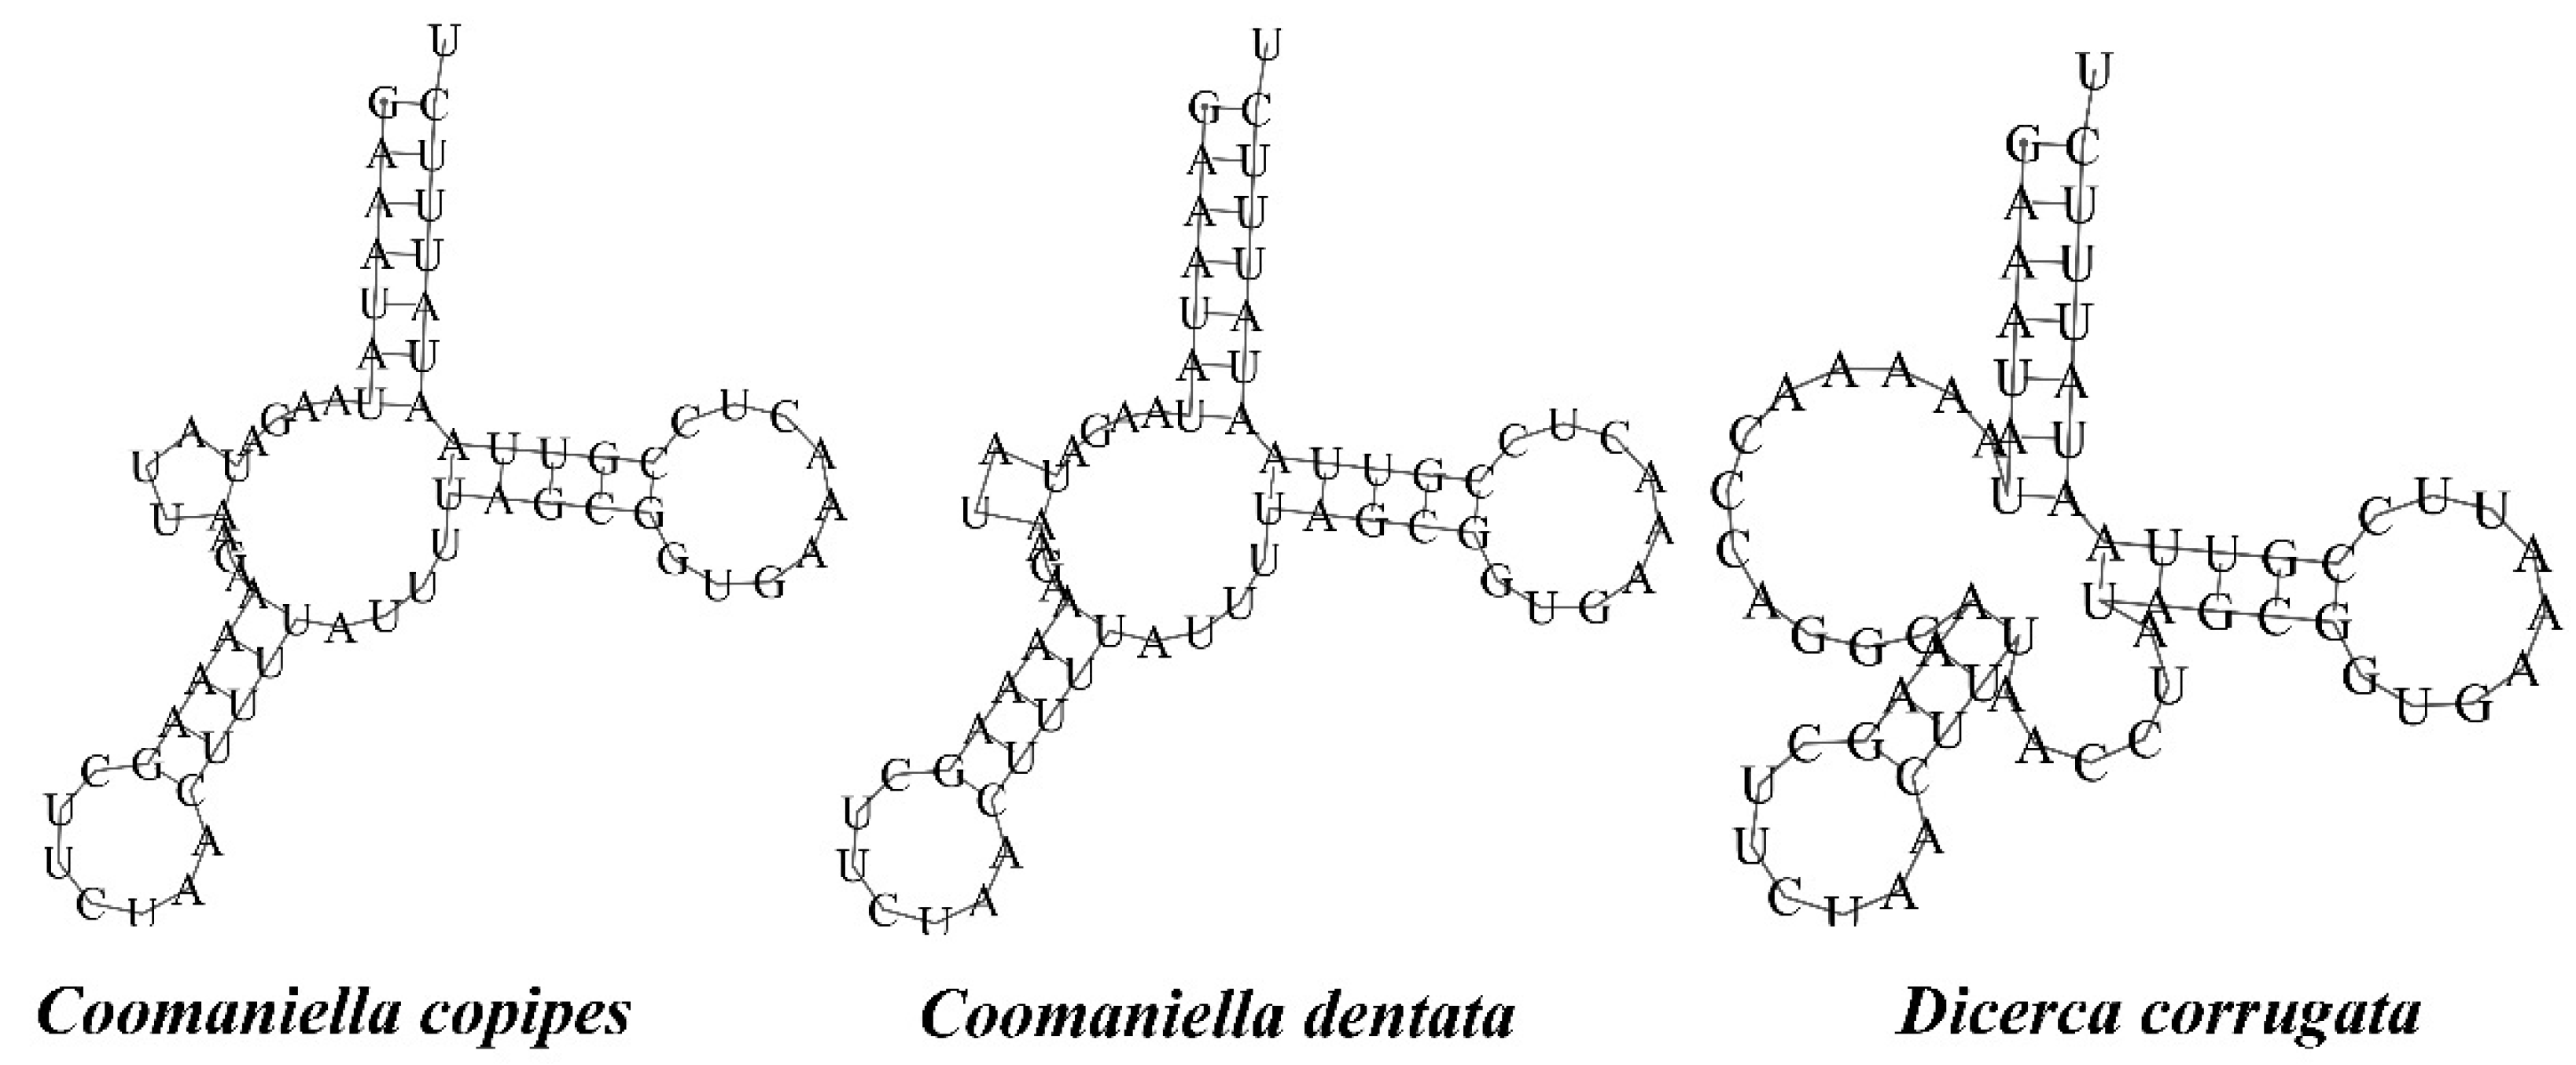
3.3. Ribosomal and Transfer RNA Genes
3.4. Non-Coding Region
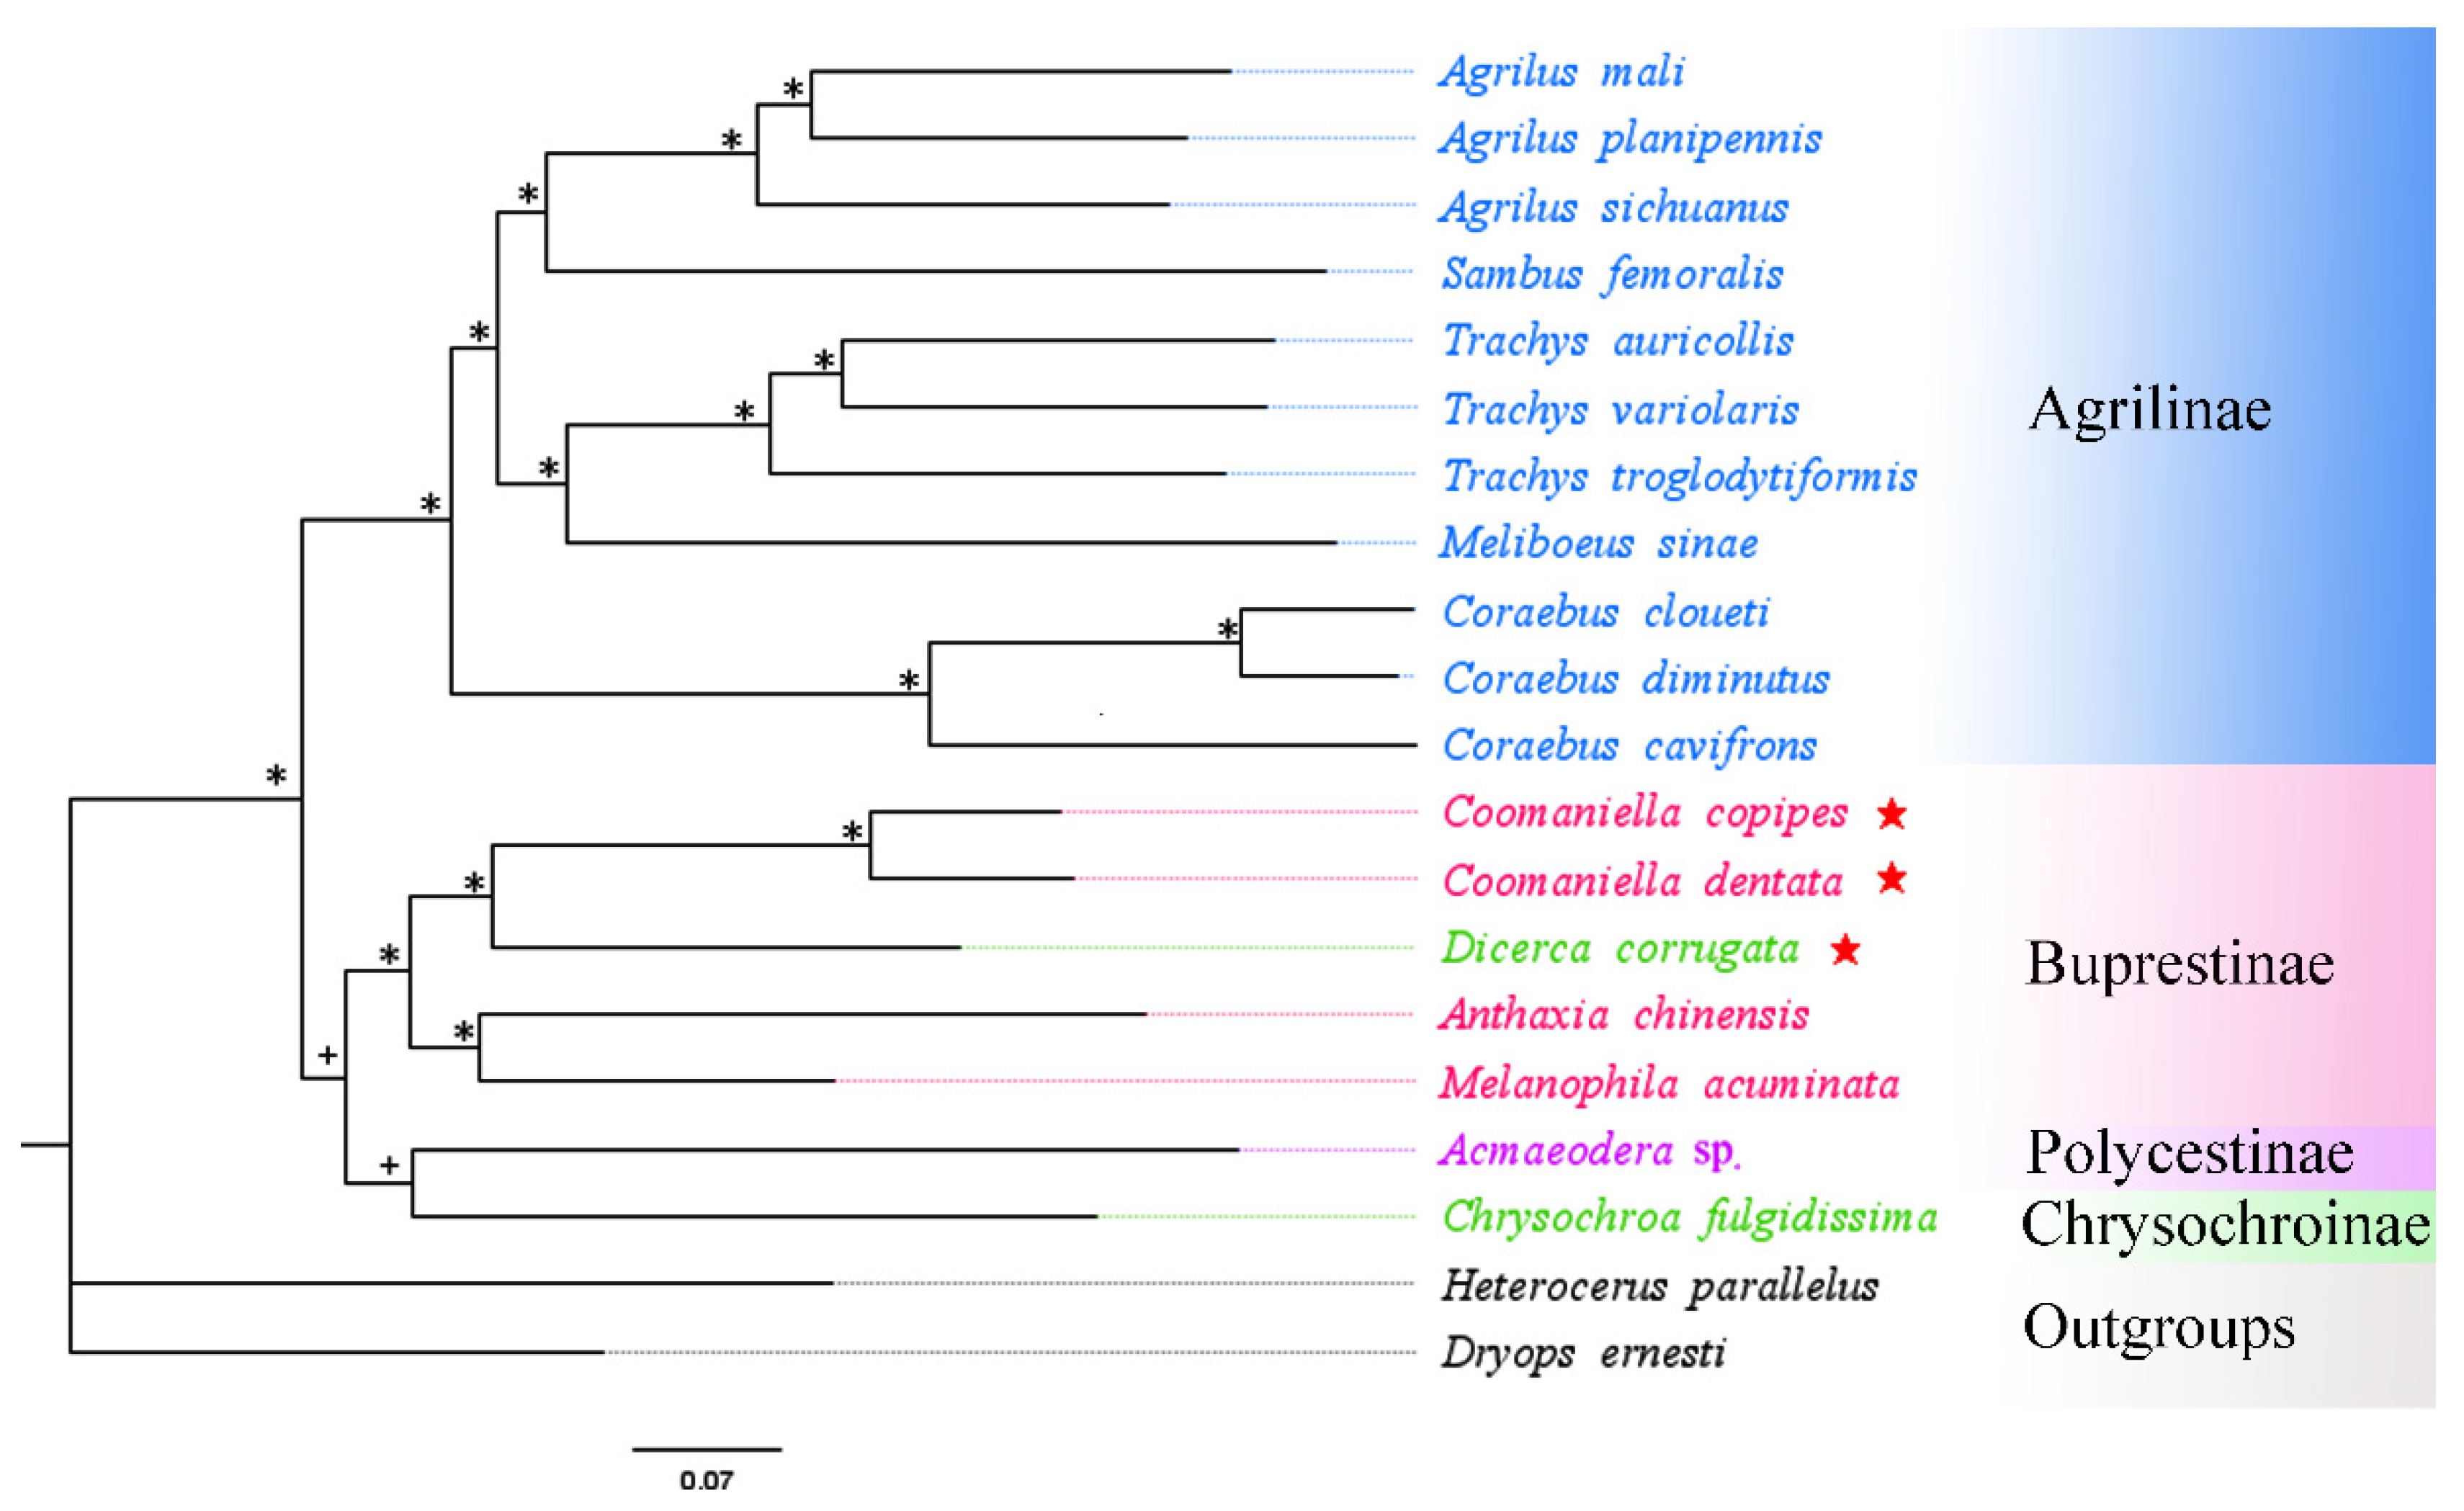
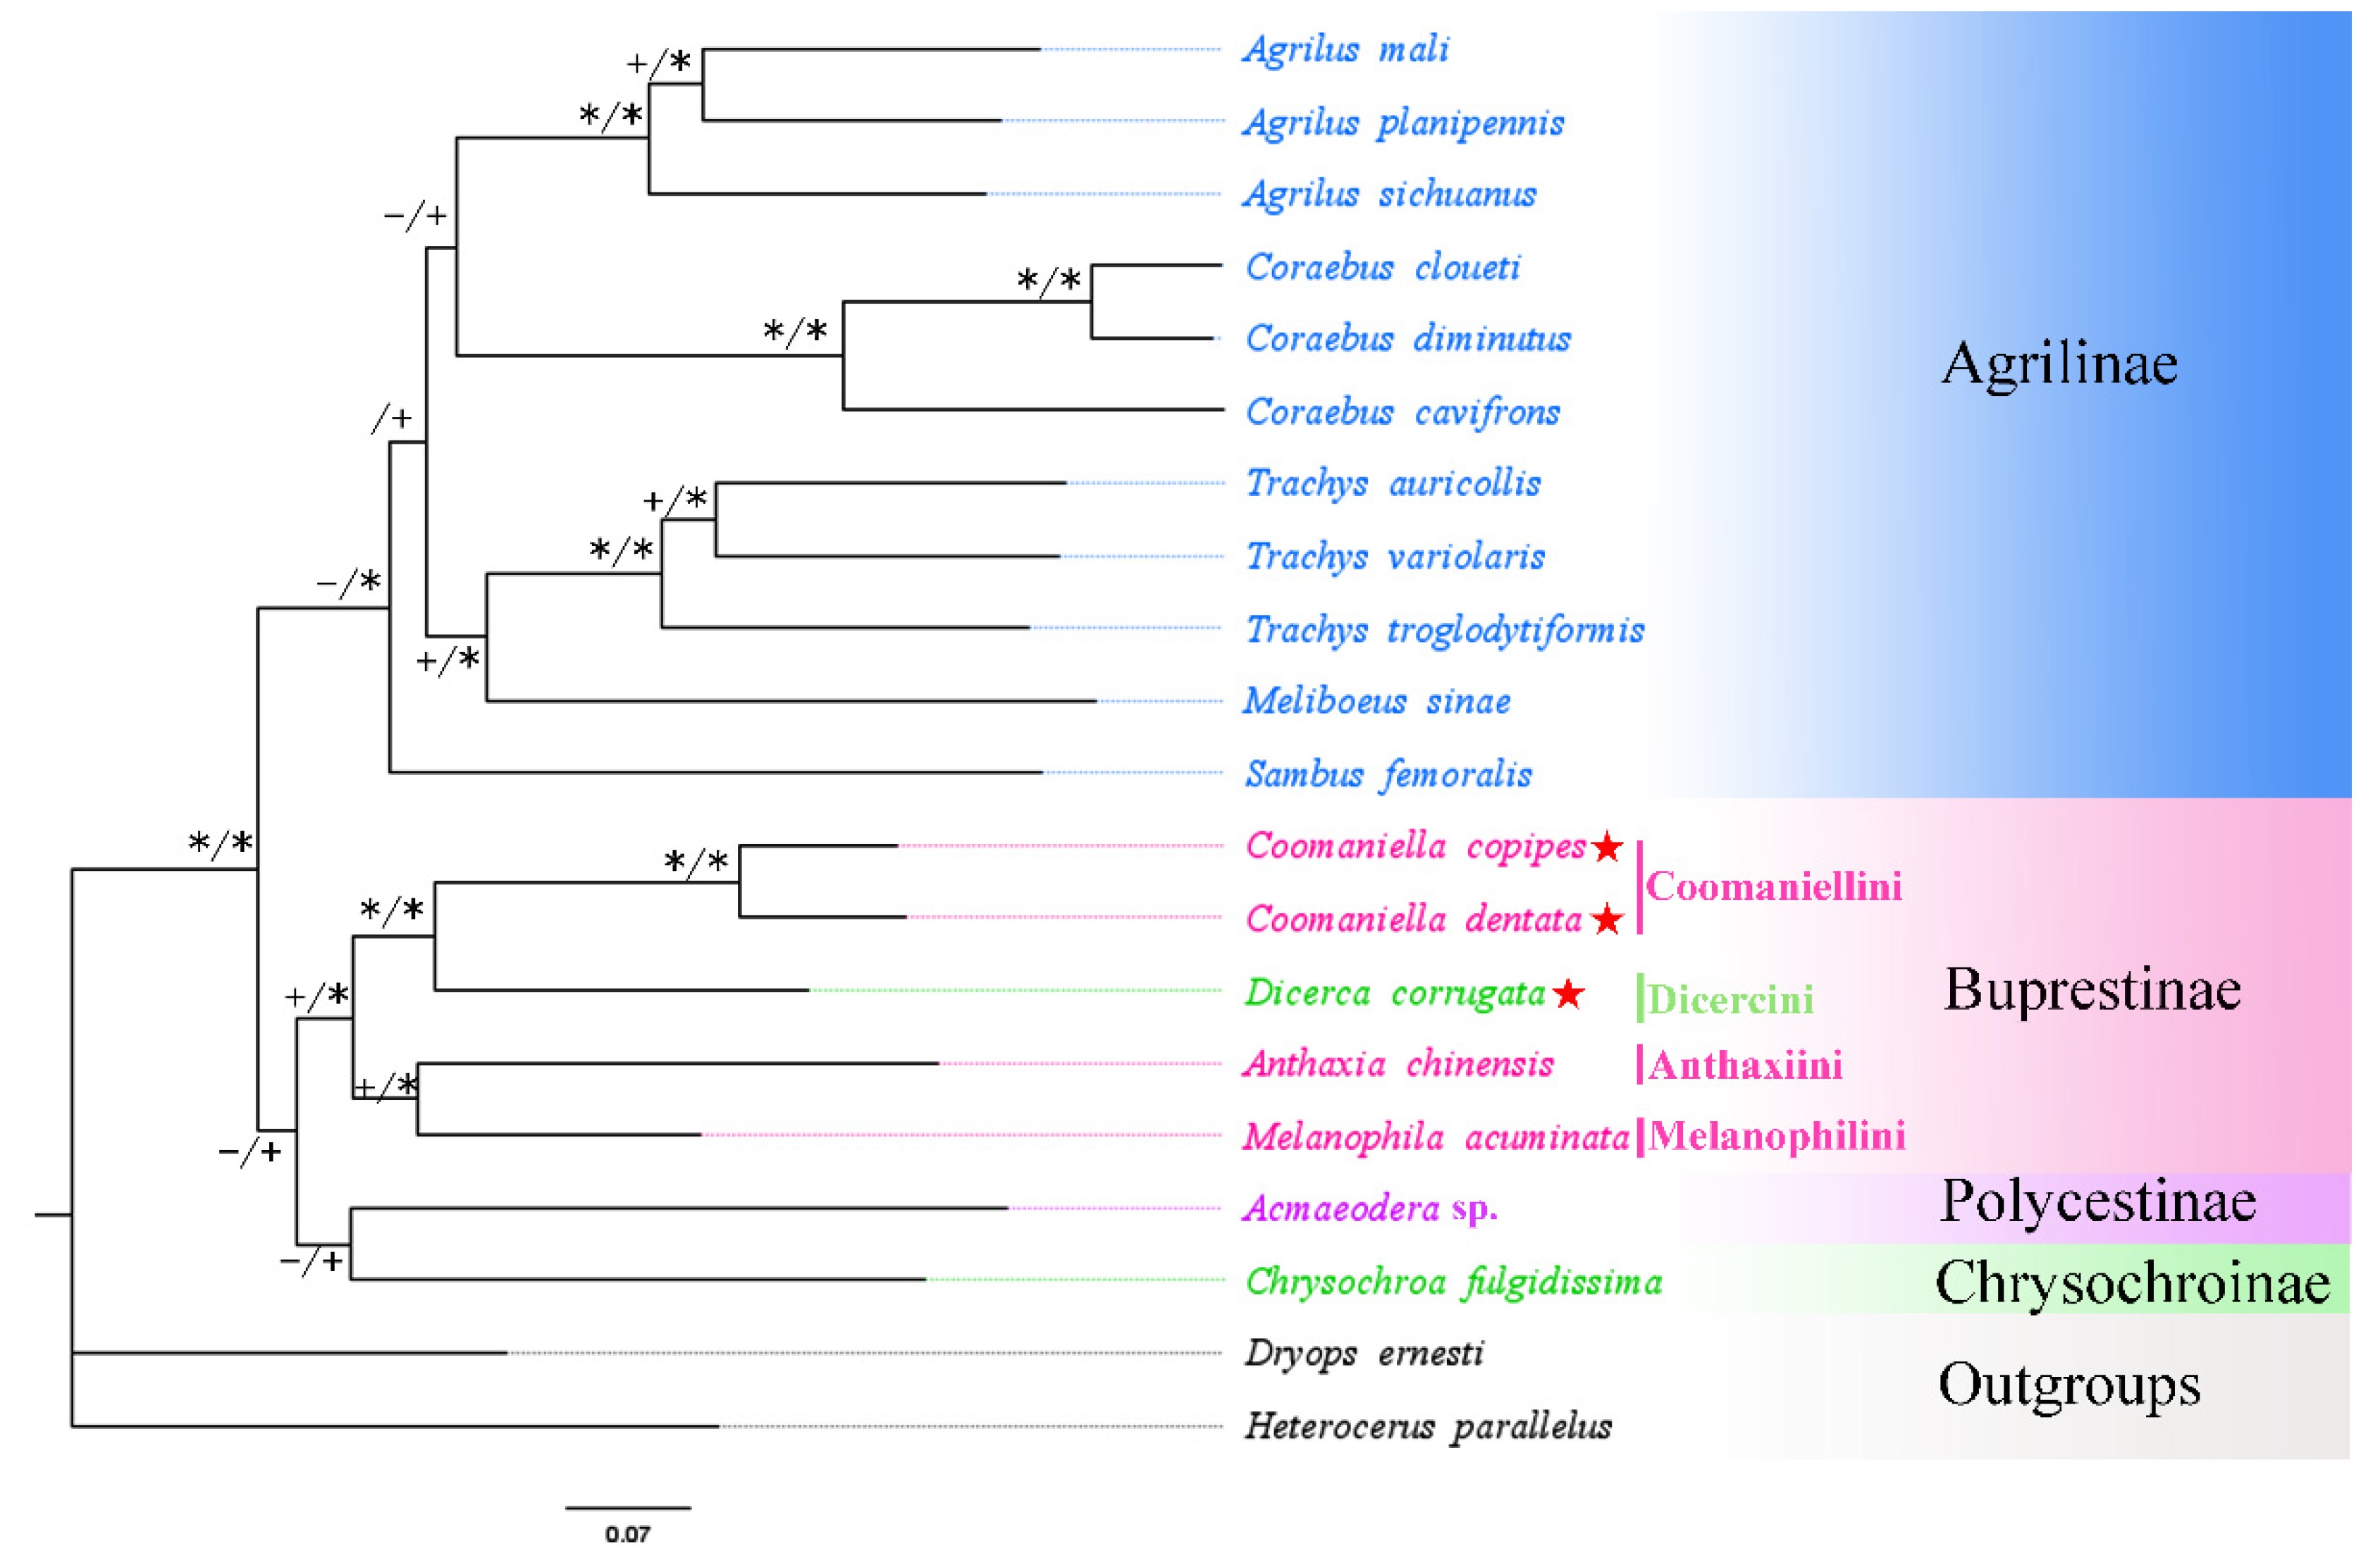
3.5. Phylogenetic Analysis
4. Conclusions
Supplementary Materials
Author Contributions
Funding
Institutional Review Board Statement
Informed Consent Statement
Data Availability Statement
Conflicts of Interest
References
- Bellamy, C.L. An illustrated summary of the higher classification of the superfamily Buprestoidea (Coleoptera). Folia Heyrovskiana Suppl. 2003, 10, 1–197. [Google Scholar]
- Bellamy, C.L. A World Catalogue and Bibliography of the Jewel Beetles (Coleoptera: Buprestoidea), Pensoft Series Faunistica; Pensoft Publishers: Sofia, Bulgaria; Moscow, Russia, 2008; Volumes 1–4, pp. 9–2684. [Google Scholar]
- Haack, R.A.; Jendek, E.; Liu, H.; Marchant, K.R.; Petrice, T.R.; Poland, T.M.; Ye, H. The emerald ash borer: A new exotic pest in North America. Newslett. Mich. Entomol. Soc. 2002, 47, 1–5. [Google Scholar]
- Haack, R.A.; Petrice, T.R.; Zablotny, J.E. First report of the European oak borer, Agrilus sulcicollis (Coleoptera: Buprestidae), in the United States. Gt. Lake Entomol. 2009, 42, 1–7. [Google Scholar]
- Herms, D.A. Strategies for deployment of insect resistant ornamental plants. In Mechanisms and Deployment of Resistance in Trees to Insects; Wagner, M.R., Clancy, K.M., Lieutier, F., Paine, T.D., Eds.; Kluwer Academic Publishing: Dordrecht, The Netherlands, 2002; pp. 217–237. [Google Scholar]
- Herms, D.A.; McCullough, D.G. Emerald ash borer invasion of North America: History, biology, ecology, impact and management. Annu. Rev. Entomol. 2014, 59, 13–30. [Google Scholar] [CrossRef] [PubMed] [Green Version]
- Bozorov, T.A.; Luo, Z.H.; Li, X.S.; Zhang, D.Y. Agrilus mali Matsumara (Coleoptera: Buprestidae), a new invasive pest of wild apple in western China: DNA barcoding and life cycle. Ecol. Evol. 2018, 9, 1160–1172. [Google Scholar] [CrossRef] [Green Version]
- Apel, K.H.; Katzel, R.; Luttschwager, D.; Schmitz, H.; Schutz, S. Investigations on possible mechanisms of the host finding by Phaenops cyanea F. (Col., Buprestidae). Mitt. Dtsch. Ges. Allg. Angew. Ent. 2000, 12, 23–27. [Google Scholar]
- Xu, G.X.; Liu, Y.M.; Wu, W. Occurrence rhythm and control of Chrysobothris igai at Orange Stand. J. Zhejiang For. Sci. Tech. 2006, 26, 49–52. [Google Scholar]
- Cobos, A. Ensayo sobre los géneros de la subfamilia Polycestinae (Coleoptera, Buprestidae) (Parte I). EOS Rev. Esp. Entomol. 1980, 54, 15–94. [Google Scholar]
- Cobos, A. Fauna Iberica de Coleopteros Buprestidae; Consejo Superior de Invertigaciones Cientificas: Madrid, Spain, 1986; pp. 1–364. [Google Scholar]
- Tôyama, M. The systematic positions of some buprestid genera (Coleoptera, Buprestidae). Elytra 1987, 15, 1–11. [Google Scholar]
- Hołyński, R.B. Remarks on the general classification of Buprestidae Leach as applied to Maoraxiina. Folia Entomol. Hung. 1988, 49, 49–54. [Google Scholar]
- Hołyński, R.B. A reassessment of the internal classification of the Buprestidae Leach (Coleoptera). Cryst. Ser. Zool. 1993, 1, 1–42. [Google Scholar]
- Evans, A.M.; Mckenna, D.D.; Bellamy, C.L.; Farrell, B.D. Large-scale molecular phylogeny of metallic wood-boring beetles (Coleoptera: Buprestoidea) provides new insights into relationships and reveals multiple evolutionary origins of the larval leaf-mining habit. Syst. Entomol. 2015, 40, 385–400. [Google Scholar] [CrossRef]
- Hansen, J.A.; Moulton, J.K.; Klingeman, W.E.; Oliver, J.B.; Windham, M.T.; Trigiano, R.N.; Reding, M.E. Molecular systematics of the Chrysobothris femorata species group (Coleoptera: Buprestidae). Ann. Entomol. Soc. AM 2016, 108, 950–963. [Google Scholar] [CrossRef]
- Pentinsaari, M.; Mutanen, M.; Kaila, L. Cryptic diversity and signs of mitochondrial introgression in the Agrilus viridis species complex (coleoptera: Buprestidae). Eur. J. Entomol. 2014, 111, 475–486. [Google Scholar] [CrossRef] [Green Version]
- Pellegrino, I.; Curletti, G.; Liberatore, F.; Cucco, M. Cryptic diversity of the jewel beetles Agrilus viridis (Coleoptera: Buprestidae) hosted on hazelnut. Eur. Zool. J. 2017, 84, 465–472. [Google Scholar] [CrossRef] [Green Version]
- Kelnarova, I.; Jendek, E.; Grebennikov, V.V.; Bocak, L. First molecular phylogeny of Agrilus (Coleoptera: Buprestidae), the largest genus on Earth, with DNA barcode database for forestry pest diagnostics. B Entomol. Res. 2019, 109, 200–211. [Google Scholar] [CrossRef]
- Bílý, S. A revision of the genus Coomaniella Bourgoin of the Coomaniellini tribe nov. (Coleoptera, Buprestidae). Acta Entomol. Bohemoslov. 1974, 71, 30–41. [Google Scholar]
- Jendek, E.; Pham, H.T. Seven new species of Coomaniella Bourgoin, 1924 (Coleoptera: Buprestidae) with redefinition of species-groups and remarks on distribution and biology. Bonn Zool. Bull. 2013, 62, 111–123. [Google Scholar]
- Song, H.T. A new species of Coomaniella (Coleoptera, Buprestidae, Coomaniellini) from Guangxi, China, with new distributional records and biological observations. Zookeys 2021, 1010, 185–190. [Google Scholar] [CrossRef]
- Saccone, C.; De Giorgi, C.; Gissi, C.; Pesole, G.; Reyes, A. Evolutionary genomics in Metazoa: The mitochondrial DNA as a model system. Gene 1999, 238, 195–209. [Google Scholar] [CrossRef]
- Cameron, S.L. Insect mitochondrial genomics: Implications for evolution and phylogeny. Annu. Rev. Entomol. 2014, 59, 95–117. [Google Scholar] [CrossRef] [PubMed] [Green Version]
- Li, H.; Shao, R.F.; Song, N.; Song, F.; Jiang, P.; Li, Z.H.; Cai, W.Z. Higher-level phylogeny of paraneopteran insects inferred from mitochondrial genome sequences. Sci. Rep. 2015, 5, 8527. [Google Scholar] [CrossRef] [PubMed] [Green Version]
- Qin, J.; Zhang, Y.Z.; Zhou, X.; Kong, X.B.; Wei, S.J.; Ward, R.D.; Zhang, A.B. Mitochondrial phylogenomics and genetic relationships of closely related pine moth (Lasiocampidae: Dendrolimus) species in China, using whole mitochondrial genomes. BMC Genom. 2015, 16, 428. [Google Scholar] [CrossRef] [PubMed] [Green Version]
- Tian, T.; Yuan, H.; Chen, B. Phylogeny of hydradephagan water beetles (Coleoptera: Adephaga) inferred with mitochondrial genome sequences. Acta Entomol. Sin. 2020, 63, 1016–1027. [Google Scholar]
- Krzywinski, J.; Li, C.; Morris, M.; Conn, J.E.; Lima, J.B.; Povoa, M.M.; Wilkerson, R.C. Analysis of the evolutionary forces shaping mitochondrial genomes of a Neotropical malaria vector complex. Mol. Phylogenet. Evol. 2011, 58, 469–477. [Google Scholar] [CrossRef] [PubMed] [Green Version]
- Yan, L.P.; Pape, T.; Elgar, M.A.; Gao, Y.Y.; Zhang, D. Evolutionary history of stomach bot flies in the light of mitogenomics. Syst. Entomol. 2019, 44, 797–809. [Google Scholar] [CrossRef]
- Motyka, M.; Kusy, D.; Háva, J.; Jahodářová, E.; Bílková, R.; Vogler, A.P.; Bocak, L. Mitogenomic data elucidate the phylogeny and evolution of life strategies in Dermestidae (Coleoptera). Syst. Entomol. 2022, 47, 82–93. [Google Scholar] [CrossRef]
- Nie, R.E.; Wei, J.; Zhang, S.K.; Vogler, A.P.; Wu, L.; Konstantinov, A.S.; Li, W.Z.; Yang, X.K.; Xue, H.J. Diversification of mitogenomes in three sympatric Altica flea beetles (Insecta, Chrysomelidae). Zool. Scr. 2019, 48, 657–666. [Google Scholar] [CrossRef]
- Park, J.S.; Cho, Y.; Kim, M.J.; Nam, S.H.; Kim, I. Description of complete mitochondrial genome of the black-veined white, Aporia crataegi (Lepidoptera: Papilionoidea), and comparison to papilionoid species. J. Asia-Pac. Entomol. 2012, 15, 331–341. [Google Scholar] [CrossRef]
- Wang, W.Q.; Huang, Y.X.; Bartlett, C.R.; Zhou, F.M.; Meng, H.; Qin, D.Z. Characterization of the complete mitochondrial genomes of two species of the genus Aphaena Guérin-Méneville (Hemiptera: Fulgoridae) and its phylogenetic implications. Int. J. Biol. Macromol. 2019, 141, 29–40. [Google Scholar] [CrossRef]
- Song, X.X.; Zhao, Y.; Song, C.Y.; Chen, M.J.; Huang, J.C.; Bao, D.P.; Tan, Q.; Yang, R.H. Mitogenome types of two Lentinulaedodes sensu lato populations in China. Sci. Rep. 2019, 9, 9421. [Google Scholar] [CrossRef] [PubMed]
- Lim, L.W.K.; Chung, H.H.; Lau, M.M.L.L.; Aziz, F.; Gan, H.M. Improving the phylogenetic resolution of Malaysian and Javan mahseer (Cyprinidae), Tor tambroides and Tor tambra: Whole mitogenomes sequencing, phylogeny and potential mitogenome markers. Gene 2021, 791, 145708. [Google Scholar] [CrossRef] [PubMed]
- Hong, M.Y.; Jeong, H.C.; Kim, M.J.; Jeong, H.U.; Lee, S.H.; Kim, I. Complete mitogenome sequence of the jewel beetle, Chrysochroa fulgidissima (Coleoptera: Buprestidae). Mitochondrial DNA 2009, 20, 46–60. [Google Scholar] [CrossRef] [PubMed]
- Xiao, L.F.; Zhang, S.D.; Long, C.P.; Guo, Q.Y.; Xu, J.S.; Dai, X.H.; Wang, J.G. Complete mitogenome of a leaf-Mining buprestid Beetle, Trachys auricollis, and its phylogenetic implications. Genes 2019, 10, 992. [Google Scholar] [CrossRef] [PubMed] [Green Version]
- Sun, H.Q.; Zhao, W.X.; Lin, R.Z.; Zhou, Z.F.; Huai, W.X.; Yao, Y.X. The conserved mitochondrial genome of the jewel beetle (Coleoptera: Buprestidae) and its phylogenetic implications for the suborder Polyphaga. Genomics 2020, 112, 3713–3721. [Google Scholar] [CrossRef]
- Peng, X.J.; Liu, J.; Wang, Z.; Zhan, Q.Z. The complete mitochondrial genome of the pyrophilous jewel beetle Melanophila acuminata (Coleoptera: Buprestidae). Mitochondrial DNA B 2021, 6, 1059–1060. [Google Scholar] [CrossRef]
- Chen, B.; Wei, Z.H.; Shi, A.M. The complete mitochondrial genome of the jewel beetle, Anthaxia chinensis (Coleoptera: Buprestidae). Mitochondrial DNA B 2021, 6, 2962–2963. [Google Scholar] [CrossRef]
- Wei, Z.H. The complete mitochondrial genomes of five Agrilinae (Coleoptera, Buprestidae) species and phylogenetic implications. Zookeys 2022, 1092, 195–212. [Google Scholar] [CrossRef]
- Duan, J.; Quan, G.X.; Mittapalli, O.; Cusson, M.; Krell, P.J.; Doucet, D. The complete mitogenome of the Emerald Ash Borer (EAB), Agrilus planipennis (Insecta: Coleoptera: Buprestidae). Mitochondrial DNA B 2017, 2, 134–135. [Google Scholar] [CrossRef] [Green Version]
- Cao, L.M.; Wang, X.Y. The complete mitochondrial genome of the jewel beetle Coraebus cavifrons (Coleoptera: Buprestidae). Mitochondrial DNA B 2019, 4, 2407–2408. [Google Scholar] [CrossRef] [Green Version]
- Cao, L.M.; Wang, X.Y. The complete mitochondrial genome of the jewel beetle Trachys variolaris (Coleoptera: Buprestidae). Mitochondrial DNA B 2019, 4, 3042–3043. [Google Scholar] [CrossRef] [PubMed] [Green Version]
- Sheffield, N.C.; Song, H.; Cameron, S.L.; Whiting, M.F. Nonstationary evolution and compositional heterogeneity in beetle mitochondrial phylogenomics. Syst. Biol. 2009, 58, 381–394. [Google Scholar] [CrossRef] [PubMed] [Green Version]
- Hahn, C.; Bachmann, L.; Chevreux, B. Reconstructing mitochondrial genomes directly from genomic next-generation sequencing reads—A baiting and iterative mapping approach. Nucleic Acids Res. 2013, 41, e129. [Google Scholar] [CrossRef] [PubMed] [Green Version]
- Kearse, M.; Moir, R.; Wilson, A.; Stones-Havas, S.; Cheung, M.; Sturrock, S.; Buxton, S.; Cooper, A.; Markowitz, S.; Duran, C.; et al. Geneious Basic: An integrated and extendable desktop software platform for the organization and analysis of sequence data. Bioinformatics 2012, 28, 1647–1649. [Google Scholar] [CrossRef]
- Bernt, M.; Donath, A.; Jühling, F.; Externbrink, F.; Florentz, C.; Fritzsch, G.; Pütz, J.; Middendorf, M.; Stadler, P.F. MITOS: Improved de novo metazoan mitochondrial genome annotation. Mol. Phylogenet. Evol. 2013, 69, 313–319. [Google Scholar] [CrossRef]
- Lowe, T.M.; Chan, P.P. tRNAscan-SE On-line: Integrating search and context for analysis of transfer RNA genes. Nucleic Acids Res. 2016, 33, 686–689. [Google Scholar] [CrossRef]
- Greiner, S.; Lehwark, P.; Bock, R. OrganellarGenomeDRAW (OGDRAW) version 1.3.1: Expanded toolkit for the graphical visualization of organellar genomes. Nucleic Acids Res. 2019, 47, 59–64. [Google Scholar] [CrossRef] [Green Version]
- Kumar, S.; Stecher, G.; Tamura, K. MEGA7: Molecular Evolutionary Genetics Analysis version 7.0 for bigger datasets. Mol. Biol. Evol. 2016, 33, 1870–1874. [Google Scholar] [CrossRef] [Green Version]
- Perna, N.T.; Kocher, T.D. Patterns of nucleotide composition at fourfold degenerate sites of animal mitochondrial genomes. J. Mol. Evol. 1995, 3, 353–358. [Google Scholar] [CrossRef]
- Librado, P.; Rozas, J. DnaSP v5: A software for comprehensive analysis of DNA polymorphism data. Bioinformatics 2009, 25, 1451–1452. [Google Scholar] [CrossRef] [Green Version]
- Zhang, D.; Gao, F.; Jakovlić, I.; Zou, H.; Zhang, J.; Li, W.X.; Wang, G.T. PhyloSuite: An integrated and scalable desktop platform for streamlined molecular sequence data management and evolutionary phylogenetics studies. Mol. Ecol. Resour. 2020, 20, 348–355. [Google Scholar] [CrossRef] [PubMed]
- Thompson, J.D.; Higgins, D.G.; Gibson, T.J. Clustal W: Improving the sensitivity of progressive multiple sequence alignment through sequence weight, position-specific gap penalties and weight matrix choice. Nucleic Acids Res. 1994, 22, 4673–4680. [Google Scholar] [CrossRef] [PubMed] [Green Version]
- Capella-Gutiérrez, S.; Silla-Martínez, J.M.; Gabaldón, T. TrimAl: A tool for automated alignment trimming in large-scale phylogenetic analyses. Bioinformatics 2009, 25, 1972–1973. [Google Scholar] [CrossRef] [PubMed]
- Kalyaanamoorthy, S.; Minh, B.Q.; Wong, T.K.F.; von Haeseler, A.; Jermiin, L.S. ModelFinder: Fast model selection for accurate phylogenetic estimates. Nat. Methods 2017, 14, 587–589. [Google Scholar] [CrossRef] [PubMed] [Green Version]
- Guindon, S.; Dufayard, J.; Lefort, V.; Anisimova, M.; Hordijk, W.; Gascuel, O. New algorithms and methods to estimate maximum-likelihood phylogenies: Assessing the performance of PhyML 3.0. Syst. Biol. 2010, 59, 307–321. [Google Scholar] [CrossRef] [PubMed] [Green Version]
- Ronquist, F.; Teslenko, M.; Der Mark, P.V.; Ayres, D.L.; Darling, A.E.; Hohna, S.; Huelsenbeck, J.P. MrBayes 3.2: Efficient Bayesian Phylogenetic Inference and Model Choice across a Large Model Space. Syst. Biol. 2012, 61, 539–542. [Google Scholar] [CrossRef] [PubMed] [Green Version]
- Horton, D.L.; Mcelhinney, L.M.; Freuling, C.M.; Marston, D.A.; Banyard, A.C.; Goharrriz, H.; Fooks, A.R. Complex Epidemiology of a Zoonotic Disease in a Culturally Diverse Region: Phylogeography of Rabies Virus in the Middle East. PLoS Neglect. Trop. D 2015, 9, e0003569. [Google Scholar] [CrossRef]
- Boore, J.L.; Brown, W.M. Big trees from little genomes: Mitochondrial gene order as a phylogenetic tool. Curr. Opin. Genet. Dev. 1998, 8, 668–674. [Google Scholar] [CrossRef]
- Boore, J.L. Animal mitochondrial genomes. Nucleic Acids Res. 1999, 27, 1767–1780. [Google Scholar] [CrossRef] [Green Version]
- Wang, Q.; Huang, J.H.; Wu, H. Mitogenomes provide insights into the phylogeny of Mycetophilidae (Diptera: Sciaroidea). Gene 2021, 783, 145564. [Google Scholar] [CrossRef]
- Li, J.; Lv, Q.; Zhang, X.M.; Han, H.l.; Zhang, A.B. Characterization and Phylogenetic Analysis of the Complete Mitochondrial Genome of Laelia suffusa (Lepidoptera: Erebidae, Lymantriinae). J. Insect Sci. 2021, 21, 5. [Google Scholar] [CrossRef] [PubMed]
- Zhang, Z.Q.; Wang, X.J.; Li, R.Z.; Guo, R.J.; Zhang, W.; Song, W.; Hao, C.; Wang, H.; Li, M. The mitochondrial genome of dastarcus helophoroides (Coleoptera: Bothrideridae) and related phylogenetic analyses. Gene 2015, 560, 1. [Google Scholar] [CrossRef] [PubMed]
- Timmermans, M.J.T.N.; Vogler, A.P. Phylogenetically informative rearrangements in mitochondrial genomes of Coleoptera, and monophyly of aquatic elateriform beetles (Dryopoidea). Mol. Phylogenet. Evol. 2012, 2, 299–304. [Google Scholar] [CrossRef] [PubMed]
- Yang, F.; Du, Y.; Cao, J.; Huang, F. Analysis of three leafminers’ complete mitochondrial genomes. Gene 2013, 529, 1–6. [Google Scholar] [CrossRef]
- Friedrich, M.; and Muquim, N. Sequence and phylogenetic analysis of the complete mitochondrial genome of the flour beetle Tribolium castanaeum. Mol. Phylogenet. Evol. 2003, 26, 502–512. [Google Scholar] [CrossRef]
- Anderson, S.; Bankier, A.T.; Barrell, B.G.; de Bruijin, M.H.L.; Droujn, A.R.J.; Eperon, I.C.; Nierlich, D.P.; Roe, B.A.; Sanger, F.; Schreier, P.H.; et al. Sequence and organization of the human mitochondrial genome. Nature 1981, 290, 457–465. [Google Scholar] [CrossRef] [PubMed]
- Ojala, D.; Montoya, J.; Attardi, G. TRNA punctuation model of RNA processing in human mitochondria. Nature 1981, 290, 470–474. [Google Scholar] [CrossRef]
- Shen, X.; Li, X.; Sha, Z.; Yan, B.; Xu, Q. Complete mitochondrial genome of the Japanese snapping shrimp Alpheus japonicus (Crustacea: Decapoda: Caridea): Gene rearrangement and phylogeny within Caridea. Sci. China Life Sci. 2012, 55, 591–598. [Google Scholar] [CrossRef] [Green Version]
- Li, H.; Liu, H.Y.; Song, F.; Shi, A.M.; Zhou, X.G.; Cai, W.Z. Comparative mitogenomic analysis of damsel bugs representing three tribes in the family Nabidae (Insecta: Hemiptera). PLoS ONE 2012, 7, e45925. [Google Scholar] [CrossRef]
- Song, F.; Li, H.; Jiang, P.; Zhou, X.; Liu, J.P.; Sun, C.H.; Vogler, A.P.; Cai, W.Z. Capturing the phylogeny of holometabola with mitochondrial genome data and Bayesian site-heterogeneous mixture models. Genome Biol. Evol. 2016, 8, 1411–1426. [Google Scholar] [CrossRef]
- Sheffield, N.C.; Song, H.; Cameron, S.L.; and Whiting, M.F. A Comparative analysis of mitochondrial genomes in Coleoptera (Arthropoda: Insecta) and genome descriptions of six new beetles. Mol. Biol. Evol. 2008, 25, 2499–2509. [Google Scholar] [CrossRef] [PubMed] [Green Version]
- Podsiadlowski, L. The mitochondrial genome of the bristletail Petrobius brevistylis (Archaeognatha: Machilidae). Insect Mol. Biol. 2010, 15, 253–258. [Google Scholar] [CrossRef] [PubMed]
- Li, R.; Shu, X.H.; Li, X.D.; Meng, L.; Li, B.P. Comparative mitogenome analysis of three species and monophyletic inference of Catantopinae (Orthoptera: Acridoidea). Genomics 2019, 111, 1728–1735. [Google Scholar] [CrossRef] [PubMed]
- Yuan, M.L.; Zhang, Q.L.; Zhang, L.; Guo, Z.L.; Liu, Y.J.; Shen, Y.Y.; Shao, R. High-level phylogeny of the Coleoptera inferred with mitochondrial genome sequences. Mol. Phylogenet. Evol. 2016, 104, 99–111. [Google Scholar] [CrossRef] [PubMed]
- Chen, Z.T.; Zhao, M.Y.; Xu, C.; Du, Y.Z. Molecular phylogeny of Systellognatha (Plecoptera: Arctoperlaria) inferred from mitochondrial genome sequences. Int. J. Boil. Macromol. 2018, 111, 542–547. [Google Scholar] [CrossRef]
- Volkovitsh, M.G. The comparative morphology of antennal structures in Buprestidae (Coleoptera): Evolutionary trends, taxonomic and phylogenetic implications. Part 1. Acta Mus. Morav. Sci. Biol. 2001, 86, 43–169. [Google Scholar]


| No. | Family/Subfamily | Taxa | Accession No. | Genome Size (bp) | A + T% | AT-Skew | GC-Skew | Location/References |
|---|---|---|---|---|---|---|---|---|
| 1 | Buprestinae | Melanophila acuminata | MW287594 | 15,853 | 75.66 | 0.02 | −0.25 | [39] |
| 2 | Buprestinae | Anthaxia chinensis | MW929326 | 15,881 | 73.61 | 0.09 | −0.29 | [40] |
| 3 | Buprestinae | Coomaniella copipes | OL694145 | 16,196 | 74.47 | 0.03 | −0.24 | This study |
| 4 | Buprestinae | Coomaniella dentata | OL694144 | 16,179 | 76.59 | 0.01 | −0.21 | This study |
| 5 | Chrysochroinae | Dicerca corrugata | OL753086 | 16,276 | 71.76 | 0.09 | −0.21 | This study |
| 6 | Chrysochroinae | Chrysochroa fulgidissima | EU826485 | 15,592 | 69.92 | 0.15 | −0.24 | [36] |
| 7 | Agrilinae | Coraebus diminutus | OK189521 | 15,499 | 68.42 | 0.12 | −0.25 | [41] |
| 8 | Agrilinae | Coraebus cloueti | OK189520 | 15,514 | 69.27 | 0.11 | −0.25 | [41] |
| 9 | Agrilinae | Meliboeus sinae | OK189522 | 16,108 | 72.42 | 0.11 | −0.22 | [41] |
| 10 | Agrilinae | Sambus femoralis | OK349489 | 15,367 | 73.23 | 0.12 | −0.18 | [41] |
| 11 | Agrilinae | Agrilus sichuanus | OK189519 | 16,521 | 71.73 | 0.12 | −0.21 | [41] |
| 12 | Agrilinae | Agrilus planipennis | KT363854 | 15,942 | 71.90 | 0.12 | −0.24 | [42] |
| 13 | Agrilinae | Agrilus mali | MN894890 | 16,204 | 74.46 | 0.08 | −0.18 | [38] |
| 14 | Agrilinae | Coraebus cavifrons | MK913589 | 15,686 | 69.79 | 0.12 | −0.18 | [43] |
| 15 | Agrilinae | Trachys auricollis | MH638286 | 16,429 | 71.05 | 0.10 | −0.20 | [37] |
| 16 | Agrilinae | Trachys troglodytiformis | KX087357 | 16,316 | 74.62 | 0.10 | −0.19 | unpublished |
| 17 | Agrilinae | Trachys variolaris | MN178497 | 16,771 | 72.11 | 0.11 | −0.21 | [44] |
| 18 | Polycestinae | Acmaeodera sp. | FJ613420 | 16,217 | 68.41 | 0.11 | −0.25 | [45] |
| 19 | Heteroceridae | Heterocerus parallelus | KX087297 | 15,845 | 74.03 | 0.13 | −0.24 | unpublished |
| 20 | Dryopidae | Dryops ernesti | KX035147 | 15,672 | 72.98 | 0.07 | −0.23 | unpublished |
| Gene | Strand | Position | Codons | Anticodon | IGN | ||
|---|---|---|---|---|---|---|---|
| From | To | Start | Stop | ||||
| nad2 | J | 199/201/201 | 1221/1223/1223 | ATT/ATT/ATT | TAA/TAA/TAA | −2/−2/−2 | |
| cox1 | J | 1405/1407/1405 | 2935/2937/2935 | –/–/– | T/T/T | 0/0/0 | |
| cox2 | J | 3001/3003/3001 | 3685/3684/3682 | ATA/ATA/ATA | T/T/T | 0/0/0 | |
| atp8 | J | 3822/3824/3817 | 3977/3979/3972 | ATT/ATC/ATT | TAA/TAA/TAA | −7/−7/−7 | |
| atp6 | J | 3971/3973/3966 | 4645/4647/4640 | ATG/ATG/ATG | TAA/TAA/TAA | −1/−1/−1 | |
| cox3 | J | 4645/4647/4640 | 5431/5433/5426 | ATG/ATG/ATG | T/T/T | 0/0/0 | |
| nad3 | J | 5494/5496/5490 | 5847/5849/5843 | ATT/ATT/ATT | TAG/TAG/TAG | −2/−1/−2 | |
| nad5 | N | 6231/6229/6227 | 7950/7948/7946 | ATT/ATT/ATT | T/T/T | 0/0/0 | |
| nad4 | N | 8016/8013/8012 | 9351/9348/9347 | ATG/ATG/ATG | T/T/T | −7/−7/−7 | |
| nad4l | N | 9345/9342/9341 | 9629/9626/9631 | ATG/ATG/ATG | TAA/TAA/TAA | 2/2/2 | |
| nad6 | J | 9760/9757/9763 | 10,269/10,266/10,263 | ATT/ATT/ATT | TAA/TAA/TAA | −1/−1/−1 | |
| cytb | J | 10,269/10,266/10,263 | 11,411/11,408/11,405 | ATG/ATG/ATG | TAG/TAG/TAG | −2/−2/−2 | |
| nad1 | N | 11,493/12,485/11,501 | 12,446/12,441/12,451 | TTG/TTG/TTG | TAA/TAA/TAG | 1/1/1 | |
| trnI | J | 1/1/1 | 64/65/65 | GAT | −3/−3/−3 | ||
| trnQ | N | 62/63/63 | 130/131/131 | TTG | −1/0/0 | ||
| trnM | J | 130/132/132 | 198/200/200 | CAT | 0/0/0 | ||
| trnW | J | 1220/1222/1222 | 1284/1286/1287 | TCA | −8/−8/−8 | ||
| trnC | N | 1277/1279/1280 | 1337/1339/1341 | GCA | 0/0/0 | ||
| trnY | N | 1338/1340/1342 | 1403/1405/1403 | GTA | 1/1/1 | ||
| trnL2 | J | 2936/2938/2936 | 3000/3002/3000 | TAA | 0/0/0 | ||
| trnK | J | 3686/3685/3683 | 3755/3754/3752 | CTT | 0/0/0 | ||
| trnD | J | 3756/3755/3753 | 3820/3823/3816 | GTC | 1/0/0 | ||
| trnG | J | 5432/5434/5427 | 5493/5495/5489 | TCC | 0/0/0 | ||
| trnA | J | 5846/5849/5842 | 5908/5910/5904 | TGC | −1/0/−1 | ||
| trnR | J | 5908/5911/5904 | 5971/5970/5970 | TCG | −1/0/−3 | ||
| trnN | J | 5971/5971/5968 | 6037/6035/6032 | GTT | 0/0/0 | ||
| trnS1 | J | 6038/6036/6033 | 6104/6101/6099 | TCT | 0/0/0 | ||
| trnE | J | 6105/6102/6100 | 6168/6165/6163 | TTC | −1/−1/−1 | ||
| trnF | N | 6168/6165/6163 | 6230/6228/6226 | GAA | 0/0/0 | ||
| trnH | N | 7951/7949/7947 | 8015/8012/8011 | GTG | 0/0/0 | ||
| trnT | J | 9632/9629/9634 | 9694/9691/9696 | TGT | 0/0/0 | ||
| trnP | N | 9695/9692/9697 | 9758/9755/9761 | TGG | 1/1/1 | ||
| trnS2 | J | 11,410/11,407/11,404 | 11,474/12,470/11,471 | TGA | 18/14/29 | ||
| trnL1 | N | 12,448/12,443/12,453 | 12,510/12,505/12,517 | TAG | 0/0/0 | ||
| trnV | N | 13,800/13,789/13,800 | 13,867/13,856/13,869 | TAC | 0/0/0 | ||
| rrnL | N | 12,511/12,506/12,518 | 13,799/13,788/13,799 | 0/0/0 | |||
| rrnS | N | 13,868/13,857/13,870 | 14,582/14,569/14,608 | 0/0/0 | |||
| A + T-rich region | J | 14,583/14,570/14,609 | 16,196/16,179/16,276 | 0/0/0 | |||
| Species | PCGs | rRNAs | tRNAs | A + T-Rich Region | ||||||||
|---|---|---|---|---|---|---|---|---|---|---|---|---|
| Size (bp) | A + T (%) | AT-Skew | Size (bp) | A + T (%) | AT- Skew | Size (bp) | A + T (%) | AT-Skew | Size (bp) | A + T (%) | AT-Skew | |
| C. copipes | 11,159 | 72.93 | −0.16 | 2004 | 77.64 | −0.03 | 1432 | 74.58 | 0.01 | 1614 | 81.16 | −0.05 |
| C. dentata | 11,159 | 75.23 | −0.16 | 1996 | 78.66 | −0.01 | 1429 | 76.35 | 0.02 | 1610 | 83.60 | −0.09 |
| D. corrugata | 11,150 | 69.70 | −0.15 | 2021 | 75.41 | −0.09 | 1441 | 73.56 | 0.02 | 1668 | 79.50 | 0.06 |
| ML | BI | |
|---|---|---|
| 13PCGs | GTR + F + I + G4 | GTR + F + I + G4 |
| 2rRNAs | TVM + F + I + G4 | GTR + F + I + G4 |
| 13PCGs + 2rRNAs | GTR + F + I + G4 | GTR + F + I + G4 |
Publisher’s Note: MDPI stays neutral with regard to jurisdictional claims in published maps and institutional affiliations. |
© 2022 by the authors. Licensee MDPI, Basel, Switzerland. This article is an open access article distributed under the terms and conditions of the Creative Commons Attribution (CC BY) license (https://creativecommons.org/licenses/by/4.0/).
Share and Cite
Huang, X.; Chen, B.; Wei, Z.; Shi, A. First Report of Complete Mitochondrial Genome in the Tribes Coomaniellini and Dicercini (Coleoptera: Buprestidae) and Phylogenetic Implications. Genes 2022, 13, 1074. https://doi.org/10.3390/genes13061074
Huang X, Chen B, Wei Z, Shi A. First Report of Complete Mitochondrial Genome in the Tribes Coomaniellini and Dicercini (Coleoptera: Buprestidae) and Phylogenetic Implications. Genes. 2022; 13(6):1074. https://doi.org/10.3390/genes13061074
Chicago/Turabian StyleHuang, Xuyan, Bo Chen, Zhonghua Wei, and Aimin Shi. 2022. "First Report of Complete Mitochondrial Genome in the Tribes Coomaniellini and Dicercini (Coleoptera: Buprestidae) and Phylogenetic Implications" Genes 13, no. 6: 1074. https://doi.org/10.3390/genes13061074