Article

Genome-Wide Identification and Analysis of the NAC Transcription Factor Gene Family in Garden Asparagus (Asparagus officinalis)

1
Center for Computational Biology, College of Biological Sciences and Technology, Beijing Forestry University, Beijing 100083, China
2
Tandon School of Engineering, New York University, New York, NY 11201, USA
3
National Engineering Laboratory for Tree Breeding, Beijing Forestry University, Beijing 100083, China
4
Key Laboratory of Genetics and Breeding in Forest Trees and Ornamental Plants, Beijing Forestry University, Ministry of Education, Beijing 100083, China
5
The Tree and Ornamental Plant Breeding and Biotechnology Laboratory of National Forestry and Grassland Administration, Beijing Forestry University, Beijing 100083, China
*
Author to whom correspondence should be addressed.
Genes 2022, 13(6), 976; https://doi.org/10.3390/genes13060976
Submission received: 27 April 2022 / Revised: 27 May 2022 / Accepted: 27 May 2022 / Published: 30 May 2022
(This article belongs to the Section Plant Genetics and Genomics)

Abstract

:
As a large plant-specific gene family, the NAC (NAM, ATAF1/2, and CUC2) transcription factor is related to plant growth, development, and response to abiotic stresses. Although the draft genome of garden asparagus (Asparagus officinalis) has been released, the genome-wide investigation of the NAC gene family is still unavailable. In this study, a total of 85 A. officinalis NAC genes were identified, and a comprehensive analysis of the gene family was performed, including physicochemical properties, phylogenetic relationship, chromosome localization, gene structure, conserved motifs, intron/exon, cis-acting elements, gene duplication, syntenic analysis, and differential gene expression analysis. The phylogenetic analysis demonstrated that there were 14 subgroups in both A. officinalis and Arabidopsis thaliana, and the genes with a similar gene structure and motif distribution were clustered in the same group. The cis-acting regulatory analysis of AoNAC genes indicated four types of cis-acting elements were present in the promoter regions, including light-responsive, hormone-responsive, plant-growth-and-development-related, and stress-responsive elements. The chromosomal localization analysis found that 81 NAC genes in A. officinalis were unevenly distributed on nine chromosomes, and the gene duplication analysis showed three pairs of tandem duplicated genes and five pairs of segmental duplications, suggesting that gene duplication is possibly associated with the amplification of the A. officinalis NAC gene family. The differential gene expression analysis revealed one and three AoNAC genes that were upregulated and downregulated under different types of salinity stress, respectively. This study provides insight into the evolution, diversity, and characterization of NAC genes in garden asparagus and will be helpful for future understanding of their biological roles and molecular mechanisms in plants.

1. Introduction

The transcriptional regulation of gene expression controls many important cellular processes in plants, such as cellular morphogenesis, signal transduction, and environmental stress responses [1]. Transcription factors (TFs) are one kind of regulatory protein that stimulates or inhibits the transcriptional rates of its targeted genes by binding to specific cis-acting elements, thereby controlling plant growth and development, as well as abiotic and biotic stress responses [2,3,4]. According to the different DNA-binding domains (DBDs) in target genes’ promoters, plant transcription factors can be classified into 58 families [5], such as MYB (v-myb avian myeloblastosis viral oncogene homolog), AP2/ERF (APETALA 2/ethylene-responsive element binding factor), HD-Zip (homeodomain leucine zipper), RHR (rel-homology region), Sp1 (specificity protein 1), ARF (auxin response factor), MRKY, NAC, and so on [6].
As one of the significant and diverse plant-specific transcription factor families, the name of the NAC gene family originated from three important proteins with similar DNA-binding domains: NAM (no apical meristem) in Petunia, ATAF1/2 (transcription activation factors), and CUC2 (cup-shaped cotyledon 2) in Arabidopsis [4,6]. The NAM domain affects the formation and differentiation of apical meristem of petunia [6]. ATAF1 and ATAF2 are found to negatively regulate the defense responses against necrotrophic fungal and bacterial pathogens [7]. CUC2 plays an important role in the development of Arabidopsis embryos, flowers, and apical meristem [4]. Generally, the N-terminus of NAC proteins contains a well-conserved NAM domain which is helpful to bind the target genes to their cis-acting elements, and the C-terminus contains variable transcriptional activation regions [8]. The N-terminus NAC domain is commonly composed of about 160 amino acids (aa) which can be further cut up into five subdomains, A to E, along with the related functions of nuclear localization, DNA binding, and the construction of homo- and heterodimerize [9,10,11,12,13,14]. The three subdomains A, C, and D are highly conserved; however, the remaining two subdomains, B and E, are poorly conserved, and this may lead to the diversity of NAC protein functions [3]. In contrast, the C-terminus of NAC proteins is highly divergent and has an essential structural basis for the interaction between NAC proteins [15]. Furthermore, the C-terminus of several NAC proteins is membrane-bound, which contributes to rapid transcriptional regulation in endoplasmic reticulum stress response [16].
NAC proteins regulate the growth and development processes of a variety of plants, including the secondary wall formation [17], shoot apical meristem formation [18], organ boundary separation [19], lateral root growth [20], fruit maturation [9], leaf senescence [21,22], and cell-cycle control [23,24]. NAC proteins are also involved in the signal transduction pathways of auxin, cytokinin, ethylene, gibberellin, and other hormones [20,25,26]; for instance, Arabidopsis ATAF1 can directly regulate the expression of abscisic acid (ABA) synthesis gene NCED3 to regulate ABA biosynthesis [27] and can also induce the expression of defense signal genes related to the jasmonic acid (JA) pathway [28]. Particularly, NAC proteins play an important role in abiotic stresses such as drought, low temperature, high temperature, and high salt; and biological stresses such as pests and pathogens [28,29,30,31,32,33,34,35,36]. One study showed that OsNAC5 as a rice NAC gene enlarged the root diameter through overexpression, so as to enhance drought tolerance and increase grain yield in the field [37]. Another research study revealed that the overexpression of TaNAC69 in wheat could regulate stress upregulated genes and help wheat adapt to drought stress [38].
In recent years, with the completion of a large number of plant genome sequencings and the continuous improvement of bioinformatics, the research of the NAC transcription factor gene family has entered an upsurge. Up till now, 117 NAC genes in A. thaliana [39,40], 151 in Oryza sativa [39,40,41], 163 in Populus trichocarpa [42], 71 in Cicer arietinum [43], 83 in Sesamum indicum [44], 183 in Pyrus bretschneideri [45], 114 in Betula pendula [46], and 73 in Ananas comosus [47] have been identified by genome-wide analyses, respectively. However, NAC genes were not studied in A. officinalis.
A. officinalis is also known as garden asparagus, whose genome contains 10 chromosomes with a total length of about 1187.54 Mb. Internationally known as “the king of vegetables”, garden asparagus stalk is usually eaten as a vegetable, and it is one of the world’s top ten dishes due to its high nutritional value [48]. Garden asparagus is grown in nearly all areas of the world, with the largest production regions being China, Western Europe, North America, and Peru [49]. Worldwide asparagus production reached 8.45 million metric tons in 2020 [50]. Additionally, its materials have also been used for centuries as herbal medicine because it is rich in amino acids, folic acid, ascorbic acid, phenols, saponins, dietary fiber, anthocyanins, and so on [51]. Soil salinization is one of the main limiting factors of agricultural production which seriously affects the growth and development of plants. It is estimated that about 20% of cultivated land and 33% of irrigated farmland in the world are seriously affected by saline–alkali stress [52]. Garden asparagus is a strong salt-tolerant plant which can grow normally in saline–alkali soil below about 50 mM. It is a pioneer crop for the development and utilization of saline–alkali land and the exploration of plant salt tolerance mechanisms. Therefore, understanding the response of A. officinalis to salinity stress is helpful to clarify the mechanism of plant adaptation and obtain a stable yield of plant breeding in saline–alkali soil [53]. Previous studies mainly focused on the analysis of nutritional components and active components in different parts of garden asparagus, whereas there were few studies at the genome level, and the research on its response mechanism to salinity stress is still in its infancy. The garden asparagus genome was completed and published in 2017 [54]; it provides a powerful tool for studying garden asparagus from the gene level. The genome-wide identification and analysis of the NAC gene family will provide an important basis for understanding the evolution of signaling pathways and abiotic stress response, especially salt-stress response. In this research, a comprehensive investigation was conducted of the NAC gene family in garden asparagus, including gene structure, domain analysis, chromosome localization, intron/exon, subcellular localization, and cis-acting elements of NAC genes. In addition, we analyzed the phylogenetic relationship of NAC proteins between A. officinalis and A. thaliana. Furthermore, we investigated the gene duplication pattern of garden asparagus NAC proteins, and we performed a syntenic analysis of NAC proteins among A. officinalis, A. thaliana, S. indicum, and A. comosus. Finally, we utilized transcriptome data of garden asparagus to analyze differentially expressed genes under different types of salinity stress. Our study may lay the foundation for a follow-up study of the development, regulation, and biological functions of NAC genes in garden asparagus.

2. Materials and Methods

2.1. Identification of the NAC Gene Family in A. officinalis

Genome sequences, protein sequences, coding sequence (CDS), and annotation files of A. officinalis were downloaded from the Ensembl Plants (http://plants.ensembl.org/index.html, accessed on 24 March 2022). The Hidden Markov Model (HMM) file of the NAM domain (PF02365) was retrieved from the Pfam protein family database (release 35.0; http://pfam.xfam.org/, accessed on 24 March 2022) [55].
A. officinalis NAC protein sequences were aligned through HMMER search (version 3.1b2) with an e-value of 0.05. To avoid missing candidates, we selected 67 protein sequences with e-value < 1 × 10⁻²⁰ to rebuild a new HMM model, and ClustalW in MEGA 11 software (version 11.0.11) was used for multiple sequence alignment [56,57]. The new HMM model was used to search all A. officinalis protein sequences at an e-value of 0.05. We took the intersection of the two search results as the final candidate protein sequences. Furthermore, we utilized the SMART program (http://smart.embl.de/smart/batch.pl, accessed on 26 March 2022) [58], NCBI Conserved Domain Search (https://www.ncbi.nlm.nih.gov/Structure/bwrpsb/bwrpsb.cgi, accessed on 26 March 2022), and Pfam Batch Sequence Search (http://pfam.xfam.org/search#tabview=tab1, accessed on 26 March 2022) to verify the existence of the NAM domain in each candidate protein sequence. After the elimination of the unqualified sequences, 85 NAC genes were identified from the A. officinalis genome.

2.2. Phylogenetic Analysis and Classification of AoNAC Genes

To understand the phylogenetic relationship and to classify the NAC genes, the unrooted phylogenetic tree for A. officinalis (AoNAC) and A. thaliana (AtNAC) NAC proteins was constructed by using MEGA 11 software (version 11.0.11). The AoNAC genes were classified according to their phylogenetic relations, with corresponding A. thaliana NAC members. A. thaliana NAC protein sequences were obtained from TAIR (https://www.arabidopsis.org, accessed 28 March 2022), with the accession numbers reported by Ooka H et al. [40]. All protein sequences were aligned by Muscle in MEGA 11 software (version 11.0.11), with the default parameters [59]. The Maximum Likelihood (ML) method was used with the following parameters: 1000 iterations for the bootstrap method, Poisson model, and use all sites. Additionally, an individual phylogenetic tree of AoNAC genes was built with the same method and visualized by the ggtree package in the R programming language (version 4.1.3) [60].

2.3. Chromosomal Mapping and Cis-Acting Regulatory Analysis of AoNAC Genes

The chromosome annotation file of AoNAC genes was obtained from Ensembl Plants. The chromosomal position of AoNAC genes was displayed by using MG2C (http://mg2c.iask.in/mg2c_v2.1, accessed on 29 March 2022). All identified genes were mapped to 10 chromosomes according to their chromosomal positions and relative distance. The upstream sequences (2000 bp) of AoNAC genes’ CDS were retrieved from the A. officinalis genome by TBtools software (version 1.098696), according to gene ID, and then submitted to the PlantCARE database (http://bioinformatics.psb.ugent.be/webtools/plantcare/html, accessed on 29 March 2022) to predict cis-acting elements [61]. TBtools software (version 1.098696) was used to visualize the cis-acting elements in upstream sequences after filtering and screening.

2.4. Gene Structure and Motif Analysis of AoNAC Genes

The online program MEME (https://meme-suite.org/meme/tools/meme, accessed on 30 March 2022) was applied to analyze the conserved motifs in the AoNAC proteins with the following settings: maximum number of motifs 15, minimum motif width 6, maximum motif width 50, and number of repetitions any [62]. The Gene Structure Display Server 2.0 program (http://gsds.gao-lab.org, accessed on 30 March 2022) was used to analyze the intron/exon structure of AoNAC genes [63].

2.5. Physicochemical Properties and Subcellular Localization Analysis of AoNAC Genes

The ProtParam (https://web.expasy.org/protparam, accessed on 1 April 2022) and Compute pI/Mw (https://web.expasy.org/compute_pi, accessed on 1 April 2022) in the Expasy Webserver were used to analyze physicochemical properties, including the theoretical isoelectric point (pI), molecular weight (MW), instability index, and aliphatic index [64]. For the protein sequences whose theoretical isoelectric point (pI) and molecular weight (MW) could not be predicted by Compute pI/Mw (https://web.expasy.org/compute_pi, accessed on 1 April 2022), DNAman software (version 6.0.3.48) was used for relevant prediction. The number of amino acids (aa) and the open reading frame (ORF) lengths were found on the ORFfinder website (https://www.ncbi.nlm.nih.gov/orffinder, accessed on 1 April 2022). The BUSCA program (https://busca.biocomp.unibo.it, accessed on 1 April 2022) was used to predict the subcellular localization (SL) of the AoNAC proteins.

2.6. Gene Duplication and Syntenic Analysis of AoNAC Genes

Gene duplications of AoNAC genes were predicted through MCScanX in TBtools software (version 1.098696), with default parameters. The duplication events in the A. officinalis genome were calculated by Diamond output results in MCScanX. The Duplicate_gene_classifier program in MCScanX (https://github.com/wyp1125/MCScanX, accessed on 3 April 2022) was applied to analyze the duplication type of each AoNAC gene. A total of 85 AoNAC genes were classified into various types of duplications, including WGD/Segmental, tandem, proximal, singleton, and dispersed. The CDSs of tandem duplicated sequences in AoNAC genes were aligned via Muscle (Codons) in MEGA 11 software (version 11.0.11), with the default parameters. The Ka/Ks ratios for tandem duplicated gene pairs in AoNAC genes were calculated by using the KaKs_calculator (Version 2.0) with the following settings: genetic code Table 1 (standard code); and method of calculation, YN [65]. The WGD/Segmental duplications were visualized by using the Advanced Circos of TBtools software (version 1.098696). One-Step MCScanX was used to predict the synteny between the NAC genes in A. officinalis with the NAC genes in A. thaliana, A. comosus (Pineapple), and S. indicum (Sesame), using the genome annotation files and genome sequences files. The dual synteny plot for MCScanX in TBtools software (version 1.098696) was used to visualize the synteny.

2.7. Differential Expression of AoNAC Genes under Different Types of Salinity Stress

RNA-sequencing data sequenced by Illumina HiSeq 2500 of A. officinalis were used to analyze differentially expressed genes of AoNAC genes under different types of salinity stress [66]. The experiment consisted of 4 total treatments: (1) non-inoculated A. officinalis plants without salinity stress (NI), (2) inoculated A. officinalis plants without salinity stress (arbuscular mycorrhiza fungi, AMF), (3) non-inoculated A. officinalis plants subjected to salinity stress (NI + S), and (4) inoculated A. officinalis plants subjected to salinity stress (AMF + S). Each treatment had 3 biological replicates, and a total of 12 leaf samples were obtained for further analysis. Sequence read archives (SRAs) with accession number SRP188664 were retrieved from the National Centre for Biotechnology Information (NCBI) (https://www.ncbi.nlm.nih.gov/sra/?term=SRP188664#, accessed on 30 April 2022) (Supplementary Table S1). FASTQ files generated the pair-end data containing forward and reverse reads from SRA files. FastQC and MultiQC were used to check the quality of the reads at each step [67,68]. Trimmomatic software was used to trim adapter and low-quality sequences from the reads [69]. The GTF file of garden asparagus was used as the reference genome for the alignment of the reads in STAR [70]. The number of reads per gene was determined by using RSEM software [71]. DESeq2 package was used to analyze differential gene expression of AoNAC genes under normal and salt-stress conditions [72]. Filtration of differentially expressed genes was carried out at a significant adjusted p-value < 0.05 and an absolute value of log2FC (log of fold change) > 1 to filter out insignificantly expressed genes. The volcano plot was created by using differential expression data from DESeq2. Differentially expressed AoNAC genes were labeled in the volcano plot. The heatmap of the differentially expressed genes was constructed by the heatmap package, following the log10 transformed RPKM (the reads per kilobase per million) values.

3. Results

3.1. Identification of NAC Members in A. officinalis

To identify the NAC genes in the A. officinalis genome, the Hidden Markov Model (HMM) file corresponding to the NAM domain (PF02365) was employed as a query to search in the A. officinalis protein database. After finishing the first HMMER search and removing duplicates, we obtained a total of 86 putative NAC proteins. For the second HMMER search, we selected 67 proteins with an e-value < 10−20 as candidate members to rebuild a new HMM model. Based on the results of two HMMER searches, we finally obtained 87 candidate protein sequences. The sequences were further examined by the NCBI Conserved Domain Search, Pfam Batch Sequence Search, and SMART for the authenticity of NAM domains in individual sequences. Finally, the HMMER search and domain analysis identified 85 NAC genes in A. officinalis (Supplementary Table S2). The identified genes were renamed from AoNAC5 to AoNAC85 according to their sequential distribution on chromosomes and subjected to further analyses. The first four AoNAC genes (AoNAC1 to AoNAC4) had no annotation information on any A. officinalis chromosome, so they were mapped on an undefined chromosome (Un). Detailed characteristics of identified AoNAC genes, including the number of amino acids (aa), molecular weight (MW), isoelectric point (pI), instability index, aliphatic index, subcellular localization, and duplication type of AoNAC genes are listed in Table 1 and Supplementary Table S3.
The statistical results showed that protein sequences of AoNAC genes ranged from 90 amino acid residues (AoNAC59) to 1187 amino acid residues (AoNAC28), and the molecular weights varied from 10.34 kDa (AoNAC59) to 131.61 kDa (AoNAC28). The ORFs of the 85 AoNAC genes ranged from 273 bp (AoNAC59) to 3564 bp (AoNAC28). Additionally, 48 AoNAC proteins with less than 6.5 pI values were acidic, while 28 with more than 7.5 pI values were alkaline, and 9 with pI values between 6.5 and 7.5 were neutral. Most AoNAC proteins had an instability index of more than 40, belonging to unstable proteins, in addition to AoNAC4, AoNAC6, AoNAC11, AoNAC12, AoNAC13, AoNAC30, AoNAC35, AoNAC48, AoNAC50, AoNAC54, AoNAC63, AoNAC64, AoNAC65, and AoNAC80. The subcellular localization predicted that 89.41% of AoNAC genes were located in the nucleus, whereas AoNAC31, AoNAC55, AoNAC60, AoNAC72, and AoNAC78 were found in the chloroplast; AoNAC14 and AoNAC22 were found in the endomembrane system; AoNAC29 was found in the plasma membrane; and AoNAC69 was found in the extracellular space. The duplication-type analysis of each AoNAC gene by MCScanX indicated that most of the genes were dispersed (75.29%) and WGD/Segmental (10.59%), seven of AoNAC genes were tandem (8.24%), and five of AoNAC genes were proximal (5.88%).

3.2. Phylogenetic Analysis of AoNAC and AtNAC

To explore the evolutionary relationship of NAC proteins between A. officinalis and A. thaliana, we constructed an unrooted phylogenetic tree by using MEGA 11 software based on NAC protein full-length sequences alignment of 85 proteins from A. officinalis and 116 from A. thaliana (Figure 1), and it allowed us to infer the possible functions of AoNAC genes based on the function research of AtNAC genes. Based on the homology with NAC proteins in A. thaliana, the 85 AoNAC proteins formed 14 clades (renamed as subgroups G1–G14) together with AtNAC proteins. The largest subgroups (G8 and G14) involved ten AoNAC members, while the smallest (G1) only had one member. Two subgroups (G3 and G4) only involved the members of A. officinalis, meaning that the homologs of NAC genes in two subgroups may differentiate during the evolution of A. thaliana. It was worth noting that AtNAC genes with the same function had a strong tendency to aggregate into the same subgroup. For instance, CUC1 (AtNAC054), CUC2 (AtNAC098), and CUC3 (AtNAC031) involved in shoot organ-boundary separation were mainly located in the subgroup G12. VND1 (AtNAC037), VND2 (AtNAC076), VND3 (AtNAC105), VND4 (AtNAC007), VND5 (AtNAC026), VND6 (AtNAC101), and VND7 (AtNAC030) involved in secondary wall synthesis were mainly located in subgroup G14. The subgroup G7 contained many famous AtNAC genes related to stress response, including AtNAC019, AtNAC056, AtNAC055, AtNAC002, AtNAC081, and AtNAC072 (Supplementary Table S4). Therefore, it was speculated that AoNAC genes in the corresponding subgroup may have similar functions.

3.3. Gene Structure, Conserved Motifs, and Domain Analysis of AoNAC Genes

In order to explore the evolutionary relationship between AoNAC genes, we established an unrooted phylogenetic tree based on multiple sequence alignment of 85 AoNAC proteins. The AoNAC genes were separated into 14 subgroups (renamed G1 to G14), and this was basically consistent with the phylogenetic analysis between AoNAC and AtNAC in the above results (Figure 2A). The largest subgroup (G8) involved 12 members, while the smallest contained 3 members. Moreover, a majority of AoNAC genes with similar domains were gathered into a subgroup, such as AoNAC14, AoNAC41, and AoNAC81, with transmembrane domains assigned to the subgroup G10.
In order to further understand the structural diversity and similarity of AoNAC genes, we studied the conserved motifs and intron/exon distribution based on their phylogenetic relationship. A total of 15 conservative motifs were predicted by the MEME program and named from Motif 1 to Motif 15 (Figure 2B and Supplementary Table S5). Similar to the domain analysis, AoNAC members that were gathered into the same subgroup exhibited a common motif composition, thus implying that their biological functions might be similar. By analyzing the motif distribution of AoNAC proteins, the N-terminus of most AoNAC genes involved five well-conserved motifs (Motif 2, Motif 4, Motif 5, Motif 6, and Motif 7), which conferred DNA-binding activity. Specific subgroups had different conserved motifs in the C-terminus regions, such as Motif 9 in subgroup G3, Motif 14 in subgroup G5, and Motif 15 in subgroup G10 (Figure 2B), indicating that the specific motifs in different subgroups may bring specific functions.
The intron/exon structure of the AoNAC coding sequences was visualized by the Gene Structure Display Server 2.0 program. The result revealed that the number of introns in AoNAC genes ranged from zero (AoNAC60 and AoNAC67) to thirteen (AoNAC34), and most AoNAC genes involved three exons (Figure 2C). Interestingly, AoNAC genes in the same phylogenetic group shared highly similar intron/exon structure, differing only in the length of exons and introns.

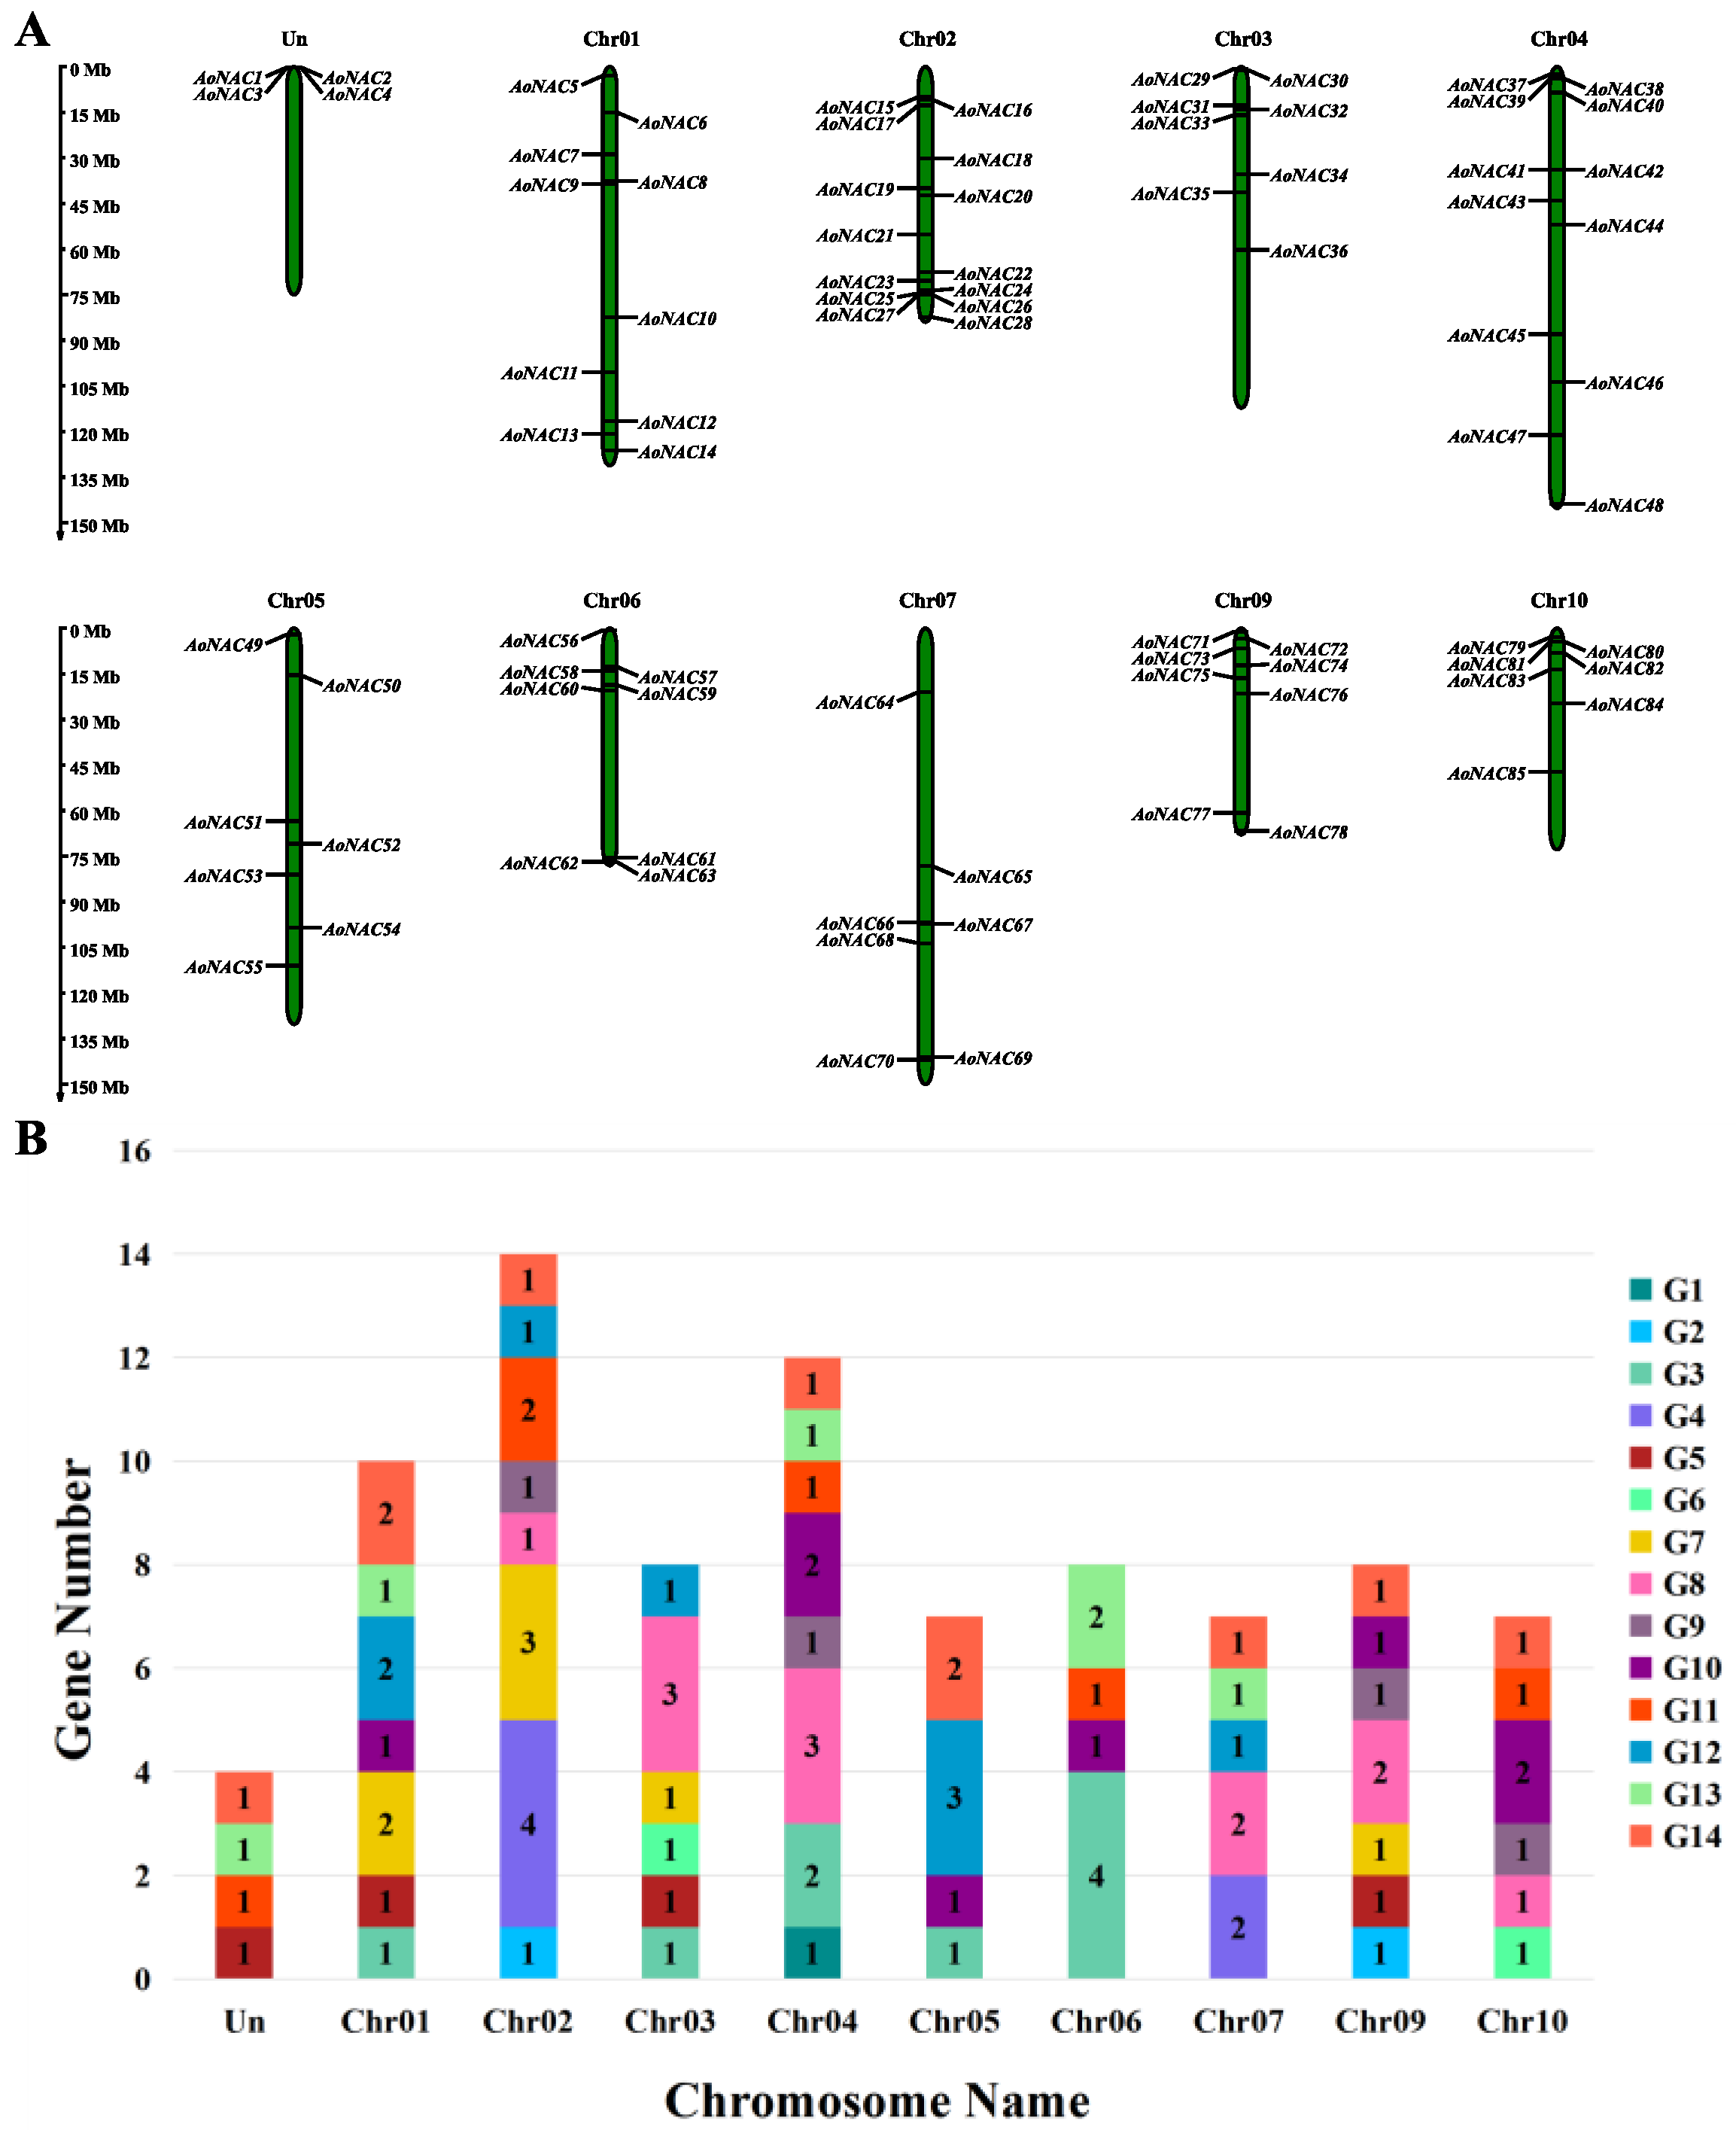
3.4. Chromosomal Mapping and Cis-Acting Regulatory Analysis of AoNAC Genes

We acquired the AoNAC genes’ location information according to the genome annotation file from the Ensembl Plants database. Except that chromosome 8 did not contain any AoNAC gene, 85 AoNAC genes were non-randomly distributed on the remaining nine chromosomes and an undefined chromosome (Un) and were renamed as AoNAC1-AoNAC85 based on their position on the chromosome (Figure 3A). Chr02 contained the largest number (14, 16.47%) of AoNAC genes, followed by Chr04 with 12 members (14.12%). In contrast, Chr05, Chr07, and Chr10 contained only seven AoNAC genes each (8.24%). As shown in Figure 3B, Chr02 and Chr04 had eight subgroups of AoNAC genes, while Chr05 and Chr06 had only four subgroups each. Subgroup G14 was observed on eight chromosomes, except for Chr03 and Chr06, while subgroup G1 was only observed on Chr04.
Cis-acting elements are binding sites of transcription factors, which regulate the precise initiation and efficiency of gene transcription by binding to transcription factors. To deeply study the regulatory mechanism of the AoNAC genes in abiotic stress responses, we extracted the 2000 bp sequences upstream of the transcription start site of 85 AoNAC genes and then submitted them to the PlantCARE Online program for further analysis. We found four types of cis-acting elements in the promoter regions of the AoNAC genes, including light-responsive, hormone-responsive, plant-growth-and-development-related, and stress-responsive elements. The distribution of these cis-acting elements on the promoters is shown in Supplementary Figures S1–S4. The results indicated that AoNAC genes were highly relevant to the abiotic stress response. To learn more about the distribution of abiotic stress response, the stress-responsive elements were further divided into anaerobic inducibility, low-temperature responsive, drought inducibility, defense and stress-responsive, anoxic-specific inducibility, and wound-responsive cis-elements (Figure 4A). As shown in Figure 4B, the hormone and light-responsive cis-elements existed in all promoter regions of AoNAC genes, the plant-growth-and-development-related cis-elements were present in 69 AoNAC genes, the anaerobic inducibility cis-elements were present in 67 AoNAC genes, the low-temperature responsive cis-elements were present in 40 AoNAC genes, the drought inducibility cis-elements were present in 36 AoNAC genes, the defense and stress-responsive cis-elements were present in 32 AoNAC genes, the anoxic-specific inducibility cis-elements were present in 18 AoNAC genes, and the wound-responsive cis-elements were present in 3 AoNAC genes. Furthermore, the stress-responsive elements, including ARE, LTR, MBS, TC-rich repeats, GC-motif, and WUN-motif cis-elements, were related to anaerobic inducibility, low-temperature responsive, drought inducibility, defense and stress-responsive, anoxic specific inducibility, and wound-responsive elements, respectively (Figure 4C). The detailed information about other types of cis-elements in AoNAC genes is shown in Supplementary Figures S5 and S6.

3.5. Gene Duplication and Syntenic Analysis of AoNAC Genes

According to the genome-wide analysis of garden asparagus gene duplications generated by MCScanX software, there were 1153 tandem duplications in the genome of A. officinalis; however, only three pairs of tandem duplicated genes existed in 81 AoNAC genes (Figure 5). The analysis showed that there was one pair of tandem duplicated genes (AoNAC38 and AoNAC39) on Chr04, one pair (AoNAC62 and AoNAC63) on Chr06, and one pair (AoNAC80 and AoNAC81) on Chr10. Additionally, we calculated the substitution ratio of non-synonymous (Ka) to synonymous (Ks) mutations (Ka/Ks) of the above three pairs (Table 2). The Ka/Ks values of the three pairs were less than 1.00, meaning that these duplicated gene pairs evolved under negative purifying selection.
The MCScanX revealed 2336 segmental duplications in the genome of A. officinalis; however, only five pairs of segmental duplicated genes were predicted in 81 AoNAC genes. The synteny regions (segmental duplications) on all 9 chromosomes were visualized by using TBtools software (Version 1.098696), as represented in Figure 5. Chr09 contained two segmental duplicated genes, while Chr04, Chr06, Chr07, and Chr10 each contained only one segmental duplicated gene. However, Chr01, Chr03, and Chr05 did not contain any segmental duplicated genes.
The AoNAC gene and the NAC genes of A. thaliana, S. indicum, and A. comosus were separately analyzed to find homologous gene pairs (Figure 6). We found that 27 AoNAC genes were syntenic with the NAC genes of A. thaliana (4), S. indicum (11), and A. comosus (27) (Supplementary Tables S6–S8). Considering that several genes had multicollinearity with NAC genes of other species, we found that there were 5, 15, and 41 NAC genes of A. thaliana, S. indicum, and A. comosus, respectively, which had synteny with 27 AoNAC genes. In addition, three NAC genes existed in four plants at the same time (Figure 7). However, sixteen homologous NAC genes existed in A. officinalis and A. comosus rather than in A. thaliana and S. indicum. Similarly, one homologous NAC gene existed in A. officinalis and S. indicum rather than in A. thaliana and A. comosus. A. officinalis, A. comosus, and S. indicum had five homologous NAC genes that did not exist in A. thaliana. Moreover, A. officinalis, A. comosus, and A. thaliana had two homologous NAC genes that did not exist in S. indicum.

3.6. Differentially Expressed Genes Analysis of AoNAC Genes under Different Types of Salinity Stress

To further provide information on the function of AoNAC genes in garden asparagus, we investigated the gene expression difference in AoNAC genes under different types of salinity stress, using RNA-seq data. A total of 67 AoNAC genes common to NI and NI + S plants were expressed differentially after only salinity treatment (Figure 8A). Among these widely expressed AoNAC genes, seven genes were highly expressed under NI and NI + S conditions, especially AoNAC75 and AoNAC77. In the first 15 AoNAC genes in Figure 8A, the average expression of 11 AoNAC genes in NI + S treatment was higher than that in NI treatment. In these 67 AoNAC genes, 5 (AoNAC30, AoNAC50, AoNAC57, AoNAC69, and AoNAC77) were significantly upregulated (padj < 0.05 and log2FC > 1) and 5 (AoNAC6, AoNAC7, AoNAC42, AoNAC61, and AoNAC81) were downregulated (padj < 0.05 and log2FC < −1) in leaves of both NI and NI + S plants during salinity treatment (Supplementary Figure S7A). A total of 74 AoNAC genes common to AMF and AMF + S plants were expressed differentially after AMF and salinity treatment (Figure 8B). Among these widely expressed AoNAC genes, five genes showed relatively higher expression levels under AMF and AMF + S conditions, but, obviously, the expression of AoNAC77, AoNAC17, and AoNAC75 genes in the AMF plant was much higher than that in the AMF + S plant. In the first 17 AoNAC genes shown in Figure 8A, the average expression of 14 AoNAC genes in the AMF + S treatment was higher than that in the AMF treatment. In these 74 AoNAC genes, 7 (AoNAC17, AoNAC24, AoNAC32, AoNAC44, AoNAC50, AoNAC56, and AoNAC77) were significantly upregulated and 3 (AoNAC6, AoNAC42, and AoNAC81) were downregulated in the leaves of both AMF and AMF + S plants during AMF and salinity treatment (Supplementary Figure S7B).

4. Discussion

A. officinalis, a species belonging to the Liliaceae family, is a perennial herb with important economic and pharmacological value. It contains about 300 species with known traditional uses, such as appetizer, lactating enhancer, antioxidant activities, and antitumor [73], while it is also sensitive to stress, such as drought and salinity, as most horticultural crops are [74]. Researchers have identified the NAC gene family in many species; however, little is known about the family in garden asparagus. With the release of the A. officinalis genome, transcriptome sequencing and functional genomics have greatly facilitated A. officinalis research [75,76]. The NAC gene family is one of the largest families of transcription factors and plays important roles in plant growth, development, and response to abiotic and biotic stresses. In this study, 85 NAC genes were identified in the garden asparagus genome, which is less than those of A. thaliana (117 NAC genes) and similar to those of S. indicum (83 NAC genes) [40,44]. However, it is more than the number of NAC genes in A. comosus (73 NAC genes) [47], thereby indicating that more NAC genes were needed in the transcriptional regulation of garden asparagus. These results indicated that most AoNAC genes were not eliminated by environmental selection; instead, they showed high conservation during the evolution process, which needs to be deeply studied from an evolutionary perspective. These 85 AoNAC genes were classified into 14 subgroups according to their phylogenetic relationship with A. thaliana. We found that the NAC gene family members were unevenly distributed among subgroups; for instance, the subgroups of G3 and G4 only contained A. officinalis members, and the member number of subgroups of G9 and G13 in A. officinalis was more than that in A. thaliana. Since A. officinalis and A. thaliana were exposed to different environments during the evolution process, the number of NAC genes in their subgroups became different as NAC genes differentiated. Gene duplication is closely related to the evolution of genome size, the origin of new genes, species differentiation, and the ability of gene anti-mutation [51,77]. The collinearity analysis in our study showed that there were three pairs of tandem duplication and five pairs of segmental duplication events in the A. officinalis NAC gene family, and this might play an important role in the NAC family expansion in garden asparagus.
During the development and evolution of the gene family, the gene structure will vary according to the environmental changes to obtain new functions. The structural analysis of AoNAC genes according to phylogenetic relationship revealed that different subgroups have different gene structures and conserved motifs, while the identical subgroup had similar motif compositions and gene structures, thus implying that the members in the same subgroup possessed similar functions. These results were in agreement with reports in A. thaliana, O. sativa, and Vitis vinifera [40,78], which also indicated that NAC proteins with similar structures and motifs within species were functionally orthologous. In this study, we found numerous cis-acting elements that were involved in light-responsive, hormone-responsive, plant growth and development-related and stress-responsive elements. In the hormone-responsive elements as shown in Supplementary Figure S5, ABRE involved in ABA responsiveness existed in 66 AoNAC genes, which contributes to regulating strawberry fruit ripening by ABA [14,79]; both CGTCA-motif and TGACG-motif involved in MeJA responsiveness were found in 63 AoNAC genes, which activates MYB to regulate overexpression of MdMYB9 or MdMYB11 so as to anthocyanin and proanthocyanidin accumulation in apple calluses [80]; previous studies showed that the interaction of light, ethylene, and auxin can regulate the biosynthesis of carotenoids during tomato fruit ripening [81], and TGA-element, AuxRR-core, and TGA-box, involved in auxin-responsive elements, were found in 36, 11, and 1 AoNAC genes, respectively; P-box, GARE-motif, and TATC-box, involved in gibberellin-responsive elements, were found in 28, 19, and 18 AoNAC genes, respectively; SARE and TCA-element involved in salicylic acid-responsive elements were found in 2 and 30 AoNAC genes, respectively. In the plant growth and development-related elements as shown in Supplementary Figure S6, O2-site (zein metabolism regulation), MBSI (MYB binding site involved in flavonoid biosynthetic genes regulation), MSA-like (cell cycle regulation), HD-Zip 1 (differentiation of the palisade mesophyll cells), and HD-Zip 3 (protein binding site), involved in metabolism-related element, were found in 32, 5, 3, 3, and 1 AoNAC genes, respectively; CAT-box related to meristem expression was found in 27 AoNAC genes; circadian involved in circadian control was found in 16 AoNAC genes; RY-element involved in seed-specific regulation was found in 9 AoNAC genes; AACA_motif and GCN4_motif involved in endosperm-related element were found in 2 and 14 AoNAC genes, respectively.
RNA-seq technology is an indispensable tool for analyzing differential gene expression at the transcriptome level. In this study, transcriptome data of garden asparagus under different types of salinity stress were used to determine the expression of AoNAC genes. Whether NI + S treatment or AMF + S treatment, AoNAC77 had up-regulated expression whereas AoNAC6, AoNAC42, and AoNAC81 had down-regulated expression. AoNAC77 and AoNAC75 were the highest expression genes under the four treatments, which means that they may be salt stress tolerance-related genes. Similar to A. officinalis, it has been found that VvNAC17 in V. vinifera could enhance salinity, freezing, and drought tolerance in transgenic Arabidopsis [82], GmNAC06 in Glycine max played a role in response to salt stress thought controlling the Na+/K+ ratios in hairy roots to maintain ionic homeostasis [83], and MdNAC047 in apple could enhance salt stress tolerance by modulating the ethylene response [84]. These findings may help to lay foundations for subsequent in-depth research of the specific functions of NAC transcription factor family genes of A. officinalis.

5. Conclusions

Using a genome-wide identification and analysis of the A. officinalis NAC transcription factor family, we identified a total of 85 AoNAC genes belonging to fourteen subgroups that were non-randomly distributed across nine chromosomes and an undefined chromosome. Moreover, these proteins had typical NAC-conserved motifs and gene structures within the same subgroup, and they may be involved in light-responsive, hormone-responsive, plant-growth-and-development-related, and stress-responsive elements. Furthermore, segmental duplications in AoNAC genes contribute significantly to the expansion of the garden asparagus NAC gene family, and their differential gene expression was significantly influenced by different types of salinity stress. In short, our findings provide more information about NAC genes and establish a foundation for future study of NAC genes in garden asparagus.

Supplementary Materials

The following supporting information can be downloaded at https://www.mdpi.com/article/10.3390/genes13060976/s1. Table S1: SRA accession number about Asparagus officinalis transcriptome data. Table S2: The NAC protein full-length sequences of Asparagus officinalis identified in this study. Table S3: Detailed information of NAC genes in Asparagus officinalis. Table S4: The accession numbers of NAC genes in Arabidopsis thaliana. Table S5: Sequence logos for the conserved motifs of Asparagus officinalis NAC domain proteins. Table S6: One-to-one orthologous relationship of NAC genes of Asparagus Officinalis and Arabidopsis thaliana. Table S7: One-to-one orthologous relationship of NAC genes of Asparagus Officinalis and Sesamum indicum. Table S8: One-to-one orthologous relationship of NAC genes of Asparagus Officinalis and Ananas comosus. Figure S1: Light-responsive element in 85 AoNAC genes. Figure S2: Plant-growth-and-development-related element in 69 AoNAC genes. Figure S3: Hormone-responsive element in 85 AoNAC genes. Figure S4: Stress-responsive element in 83 AoNAC genes. Figure S5: The analysis of plant-growth-and-development-related element in 69 AoNAC genes. Figure S6: The analysis of hormone-responsive element in 85 AoNAC genes. Figure S7: Volcanic maps of differential gene expression of AoNAC genes under different types of salinity stress.

Author Contributions

Conceptualization, C.L.; methodology, C.L.; software, C.L.; formal analysis, C.L. and J.Z.; investigation, C.L.; resources, C.L., J.Z. and Q.Z.; writing—original draft preparation, C.L.; writing—review and editing, Q.Z., J.Z., A.D., Q.W. and X.Z. (Xingyu Zhu); visualization, C.L. and J.Z.; supervision, C.L.; project administration, X.Z. (Xuli Zhu); funding acquisition, X.Z. (Xuli Zhu). All authors have read and agreed to the published version of the manuscript.

Funding

This research was funded by Fundamental Research Funds for the Central Universities (NO. BLX201912) and China Postdoctoral Science Foundation (2019M660496).

Institutional Review Board Statement

Not applicable.

Informed Consent Statement

Not applicable.

Data Availability Statement

Data are available upon reasonable request.

Conflicts of Interest

The authors declare no conflict of interest.

References

  1. Singh, S.; Koyama, H.; Bhati, K.K.; Alok, A. The biotechnological importance of the plant-specific NAC transcription factor family in crop improvement. J. Plant Res. 2021, 134, 475–495. [Google Scholar] [CrossRef] [PubMed]
  2. Meshi, T.; Iwabuchi, M. Plant transcription factors. Plant Cell Physiol. 1995, 36, 1405–1420. [Google Scholar] [PubMed]
  3. Puranik, S.; Sahu, P.P.; Srivastava, P.S.; Prasad, M. NAC proteins: Regulation and role in stress tolerance. Trends Plant Sci. 2012, 17, 369–381. [Google Scholar] [CrossRef] [PubMed]
  4. Aida, M.; Ishida, T.; Fukaki, H.; Fujisawa, H.; Tasaka, M. Genes involved in organ separation in Arabidopsis: An analysis of the cup-shaped cotyledon mutant. Plant Cell 1997, 9, 841–857. [Google Scholar] [CrossRef] [Green Version]
  5. Jin, J.P.; Zhang, H.; Kong, L.; Gao, G.; Luo, J.C. PlantTFDB 3.0: A portal for the functional and evolutionary study of plant transcription factors. Nucleic Acids Res. 2014, 12, D1182–D1187. [Google Scholar] [CrossRef] [Green Version]
  6. Liu, G.S.; Li, H.L.; Grierson, D.; Fu, D.Q. NAC transcription factor family regulation of fruit ripening and quality: A review. Cells 2022, 11, 525. [Google Scholar] [CrossRef]
  7. Tran, L.S.; Quach, T.N.; Guttikonda, S.K.; Aldrich, D.L.; Kumar, R.; Neelakandan, A.; Valliyodan, B.; Nguyen, H.T. Molecular characterization of stress–inducible GmNAC genes in soybean. Mol. Genet. Genom. 2009, 281, 647–664. [Google Scholar] [CrossRef]
  8. Zhu, T.T.; Nevo, E.; Sun, D.F.; Peng, J.H. Phylogenetic analyses unravel the evolutionary history of NAC proteins in plants. Evolution 2012, 66, 1833–1848. [Google Scholar] [CrossRef]
  9. Duval, M.; Hsieh, T.F.; Kim, S.Y.; Thomas, T.L. Molecular characterization of AtNAM: A member of the Arabidopsis NAC domain superfamily. Plant Mol. Biol. 2002, 50, 237–248. [Google Scholar] [CrossRef]
  10. Shahzad, R.; Jamil, S.; Ahmad, S.; Nisar, A.; Amina, Z.; Saleem, S.; Iqbal, M.Z.; Atif, R.M.; Wang, X. Harnessing the potential of plant transcription factors in developing climate resilient crops to improve global food security: Current and future perspectives. Saudi J. Biol. Sci. 2021, 28, 2323–2341. [Google Scholar] [CrossRef]
  11. Hegedus, D.; Yu, M.; Baldwin, D.; Gruber, M.; Sharpe, A.; Parkin, I.; Whitwill, S.; Lydiate, D. Molecular characterization of Brassica napus NAC domain transcriptional activators induced in response to biotic and abiotic stress. Plant Mol. Biol. 2003, 53, 383–397. [Google Scholar] [CrossRef] [PubMed]
  12. Olsen, A.N.; Ernst, H.A.; Leggio, L.L.; Skriver, K. NAC transcription factors: Structurally distinct, functionally diverse. Trends Plant Sci. 2005, 10, 79–87. [Google Scholar] [CrossRef] [PubMed]
  13. Xie, Q.; Frugis, G.; Colgan, D.; Chua, N.H. Arabidopsis NAC1 transduces auxin signal downstream of TIR1 to promote lateral root development. Genes Dev. 2000, 14, 3024–3036. [Google Scholar] [CrossRef] [PubMed] [Green Version]
  14. Jensen, M.K.; Kjaersgaard, T.; Nielsen, M.M.; Galberg, P.; Petersen, K.; O’shea, C.; Skriver, K. The Arabidopsis thaliana NAC transcription factor family: Structure–function relationships and determinants of ANAC019 stress signalling. Biochem. J. 2010, 426, 183–196. [Google Scholar] [CrossRef] [Green Version]
  15. Kjaersgaard, T.; Jensen, M.K.; Christiansen, M.W.; Gregersen, P.; Kragelund, B.B.; Skriver, K. Senescence–associated barley NAC (NAM, ATAF1,2, CUC) transcription factor interacts with radical–induced cell death 1 through a disordered regulatory domain. J. Biol. Chem. 2011, 286, 35418–35429. [Google Scholar] [CrossRef] [Green Version]
  16. Seo, P.J.; Kim, S.G.; Park, C.M. Membrane–bound transcription factors in plants. Trends Plant Sci. 2008, 13, 550–556. [Google Scholar] [CrossRef]
  17. Sun, Q.W.; Huang, J.F.; Guo, Y.F.; Yang, M.M.; Guo, Y.J.; Li, J.; Zhang, J.; Xu, W.L. A cotton NAC domain transcription factor, GhFSN5, negatively regulates secondary cell wall biosynthesis and anther development in transgenic Arabidopsis. Plant Physiol. Bioch. 2020, 146, 303–314. [Google Scholar] [CrossRef]
  18. Vroemen, C.W.; Mordhorst, A.P.; Albrecht, C.; Kwaaitaal, M.A.; de Vries, S.C. The CUP-SHAPED COTYLEDON3 gene is required for boundary and shoot meristem formation in Arabidopsis. Plant Cell 2003, 15, 1563–1577. [Google Scholar] [CrossRef]
  19. Zimmermann, R.; Werr, W. Pattern formation in the monocot embryo as revealed by NAMand CUC3 orthologues from Zea mays L. Plant Mol. Biol. 2005, 58, 669–685. [Google Scholar] [CrossRef]
  20. He, X.J.; Mu, R.L.; Cao, W.H.; Zhang, Z.G.; Zhang, J.S.; Chen, S.Y. AtNAC2, a transcription factor downstream of ethylene and auxin signaling pathways, is involved in salt stress response and lateral root development. Plant J. 2005, 44, 903–916. [Google Scholar] [CrossRef]
  21. Guo, Y.; Gan, S. AtNAP, a NAC family transcription factor, has an important role in leaf senescence. Plant J. 2006, 46, 601–612. [Google Scholar] [CrossRef] [PubMed]
  22. Uauy, C.; Distelfeld, A.; Fahima, T.; Blechl, A.; Dubcovsky, J. A NAC Gene regulating senescence improves grain protein, zinc, and iron content in wheat. Science 2006, 314, 1298–1301. [Google Scholar] [CrossRef] [PubMed] [Green Version]
  23. Kim, Y.S.; Kim, S.G.; Park, J.E.; Park, H.Y.; Lim, M.H.; Chua, N.H.; Park, C.M. A membrane-bound NAC transcription factor regulates cell division in Arabidopsis. Plant Cell 2006, 18, 3132–3144. [Google Scholar] [CrossRef] [PubMed] [Green Version]
  24. Willemsen, V.; Bauch, M.; Bennett, T.; Campilho, A.; Wolkenfelt, H.; Jian, X.; Scheres, B. The NAC domain transcription factors FEZ and SOMBRERO control the orientation of cell division plane in Arabidopsis root stem cells. Dev. Cell 2008, 15, 913–922. [Google Scholar] [CrossRef] [Green Version]
  25. Mao, C.J.; He, J.M.; Liu, L.N.; Deng, Q.M.; Yao, X.F.; Liu, C.M.; Qiao, Y.L.; Li, P.; Ming, F. OsNAC2 integrates auxin and cytokinin pathways to modulate rice root development. Plant Biotechnol. J. 2020, 18, 429–442. [Google Scholar] [CrossRef] [Green Version]
  26. Chen, X.; Lu, S.; Wang, Y.; Zhang, X.; Ming, F. OsNAC2 encoding a NAC transcription factor that affects plant height through mediating the gibberellic acid pathway in rice. Plant J. 2015, 82, 302–314. [Google Scholar] [CrossRef]
  27. Jensen, M.K.; Lindemose, S.; Masi, F.D.; Reimer, J.J.; Nielsen, M.; Perera, V.; Workman, C.T.; Turck, F.; Grant, M.R.; Mundy, J.; et al. ATAF1 transcription factor directly regulates abscisic acid biosynthetic gene NCED3 in Arabidopsis thaliana. FEBS Open Bio. 2013, 3, 321–327. [Google Scholar] [CrossRef] [Green Version]
  28. Lu, P.L.; Chen, N.Z.; Rui, A.; Su, Z.; Qi, B.S.; Ren, F.; Chen, J.; Wang, X.C. A novel drought-inducible gene, ATAF1, encodes a NAC family protein that negatively regulates the expression of stress-responsive genes in Arabidopsis. Plant Mol. Biol. 2007, 63, 289–305. [Google Scholar] [CrossRef]
  29. Zheng, X.; Chen, B.; Lu, G.; Han, B. Overexpression of a NAC transcription factor enhances rice drought and salt tolerance. Biochem. Biophys. Res. Commun. 2009, 379, 985–989. [Google Scholar] [CrossRef]
  30. Hu, H.; Dai, M.; Yao, J.; Xiao, B.; Li, X.; Zhang, Q.; Xiong, L. Overexpressing a NAM, ATAF, and CUC (NAC) transcription factor enhances drought resistance and salt tolerance in rice. Proc. Natl. Acad. Sci. USA 2006, 103, 12987–12992. [Google Scholar] [CrossRef] [Green Version]
  31. Tran, L.S.; Nakashima, K.; Sakuma, Y.; Simpson, S.D.; Fujita, Y.; Maruyama, K.; Fujita, M.; Seki, M.; Shinozaki, K.; Yamaguchi-Shinozaki, K. Isolation and functional analysis of Arabidopsis stress-inducible NAC transcription factors that bind to a drought-responsive cis-element in the early responsive to dehydration stress 1 promoter. Plant Cell 2004, 16, 2481–2498. [Google Scholar] [CrossRef] [PubMed] [Green Version]
  32. Jiang, Y.; Deyholos, M.K. Comprehensive transcriptional profiling of NaCl-stressed Arabidopsis roots reveals novel classes of responsive genes. BMC Plant Biol. 2006, 6, 1–20. [Google Scholar] [CrossRef] [PubMed] [Green Version]
  33. Collinge, M.; Boller, T. Differential induction of two potato genes, Stprx2 and StNAC, in response to infection by Phytophthora infestans and to wounding. Plant Mol. Biol. 2001, 46, 521–529. [Google Scholar] [CrossRef] [PubMed]
  34. Ren, T.; Qu, F.; Morris, T.J. HRT gene function requires interaction between a NAC protein and viral capsid protein to confer resistance to turnip crinkle virus. Plant Cell 2000, 12, 1917–1926. [Google Scholar] [CrossRef] [PubMed] [Green Version]
  35. Delessert, C.; Kazan, K.; Wilson, I.W.; Straeten, D.V.D.; Manners, J.; Dennis, E.S.; Dolferus, R. The transcription factor ATAF2 represses the expression of pathogenesis-related genes in Arabidopsis. Plant J. 2005, 43, 745–757. [Google Scholar] [CrossRef] [PubMed]
  36. Wang, X.; Basnayake, B.M.; Zhang, H.; Li, G.; Li, W.; Virk, N.; Mengiste, T.; Song, F. The Arabidopsis ATAF1, a NAC transcription factor, is a negative regulator of defense responses against necrotrophic fungal and bacterial pathogens. Mol. Plant-Microbe Interact. 2009, 22, 1227–1238. [Google Scholar] [CrossRef] [Green Version]
  37. Jeong, J.S.; Kim, Y.S.; Redillas, M.C.F.R.; Jang, G.; Jung, H.; Bang, S.W.; Choi, Y.D.; Ha, S.H.; Reuzeau, C.; Kim, J.K. OsNAC5 overexpression enlarges root diameter in rice plants leading to enhanced drought tolerance and increased grain yield in the field. Plant Biotechnol. J. 2013, 11, 101–114. [Google Scholar] [CrossRef]
  38. Xue, G.P.; Way, H.M.; Richardson, T.; Drenth, J.; Joyce, P.A.; McIntyre, C.L. Overexpression of TaNAC69 leads to enhanced transcript levels of stress up-regulated genes and dehydration tolerance in bread wheat. Mol. Plant 2011, 4, 697–712. [Google Scholar] [CrossRef]
  39. Nuruzzaman, M.; Manimekalai, R.; Sharoni, A.M.; Satoh, K.; Kondoh, H.; Ooka, H.; Kikuchi, S. Genome-wide analysis of NAC transcription factor family in rice. Gene 2010, 465, 30–44. [Google Scholar] [CrossRef]
  40. Ooka, H.; Satoh, K.; Doi, K.; Nagata, T.; Otomo, Y.; Murakami, K.; Matsubara, K.; Osato, N.; Kawai, J.; Carninci, P.; et al. Comprehensive analysis of NAC family genes in Oryza sativa and Arabidopsis thaliana. DNA Res. 2003, 10, 239–247. [Google Scholar] [CrossRef]
  41. Fang, Y.J.; Jun, Y.; Xie, K.B.; Xiong, L.Z. Systematic sequence analysis and identification of tissue-specific or stress-responsive genes of NAC transcription factor family in rice. Mol. Genet. Genom. 2008, 280, 547–563. [Google Scholar] [CrossRef] [PubMed]
  42. Hu, R.B.; Guang, Q.; Kong, Y.Z.; Kong, D.J.; Gao, Q.; Zhou, G.K. Comprehensive analysis of NAC domain transcription factor gene family in Populus trichocarpa. BMC Plant Biol. 2010, 10, 145. [Google Scholar] [CrossRef] [PubMed] [Green Version]
  43. Ha, C.V.; Esfahani, M.N.; Watanabe, Y.; Tran, U.T.; Sulieman, S.; Mochida, K.; Nguyen, D.V.; Tran, L.S. Genome-wide identification and expression analysis of the CaNAC family members in chickpea during development, dehydration and ABA treatments. PLoS ONE 2014, 9, e114107. [Google Scholar] [CrossRef] [Green Version]
  44. Zhang, Y.J.; Li, D.H.; Wang, Y.Y.; Zhou, R.; Wang, L.H.; Zhang, Y.X.; Yu, J.Y.; Gong, H.H.; You, J.; Zhang, X.R.; et al. Genome-wide identification and comprehensive analysis of the NAC transcription factor family in Sesamum indicum. PLoS ONE 2018, 13, e0199262. [Google Scholar] [CrossRef]
  45. Gong, X.; Zhao, L.Y.; Song, X.F.; Lin, Z.K.; Gu, B.J.; Yan, J.X.; Zhang, S.L.; Tao, S.T.; Huang, X.S. Genome-wide analyses and expression patterns under abiotic stress of NAC transcription factors in white pear (Pyrus bretschneideri). BMC Plant Biol. 2019, 19, 161. [Google Scholar] [CrossRef] [PubMed]
  46. Chen, S.; Lin, X.; Zhang, D.; Li, Q.; Chen, S. Genome-wide analysis of NAC gene family in Betula pendula. Forests 2019, 10, 741. [Google Scholar] [CrossRef] [Green Version]
  47. He, Q.; Liu, Y.; Zhang, M.; Bai, M.; Qin, Y. Genome-wide identification and expression analysis of the NAC transcription factor family in pineapple. Trop. Plant Biol. 2019, 12, 255–267. [Google Scholar] [CrossRef]
  48. Wang, N.; Liu, H.; Li, Z.; Lu, L.; Wang, C. The bioactive compounds and biological functions of Asparagus officinalis L.—A review. J. Funct. Foods. 2019, 65, 03727. [Google Scholar]
  49. Pegiou, E.; Mumm, R.; Acharya, P.; de Vos, R.; Hall, R.D. Green and White asparagus (Asparagus officinalis): A Source of Developmental, Chemical and Urinary Intrigue. Metabolites 2019, 10, 17. [Google Scholar] [CrossRef]
  50. Global Production of Vegetables in 2020, by Type. 2022. Available online: https://www.statista.com/statistics/264065/global-production-of-vegetables-by-type (accessed on 22 April 2022).
  51. Sriyab, S.; Laosirisathian, N.; Punyoyai, C.; Anuchapreeda, S.; Tima, S.; Chiampanichayakul, S.; Chaiyana, W. Nutricosmetic effects of Asparagus officinalis: A potent matrix metalloproteinase-1 inhibitor. Sci. Rep. 2021, 11, 8772. [Google Scholar] [CrossRef]
  52. Rui, M.; Ricardo, S. Soil salinity: Effect on vegetable crop growth. Management practices to prevent and mitigate soil salinization. Horticulturae 2017, 3, 13. [Google Scholar]
  53. Zhang, X.; Han, C.; Cao, Y. Transcriptomic and Physiological analyses reveal the dynamic response to salinity stress of the garden asparagus (Asparagus officinalis L.). Plant Mol. Biol. Report. 2020, 38, 613–627. [Google Scholar] [CrossRef]
  54. Harkess, A.; Zhou, J.; Xu, C.; Bowers, J.E.; Van der Hulst, R.; Ayyampalayam, S.; Mercati, F.; Riccardi, P.; McKain, M.R.; Kakrana, A.; et al. The asparagus genome sheds light on the origin and evolution of a young Y chromosome. Nat. Commun. 2017, 8, 1279. [Google Scholar] [CrossRef] [PubMed]
  55. El-Gebali, S.; Mistry, J.; Bateman, A.; Eddy, S.R.; Luciani, A.; Potter, S.C.; Qureshi, M.; Richardson, L.J.; Salazar, G.A.; Smart, A. The Pfam protein families database in 2019. Nucleic Acids Res. 2019, 47, D427–D432. [Google Scholar] [CrossRef] [PubMed]
  56. Larkin, M.A.; Blackshields, G.; Brown, N.P.; Chenna, R.; McGettigan, P.A.; McWilliam, H.; Valentin, F.; Wallace, I.M.; Wilm, A.; Lopez, R. Clustal W and Clustal X version 2.0. Bioinformatics 2007, 23, 2947–2948. [Google Scholar] [CrossRef] [Green Version]
  57. Kumar, S.; Stecher, G.; Li, M.; Knyaz, C.; Tamura, K. MEGA X: Molecular evolutionary genetics analysis across computing platforms. Mol. Biol. Evol. 2018, 35, 1547–1549. [Google Scholar] [CrossRef]
  58. Letunic, I.; Copley, R.R.; Schmidt, S.; Ciccarelli, F.D.; Doerks, T.; Schultz, J.; Ponting, C.P.; Bork, P. SMART 4.0: Towards genomic data integration. Nucleic Acids Res. 2004, 32, D142–D144. [Google Scholar] [CrossRef] [Green Version]
  59. Edgar, R.C. MUSCLE: A multiple sequence alignment method with reduced time and space complexity. BMC Bioinform. 2004, 5, 113. [Google Scholar] [CrossRef] [Green Version]
  60. Yu, G. Using ggtree to visualize data on tree-like structures. Curr. Protoc. Bioinform. 2020, 69, e96. [Google Scholar] [CrossRef]
  61. Lescot, M.; Déhais, P.; Thijs, G.; Marchal, K.; Moreau, Y.; Van de Peer, Y.; Rouzé, P.; Rombauts, S. PlantCARE, a database of plant cis-acting regulatory elements and a portal to tools for in silico analysis of promoter sequences. Nucleic Acids Res. 2002, 30, 325–327. [Google Scholar] [CrossRef]
  62. Bailey, T.L.; Boden, M.; Buske, F.A.; Frith, M.; Grant, C.E.; Clementi, L.; Ren, J.; Li, W.W.; Noble, W.S. MEME SUITE: Tools for motif discovery and searching. Nucleic Acids Res. 2009, 37, W202–W208. [Google Scholar] [CrossRef] [PubMed]
  63. Hu, B.; Jin, J.P.; Guo, A.Y.; Zhang, H.; Luo, J.C.; Gao, G. GSDS 2.0: An upgraded gene feature visualization server. Bioinformatics 2015, 31, 1296–1297. [Google Scholar] [CrossRef] [PubMed] [Green Version]
  64. Wilkins, M.R.; Gasteiger, E.; Bairoch, A.; Sanchez, J.C.; Hochstrasser, D.F. Protein identification and analysis tools in the ExPASy server. Methods Mol. Biol. 1999, 112, 531–552. [Google Scholar] [PubMed]
  65. Wang, D.P.; Zhang, Y.B.; Zhang, Z.; Zhu, J.; Yu, J. KaKs_Calculator 2.0: A Toolkit Incorporating Gamma-Series Methods and Sliding Window Strategies. Genom. Proteom. Bioinf. 2010, 8, 77–80. [Google Scholar] [CrossRef] [Green Version]
  66. Zhang, X.; Han, C.; Gao, H.; Cao, Y. Comparative transcriptome analysis of the garden asparagus (Asparagus officinalis L.) reveals the molecular mechanism for growth with arbuscular mycorrhizal fungi under salinity stress. Plant Physiol. Biochem. 2019, 141, 20–29. [Google Scholar] [CrossRef]
  67. Andrew, S. FastQC: A quality control tool for high throughput sequence data. Babraham Bioinform. 2014, 532, 1. [Google Scholar]
  68. Ewels, P.; Magnusson, M.; Lundin, S.; Käller, M. MultiQC: Summarize analysis results for multiple tools and samples in a single report. Bioinformatics 2016, 32, 3047–3048. [Google Scholar] [CrossRef] [Green Version]
  69. Bolger, A.M.; Lohse, M.; Usadel, B. Trimmomatic: A flexible trimmer for Illumina sequence data. Bioinformatics 2014, 30, 2114–2120. [Google Scholar] [CrossRef] [Green Version]
  70. Dobin, A.; Davis, C.A.; Schlesinger, F.; Drenkow, J.; Zaleski, C.; Jha, S.; Batut, P.; Chaisson, M.; Gingeras, T.R. STAR: Ultrafast universal RNA-seq aligner. Bioinformatics 2013, 29, 15–21. [Google Scholar] [CrossRef]
  71. Li, B.; Dewey, C.N. RSEM: Accurate transcript quantification from RNA-Seq data with or without a reference genome. BMC Bioinform. 2011, 12, 323. [Google Scholar] [CrossRef] [Green Version]
  72. Love, M.I.; Huber, W.; Anders, S. Moderated estimation of fold change and dispersion for RNA-seq data with DESeq2. Genome Biol. 2014, 15, 550. [Google Scholar] [CrossRef] [PubMed] [Green Version]
  73. Al-Ghamdi, A.A.; Elansary, H.O. Synergetic effects of 5-aminolevulinic acid and Ascophyllum nodosum seaweed extracts on asparagus phenolics and stress related genes under saline irrigation. Plant Physiol. Bioch. 2018, 129, 273–284. [Google Scholar] [CrossRef] [PubMed]
  74. Pressman, E.; Schaffer, A.A.; Compton, D.; Zmski, E. Carbohydrate content of young asparagus plants affected by temperature regimes. J. Plant Physiol. 1994, 143, 621–624. [Google Scholar] [CrossRef]
  75. Murase, K.; Shigenobu, S.; Fujii, S.; Ueda, K.; Murata, T.; Sakamoto, A.; Wada, Y.; Yamaguchi, K.; Osakabe, Y.; Osakabe, K.; et al. MYB transcription factor gene involved in sex determination in Asparagus officinalis. Genes Cells 2017, 22, 115–123. [Google Scholar] [CrossRef] [Green Version]
  76. Dong, T.; Han, R.; Yu, J.; Zhu, M.; Zhang, Y.; Gong, Y.; Li, Z. Anthocyanins accumulation and molecular analysis of correlated genes by metabolome and transcriptome in green and purple asparaguses (Asparagus officinalis L.). Food Chem. 2019, 271, 18–28. [Google Scholar] [CrossRef]
  77. Moore, R.C.; Purugganan, M.D. The early stages of duplicate gene evolution. Proc. Natl. Acad. Sci. USA 2003, 100, 15682–15687. [Google Scholar] [CrossRef] [Green Version]
  78. Wang, N.; Zheng, Y.; Xin, H.; Fang, L.; Li, S. Comprehensive analysis of NAC domain transcription factor gene family in Vitis vinifera. Plant Cell Rep. 2013, 32, 61–75. [Google Scholar] [CrossRef]
  79. Guo, J.; Wang, S.; Yu, X.; Dong, R.; Li, Y.; Mei, X.; Shen, Y. Polyamines regulate strawberry fruit ripening by abscisic acid, auxin, and ethylene. Plant Physiol. 2018, 177, 339–351. [Google Scholar] [CrossRef] [Green Version]
  80. An, X.H.; Tian, Y.; Chen, K.Q.; Liu, X.J.; Liu, D.D.; Xie, X.B.; Cheng, C.G.; Cong, P.H.; Hao, Y.J. MdMYB9 and MdMYB11 are involved in the regulation of the JA-induced biosynthesis of anthocyanin and proanthocyanidin in apples. Plant Cell Physiol. 2015, 56, 650–662. [Google Scholar] [CrossRef] [Green Version]
  81. Cruz, A.B.; Bianchetti, R.E.; Alves, F.R.R.; Purgatto, E.; Peres, L.E.P.; Rossi, M.; Freschi, L. Light, Ethylene and Auxin Signaling Interaction Regulates Carotenoid Biosynthesis During Tomato Fruit Ripening. Front Plant Sci. 2018, 9, 1370. [Google Scholar] [CrossRef]
  82. Ju, Y.L.; Yue, X.F.; Min, Z.; Wang, X.H.; Fang, Y.L.; Zhang, J.X. VvNAC17, a novel stress-responsive grapevine (Vitis vinifera L.) NAC transcription factor, increases sensitivity to abscisic acid and enhances salinity, freezing, and drought tolerance in transgenic Arabidopsis. Plant Physiol. Biochem. 2020, 146, 98–111. [Google Scholar] [CrossRef] [PubMed]
  83. Li, M.; Chen, R.; Jiang, Q.; Sun, X.; Zhang, H.; Hu, Z. GmNAC06, a NAC domain transcription factor enhances salt stress tolerance in soybean. Plant Mol. Biol. 2021, 105, 333–345. [Google Scholar] [CrossRef] [PubMed]
  84. An, J.P.; Yao, J.F.; Xu, R.R.; You, C.X.; Wang, X.F.; Hao, Y.J. An apple NAC transcription factor enhances salt stress tolerance by modulating the ethylene response. Physiol. Plant. 2018, 164, 279–289. [Google Scholar] [CrossRef] [PubMed] [Green Version]
Figure 1. Phylogenetic tree of NAC genes between A. officinalis and A. thaliana. The AoNAC and AtNAC genes are indicated with red and black fonts, respectively. They are divided into 14 subgroups according to the subgroups of Arabidopsis and represented by different colors. The phylogenetic tree was compiled by the Maximum Likelihood (ML) method, with 1000 bootstrap replicates.
Genes 13 00976 g001
Figure 2. Phylogenetic relationship, conserved motifs, and gene structure of AoNAC genes. (A) An unrooted phylogenetic tree was constructed by using the ML method with 1000 bootstrap replicates based on AoNAC protein full-length sequences. (B) The conserved AoNAC protein motifs were predicted by the MEME program. Different colored boxes represent different motifs, and the black lines represent non-conserved sequences. The scale bar is 200 amino acids. (C) The intron/exon structures of AoNAC genes were displayed by using Gene Structure Display Server 2.0 program. The black line represents introns, and the green box represents exons. The intron and exon scale bars are 10 and 1 kb, respectively.
Genes 13 00976 g002
Figure 3. (A) Physical distribution of AoNAC genes on 9 chromosomes (Chr01–Chr09) and an undefined chromosome (Un). Vertical bars represent the chromosome of A. officinalis. The scale is in 15 Mb. (B) Number of AoNAC subgroups on each chromosome.
Genes 13 00976 g003
Figure 4. The cis-acting elements analysis of AoNAC genes. (A) Based on the promoter 2000 bp sequences of 85 AoNAC genes, we analyzed the light-responsive, hormone-responsive, plant-growth-and-development-related, anaerobic inducibility, low-temperature responsive, drought inducibility, defense and stress-responsive, anoxic-specific inducibility, and wound-responsive cis-elements. Different colors represent different cis-acting elements. (B) The number of AoNAC genes in the four types (including six subtypes). (C) The number of the various cis-elements in the stress-responsive element is presented in the bar chart.
Genes 13 00976 g004
Figure 5. Schematic diagram of the duplication patterns of the AoNAC genes. The blue lines indicate segmental duplications of AoNAC gene pairs, and the red lines indicate tandem duplications of AoNAC gene pairs.
Genes 13 00976 g005
Figure 6. Schematic diagram of syntenic analysis. Synteny of the AoNAC genes with the NAC genes of A. thaliana (A), S. indicum (B), and A. comosus (C) was visualized by MCScanX and TBtools software. The gray lines between the chromosomes of the two species indicate all synteny blocks, and the red lines represent the synteny of their NAC genes.
Genes 13 00976 g006
Figure 7. Venn diagram of the identical and different NAC genes among A. officinalis, A. thaliana, S. indicum, and A. comosus.
Genes 13 00976 g007
Figure 8. Differential gene expression of AoNAC genes under different types of salinity stress: (A) non-inoculated A. officinalis plants without salinity stress (NI) and non-inoculated A. officinalis plants subjected to salinity stress (NI + S); (B) inoculated A. officinalis plants without salinity stress (AMF) and inoculated A. officinalis plants subjected to salinity stress (AMF + S). Heatmaps are based on the log10-transformed RPKM values. Red represents a high expression level, and blue represents a low expression level. Volcano plots are based on the significantly adjusted p-value (padj) < 0.05 and an absolute value of log2FC (log of fold change) > 1.
Genes 13 00976 g008
Table 1. Detailed information of NAC genes in A. officinalis.
Gene SymbolpIMW (kDa)Length (aa)Instability IndexAliphatic IndexSubcellular LocalizationORFDuplications
AoNAC14.4950.3544945.6563.63Nucleus1350Dispersed
AoNAC25.1846.2941248.1070.49Nucleus1239Dispersed
AoNAC37.6828.4224940.8970.12Nucleus750Dispersed
AoNAC45.5126.4623224.7557.11Nucleus699Dispersed
AoNAC55.4299.2687257.2471.69Nucleus2619Dispersed
AoNAC65.3829.6526339.1360.72Nucleus792Dispersed
AoNAC77.3836.7433044.4765.00Nucleus993Dispersed
AoNAC88.3635.4731843.2061.32Nucleus957Dispersed
AoNAC97.0337.6033844.8169.56Nucleus1017Dispersed
AoNAC107.3543.4838947.8461.13Nucleus1167Dispersed
AoNAC117.7135.9031239.6463.46Nucleus939Dispersed
AoNAC128.5432.3428430.0558.31Nucleus855Dispersed
AoNAC139.3318.9316135.4655.78Nucleus486Dispersed
AoNAC144.8269.3362154.8769.73Endomembrane System1866Dispersed
AoNAC155.9535.9731357.0468.18Nucleus942Dispersed
AoNAC166.3631.3827941.3955.63Nucleus840Dispersed
AoNAC179.1721.5419761.8560.46Nucleus594WGD/Segmental
AoNAC185.4917.8615372.4374.51Nucleus462Dispersed
AoNAC194.9448.2842560.3764.05Nucleus1278Dispersed
AoNAC205.3036.1931844.0764.69Nucleus957Dispersed
AoNAC216.4731.9028044.9358.57Nucleus843Dispersed
AoNAC224.8466.2958953.8469.56Endomembrane System1770Dispersed
AoNAC236.9130.5027356.5957.58Nucleus822Dispersed
AoNAC248.9430.0426145.3762.03Nucleus786Dispersed
AoNAC255.8129.5126161.5168.70Nucleus786Dispersed
AoNAC265.1817.8615655.8876.79Nucleus471Dispersed
AoNAC275.4343.3238654.3863.73Nucleus1161Proximal
AoNAC286.44131.61118753.5170.73Nucleus3564Tandem
AoNAC295.9372.8165246.3778.70Plasma Membrane1959WGD/Segmental
AoNAC306.4742.8838335.1560.34Nucleus1152Dispersed
AoNAC319.7323.7920945.9156.08Chloroplast630Dispersed
AoNAC325.7635.2530442.8759.61Nucleus915Dispersed
AoNAC334.6713.5612146.4243.55Nucleus366Dispersed
AoNAC345.84127.90113958.0874.12Nucleus3420Dispersed
AoNAC359.0823.6120535.3770.83Nucleus618Dispersed
AoNAC3610.0527.5126140.6659.20Nucleus786Dispersed
AoNAC375.7829.8626354.6961.86Nucleus792Dispersed
AoNAC385.2848.4042349.8462.53Nucleus1272Tandem
AoNAC396.4947.1841553.2957.42Nucleus1248Tandem
AoNAC404.5242.5737349.9866.89Nucleus1122Dispersed
AoNAC415.7164.4456346.6973.53Nucleus1692Proximal
AoNAC424.9327.9724341.9962.55Nucleus732Proximal
AoNAC439.0225.1822144.4356.88Nucleus666WGD/Segmental
AoNAC445.0442.4637747.3060.24Nucleus1134Dispersed
AoNAC454.7025.4822449.3777.50Nucleus675Dispersed
AoNAC467.0733.3129356.0160.31Nucleus882Dispersed
AoNAC474.9121.9919147.5863.30Nucleus576Dispersed
AoNAC489.1124.5220530.9058.44Nucleus618Dispersed
AoNAC494.8337.7133867.4869.56Nucleus1017Dispersed
AoNAC507.0232.1527833.7256.47Nucleus837Dispersed
AoNAC515.0332.2729041.8174.38Nucleus873Dispersed
AoNAC524.6757.7851643.7460.31Nucleus1551Dispersed
AoNAC539.1036.0331540.0178.03Nucleus948Dispersed
AoNAC549.4427.5024538.8561.76Nucleus738Dispersed
AoNAC559.4620.9518648.1181.24Chloroplast561Dispersed
AoNAC568.0434.7630847.1761.43Nucleus927Dispersed
AoNAC575.8528.9725352.1568.58Nucleus762Dispersed
AoNAC588.8446.5441253.0659.13Nucleus1239Dispersed
AoNAC595.8710.349048.3675.78Nucleus273Dispersed
AoNAC609.2713.3611346.5848.32Chloroplast342Dispersed
AoNAC618.4432.2528751.5358.75Nucleus864WGD/Segmental
AoNAC626.3678.3968553.9664.89Nucleus2058Tandem
AoNAC635.4415.7813439.3290.90Nucleus405Tandem
AoNAC647.6134.0129929.0652.81Nucleus900Dispersed
AoNAC656.9829.3826038.0270.50Nucleus783Dispersed
AoNAC665.4735.2031357.9261.79Nucleus942Proximal
AoNAC674.6745.4840457.8769.33Nucleus1215Proximal
AoNAC686.6740.1535644.8671.24Nucleus1071Dispersed
AoNAC697.0439.2334446.4057.50Extracellular Space1035WGD/Segmental
AoNAC707.7134.2829849.5659.30Nucleus897WGD/Segmental
AoNAC716.1129.6426665.6748.08Nucleus801Dispersed
AoNAC728.8813.7011771.0764.10Chloroplast354Dispersed
AoNAC735.5029.5126452.0962.05Nucleus795Dispersed
AoNAC748.3923.0720148.5465.87Nucleus606Dispersed
AoNAC759.7120.8718644.0466.18Nucleus561WGD/Segmental
AoNAC765.5136.1031443.3561.82Nucleus945Dispersed
AoNAC779.5324.8721946.4559.22Nucleus660WGD/Segmental
AoNAC785.6144.1039242.4176.12Chloroplast1179Dispersed
AoNAC798.8530.9527246.2476.69Nucleus819Dispersed
AoNAC805.4324.0020836.8353.41Nucleus627Tandem
AoNAC815.2464.6356746.7671.55Nucleus1704Tandem
AoNAC828.5526.8023457.6867.91Nucleus705WGD/Segmental
AoNAC835.5832.4727849.1964.89Nucleus837Dispersed
AoNAC848.1927.0523249.1968.10Nucleus699Dispersed
AoNAC854.6350.4845140.3662.86Nucleus1356Dispersed
Table 2. Tandem duplication in AoNAC genes and corresponding Ka, Ks, and Ka/Ks values.
Tandem DuplicationChromosome NameKaKsKa/Ks
AoNAC38 and AoNAC39Chr040.350.700.51
AoNAC62 and AoNAC63Chr060.060.100.60
AoNAC80 and AoNAC81Chr100.293.690.08
Publisher’s Note: MDPI stays neutral with regard to jurisdictional claims in published maps and institutional affiliations.

