Article

Genome-Wide Association Study Identifies Candidate Genes for Stripe Pattern Feather Color of Rhode Island Red Chicks

1
National Engineering Laboratory for Animal Breeding, College of Animal Science and Technology, China Agricultural University, Beijing 100193, China
2
Dawu Breeding Company, Baoding 072550, China
*
Author to whom correspondence should be addressed.
Genes 2022, 13(9), 1511; https://doi.org/10.3390/genes13091511
Submission received: 8 July 2022 / Revised: 17 August 2022 / Accepted: 20 August 2022 / Published: 24 August 2022
(This article belongs to the Section Animal Genetics and Genomics)

Abstract

:
Feather colors of chickens are not only characteristics of breeds but also as phenotypic markers in chicken breeding. Pure-bred Rhode Island Red (RIR) chicks have a stripe pattern and a non-stripe pattern on the back. The stripe pattern of RIR is generally shown as four longitudinal black stripes on the back and is more likely to appear in females. In this study, we performed a genome-wide association study (GWAS) to identify candidate genes controlling the stripe pattern of RIR chicks, and then, based on physical location and biological functions, quantitative RT-PCR analysis was used to validate the differential expression of candidate genes between stripe pattern and non-stripe pattern back skin tissue. The GWAS showed that a major signal contains 768 significant single nucleotide polymorphisms (SNPs) and 87 significant small insertions-deletions (INDELs) spanning 41.78 to 43.05 Mb (~1.27 Mb) on GGA1, corresponding to 16 genes associated with stripe pattern phenotype. Among these 16 genes, KITLG and TMTC3 could be considered candidate genes as they showed different expressions between back skin tissues of stripe pattern and non-stripe pattern chicks in value (p = 0.062) and the significant level (p < 0.05), respectively. This study provided novel insight into the mechanisms underlying feather pigmentation and stripe formation in RIR chicks.

1. Introduction

Feather colors are not only characteristics of chicken breeds but also as phenotypic markers in chicken breeding. They can be categorized as patterned (dorsal and ventral pigmentation, spots, stripes, patches, etc.) and non-patterned (solid colored from heavily pigmented to white) at the whole-body level [1,2]. Over a long period of domestication, variations of feather color arose and was selectively bred, which led to a bewildering array of colors and patterns in chickens [3,4,5]. Melanin, including eumelanin (brown to black) and pheomelanin (yellow to red), was produced by melanocytes in hair follicles [3,6]. Feather colors are directly determined by the distribution of melanin type and density which depend on a cascade of molecular signal pathways during the complex processes of the regulation of melanocytes and melanin production [1,6,7]. In addition, the structural color, namely the interaction between the feather microstructure and light, also plays an important role in the final formation of the feather color [8,9,10].
Genes that control feather colors and their associated inheritance patterns in chickens have been extensively studied. Kerje et al. reported that the MC1R gene should be equal to the extended black (E) locus, and its mutations are related to chicken feather colors [11]. Mutations of PMEL17 and TYR were responsible for dominant white and recessive white phenotypes in chicken, respectively [12,13]. Gunnarsson et al. found that two independent missense mutations (Tyr277Cys and Leu347Met) in SLC45A2 were associated with the sex-linked silver locus (S) in chicken [14]. Thalmann et al. suggested that mutations in the regulatory region of CDKN2A cause sex-linked barring in chicken, and two variants in the CDS region of the same gene make the barring pattern more distinct independently [15]. Gunnarsson et al. demonstrated that an 8.3 kb deletion upstream of SOX10 causes dark brown feather color in chickens [16].
Stripe patterns are the most prominent pigment patterns and often show on the back skin at the embryonic and juvenile stages of Galliformes birds [2]. It was reported that melanoblasts committed to producing eumelanin and formed longitudinal black stripes on the back of wild-type quail embryos before the apparent expression of melanogenic genes in melanocytes [17]. In the back derma of Galliformes embryos, expression patterns of ASIP were related to longitudinal stripe patterns (alternating yellow and black dorsal stripes) and regulated the width of yellow stripes [18,19]. Rhode Island Red (RIR) chicken is one of the most common breeds in the world and is often used as a cross parent for many commercial layers [4]. Pure-bred RIR chicks show stripe patterns and non-stripe patterns on the back (Figure 1a,b). The stripe pattern is generally shown as four longitudinal black stripes covering the back and is more likely to appear in female chicks younger than 2 weeks old. As the chick grows, the downy feathers are gradually replaced with youth feathers and the stripes disappear (Figure 1c,d). To date, the molecular mechanisms underlying the stripe pattern in RIR chicks remain unknown. We observed that in Dawu Breeding Company stripe pattern in females accounted for about 85–90% of the total female chicks, while in males, about 5% of the total male chicks. In this study, we used a pure-bred RIR chicken population to identify the candidate genes controlling stripe patterns while providing some clues for revealing the molecular mechanisms of the formation of black stripe patterns in chicks.

2. Materials and Methods

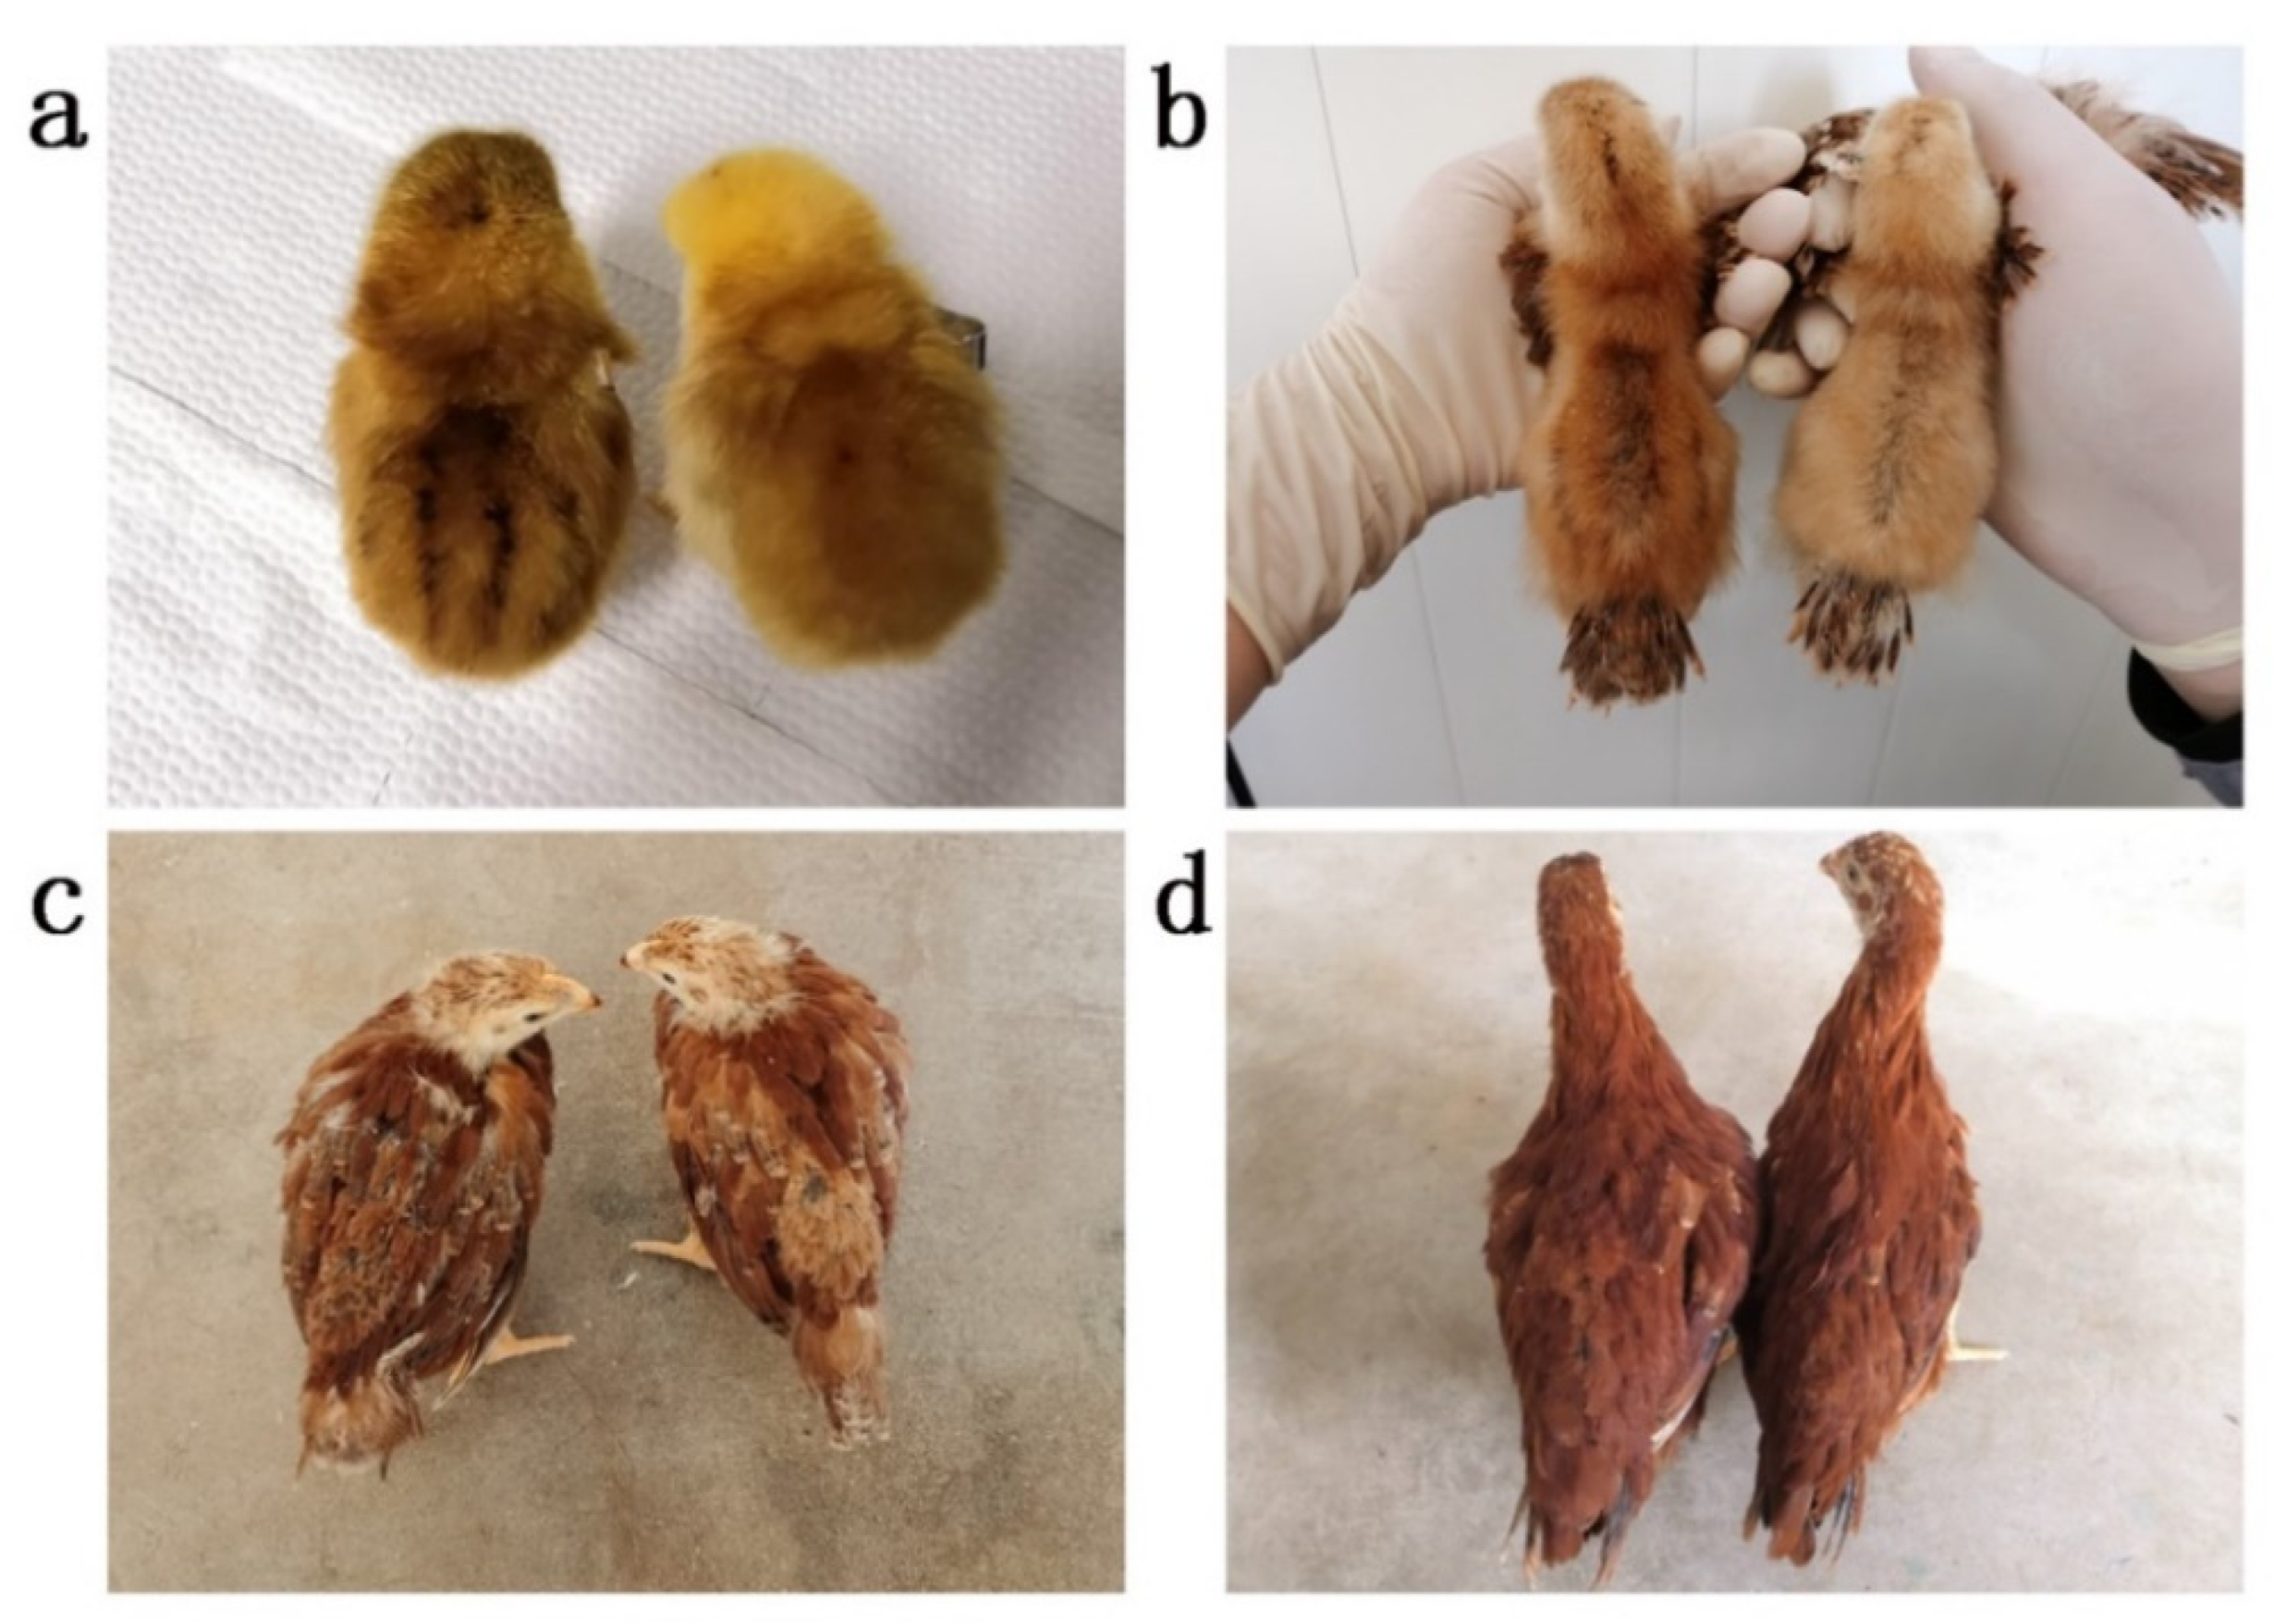
2.1. Animals and Sample Collection

All birds used in this study were from a pure-bred RIR population raised in Dawu Breeding Company (Baoding, China). Based on pedigree records, 14 roosters and 132 hens with no relationship between any two birds within two generations were selected from the pure-bred RIR population at the age of 30 weeks to breed their chicks, each rooster mating with 8–10 hens. Feather colors of chicks were distinguished within one week after hatching. Once hatched, a total of 74 female chicks, including 37 with the stripe pattern and 37 with the non-stripe pattern, were selected for a genome-wide association study (GWAS) according to the principle of full-sib or half-sib pairing. A blood sample of each female chick for GWAS was collected from the wing vein using 1 mL injectors at 8 weeks of age.

2.2. Whole-Genome Sequencing and Variant Calling

Genomic DNA was isolated from the 74 blood samples using the TIANamp Genomic DNA Kit (Cat. #DP304-03, TIANGEN Biotech (Beijing) Co., Ltd., Beijing, China) according to the manufacturer’s instructions. After being checked and qualified, DNA samples were delivered to a commercial company for next-generation sequencing. The whole-genome resequencing data were generated on Illumina NovaSeq 6000 platform with 150 bp paired-end reads. The average depth of resequencing for each sample was greater than 10 X. After removing reads with low-quality bases containing adapters or poly-Ns from raw data; the clean data were aligned against the reference genome sequence (GRCg6a) supported by Ensembl using the Bowtie 2 (version 2.4.5) with parameters “-p 8 -reorder -X 500”, and then sorted by SAMtools (version 1.11) [20,21]. Genome-wide single nucleotide polymorphisms (SNPs) and small insertions-deletions (INDELs) were detected by SAMtools (version 1.11) “mpileup” module and BCFtools (version 1.11) “call” option [21].

2.3. Genome-Wide Association Studies

VCFtools (version 0.1.16) was performed to filtering variants (SNPs and INDELs) with the following criteria: only bi-allelic sites, quality value per site > 30, mean depth value per site > 5, minor allele frequency > 0.05, missing rate per site < 0.1, distance between adjacent sites > 500 bp [22]. PLINK (version 1.90) was performed to filtering individuals genotype rate > 0.9 and Hardy–Weinberg equilibrium at p > 0.000001 [23]. After filtering, 74 chickens with 1,080,642 SNPs and 106,058 INDELs were retained. GWAS was performed by the “assoc” model of PLINK (version 1.90) software with 37 chicks of stripe pattern (case group) and 37 chicks of the non-stripe pattern (control group) [23]. The significance threshold for GWAS was set at 0.05 after correction for multiple tests by the FDR_BH method [24]. The Manhattan plot was drawn using the R package of qqman [25].

2.4. Variation Annotation and Candidate Gene Identification

The significant SNPs and INDELs were annotated to the gene region or within 5 kb upstream or downstream of the gene by snpEff software (version 4.5) based on the GRCg6a assembly supported by Ensembl [26]. Candidate genes for stripe patterns were identified based on the physical locations of the significant variations and biological functions of corresponding genes.

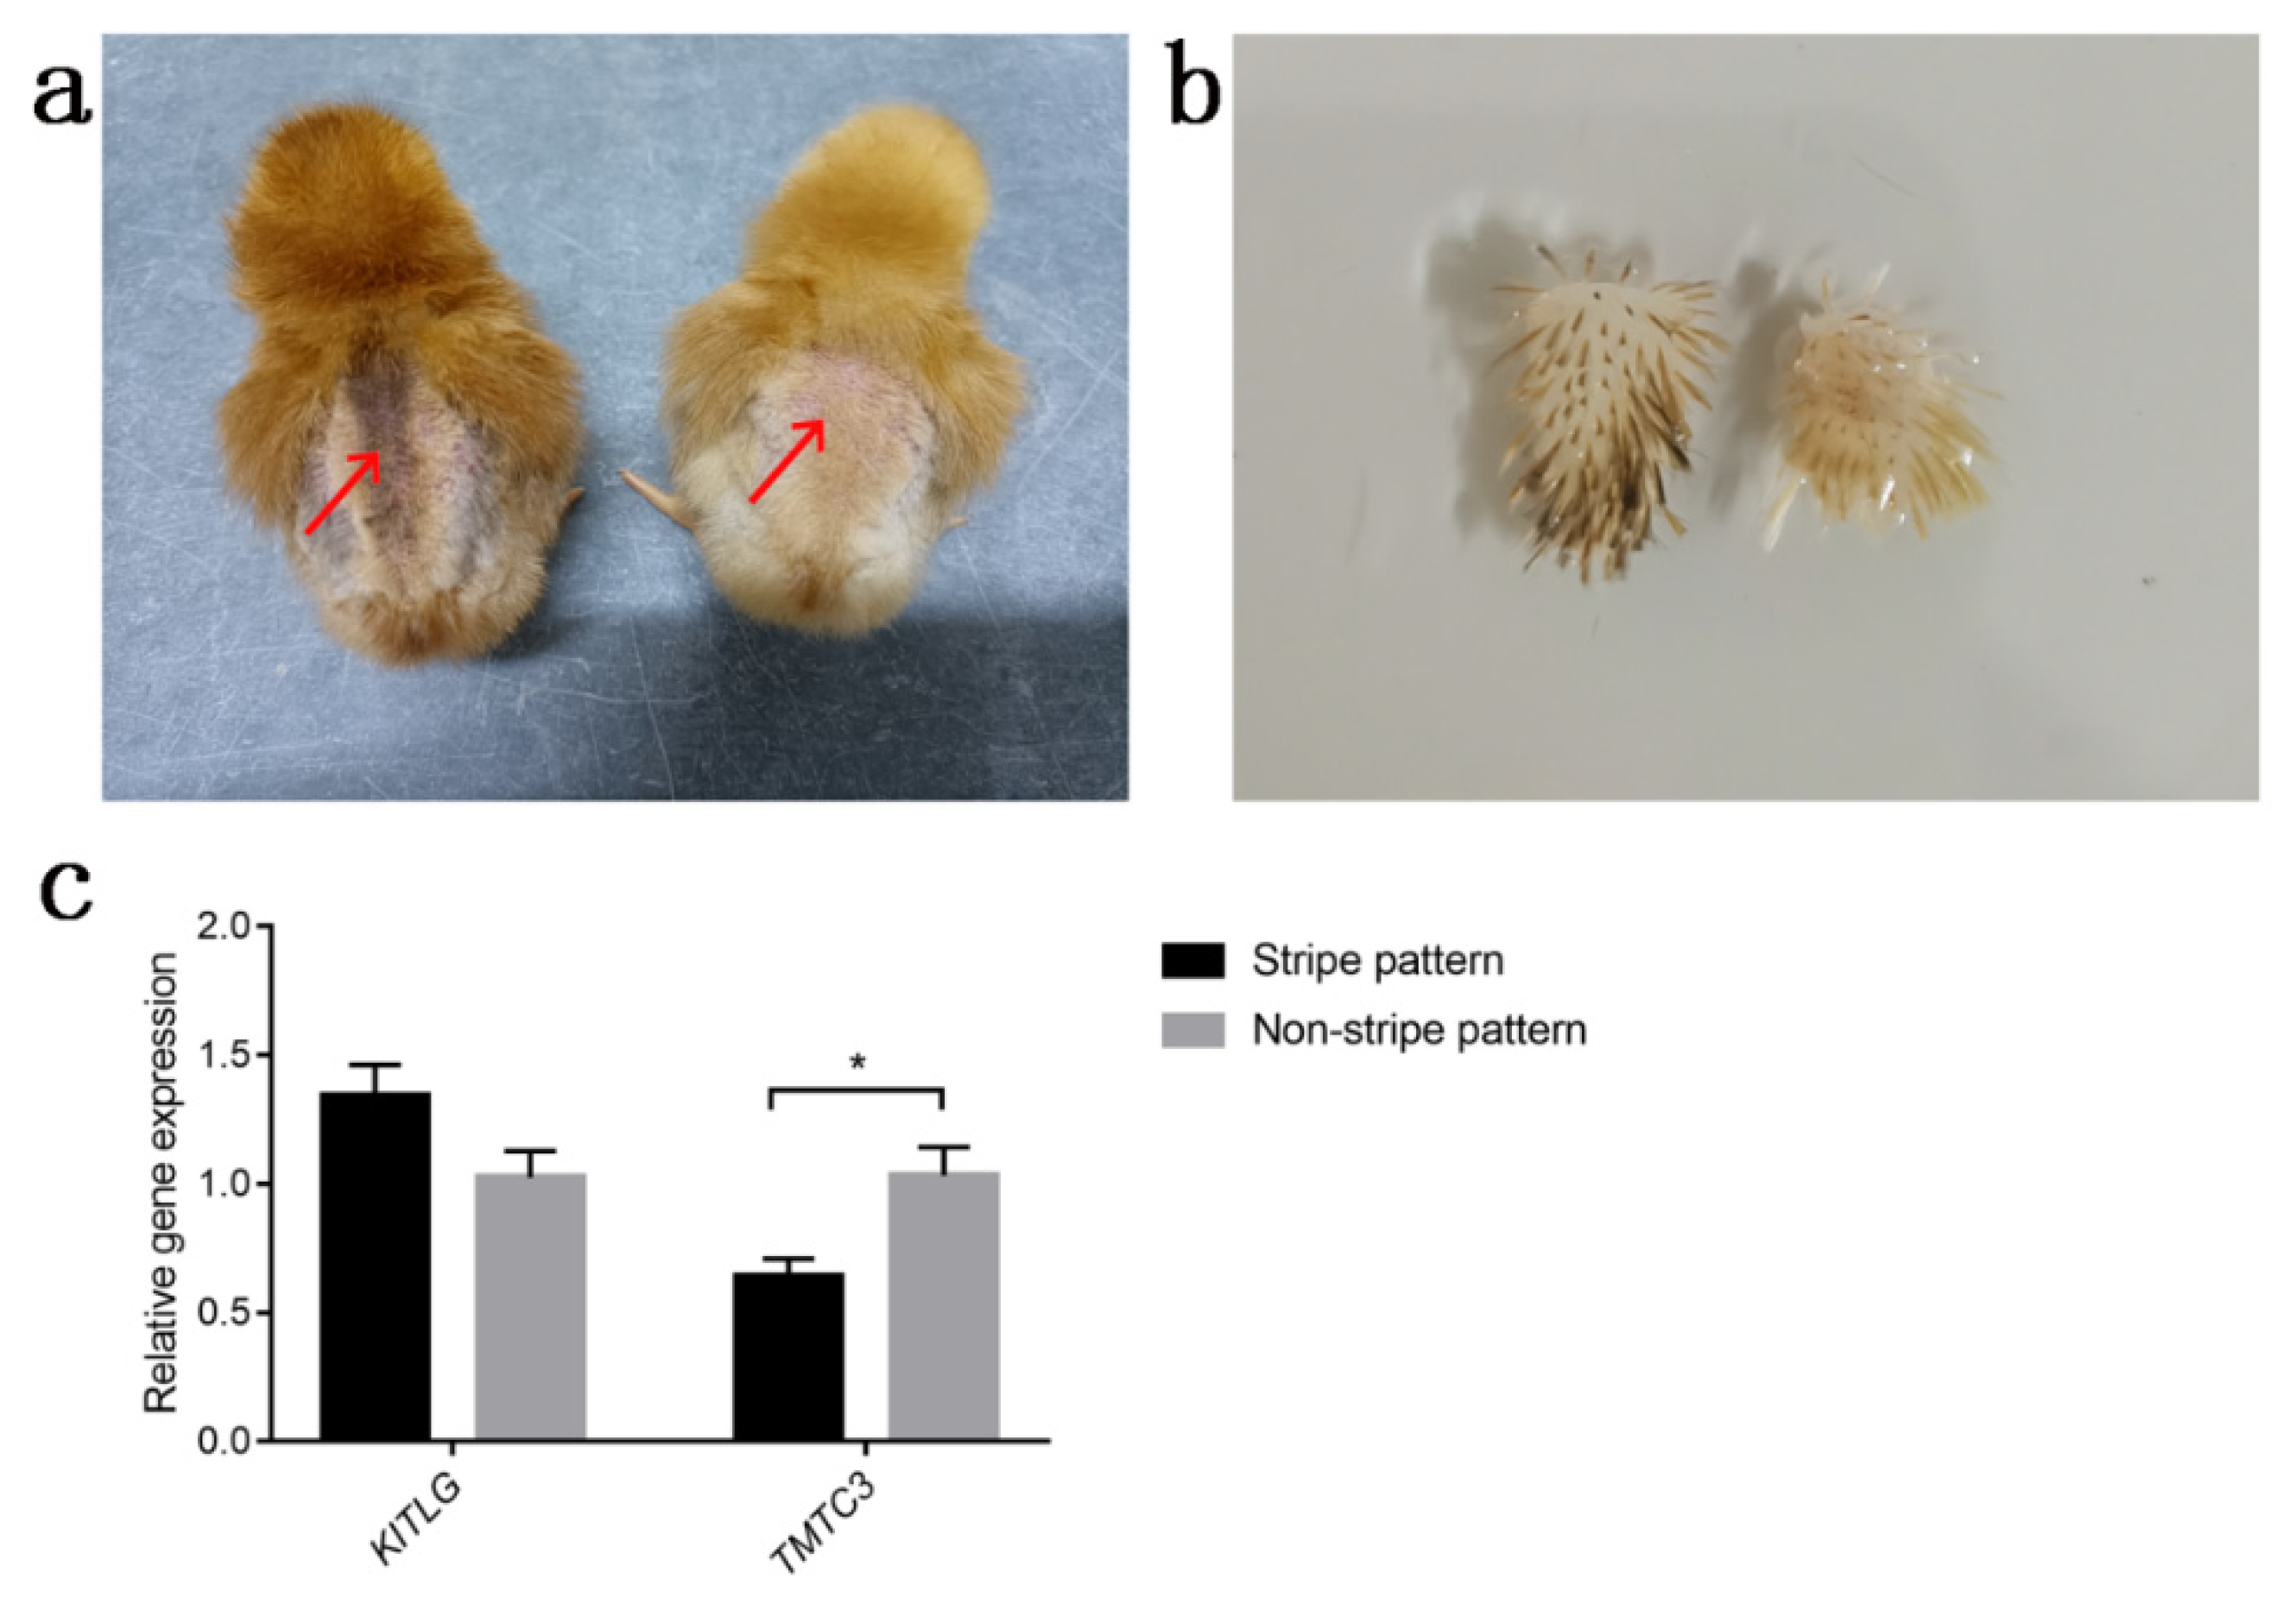
2.5. Quantitative Real-Time PCR

Twelve female chicks of one-day-old (6 birds per phenotype) were selected at random and a piece of back skin tissue of each chick was collected and immediately placed in liquid nitrogen. Total RNA was isolated using the Trizol protocol [27]. The quality and concentration were determined by NanoDrop 2000 Spectrophotometer (Thermo Fisher Scientific Inc., Waltham, MA, USA) and agarose gel (1.0%) electrophoresis. About 1 µg RNA of each sample was used for cDNA synthesis using a reverse transcription kit (Cat. #KR116-02, TIANGEN Biotech (Beijing) Co., Ltd., Beijing, China). In the differential expression analysis of two candidate genes of TMTC3 and KITLG between chicks of the stripe pattern and the non-stripe pattern by quantitative Real-Time PCR (qRT-PCR) analyses, GAPDH was set as a reference control [28]. Primer sequences were designed using Primer 5.0 (PREMIER Biosoft, San Francisco, CA, USA) and are shown in Table 1. qRT-PCR was performed on Bio-Rad CFX96TM Real-Time System (Bio-Rad Laboratories, Inc., Hercules, CA, USA) with a 20 µL reaction system. Each sample had three biological replicates. The 20 µL of qRT-PCR reaction mixture contained 10 µL of 2 × SuperReal PreMix Plus (SYBR Green) (Cat. #FP205-02, TIANGEN Biotech (Beijing) Co., Ltd., Beijing, China), 0.6 µL of the forward primer (10 pmoL/μL), 0.6 μL of the reverse primer (10 pmoL/µL), 1 µL of cDNA template and 7.8 µL of RNase free water. The thermal cycling process was as follows: 95 °C for 15 min, 40 cycles of amplification (95 °C for 10 s, Tm for 30 s, and 72 °C for 30 s). Relative expression quantification of each gene was calculated by the 2−ΔΔCt method [29]. The variance analysis was performed with SPSS software 21.0 (IBM Corp, Armonk, NY, USA), and the statistical significance level was set at p < 0.05.

3. Results

3.1. Overview of the Whole-Genome Sequencing Data

A summary of the whole-genome sequencing data is shown in Table S1. A total of 1821 G raw bases were obtained. After filtering, 1816 G clean bases were aligned with the genome reference of chicken (GRCg6a), and the Q20 value of each sample was above 95.2%. The alignment rate of the clean data of each sample was above 91.8%. These results showed that the sequencing data were of good quality and could be used for subsequent analyses.

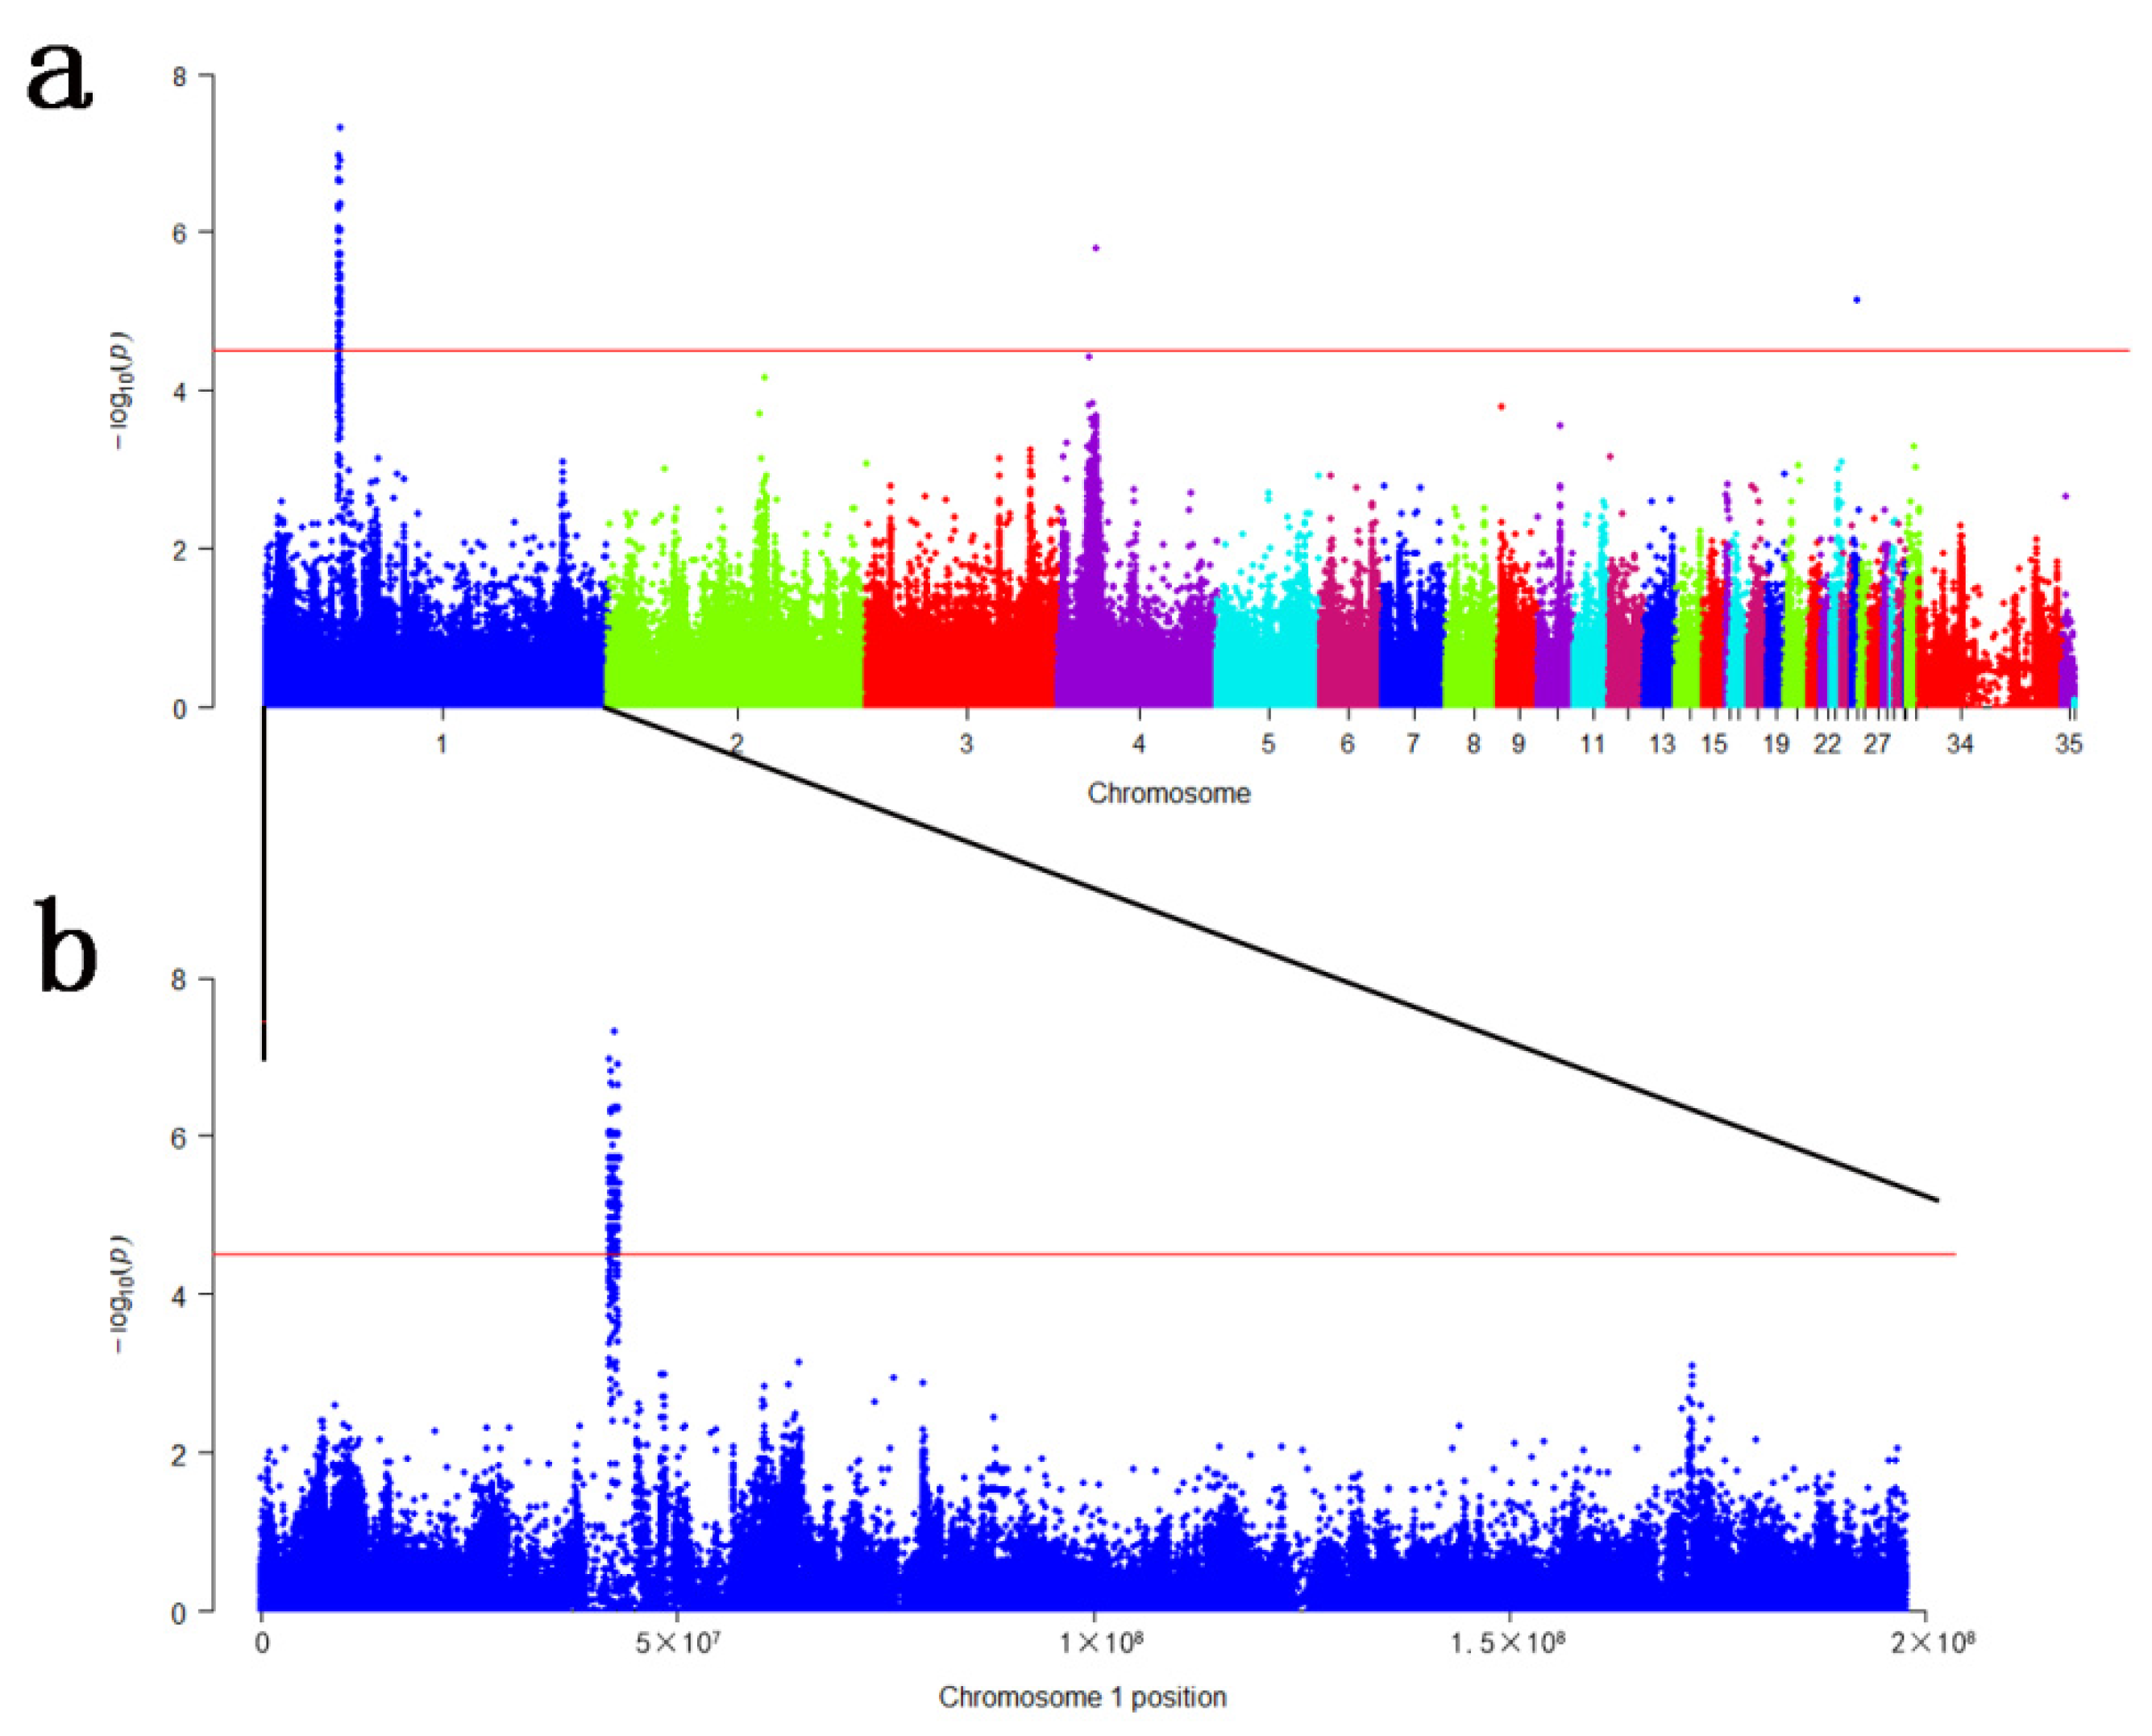
3.2. Genome-Wide Association Studies

A total of 14,696,437 variants, including 11,517,331 SNPs and 3,179,106 INDELs, were identified in the present study (Table S2). After filtration, only 1,186,700 bi-allelic variants throughout the whole genome were used for the GWAS.
GWAS revealed that 857 bi-allelic variants were associated with the RIR stripe pattern significantly (p < 3.07 × 10⁻⁵). The Manhattan plot is shown in Figure 2. A major association signal contains 768 SNPs and 87 INDELs were observed spanning a region about 1.27 Mb from the position of 41.78 Mb to 43.05 Mb on GGA1, corresponding to 16 genes, namely TSPAN19, ENSGALG00000044478, ALX1, ENSGALG00000047575, RASSF9, NTS, MGAT4C, ENSGALG00000045907, ENSGALG00000053372, C12orf50, C12orf29, ENSGALG00000049176, ENSGALG00000051263, ENSGALG00000011177, TMTC3, KITLG (Table 2). Besides, the other two significant SNPs were located on GGA 4 and GGA 25, respectively, corresponding to ENSGALG00000048717, GASK1B, and KCNN3. The descriptive summary of associated variants is shown in Table 2, and detailed information is provided in Table S3.

3.3. Quantitative Real-Time PCR

Based on the results of GWAS and the biological functions of candidate genes, KITLG and TMTC3 were considered as candidate genes for stripe patterns in the RIR chick dorsum. We used qRT-PCR to measure the relative expression of KITLG and TMTC3 in dorsal skin tissue. The results indicated that the expression level of TMTC3 was significantly higher in chicks of the stripe pattern than those of the non-stripe pattern (p = 0.021), and KITLG expression showed a downward trend from stripe pattern to non-stripe pattern chicks (p = 0.062) as shown in Figure 3.

4. Discussions

Although studies in feather color patterns of chickens have revealed some genetic and molecular mechanisms, the genes involved in a dorsal stripe pattern in RIR chicks is still unclear [2,4,30]. In this study, we perform a standard case/control association analysis using 74 RIR female chicks with a stripe or non-stripe pattern to identify candidate genes associated with dorsal stripes. Since the genetic background of the population is generally required to be consistent or similar between the case and control populations to avoid population stratification and reduce false positives [31], the sib-pair design was used in the present study to reduce the difference in genetic background between the case and control populations.
The Manhattan plots of GWAS are shown in Figure 2. As we can see from Figure 2 and Table 2, association signals are mainly in the genomic region ranging from 41.78 to 43.05 Mb (~1.27 Mb) on GGA 1. Although there is one significant SNP associated with stripe pattern on GGA 4 and GGA 25, respectively, there are no other significant signals nearby. Therefore, we mainly focused on the association region on GGA 1, which corresponded to 16 genes, including nine known genes and seven anonymous genes (Table 2).
The biological functions of the nine known genes are listed in Table 3. KITLG is the ligand of receptor tyrosine kinases (KIT), also known as stem cell factor (SCF). It was reported that KIT/KITLG signaling plays an essential role in melanoblasts/melanocytes proliferation, differentiation, migration, colonization, melanin production, gametogenesis, and hematopoiesis [32,33,34,35,36,37]. Some pigmentation disorders in humans are thought to be caused by KITLG mutations, such as Waardenburg syndrome type 2, as well as familial progressive hyper- and hypopigmentation [38,39,40]. Several variants in the upstream sequence of KITLG have been reported to be related to hair and coat color in different animals [41,42,43]. An SNP located in the upstream of KITLG was significantly associated with blond hair color in Iceland and Dutch [41]. In mice, an upstream inversion of the KITLG gene reduces hair pigmentation [42]. In the domestic dog, the copy number variant in the upstream of KITLG is responsible for coat pigment [43]. Furthermore, the genomic analysis suggested that KITLG be associated with the roan pattern in Pakistani goats [44]. In the present study, more than 10 SNPs in or nearby KITLG are significantly associated with the stripe pattern in the chick dorsum (Table S3). Therefore, we suggest that KITLG be one of the important candidate genes for the RIR stripe pattern.
TMTC3 (transmembrane and tetratricopeptide repeat containing 3) was involved in some neuronal cell migration diseases in humans, such as cobblestone lissencephaly [45]. TMTC3 protein bonded to E-cadherin and enhanced cellular adherence, which played roles in cell migration and embryonic development [46]. Melanocytes and melanoblasts are derived from the neural crest; their adhesion to surrounding cells affects their migration to destinations of the dermis layer, epidermis, and hair follicles [56]. Melanoblasts produce eumelanin before melanogenic gene expression in melanocytes at early embryonic development [17,56]. E-cadherin, mainly expressed in the epidermis, plays an important role in the colonization of epidermal melanoblasts/melanocytes [56]. Therefore, we hypothesized that TMTC3 affects the migration of melanoblasts resulting in pigmentation changes by its regulation of E-cadherin adhesion and suggested that TMTC3 be another important candidate gene for chick stripe pattern in this study.
Except for KITLG and TMTC3, the rest of the seven known genes do not appear to be functionally related to chick feather colors (Table 3) [47,48,49,50,51,52,53,54,55]. TSPAN19 was associated with plasma inhibin B levels [47]. ALX1 affected craniofacial development and was also closely related to beak shape in Darwin’s finches [48]. RASSF9 plays a role in regulating tumor proliferation and maintaining epidermal homeostasis [49,50,51]. NTS is a neuropeptide that is involved in the regulation of the central nervous system and digestive system and promotes tumor metastasis, etc. [52]. MGAT4C was identified to be related to animal growth traits [53,54]. C12orf50 and C12orf29 are also located in the significant region of 41.78 to 43.05 Mb (~1.27 Mb) in GGA 1. The biological function of C12orf50 is rarely reported. C12orf29 played a role in skeletal biology, particularly in the extracellular matrix of cartilaginous tissues [55].
qRT-PCR was performed to evaluate the differences in KITLG and TMTC3 expression levels between stripe pattern and non-stripe pattern RIR chicks. In comparison with chicks of non-stripe pattern, stripe pattern chicks showed significantly higher (p < 0.05) expression levels of TMTC3 in dorsal tissues (Figure 3). TMTC3 is important for E-cadherin-mediated cell–cell adhesion and plays a role in cell migration, while E-cadherin affects the colonization of melanoblasts/melanocytes; therefore, we speculate that the difference in TMTC3 expression implies differences in the migration of melanoblasts/melanocytes between chicks of stripe and non-stripe pattern [46]. Compared with darkly pigmented animals of the same breed, light-coated animals possessed lower values in KITLG expression level [57,58]. In the present study, the expression level of KITLG in striped chicks was higher in value than that in non-striped chicks (p = 0.062), which is similar to the previous research results in other species, such as goat, mink, and duck [57,58,59].

5. Conclusions

In this study, a genome-wide association study revealed that the genomic region ranging from 41.78 to 43.05 Mb (~1.27 Mb) on GGA 1 is associated with stripe pattern phenotype in pure-bred RIR chicks. Based on genes’ biological functions and differential expression analyses of mRNA, we considered that KITLG and TMTC3 could be candidate genes for the stripe pattern in the RIR chick dorsum. Our results provided a reference to determine molecular mechanisms underlying feather coloration and stripe formation in chicks.

Supplementary Materials

The following supporting information can be downloaded at: https://www.mdpi.com/article/10.3390/genes13091511/s1, Table S1: A summary of the whole-genome sequencing data; Table S2: The number of variants on each chromosome before and after filtering; Table S3: The significant variants associated with stripe pattern in GWAS.

Author Contributions

Conceptualization, H.B. and C.W.; methodology, H.B. and Q.S.; software, Q.S.; formal analysis, Q.S.; investigation, Q.S.; resources, X.Z. and L.Z.; data curation, J.L.; writing—original draft preparation, Q.S.; writing—review and editing, J.L., H.B. and C.W.; visualization, J.Z. and Q.S.; supervision, H.B.; project administration, H.B. and C.W.; funding acquisition, H.B. and C.W. All authors have read and agreed to the published version of the manuscript.

Funding

This research was supported by National System for Layer Production Technology (CARS-40).

Institutional Review Board Statement

All experimental procedures and animals used were approved by the Ethics Review Committee for Laboratory Animal Welfare and Animal Experiment of China Agricultural University (Approval number: AW71802202-1-3, Approval date: 17 August 2022).

Informed Consent Statement

Not applicable.

Data Availability Statement

The DNA sequencing data for this study can be downloaded from the China National GeneBank (Accession numbers: CNP0003100).

Conflicts of Interest

The authors declare no conflict of interest.

References

  1. Cieslak, M.; Reissmann, M.; Hofreiter, M.; Ludwig, A. Colours of domestication. Biol. Rev. Camb. Philos. Soc. 2011, 86, 885–899. [Google Scholar] [CrossRef] [PubMed]
  2. Inaba, M.; Chuong, C.M. Avian pigment pattern formation: Developmental control of macro- (across the body) and micro- (within a feather) level of pigment patterns. Front. Cell Dev. Biol. 2020, 8, 620. [Google Scholar] [CrossRef] [PubMed]
  3. Roulin, A.; Ducrest, A.L. Genetics of colouration in birds. Semin. Cell Dev. Biol. 2013, 24, 594–608. [Google Scholar] [CrossRef]
  4. Sheppy, A. The colour of domestication and the designer chicken. Opt. Laser Technol. 2011, 43, 295–301. [Google Scholar] [CrossRef]
  5. Roulin, A. The evolution, maintenance and adaptive function of genetic colour polymorphism in birds. Biol. Rev. 2004, 79, 815–848. [Google Scholar] [CrossRef]
  6. Boswell, T.; Takeuchi, S. Recent developments in our understanding of the avian melanocortin system: Its involvement in the regulation of pigmentation and energy homeostasis. Peptides 2005, 26, 1733–1743. [Google Scholar] [CrossRef]
  7. Hoekstra, H.E. Genetics, development and evolution of adaptive pigmentation in vertebrates. Heredity 2006, 97, 222–234. [Google Scholar] [CrossRef] [Green Version]
  8. Zi, J.; Yu, X.D.; Li, Y.Z.; Hu, X.H.; Xu, C.; Wang, X.J.; Liu, X.H.; Fu, R.T. Coloration strategies in peacock feathers. Proc. Natl. Acad. Sci. USA 2003, 100, 12576–12578. [Google Scholar] [CrossRef] [Green Version]
  9. Prum, R.O.; Torres, R.; Williamson, S.; Dyck, J. Two-dimensional Fourier analysis of the spongy medullary keratin of structurally coloured feather barbs. Proc. R. Soc. B Boil. Sci. 1999, 266, 13–22. [Google Scholar] [CrossRef] [Green Version]
  10. Prum, R.O.; Torres, R.H.; Williamson, S.; Dyck, J. Coherent light scattering by blue feather barbs. Nature 1998, 396, 28–29. [Google Scholar] [CrossRef]
  11. Kerje, S.; Lind, J.; Schutz, K.; Jensen, P.; Andersson, L. Melanocortin 1-receptor (MC1R) mutations are associated with plumage colour in chicken. Anim. Genet. 2003, 34, 241–248. [Google Scholar] [CrossRef] [PubMed]
  12. Kerje, S.; Sharma, P.; Gunnarsson, U.; Kim, H.; Bagchi, S.; Fredriksson, R.; Schutz, K.; Jensen, P.; von Heijne, G.; Okimoto, R.; et al. The Dominant white, Dun and Smoky color variants in chicken are associated with insertion/deletion polymorphisms in the PMEL17 gene. Genetics 2004, 168, 1507–1518. [Google Scholar] [CrossRef] [PubMed] [Green Version]
  13. Chang, C.M.; Coville, J.L.; Coquerelle, G.; Gourichon, D.; Oulmouden, A.; Tixier-Boichard, M. Complete association between a retroviral insertion in the tyrosinase gene and the recessive white mutation in chickens. BMC Genom. 2006, 7, 19. [Google Scholar] [CrossRef] [PubMed] [Green Version]
  14. Gunnarsson, U.; Hellstrom, A.R.; Tixier-Boichard, M.; Minvielle, F.; Bed’hom, B.; Ito, S.; Jensen, P.; Rattink, A.; Vereijken, A.; Andersson, L. Mutations in SLC45A2 cause plumage color variation in chicken and Japanese quail. Genetics 2007, 175, 867–877. [Google Scholar] [CrossRef] [Green Version]
  15. Thalmann, D.S.; Ring, H.; Sundstrom, E.; Cao, X.F.; Larsson, M.; Kerje, S.; Hoglund, A.; Fogelholm, J.; Wright, D.; Jemth, P.; et al. The evolution of Sex-linked barring alleles in chickens involves both regulatory and coding changes in CDKN2A. PLoS Genet. 2017, 13, e1006665. [Google Scholar] [CrossRef] [Green Version]
  16. Gunnarsson, U.; Kerje, S.; Bed’hom, B.; Sahlqvist, A.S.; Ekwall, O.; Tixier-Boichard, M.; Kampe, O.; Andersson, L. The dark brown plumage color in chickens is caused by an 8.3-kb deletion upstream of SOX10. Pigment Cell Melanoma Res. 2011, 24, 268–274. [Google Scholar] [CrossRef]
  17. Niwa, T.; Mochii, M.; Nakamura, A.; Shiojiri, N. Plumage pigmentation and expression of its regulatory genes during quail development-histochemical analysis using Bh (black at hatch) mutants. Mech. Dev. 2002, 118, 139–146. [Google Scholar] [CrossRef]
  18. Haupaix, N.; Curantz, C.; Bailleul, R.; Beck, S.; Robic, A.; Manceau, M. The periodic coloration in birds forms through a prepattern of somite origin. Science 2018, 361, eaar4777. [Google Scholar] [CrossRef] [Green Version]
  19. Haupaix, N.; Manceau, M. The embryonic origin of periodic color patterns. Dev. Biol. 2020, 460, 70–76. [Google Scholar] [CrossRef]
  20. Langmead, B.; Salzberg, S.L. Fast gapped-read alignment with Bowtie 2. Nat. Methods 2012, 9, 357–359. [Google Scholar] [CrossRef] [Green Version]
  21. Li, H.; Handsaker, B.; Wysoker, A.; Fennell, T.; Ruan, J.; Homer, N.; Marth, G.; Abecasis, G.; Durbin, R.; 1000 Genome Project Data Processing Subgroup. The sequence alignment/map format and SAMtools. Bioinformatics 2009, 25, 2078–2079. [Google Scholar] [CrossRef] [PubMed] [Green Version]
  22. Danecek, P.; Auton, A.; Abecasis, G.; Albers, C.A.; Banks, E.; DePristo, M.A.; Handsaker, R.E.; Lunter, G.; Marth, G.T.; Sherry, S.T.; et al. The variant call format and VCFtools. Bioinformatics 2011, 27, 2156–2158. [Google Scholar] [CrossRef] [PubMed]
  23. Purcell, S.; Neale, B.; Todd-Brown, K.; Thomas, L.; Ferreira, M.A.R.; Bender, D.; Maller, J.; Sklar, P.; de Bakker, P.I.W.; Daly, M.J.; et al. PLINK: A tool set for whole-genome association and population-based linkage analyses. Am. J. Hum. Genet. 2007, 81, 559–575. [Google Scholar] [CrossRef] [Green Version]
  24. Benjamini, Y.; Hochberg, Y. Controlling the false discovery rate—A practical and powerful approach to multiple testing. J. R. Stat. Soc. B 1995, 57, 289–300. [Google Scholar] [CrossRef]
  25. Turner, S.D. qqman: An R package for visualizing GWAS results using QQ and manhattan plots. bioRxiv 2014. [Google Scholar] [CrossRef]
  26. Cingolani, P.; Platts, A.; Wang, L.L.; Coon, M.; Nguyen, T.; Wang, L.; Land, S.J.; Lu, X.; Ruden, D.M. A program for annotating and predicting the effects of single nucleotide polymorphisms, SnpEff: SNPs in the genome of Drosophila melanogaster strain w1118; iso-2; iso-3. Fly 2012, 6, 80–92. [Google Scholar] [CrossRef] [PubMed] [Green Version]
  27. Chomczynski, P.; Sacchi, N. The single-step method of RNA isolation by acid guanidinium thiocyanate-phenol-chloroform extraction: Twenty-something years on. Nat. Protoc. 2006, 1, 581–585. [Google Scholar] [CrossRef] [PubMed]
  28. Wang, X. Physiological and Genetic Analysis of the Formation of Blue Eggshell Pigments in Chicken; China Agricultural University: Beijing, China, 2008. [Google Scholar]
  29. Livak, K.J.; Schmittgen, T.D. Analysis of relative gene expression data using real-time quantitative PCR and the 2−ΔΔCT method. Methods 2001, 25, 402–408. [Google Scholar] [CrossRef]
  30. Ng, C.S.; Li, W.H. Genetic and molecular basis of feather diversity in birds. Genome Biol. Evol. 2018, 10, 2572–2586. [Google Scholar] [CrossRef]
  31. Marchini, J.; Cardon, L.R.; Phillips, M.S.; Donnelly, P. The effects of human population structure on large genetic association studies. Nat. Genet. 2004, 36, 512–517. [Google Scholar] [CrossRef] [Green Version]
  32. Besmer, P. The kit ligand encoded at the murine Steel locus: A pleiotropic growth and differentiation factor. Curr. Opin. Cell Biol. 1991, 3, 939–946. [Google Scholar] [CrossRef]
  33. Yoshida, H.; Kunisada, T.; Grimm, T.; Nishimura, E.K.; Nishioka, E.; Nishikawa, S.I. Review: Melanocyte migration and survival controlled by SCF/c-kit expression. J. Investig. Dermatol. Symp. Proc. 2001, 6, 1–5. [Google Scholar] [CrossRef] [PubMed] [Green Version]
  34. MacKenzie, M.A.F.; Jordan, S.A.; Budd, P.S.; Jackson, I.J. Activation of the receptor tyrosine kinase kit is required for the proliferation of melanoblasts in the mouse embryo. Dev. Biol. 1997, 192, 99–107. [Google Scholar] [CrossRef] [PubMed] [Green Version]
  35. Wehrle-Haller, B. The role of kit-ligand in melanocyte development and epidermal homeostasis. Pigment Cell Res. 2003, 16, 287–296. [Google Scholar] [CrossRef] [PubMed]
  36. Vandamme, N.; Berx, G. From neural crest cells to melanocytes: Cellular plasticity during development and beyond. Cell. Mol. Life Sci. 2019, 76, 1919–1934. [Google Scholar] [CrossRef]
  37. Kunisada, T.; Yoshida, H.; Yamazaki, H.; Miyamoto, A.; Hemmi, H.; Nishimura, E.; Shultz, L.D.; Nishikawa, S.I.; Hayashi, S.I. Transgene expression of steel factor in the basal layer of epidermis promotes survival, proliferation, differentiation and migration of melanocyte precursors. Development 1998, 125, 2915–2923. [Google Scholar] [CrossRef]
  38. Ogawa, Y.; Kono, M.; Akiyama, M. Pigmented macules in Waardenburg syndrome type 2 due to KITLG mutation. Pigment Cell Melanoma Res. 2017, 30, 501–504. [Google Scholar] [CrossRef]
  39. Amyere, M.; Vogt, T.; Hoo, J.; Brandrup, F.; Bygum, A.; Boon, L.; Vikkula, M. KITLG mutations cause familial progressive hyper- and hypopigmentation. J. Investig. Dermatol. 2011, 131, 1234–1239. [Google Scholar] [CrossRef]
  40. Cuell, A.; Bansal, N.; Cole, T.; Kaur, M.R.; Lee, J.; Loffeld, A.; Moss, C.; O’Donnell, M.; Takeichi, T.; Thind, C.K.; et al. Familial progressive hyper- and hypopigmentation and malignancy in two families with new mutations in KITLG. Clin. Exp. Dermatol. 2015, 40, 860–864. [Google Scholar] [CrossRef]
  41. Sulem, P.; Gudbjartsson, D.F.; Stacey, S.N.; Helgason, A.; Rafnar, T.; Magnusson, K.P.; Manolescu, A.; Karason, A.; Palsson, A.; Thorleifsson, G.; et al. Genetic determinants of hair, eye and skin pigmentation in Europeans. Nat. Genet. 2007, 39, 1443–1452. [Google Scholar] [CrossRef]
  42. Guenther, C.A.; Tasic, B.; Luo, L.Q.; Bedell, M.A.; Kingsley, D.M. A molecular basis for classic blond hair color in Europeans. Nat. Genet. 2014, 46, 748–752. [Google Scholar] [CrossRef] [PubMed] [Green Version]
  43. Weich, K.; Affolter, V.; York, D.; Rebhun, R.; Grahn, R.; Kallenberg, A.; Bannasch, D. Pigment intensity in dogs is associated with a copy number variant upstream of KITLG. Genes 2020, 11, 75. [Google Scholar] [CrossRef] [PubMed] [Green Version]
  44. Talenti, A.; Bertolini, F.; Williams, J.; Moaeen-ud-Din, M.; Frattini, S.; Coizet, B.; Pagnacco, G.; Reecy, J.; Rothschild, M.F.; Crepaldi, P.; et al. Genomic analysis suggests KITLG is responsible for a roan pattern in two Pakistani goat breeds. J. Hered. 2018, 109, 315–319. [Google Scholar] [CrossRef] [PubMed]
  45. Jerber, J.; Zaki, M.S.; Al-Aama, J.Y.; Rosti, R.O.; Ben-Omran, T.; Dikoglu, E.; Silhavy, J.L.; Caglar, C.; Musaev, D.; Albrecht, B.; et al. Biallelic mutations in TMTC3, encoding a transmembrane and TPR-Containing protein, lead to cobblestone lissencephaly. Am. J. Hum. Genet. 2016, 99, 1181–1189. [Google Scholar] [CrossRef] [PubMed] [Green Version]
  46. Graham, J.B.; Sunryd, J.C.; Mathavan, K.; Weir, E.; Larsen, I.S.B.; Halim, A.; Clausen, H.; Cousin, H.; Alfandari, D.; Hebert, D.N. Endoplasmic reticulum transmembrane protein TMTC3 contributes to O-mannosylation of E-cadherin, cellular adherence, and embryonic gastrulation. Mol. Biol. Cell 2020, 31, 167–183. [Google Scholar] [CrossRef] [PubMed]
  47. Sato, Y.; Tajima, A.; Kiguchi, M.; Kogusuri, S.; Fujii, A.; Sato, T.; Nozawa, S.; Yoshiike, M.; Mieno, M.; Kojo, K.; et al. Genome-wide association study of semen volume, sperm concentration, testis size, and plasma inhibin B levels. J. Hum. Genet. 2020, 65, 683–691. [Google Scholar] [CrossRef] [PubMed]
  48. Lamichhaney, S.; Berglund, J.; Almen, M.S.; Maqbool, K.; Grabherr, M.; Martinez-Barrio, A.; Promerova, M.; Rubin, C.J.; Wang, C.; Zamani, N.; et al. Evolution of Darwin’s finches and their beaks revealed by genome sequencing. Nature 2015, 518, 371–375. [Google Scholar] [CrossRef]
  49. Yuan, J.; Ju, Q.Q.; Zhu, J.; Jiang, Y.; Yang, X.C.; Liu, X.Y.; Ma, J.Y.; Sun, C.; Shi, J.H. RASSF9 promotes NSCLC cell proliferation by activating the MEK/ERK axis. Cell Death Discov. 2021, 7, 199. [Google Scholar] [CrossRef]
  50. Shi, H.; Ju, Q.Q.; Mao, Y.T.; Wang, Y.J.; Ding, J.; Liu, X.Y.; Tang, X.; Sun, C. TAK1 phosphorylates RASSF9 and inhibits esophageal squamous tumor cell proliferation by targeting the RAS/MEK/ERK axis. Adv. Sci. 2021, 8, 2001575. [Google Scholar] [CrossRef]
  51. Lee, C.M.; Yang, P.L.; Chen, L.C.; Chen, C.C.; Wu, S.C.; Cheng, H.Y.; Chang, Y.S. A novel role of RASSF9 in maintaining epidermal homeostasis. PLoS ONE 2011, 6, e17867. [Google Scholar] [CrossRef] [Green Version]
  52. Ye, Y.; Long, X.; Zhang, L.; Chen, J.; Liu, P.; Li, H.; Wei, F.; Yu, W.; Ren, X.; Yu, J.J.O. NTS/NTR1 co-expression enhances epithelial-to-mesenchymal transition and promotes tumor metastasis by activating the Wnt/β-catenin signaling pathway in hepatocellular carcinoma. Oncotarget 2016, 7, 70303–70322. [Google Scholar] [CrossRef] [PubMed] [Green Version]
  53. D’Alessandro, E.; Sottile, G.; Sardina, M.T.; Criscione, A.; Bordonaro, S.; Sutera, A.M.; Zumbo, A.; Portolano, B.; Mastrangelo, S. Genome-wide analyses reveal the regions involved in the phenotypic diversity in Sicilian pigs. Anim. Genet. 2020, 51, 101–105. [Google Scholar] [CrossRef] [PubMed]
  54. Neto, F.R.D.; Santos, D.J.D.; Fernandes, G.A.; Aspilcueta-Borquis, R.R.; do Nascimento, A.V.; Seno, L.D.; Tonhati, H.; de Oliveira, H.N. Genome-wide association studies for growth traits in buffaloes using the single step genomic BLUP. J. Appl. Genet. 2020, 61, 113–115. [Google Scholar] [CrossRef] [PubMed]
  55. Friis, T.E.; Stephenson, S.; Xiao, Y.; Whitehead, J.; Hutmacher, D.W. A polymerase chain reaction-based method for isolating clones from a complimentary DNA library in sheep. Tissue Eng. Part C Methods 2014, 20, 780–789. [Google Scholar] [CrossRef] [PubMed] [Green Version]
  56. Nishimura, E.K.; Yoshida, H.; Kunisada, T.; Nishikawa, S.I. Regulation of E- and P-cadherin expression correlated with melanocyte migration and diversification. Dev. Biol. 1999, 215, 155–166. [Google Scholar] [CrossRef] [Green Version]
  57. Wu, S.F.; Li, J.Y.; Ma, T.; Li, J.P.; Li, Y.M.; Jiang, H.Z.; Zhang, Q.L. MiR-27a regulates WNT3A and KITLG expression in Cashmere goats with different coat colors. Anim. Biotechnol. 2021, 32, 205–212. [Google Scholar] [CrossRef]
  58. Song, X.C.; Xu, C.; Liu, Z.Y.; Yue, Z.G.; Liu, L.L.; Yang, T.G.; Cong, B.; Yang, F.H. Comparative transcriptome analysis of mink (Neovison vison) skin reveals the key genes involved in the melanogenesis of black and white coat colour. Sci. Rep. 2017, 7, 12461. [Google Scholar] [CrossRef] [Green Version]
  59. Lin, R.; Li, J.; Zhao, F.; Zhou, M.; Wang, J.; Xiao, T. Transcriptome analysis of genes potentially associated with white and black plumage formation in Chinese indigenous ducks (Anas platyrhynchos). Br. Poult. Sci. 2022, 18, 1–9. [Google Scholar] [CrossRef]
Figure 1. Stripe pattern and non-stripe pattern female RIR chickens of different ages. (a) 1-day-old; (b) 13-day-old; (c) 28-day-old; (d) 46-day-old. In each picture, the stripe pattern and non-stripe pattern are left and right, respectively. As the chick grows, the downy feathers are gradually replaced with youth feathers and the stripe pattern disappears.
Genes 13 01511 g001
Figure 2. Manhattan plots of GWAS for RIR stripe pattern. (a) Manhattan plot of all association bi-allelic variants (SNPs and INDELs) with the RIR stripe pattern; (b) Manhattan plot of GGA1 association bi-allelic variants (SNPs and INDELs) with the RIR stripe pattern. Manhattan plots indicate -log10(p) for variants (y-axis) against their positions on each chromosome (x-axis). Chromosomes 34 and 35 indicate Chromosome Z and W, respectively. The solid red line represents the genome-wide significant threshold (p = 3.07 × 10⁻⁵).
Genes 13 01511 g002
Figure 3. Relative expression of candidate genes in dorsal skin tissue of 1-day-old stripe and non-stripe pattern female RIR chicks. (a) The dorsal skin tissue collection location (red arrows) of the 1-day-old stripe pattern (left) and non-stripe pattern (right) RIR chicks; (b) Skin tissue collected from the stripe pattern (left) and non-stripe pattern (right); (c) Relative expression of KITLG and TMTC3. * represents p < 0.05.
Genes 13 01511 g003
Table 1. Primers used in qRT-PCR.
GenePrimersSequence (5′–3′)Size (bp)Tm (°C)
TMTC3TMTC3-FTTTGATTGTCTTCAGTCTCCG13254
TMTC3-RCGTTCTGCTACCACAAATCCA
KITLGKITLG-FAAGAGGCACTTGGCTTCATTAG13859
KITLG-RTTTCTGGTCTGGACTTAGGATG
GAPDHGAPDH-FATACACAGAGGACCAGGTTG13059
GAPDH-RAAACTCATTGTCATACCAGG
Table 2. A descriptive summary of significant variants associated with the RIR stripe pattern in GWAS.
Chr.Position (bp)N_Sig aLead Variant bp cGenomic LocationCorresponding Genes
1417852641417852647.83 × 10−6exonTSPAN19
141799389–4188994458418474229.24 × 10−7intron; exon; downstreamENSGALG00000044478
1418924281418924283.89 × 10−6IntergenicENSGALG00000044478-ALX1
141893987–4192173818419165561.06 × 10−7upstream; intron; exon; downstreamALX1
141902222–419112987419029733.89 × 10−6upstream; downstreamENSGALG00000047575
141924948–42155127180420626781.57 × 10−7intergenicALX1-RASSF9
142156048–4219043719421560481.91 × 10−6upstream; exon; intron; downstreamRASSF9
142198934–42201800342198934; 422001903.89 × 10−6intergenicRASSF9-NTS
142204316–4222509613422074409.81 × 10−7upstream; intron; downstreamNTS
142226797–422417745422324093.89 × 10−6intergenicNTS-MGAT4C
142247263–4236227911642305962; 423184782.25 × 10−7upstream; intron; downstreamMGAT4C
142363559–423807541142363559; 423721671.91 × 10−6intergenicMGAT4C-ENSGALG00000045907
142387035–423922604423870351.91 × 10−6upstream; downstreamENSGALG00000045907
142395470–424024243424024241.91 × 10−6intergenicENSGALG00000045907-ENSGALG00000053372
142417397–4248344914424668574.83 × 10−8exon; intron; upstreamENSGALG00000053372
142484399–42808126237424843991.56 × 10−5intergenicENSGALG00000053372-C12orf50
142808720–4282740622428166061.91 × 10−6upstream; intron; exon; downstreamC12orf50
142828049–4283655213428351854.67 × 10−7upstream; intron; exonC12orf29
142837178–4285427717428392074.73 × 10−7upstream; intron; exonENSGALG00000049176
1428579471428579472.14 × 10−5intergenicENSGALG00000049176-ENSGALG00000051263
142861965–4287243210428619659.24 × 10−7upstream; intron; downstreamENSGALG00000051263
142872979–4288328014428778869.24 × 10−7exon; intronENSGALG00000011177
142884076–429502587442905449; 429262889.24 × 10−7upstream; intron; exon; downstreamTMTC3
142953794–4297720812429738951.91 × 10−6intergenicTMTC3-KITLG
143028225–430475482430475483.89 × 10−6intronKITLG
4216980481216980481.60 × 10−6intergenicENSGALG00000048717-GASK1B
253002653130026537.25 × 10−6upstreamKCNN3
a The number of significant variants with p < 3.07 × 10⁻⁵, b The SNP with the smallest p at the position, c The p of lead variant.
Table 3. Known genes associated with a stripe pattern of RIR chicks in GWAS.
Association GenesPosition (bp)Full NameBiological Functions
KITLGGGA1 43015486–43066975KIT ligandMelanoblasts/melanocytes proliferation, differentiation, migration, colonization, melanin production, gametogenesis, and hematopoiesis [32,33,34,35,36,37].
TMTC3GGA1 42888363–42945679Transmembrane and tetratricopeptide repeat containing 3Cellular adherence, cell migration, and embryogenesis [45,46].
TSPAN19GGA1 41773256–41785441Tetraspanin 19Plasma inhibin B levels [47].
ALX1GGA1 41898277–41919541ALX homeobox 1Effect craniofacial development and related to beak shape in Darwin’s finches [48].
RASSF9GGA1 42160804–42190042Ras association domain family member 9Regulating tumor proliferation and maintainepidermal homeostasis [49,50,51].
NTSGGA1 42207171–42220099NeurotensinRegulatory of the central nervous system and digestive system, and promoting tumor metastasis, etc. [52].
MGAT4CGGA1 42251047–42358204MGAT4 family member CRelated to animal growth traits [53,54].
C12orf50GGA1 42813465–42822840C12orf50 homologUnclear
C12orf29GGA1 42829927–42836694C12orf29 homologSkeletal biology [55].
Publisher’s Note: MDPI stays neutral with regard to jurisdictional claims in published maps and institutional affiliations.

