Article

Endometrial Cancer-Adjacent Tissues Express Higher Levels of Cancer-Promoting Genes than the Matched Tumors

by
Mariusz Kulinczak
1,†,
Maria Sromek
1,†,
Grzegorz Panek
2,
Klara Zakrzewska
3,
Renata Lotocka
4,
Lukasz Michal Szafron
1,
Magdalena Chechlinska
1 and
Jan Konrad Siwicki
1,*
1
Department of Cancer Biology, Maria Sklodowska-Curie National Research Institute of Oncology, 02-781 Warsaw, Poland
2
Department of Gynecologic Oncology and Obstetrics, Centre of Postgraduate Medical Education, 00-416 Warsaw, Poland
3
Department of Pathology, Maria Sklodowska-Curie National Research Institute of Oncology, 02-781 Warsaw, Poland
4
Cancer Molecular and Genetic Diagnostics Laboratory, Maria Sklodowska-Curie National Research Institute of Oncology, 02-781 Warsaw, Poland
*
Author to whom correspondence should be addressed.
These authors contributed equally to this work.
Genes 2022, 13(9), 1611; https://doi.org/10.3390/genes13091611
Submission received: 14 July 2022 / Revised: 2 September 2022 / Accepted: 6 September 2022 / Published: 8 September 2022
(This article belongs to the Section Genetic Diagnosis)

Abstract

:
Molecular alterations in tumor-adjacent tissues have recently been recognized in some types of cancer. This phenomenon has not been studied in endometrial cancer. We aimed to analyze the expression of genes associated with cancer progression and metabolism in primary endometrial cancer samples and the matched tumor-adjacent tissues and in the samples of endometria from cancer-free patients with uterine leiomyomas. Paired samples of tumor-adjacent tissues and primary tumors from 49 patients with endometrial cancer (EC), samples of endometrium from 25 patients with leiomyomas of the uterus, and 4 endometrial cancer cell lines were examined by the RT-qPCR, for MYC, NR5A2, CXCR2, HMGA2, LIN28A, OCT4A, OCT4B, OCT4B1, TWIST1, STK11, SNAI1, and miR-205-5p expression. The expression levels of MYC, NR5A2, SNAI1, TWIST1, and STK11 were significantly higher in tumor-adjacent tissues than in the matched EC samples, and this difference was not influenced by the content of cancer cells in cancer-adjacent tissues. The expression of MYC, NR5A2, and SNAI1 was also higher in EC-adjacent tissues than in samples from cancer-free patients. In addition, the expression of MYC and CXCR2 in the tumor related to non-endometrioid adenocarcinoma and reduced the risk of recurrence, respectively, and higher NR5A2 expression in tumor-adjacent tissue increased the risk of death. In conclusion, tissues proximal to EC present higher levels of some cancer-promoting genes than the matched tumors. Malignant tumor-adjacent tissues carry a diagnostic potential and emerge as new promising target of anticancer therapy.

Graphical Abstract

1. Introduction

Tissues adjacent to a primary malignant tumor (TA) have been shown to present substantial molecular alterations, such as loss of heterozygosity, aneuploidy, mutations, transcriptomic and epigenetic alterations, protein expression changes, and metabolic disturbances [1,2,3]. Moreover, unique profiles of mRNA and miRNA transcriptomes have been identified in tumor-surrounding tissues in a number of cancer types, including prostate [4], colon [5], and breast carcinomas [6].
As shown in breast and lung cancers, molecular changes in TA may relate to cancer subtype [7,8]. Molecular signatures of the extratumoral microenvironment predicted clinical outcome, e.g., in head and neck, breast, and hepatocellular cancers [9,10,11]. Noteworthy, transcriptional profiles of TA samples were more informative on patient survival than the profiles of the paired tumor samples [12,13]. Hence, tumor-surrounding tissues emerge as an interesting research subject, not only in terms of basic pathogenic mechanisms but also as an important player of tumor progression, carrying a clinical potential. In endometrial cancer (EC), data on molecular changes in tissues neighboring primary tumor are scarce.
We aimed to molecularly characterize tumor-adjacent tissues in patients with EC. Therefore, we analyzed the expression of genes associated with cancer progression and metabolism, TWIST1, SNAI1, NR5A2, MYC, CXCR2, STK11, POU5F1 (OCT4, isoforms A, B, and B1), HMGA2, as well as miR-205-5p, in the matched samples of tumor-adjacent tissues and tumors from patients with endometrial cancer, and in the samples of endometrium from patients with uterine leiomyoma.
A large body of evidence indicates multiple oncogenic roles of MYC in carcinogenesis, including the pathogenesis of endometrial cancer [14,15,16].
The orphan nuclear receptor, NR5A2, has been implicated in a variety of biological processes, including cholesterol metabolism, steroidogenesis, embryogenesis, inflammation, and stem cell pluripotency [17]. NR5A2 overexpression and its oncogenic role has been implicated in multiple cancers [18]. NR5A2 is expressed in endometrial cancer cell lines [19], but its role in EC pathogenesis has not been revealed.
Overexpression of SNAI1 and TWIST1, encoding key regulators of epithelial-to-mesenchymal transition (EMT), significantly contributes to cancer development [20] and has been directly related to chemoresistance [21] and poor prognosis in several cancer types [22]. Previous studies on SNAI1 and/or TWIST1 in EC mostly relied on their immunohistochemical evaluation in tumor cells in the context of clinical variables, and increased SNAI1 and TWIST1 expression has been linked to EC progression or poor prognosis [23,24,25,26].
STK11 (also known as LKB1) has been identified as a tumor suppressor in multiple cancers [27], but in EC, clinical samples have not been evaluated in this respect.
Aberrant expression/signaling of CXCR2 and of its multiple ligands, including several CXC chemokines GRO-α, plays crucial role in carcinogenesis by promoting cancer cell proliferation, migration, and invasion, as well as angiogenesis and by contributing to chemo- and radioresistance in many cancers [28,29,30,31,32,33,34,35]. Increased CXCR2 expression has been linked to poor prognosis in various cancers [36,37,38,39].
A transcription factor, OCT4A (POU5F1), an important regulator of pluripotency and stemness, has three known transcript variants, OCT4A, OCT4B, and OCT4B1, as well as various pseudogenes [40]. OCT4A expression has been reported in cancer stem cells, implicated in chemotherapy resistance, and linked to clinical outcomes in cancer patients [41,42,43,44].
LIN28 (encoding two paralogs: LIN28A and LIN28B) plays a crucial role in the maintenance of pluripotency state and in the regulation of cell cycle, proliferation, tissue repair, microRNA biogenesis, and metabolism [45]. It has been demonstrated that an increased LIN28 expression contributes to cancer development and progression, resistance to various anti-cancer therapies, and poor prognosis in numerous cancers [46].
A number of studies have shown elevated expression of miR-205-5p and HMGA2 in EC [47,48,49,50,51,52]. Therefore, we also analyzed miR-205-5p and HMGA2 expression levels to provide an additional validation of our measurements.

2. Materials and methods

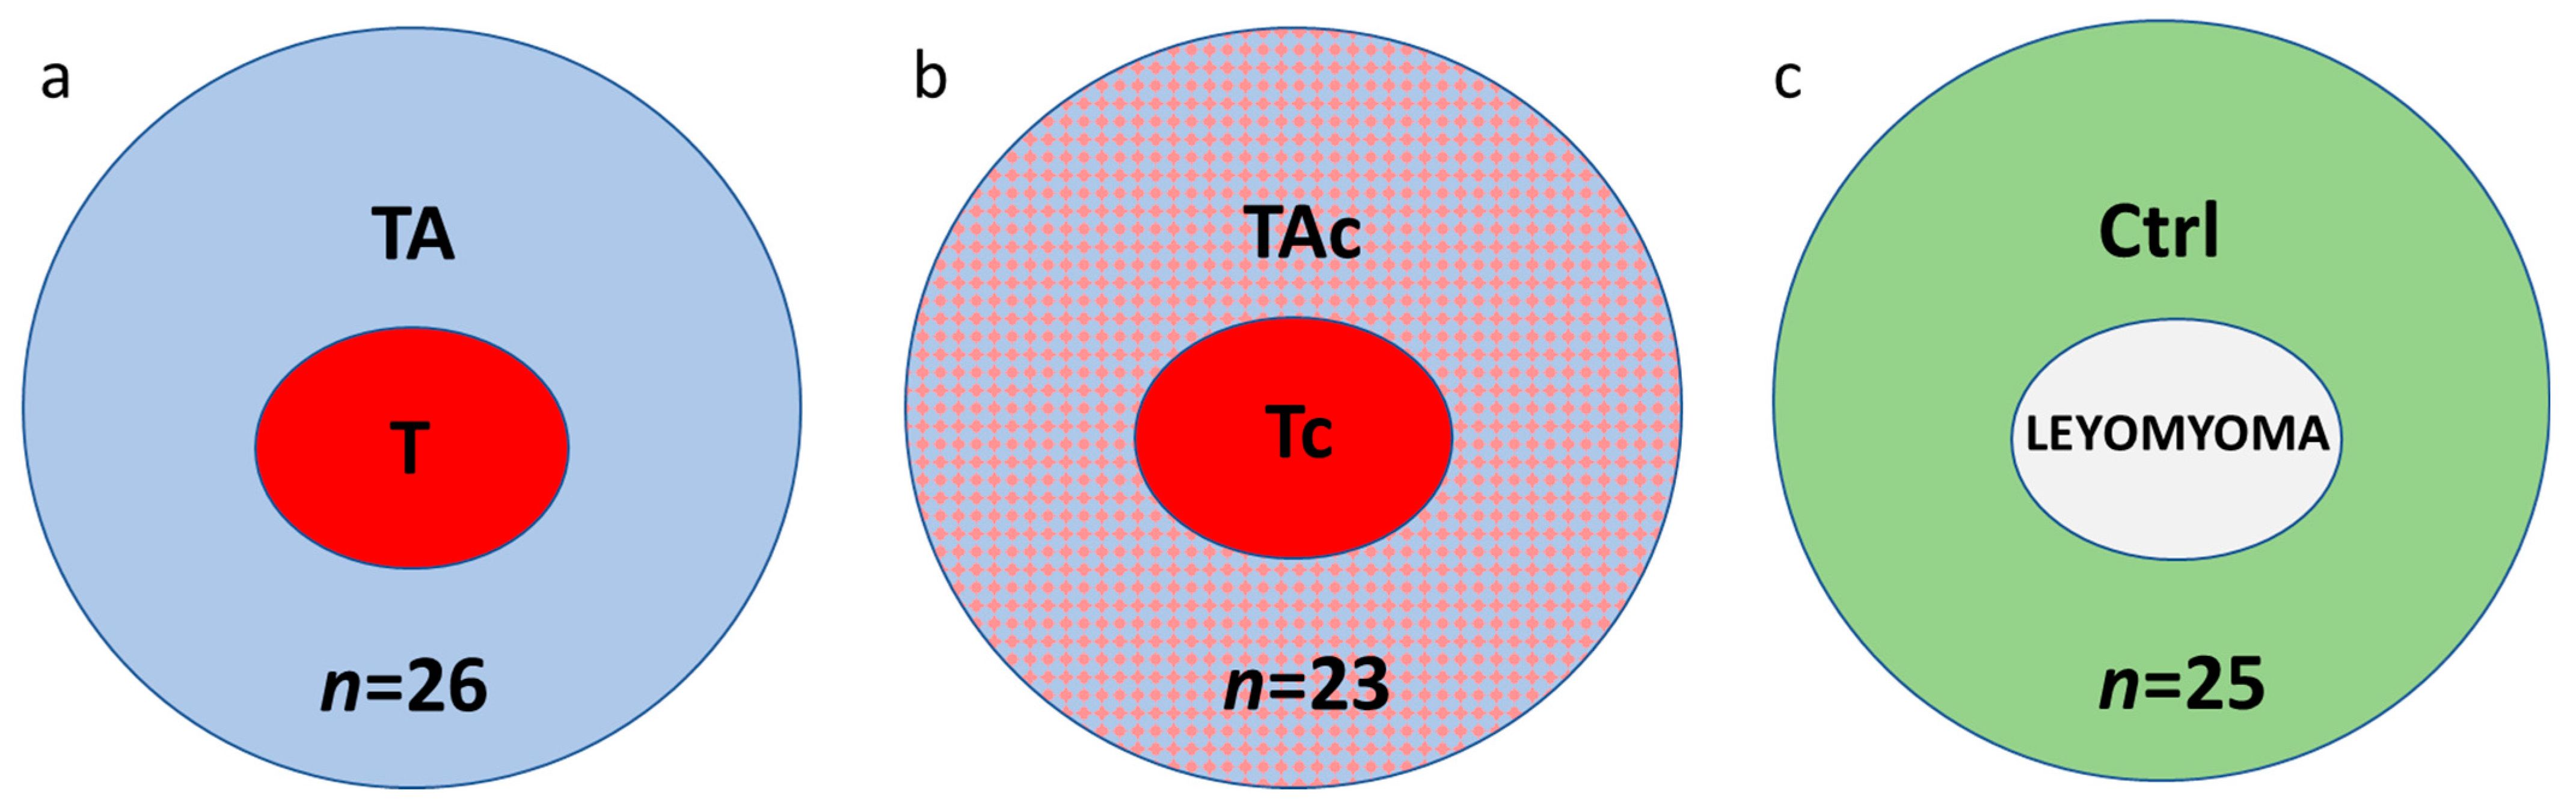
2.1. Patients and Samples

Paired samples of tumors and tumor-adjacent tissues were collected from 49 patients with histologically verified EC. Thirty-seven patients were diagnosed with endometrioid adenocarcinoma and 12 with other histological types (Table 1). In these series of paired samples, at histopathological examination of tumor adjacent tissues, 26 were found to be cancer-free (tumor–T and tumor-adjacent tissue–TA, respectively) (Figure 1a), while 23 contained cancer cells (tumor–Tc and tumor-adjacent tissue–TAc, respectively) (Figure 1b).
Twenty-five endometrial samples from cancer-free patients with leiomyomas (Control, Ctrl) were also collected (Figure 1c).
All samples of tumor-adjacent tissues were collected at least 1 cm from the tumor margins and snap-frozen. The patomorphological characteristics of the samples included the possible content of cancer cells and/or myometrium in the tumor-adjacent tissues from patients with EC.
Endometrial cancer cell lines AN-3-CA, MFE 280, and MFE 296 were obtained in 2011 from Deutsche Sammlung von Mikroorganismen und Zellkulturen (DSMZ, Braunschweig, Germany) and cell line HEC-1-A from American Type Culture Collection (ATCC, Manassas, VA, USA). Reauthentication of the cell lines was not necessary since these cell lines distributed by the repositories are subject to detailed characterization:
2/ATCC: https://www.atcc.org/about-us/quality-commitment (last accessed 12 August 2022)
In addition, these cell lines were not passaged in our laboratory for more than six months after receipt before use in our study.

2.2. RNA Isolation, Reverse Transcription and Quantitative PCR

Total RNA was extracted using GeneMATRIX Universal RNA/miRNA RNA Purification Kit (EURx, Gdansk, Poland), following the manufacturer’s instructions. RNA integrity numbers (RINs) were checked with the use of 2100 Bioanalyzer (Agilent Technologies). RIN value of most samples exceeded 7 (Table S2). No differences in RNA quality were observed depending on sample source, i.e., T vs. TA and Tc vs. TAc.
The expression of mRNA transcripts and miR-205-5p was measured by the RT-qPCR method using 7900HT Fast Real-Time PCR System (Applied Biosystems, Carlsbad, CA 92008 USA) and 7500 Fast thermal cycler (Applied Biosystems Carlsbad, CA 92008 USA), respectively. The instruments and reagents were purchased from Applied Biosystems (Carlsbad, CA 92008 USA). TaqMan probe sets were used for TWIST1 (Hs00361186_m1), SNAI1 (Hs00195597_m1), NR5A2 (Hs00187067_m1), MYC (Hs00905030_m1), CXCR2 (Hs01011557_m1), STK11 (Hs00975986_m1), HMGA2 (Hs00171569_m1), and miR-205-5p (ID No. 000509) expression assessment. The other specific primers and TaqMan probe sets were designed using PrimerExpress software (Applied Biosystems, Carlsbad, CA 92008 USA) as follows: LIN28A, Forward 5′-TTCGGCTTCCTGTCCATGAC-3′, Reverse 5′-CCACTGCCTCACCCTCCTT-3′, Probe 6-FAM-5′-TTTGTGCACCAGAGTAA-3′-MGB; POU5F1 (OCT4) isoforms, (a) POU5F1 isoform A (OCT4A) Forward 5′-GGAGACCTCTCAGCCTGAGG-3′, Reverse 5′-TTGATGTCCTGGGACTCCTC-3′, Probe 6-FAM-5′-CAGGGGTGACGGTG-3′-MGB, (b) POU5F1 isoform B (OCT4B) Forward 5′-AGACTATTCCTTGGGGCCAC-3′, Reverse 5′-GGCTGAATACCTTCCCAAATA-3′, Probe 6-FAM-5′-TGCCAAGCTCCTGAAGCA-3′-MGB, c) POU5F1 isoform B1 (OCT4B1) Forward 5′-GTGCTCCCTCACTTTGCTTCTC-3′, Reverse 5′-TTTCTGCTTTGCATATCTCCTGAA-3′, Probe 6-FAM-5′-CAGGGAAGGTATTCAGCCA-3′-MGB. Based on the NormFinder_0953 algorithm results (Table S1), out of eight candidate genes, PPIA (Hs99999904_m1) and RPLP0 (Hs99999902_m1) were selected as references for gene expression, while for miR-205-5p expression assessment RNU44 (ID No. 001094) and RNU48 (ID No. 001006) were used. The number of amplification cycles (CT value) for reference genes were similar between different series of samples.

2.3. Statistical Analysis

The relative expression levels were calculated using the ΔCt method. In statistical analyses, the Wilcoxon signed rank test was used for paired samples, and the Mann–Whitney rank sum test was used to compare groups of samples.
Statistical analyzes considering relationships between gene expression with clinico-pathological characteristics, i.e., stage, grade, histological type, relapse time, and 5-year survival, were carried out in the R environment (version: 3.6.1). The survival analysis was performed using the multivariate Cox proportional hazards models (the survival package for R, version: 3.2-11). All Cox models were also checked with respect to proportionality of hazards for each variable used. The prediction of treatment response in the experimental group of patients was analyzed by generating multivariate logistic regression models (R packages: stats (version: 3.6.1) and rms (version: 6.2-0)). In order to verify the discriminating capabilities of the Cox and logistic regression models, we performed their cross-validation in new data sets, generated from the original data by bootstrapping (with replacement) and subsequent comparison of areas under curves (AUCs) between the original and bootstrapped data sets, using the riskRegression package for R (version: 2020.12.8). All the analyses were performed not only in the entire group of tumors, but also in the subgroups with and without tumor cells in the tumor-adjacent tissue, and were adjusted for the clinical stage, histological grade, and type of tumor. Noteworthy, for all the analyzed genes, the expression was treated as a continuous variable to avoid arbitrary categorization of data, which could potentially lead to unreliable statistical results.
All p-values were considered significant at the statistical significance level (α) of 0.05.

3. Results

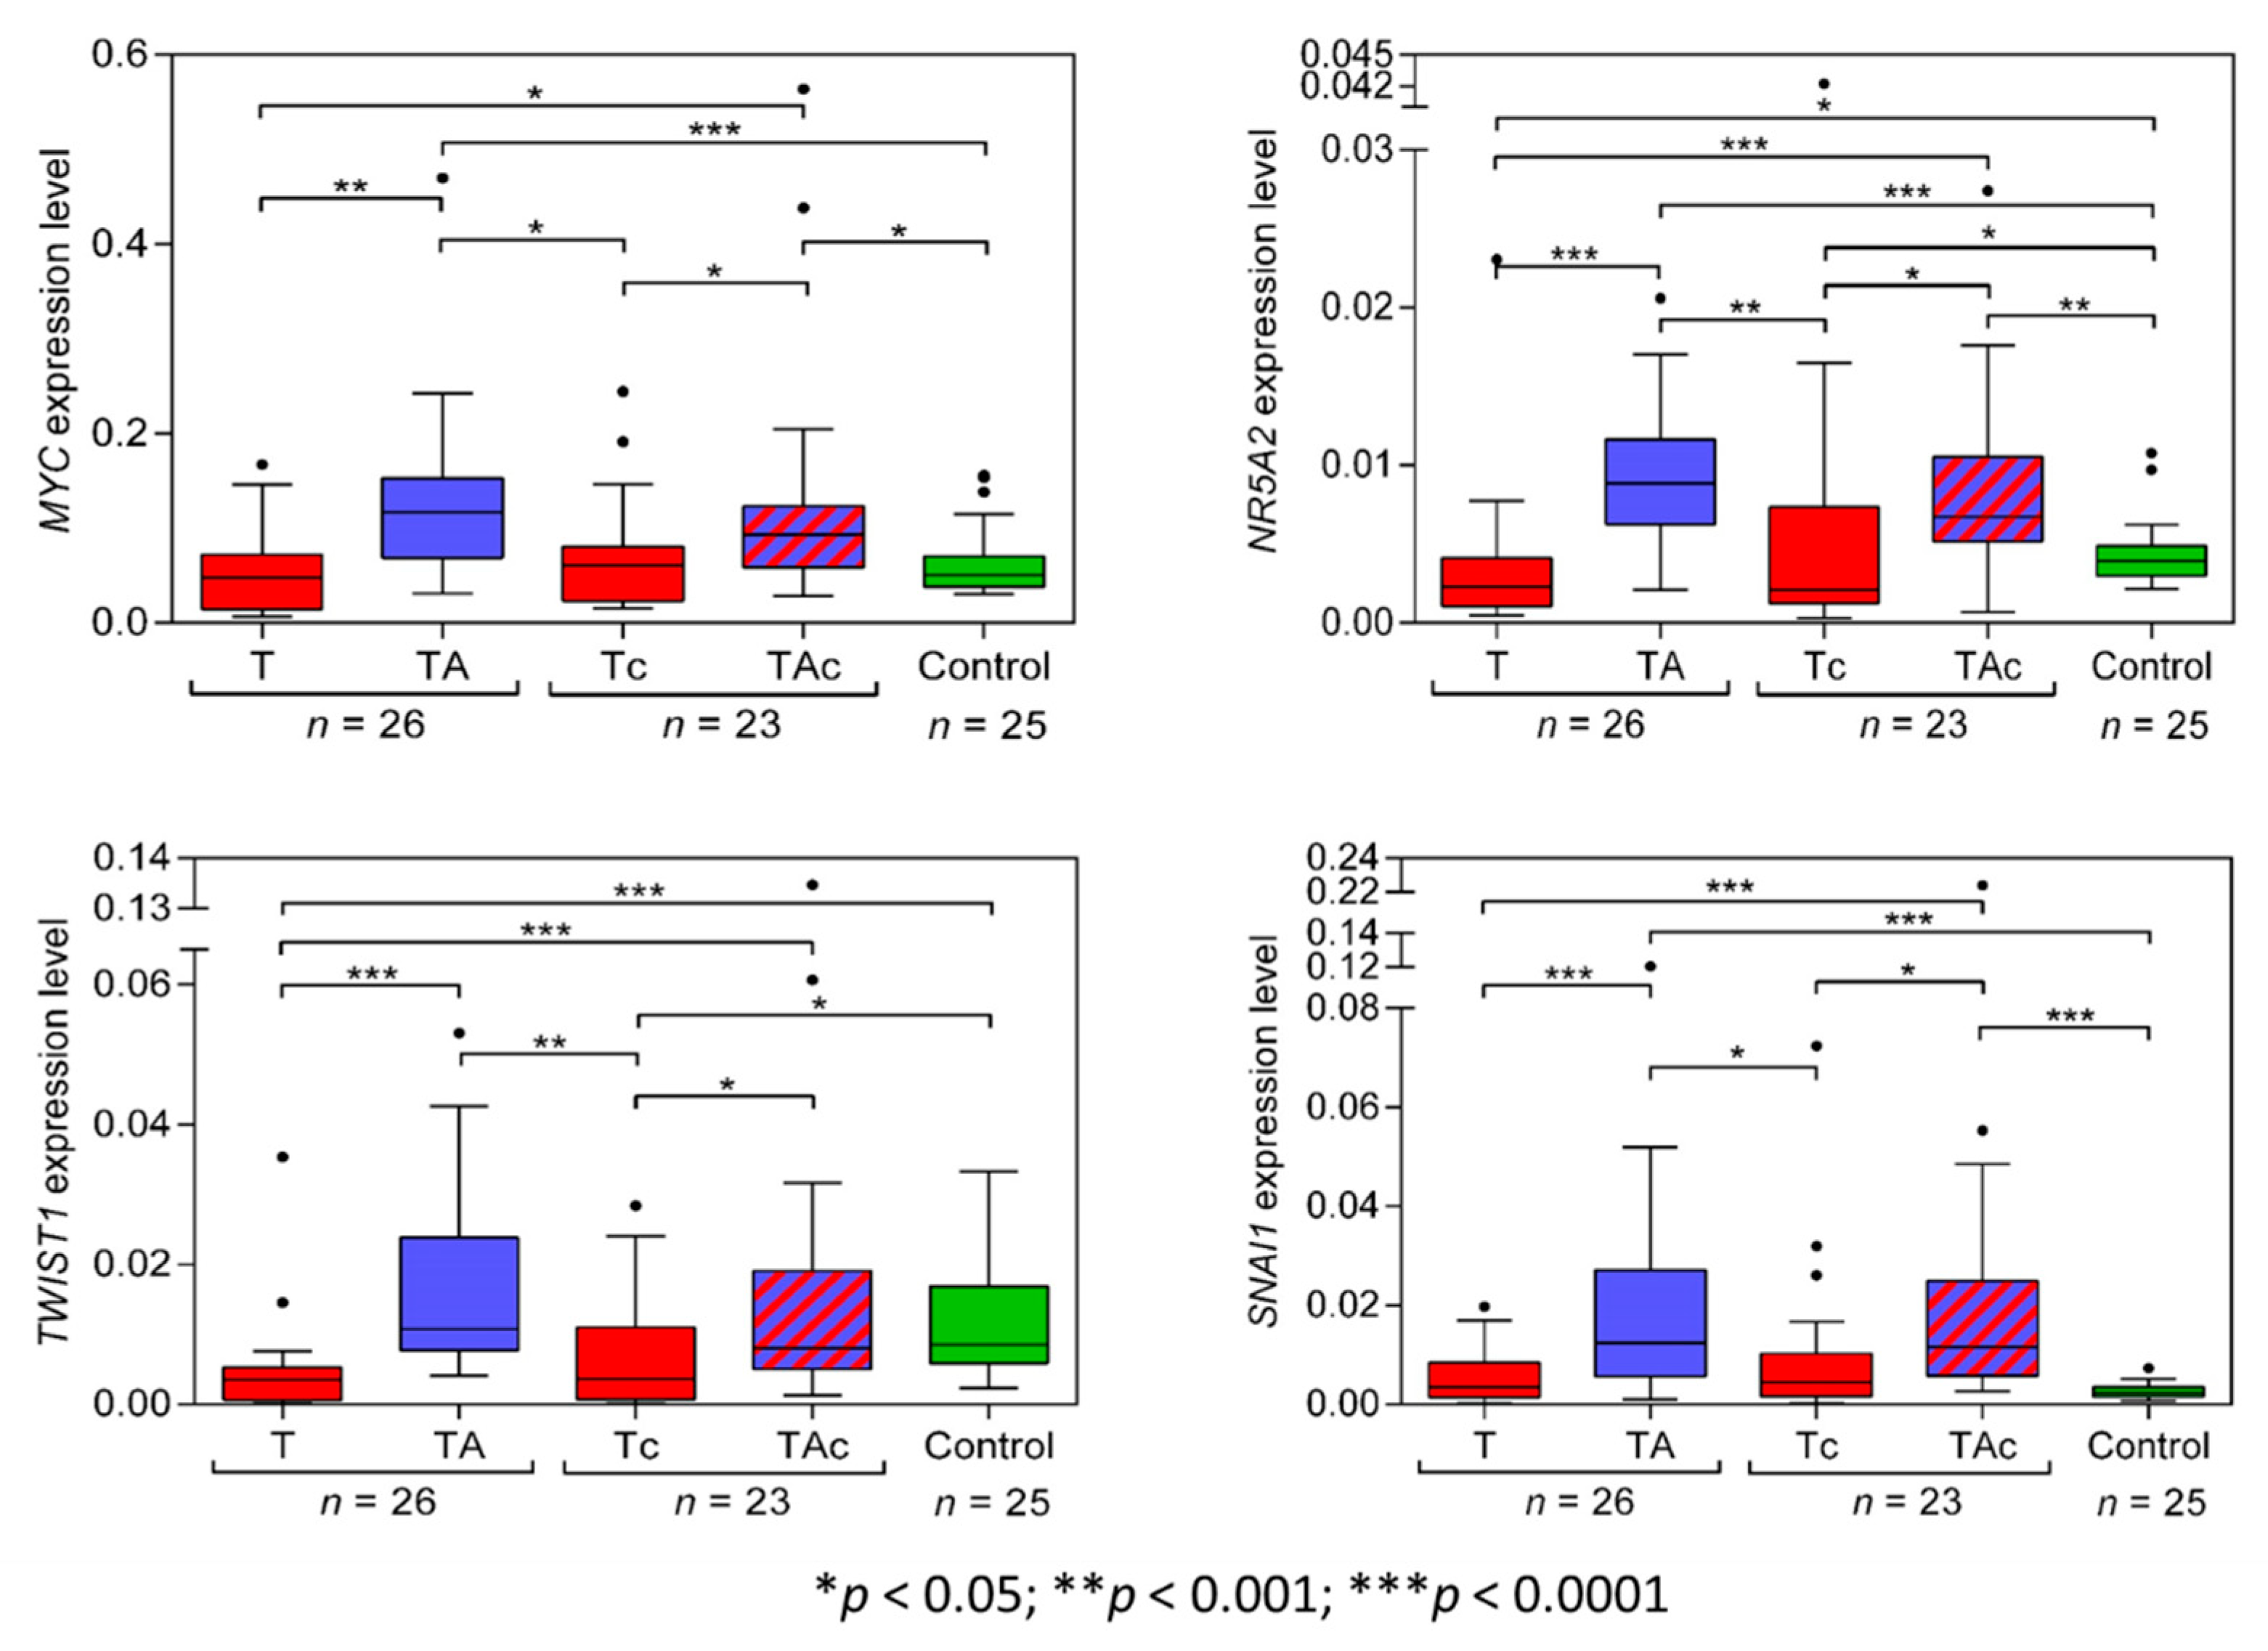
3.1. Gene Expression in Tumor-Adjacent Tissues and Tumors in Patients with EC and in Endometrial Tissue in Cancer-Free Patients with Leiomyoma

3.1.1. MYC

The level of MYC expression was significantly higher in TA than in the matched T samples. MYC expression was similar in T, Tc, and Ctrl samples. MYC expression was also significantly higher in TAc than in the matched tumor samples and in TAc than in Ctrl samples (Figure 2, Table 2 and Supplementary Figure S1a).

3.1.2. NR5A2

The expression level of NR5A2 was significantly higher in TA than in the matched T samples, and in Ctrl than in T samples. It was also significantly higher in TAc than in the matched Tc samples, in TAc than in Ctrl samples, and in Ctrl than in Tc samples (Figure 2, Table 2 and Supplementary Figure S1b).

3.1.3. TWIST1

The expression level of TWIST1 in TA samples significantly exceeded that in the matched T samples and was also significantly higher in Ctrl than in T samples, but was similar in TA and in Ctrl samples. The expression level of TWIST1 was also significantly higher in TAc samples than in the matched Tc samples and in Ctrl than in Tc samples, but it was similar in TAc and Ctrl samples (Figure 2, Table 2 and Supplementary Figure S1c).

3.1.4. SNAI1

The expression level of SNAI1 was significantly higher in TA than in the matched T, but did not significantly differ between T and Ctrl samples. The expression level of SNAI1 was significantly higher in TAc than in the matched Tc samples and in Ctrl samples, but it was similar in Ctrl and Tc samples (Figure 2, Table 2 and Supplementary Figure S1d).

3.1.5. STK11(LKB1)

STK11(LKB1) expression level was significantly higher in TA than in the matched T and in Ctrl than in T. STK11(LKB1) expression was similar in Ctrl vs. TA samples and vs. TAc samples. The expression level of STK11(LKB1) was significantly higher in TAc samples compared to the matched Tc samples, and in Ctrl it did not differ from that in Tc samples (Figure 3, Table 2 and Supplementary Figure S2a).

3.1.6. CXCR2

The expression levels of CXCR2 did not differ between T and the matched TA samples, but were significantly higher in T than in Ctrl samples. In TAc and in the matched Tc samples, no significant difference in the levels of CXCR2 expression was found, but the levels were significantly higher in TAc and Tc samples than in Ctrl samples. (Figure 3, Table 2 and Supplementary Figure S2b).

3.1.7. HMGA2

HMGA2 expression levels were significantly higher in T than in the matched TA samples and in Ctrl samples. Similar HMGA2 expression levels were found in TA and in Ctrl samples. Three T samples with the highest HMGA2 expression derived from patients with: clear cell adenocarcinoma, endometrioid adenocarcinoma, and serous carcinoma. The level of HMGA2 expression was similar in TAc and the matched TC samples, but in TAc and in Tc samples it was significantly higher than in Ctrl samples (Figure 3, Table 2 and Supplementary Figure S2c).

3.1.8. LIN28A

We found that only 9 out of 26 EC tumor samples and none of TA and Ctrl samples expressed LIN28A. Five of the LIN28A-positive tumor samples were endometrioid adenocarcinoma, and four were clear cell adenocarcinoma. LIN28A expression levels were significantly higher in T than in the matched TA samples (Figure 3, Table 2 and Supplementary Figure S2d).

3.1.9. POU5F1 Isoform A (OCT4A)

Among the matched T and TA samples from 26 EC patients, only 11 T and 2 TA samples expressed POU5F1 isoform A (OCT4A), and the tumors derived from patients with: endometrioid adenocarcinoma (eight) and clear cell adenocarcinoma (three). Two OCT4A-positive TA samples derived from patients with endometrioid adenocarcinoma (Figure 4, Table 2, and Supplementary Figure S3a). OCT4A was expressed in 5 Tc samples only, diagnosed as clear cell adenocarcinoma (four) and carcinosarcoma (one). Three OCT4A-positive TAc samples derived from patients with endometrioid adenocarcinoma (two) and carcinosarcoma (one). A total of 14 out of 25 Ctrl samples expressed OCT4A. OCT4A expression levels were significantly higher in Ctrl than in TA samples. (Figure 4, Table 2 and Supplementary Figure S3a).

3.1.10. POU5F1 isoform B (OCT4B)

POU5F1 isoform B (OCT4B) expression level was significantly lower in TA than in T samples. OCT4B expression did not differ between T and in Ctrl samples and between TA and Ctrl samples. (Figure 4, Table 2). The expression level of OCT4B was similar in TAc and the matched Tc samples, as well as in TAc vs. Ctrl samples, and in Tc vs. Ctrl samples (Figure 4, Table 2 and Supplementary Figure S3b).

3.1.11. POU5F1 isoform B1 (OCT4B1)

OCT4B1 expression level was similar in all types of the analyzed samples, T vs. TA, T vs. Ctrl, TA vs. Ctrl, TAc vs. the matched Tc, TAc vs. Ctrl and Tc vs. Ctrl (Figure 4, Table 2 and Supplementary Figure S3c).

3.1.12. miR-205-5p

The level of miR-205-5p expression was significantly higher in T than in the matched TA samples and was significantly higher in T than in Ctrl samples. miR-205-5p expression did not differ between TA samples and Ctrl samples (Figure 4, Table 2, and Supplementary Figure S3d). The expression level miR-205-5p was significantly higher in Tc samples than in the matched TAc samples, and in Ctrl samples, as well as in Tc than in Ctrl samples, and in TAc than in Ctrl samples. miR-205-5p expression was significantly higher in TAc compared to TA samples (Figure 4, Table 2 and Supplementary Figure S3d).

3.2. Gene Expression in Relation to Histological Results in Tumor-Adjacent Tissues

At histopathological examination, part of tumor-adjacent tissue samples from EC patients were found to contain various proportions of cancer and/or myometrial cells.
In 23 out of 49 EC patients, tumor-adjacent tissues contained cancer cells. There were no significant differences in the levels of TWIST1, SNAI1, NR5A2, MYC, CXCR2, STK11, POU5F isoforms A, B, B1 (OCT4A, OCT4B, OCT4B1, respectively), and HMGA2 in tumor-adjacent tissues, depending on cancer cell presence (TA vs. TAc), except miR-205-5p the expression of which was significantly higher in cancer cell-containing tumor-adjacent samples (Figure 2, Figure 3 and Figure 4). In tumor samples, none of the analyzed transcripts was differentially expressed depending on cancer cell presence in paired tumor-adjacent tissues (T vs. Tc) (Figure 2, Figure 3 and Figure 4).
In cancer cell-free EC-adjacent tissues (TA), the expression of MYC, NR5A2, SNAI1, and CXCR2 was higher than in Ctrl samples (Table 2).
Out of 26 cancer cell-free TA samples, 10 contained 0–45% myometrial cells (TA-low-M), while the others contained at least 50% (TA-high-M). The levels of CXCR2, MYC, NR5A2, POU5F isoforms B, B1 (OCT4B, OCT4B1), and miR-205-5p expression were similar in TA-high-M vs TA-low-M, while the levels of HMGA2 and SNAI1 expression was significantly higher and the level of STK11 and TWIST1 expression significantly lower in TA-low-M than in TA-high-M samples (Supplementary Figures S4–S6).

3.3. Relationships of Gene Expression with Clinical Data

We assessed relationships between the expression of the studied genes with stage, grade, histological type, relapse time, and 5-year survival in patients with EC. The only relationships revealed were as follows.
In patients with cancer-free tumor-adjacent tissue, higher MYC expression in the tumor increased the probability that tumor type was not endometrioid adenocarcinoma (OR 5.079, 95% CI [1.274–20.244], p = 0.021).
Higher TAc NR5A2 expression in patients with cancer cells infiltrating the tumor-adjacent tissue increased the risk of death (HR 50.0557, 95% CI [2.105–1190.448], p = 0.016).
Higher miR-205-5p expression in tumor-adjacent tissue related to tumor cell presence in the tumor-adjacent tissue (univariate test: OR 2.338, 95% CI [1.202–4.547], p = 0.0124; multivariate test: OR 2.172, 95% CI [1.131–4.17], p = 0.020).
Higher CXCR2 expression in tumor samples reduced the risk of recurrence in both the TA and TAc groups (univariate test: OR 0.0176, 95% CI [0.001–0.456], p = 0.015; multivariate test: OR 0.003, [0–0.508], p = 0.026).

3.4. Expression Levels of the Analyzed Transcripts in EC Cell Lines

The expression of TWIST1, SNAI1, NR5A2, MYC, CXCR2, STK11, POU5F1 (OCT4, isoforms A, B, and B1), and HMGA2 was studied in endometrial cancer cell lines, AN3 CA, HEC-1-A, MFE 280, and MFE 296. HMGA2, MYC, STK11, and TWIST expression was comparable to that in tumors from EC patients, while CXCR2, NR5A2, and SNAI expression was different from that in EC clinical samples. Inconsistent results on the expression of the other genes were observed (Supplementary Figures S1–S3).

4. Discussion

In EC, the expression of cancer-promoting genes, MYC, NR5A2, SNAI1, and TWIST1, was found to be significantly higher in tumor-adjacent tissues than in the matched tumors. The expression of all those genes, except TWIST1, was higher in tumor-adjacent tissues than in tissues neighboring uterine leiomyoma in cancer-free patients. Tumor-adjacent tissues from patients with leiomyoma were studied as the most adequate available control, as uterine biopsies of endometrium/myometrium from healthy women were inaccessible. We also present diverse expression of the analyzed genes in EC cell lines, not always reflecting the results in clinical material.
Actively released cancer cell-derived extracellular vesicles containing various functional molecules can influence the phenotypes of adjacent normal cells and promote cancer progression [53]. As recently shown, prostate cancer-derived large extracellular vesicles (oncosomes) facilitated intercellular communication through inducing high MYC activity in stromal cells [54], and human medulloblastoma cells with MYC amplification could release extracellular vesicles carrying MYC sequences [55]. Thus, extracellular vesicle-mediated induction of MYC expression may have contributed to the high MYC expression in the analyzed samples of EC-adjacent tissues. Noteworthy, a recently proposed model of MYC-dependent signal transfer from breast cancer cells to the surrounding cancer-associated fibroblasts involves exosome-transported miR-105, which downregulates the expression of MXI1, an inhibitor of MYC activity, and results in an increased MYC activity [56].
Increasing evidence also points to the important role of MYC upregulation in cell selection, also known as cell competition, leading to elimination of less competent cells, e.g., during embryonal development [57]. A possible role of cell competition has been suggested in field cancerization, a phenomenon characterized by phenotypic and genetic changes in tumor neighboring cells [57,58], and MYC-mediated “super competition” has been implicated in tumor progression [59]. Therefore, cell competition may contribute to the expansion of MYC-expressing cells in EC-adjacent tissues. We found that high expression of MYC was associated with more aggressive, non-endometrioid histology, as earlier suggested by Raeder et al. [60].
We showed significantly higher levels of NR5A2 (also known as LRH-1) in EC-adjacent tissues than in paired tumors and in endometrial samples from cancer-free leiomyoma patients. We are the first to show NR5A2 expression in clinical samples of EC. NR5A2 expression in TA and TAc exceeded that in tumors, and in TAc, higher NR5A2 expression increased the risk of death. In breast cancer, an increased NR5A2 expression has been reported in tumor-adjacent adipose tissue as compared to normal breast tissue both from cancer-free patients and from breast cancer patients [61]. NR5A2 is an estrogen receptor target gene [62], and NR5A2 is a key regulator of aromatase expression in breast cancer-associated adipose stromal fibroblasts [63]. Aromatase, a protein encoded by CYP19A1 gene, is a key enzyme responsible for estrogen biosynthesis [64]. Noteworthy, an aromatase mRNA expression and activity has been found in EC-adjacent endometrium [65]. Thus, it is possible that increased NR5A2 expression in EC-adjacent samples contributed to the aberrant aromatase expression/activity in peritumoral tissues, resulting in local estrogen production and EC progression. It has also been demonstrated that NR5A2 may positively regulate MYC expression [66], therefore, the increased NR5A2 expression may also contribute to the above-described MYC upregulation in EC-adjacent tissues. Noteworthy, in leiomyomas, a decreased expression of MYC and NR5A2 in tumors compared to the corresponding myometrium has also been observed [67].
Noteworthy, Aran et al. have recently characterized a set of genes overexpressed in tumor-adjacent tissues as compared to tumors in several cancer types, and those genes strongly associated with various signaling pathways, including EMT [68]. Our data showed a higher expression of both SNAI1 and TWIST1 in EC-adjacent tissues than in the matched tumor samples. Similarly, in breast cancer, high expression of SNAI1 and/or TWIST1 in tumor-adjacent tissues has been demonstrated [10,69]. Montserrat et al. also observed higher expression of SNAI1 and TWIST1 in EC tumors than in endometrial samples obtained at hysterectomy from patients with uterine leiomyomas or prolapse, but EC-adjacent tissues have not been analyzed [51].
We demonstrated that in EC, tumor STK11 expression level was lower than in the matched TA and in Ctrl samples. Our data implicating a tumor suppressor role of STK11 in EC are in agreement with previous studies involving cell lines and animal models, where STK11 deficiency was strongly associated with highly invasive phenotype of endometrial carcinoma cells [70,71,72].
Our data demonstrating elevated expression of miR-205-5p and HMGA2 in EC tumors are in line with previous results [49,51,73,74], and provide an additional validation of the measurements we performed here. Accordingly, higher miR-205-5p expression in tumor-adjacent tissue related to cancer cell presence in the tumor-adjacent tissue.
The higher POU5F1 isoform A (OCT4A) expression in EC in tumors than in the matched tumor-adjacent samples is consistent with previous literature data demonstrating OCT4A enrichment in EC tumor-initiating/cancer stem cells [75]. Surprisingly, OCT4A expression in TA samples were significantly lower compared to Ctrl samples derived from leiomyoma patients. The underlying mechanism of the difference is not clear. It is worth noting that recent data on patients with the most common MED12mt fibroid subtype showed a set of tumor-promoting genes to be upregulated in myometrium adjacent to tumors compared to normal myometrium [76].
Similar expression levels of all of the assessed transcripts, except miR-205-5p, were shown in cancer cell-free and cancer cell-containing tumor-adjacent tissues from EC patients. In full-thickness biopsy samples of relatively thin endometrium of postmenopausal women, the underlying myometrial cells are often present [77]. Considering the content of myometrial cells in TA tissues, samples with high percentage of myometrial cells expressed lower levels of HMGA2 and SNAI1 and higher levels of STK11 and TWIST1, while all the other transcripts were similarly expressed. Hence, the possible contribution of cancer or myometrial cells in TA in the expression of all or most of the analyzed transcripts, respectively, seems limited. Interestingly, regarding CXCR2 that was expressed at similar levels in T, TA, and TAc, patients with higher CXCR2 expression in tumor samples presented reduced risk of recurrence independent of cancer cell presence in tumor surrounding. Explaining this issue requires further research.
The molecular etiology of EC and the pathogenic role of the demonstrated here overexpression of MYC, NR5A2, SNAI1, and TWIST1 in tumor-adjacent tissues is not clear. The expression of MYC, NR5A2, and SNAI1 was found to be higher in EC-adjacent tissues than in samples from cancer-free patients, which shows that tumor-surrounding tissues presented truly elevated expression, not just higher expression than in a tumor because of a decreased tumor expression. The increased expression of cancer-promoting genes found in tumor-surrounding tissues may represent pre/pro-cancerous alterations associated with field cancerization [58]. The tumor-adjacent tissue alterations may reflect the response of extratumoral microenvironment to the tumor. Aran et al., based on datasets from the Genotype-Tissue Expression project and The Cancer Genome Atlas, in tumor-adjacent tissues identified a set of genes strongly associated with pro-inflammatory signaling pathways to be specifically overexpressed, as compared to tumors [68]. Trujillo et al., in a study on breast cancer, identified a small set of genes involved in extracellular matrix remodeling, wound healing, and fibrosis that were significantly overexpressed in patient-matched, tumor-adjacent histologically normal breast tissues located 1 cm from the margins of breast adenocarcinomas, as compared to those in tissues located 5 cm from the visible tumor margin and in breast tissues from cancer-free patients [69]. Troester et al., in another study on breast cancer, demonstrated activation of wound response signature in the histologically normal tissue adjacent to tumors [78]. A possible contribution of stroma has also been suggested in the field cancerization phenomenon [79]. An accumulating body of data shows that molecular alterations in tumor-surrounding tissues can be orchestrated by the tumor. A study by Chatterjee et al. in breast cancer showed that fibroblasts isolated from tumor-adjacent tissue were tumor-activated and suppressed the clonogenic activity of normal breast epithelial progenitor cells while promoting the growth of malignant human mammary cells [80]. Recently, Amirrad et al. suggested a possible contribution of tumor-derived exosomes to the upregulation of EGR-1 and FASN in tumor-adjacent prostatic tissues [81]. The important role of extracellular vesicles in dictating the phenotypes of tumor-surrounding cells through such a paracrine (secretory) influence has recently been demonstrated in other studies [53].
In summary, our data provide important insights into the biology of tumors and the surrounding tissues in EC and highlight the need to characterize tumor-adjacent tissues. We showed significant abnormalities in the expression of cancer-promoting genes in tissues proximal to endometrial cancer, with higher expression of MYC, NR5A2, SNAI1, and TWIST1, in tumor-adjacent tissues than in tumors, which suggests field cancerization effect. Whether a field cancerization initially defined as cancer-preceding may also be tumor-induced and how far the tumor microenvironment reaches out remain open questions. Cancer-adjacent tissue, instead of being regarded as representative of the molecularly normal tissue (even if histologically normal) should rather be considered a potential target of anticancer therapy.
We are currently further exploring the molecular changes in EC tumor-adjacent tissues.

Supplementary Materials

The following are available online at https://www.mdpi.com/article/10.3390/genes13091611/s1, Figure S1: MYC (a), NR5A2 (b), TWIST1 (c), and SNAI1 (d) expression levels in tumor-adjacent tissues (TA, blue and TAc, blue-and-red pattern), in tumors (T and Tc, red) in patients with EC and in tumor-adjacent tissues in cancer-free patients with leiomyoma (Control, green), Figure S2: STK11 (a), CXCR2 (b), HMGA2 (c), and LIN28A (d) expression levels in tumor-adjacent tissues (TA, blue and TAc, blue-and-red pattern), in tumors (T and Tc, red) in patients with EC and in tumor-adjacent tissues in cancer-free patients with leiomyoma (Control, green), Figure S3: POU5F1 (isoforms A, B, B1) (a–c) and miR-205-5p (d) expression levels in tumor-adjacent tissues (TA, blue, and TAc, blue-and-red pattern), in tumors (T and Tc, red) in patients with EC and in tumor-adjacent tissues in cancer-free patients with leiomyoma (Control, green), Figure S4: MYC, NR5A2, TWIST1, and SNAI1 expression in relation to histological results in tumor-adjacent tissues. Red horizontal lines mark significant differences assessed by the Wilcoxon signed rank test for paired samples, black horizontal lines mark significant differences assessed by the Mann–Whitney rank sum test comparing groups, Figure S5: STK11, CXCR2, HMGA2, and LIN28A expression in relation to histological results in tumor-adjacent tissues. Red horizontal lines mark significant differences assessed by the Wilcoxon signed rank test for paired samples, black horizontal lines mark significant differences assessed by the Mann–Whitney rank sum test comparing groups, Figure S6: POU5F (OCT4A), POU5F isoform B (OCT4B) and POU5F isoform B1 (OCT4B1), and miR-205p expression in relation to histological results in tumor-adjacent tissues. Red horizontal lines mark significant differences assessed by the Wilcoxon signed rank test for paired samples, black horizontal lines mark significant differences assessed by the Mann–Whitney rank sum test comparing groups, Table S1: Reference gene candidate expression stability, Table S2: RNA Integrity Number (RIN) values of the studied samples.

Author Contributions

M.K.: Conceptualization, methodology, investigation, data curation, formal analysis, statistical analysis, writing—review and editing; M.S.: Conceptualization, methodology, investigation, data curation, formal analysis, writing—review and editing; G.P.: Conceptualization, investigation, data curation, formal analysis, writing—review; K.Z.: Pathological review, formal analysis, writing—review; R.L.: Investigation, methodology, data curation; L.M.S.: Software, formal analysis, review and editing; M.C.: formal analysis, data curation, writing—review and editing; J.K.S.: Conceptualization, supervision, writing—original draft preparation, review and editing, and funding acquisition. All authors have read and agreed to the published version of the manuscript.

Funding

Cell lines were funded by Polish Foundation of the European School of Oncology (PFESO), otherwise this research received no external funding.

Institutional Review Board Statement

The study was conducted in accordance with the Declaration of Helsinki, and the protocol was approved by the Ethics Committees of the Maria Sklodowska-Curie National Research Institute of Oncology (4/2011/1/2012; 17 April 2012) and of the Medical University of Warsaw (AKBE/36/2016; 14 January 2016).

Informed Consent Statement

Informed consent was obtained from all subjects involved in the study.

Data Availability Statement

Most of the data generated or analyzed during this study are included in this published article and its supplementary information files. Detailed data and information are available from the corresponding author on reasonable request.

Conflicts of Interest

The authors declare no conflict of interest.

References

  1. Yan, P.S.; Venkataramu, C.; Ibrahim, A.; Liu, J.C.; Shen, R.Z.; Diaz, N.M.; Centeno, B.; Weber, F.; Leu, Y.W.; Shapiro, C.L.; et al. Mapping geographic zones of cancer risk with epigenetic biomarkers in normal breast tissue. Clin. Cancer Res. 2006, 12, 6626–6636. [Google Scholar] [CrossRef] [PubMed]
  2. Teschendorff, A.E.; Gao, Y.; Jones, A.; Ruebner, M.; Beckmann, M.W.; Wachter, D.L.; Fasching, P.A.; Widschwendter, M. DNA methylation outliers in normal breast tissue identify field defects that are enriched in cancer. Nat. Commun. 2016, 7, 10478. [Google Scholar] [CrossRef] [PubMed]
  3. Reed, M.A.C.; Singhal, R.; Ludwig, C.; Carrigan, J.B.; Ward, D.G.; Taniere, P.; Alderson, D.; Günther, U.L. Metabolomic Evidence for a Field Effect in Histologically Normal and Metaplastic Tissues in Patients with Esophageal Adenocarcinoma. Neoplasia 2017, 19, 165–174. [Google Scholar] [CrossRef] [PubMed]
  4. Chandran, U.R.; Dhir, R.; Ma, C.; Michalopoulos, G.; Becich, M.; Gilbertson, J. Differences in gene expression in prostate cancer, normal appearing prostate tissue adjacent to cancer and prostate tissue from cancer free organ donors. BMC Cancer 2005, 5, 45. [Google Scholar] [CrossRef]
  5. Sanz-Pamplona, R.; Berenguer, A.; Cordero, D.; Mollevi, D.G.; Crous-Bou, M.; Sole, X.; Paré-Brunet, L.; Guino, E.; Salazar, R.; Santos, C.; et al. Aberrant gene expression in mucosa adjacent to tumor reveals a molecular crosstalk in colon cancer. Mol. Cancer 2014, 13, 46. [Google Scholar] [CrossRef]
  6. Abdalla, M.; Tran-Thanh, D.; Moreno, J.; Iakovlev, V.; Nair, R.; Kanwar, N.; Abdalla, M.; Lee, J.P.Y.; Kwan, J.Y.Y.; Cawthorn, T.R.; et al. Mapping genomic and transcriptomic alterations spatially in epithelial cells adjacent to human breast carcinoma. Nat. Commun. 2017, 8, 1245. [Google Scholar] [CrossRef]
  7. Casbas-Hernandez, P.; Sun, X.; Roman-Perez, E.; D’Arcy, M.; Sandhu, R.; Hishida, A.; McNaughton, K.K.; Yang, X.R.; Makowski, L.; Sherman, M.E.; et al. Tumor intrinsic subtype is reflected in cancer-adjacent tissue. Cancer Epidemiol. Biomark. Prev. 2015, 24, 406–414. [Google Scholar] [CrossRef]
  8. Pineda, A.L.; Ogoe, H.A.; Balasubramanian, J.B.; Rangel Escareno, C.; Visweswaran, S.; Herman, J.G.; Gopalakrishnan, V. On Predicting lung cancer subtypes using ‘omic’ data from tumor and tumor-adjacent histologically-normal tissue. BMC Cancer 2016, 16, 184. [Google Scholar] [CrossRef]
  9. Raudenska, M.; Sztalmachova, M.; Gumulec, J.; Fojtu, M.; Polanska, H.; Balvan, J.; Feith, M.; Binkova, H.; Horakova, Z.; Kostrica, R.; et al. Prognostic significance of the tumour-adjacent tissue in head and neck cancers. Tumour Biol. 2015, 36, 9929–9939. [Google Scholar] [CrossRef]
  10. Roman-Perez, E.; Casbas-Hernandez, P.; Pirone, J.R.; Rein, J.; Carey, L.A.; Lubet, R.A.; Mani, S.A.; Amos, K.D.; Troester, M.A. Gene expression in extratumoral microenvironment predicts clinical outcome in breast cancer patients. Breast Cancer Res. 2012, 14, R51. [Google Scholar] [CrossRef]
  11. Grinchuk, O.V.; Yenamandra, S.P.; Iyer, R.; Singh, M.; Lee, H.K.; Lim, K.H.; Chow, P.K.; Kuznetsov, V.A. Tumor-Adjacent tissue co-expression profile analysis reveals pro-oncogenic ribosomal gene signature for prognosis of resectable hepatocellular carcinoma. Mol. Oncol. 2018, 12, 89–113. [Google Scholar] [CrossRef] [PubMed]
  12. Hoshida, Y.; Villanueva, A.; Kobayashi, M.; Peix, J.; Chiang, D.Y.; Camargo, A.; Gupta, S.; Moore, J.; Wrobel, M.J.; Lerner, J.; et al. Gene expression in fixed tissues and outcome in hepatocellular carcinoma. N. Engl. J. Med. 2008, 359, 1995–2004. [Google Scholar] [CrossRef] [PubMed]
  13. Huang, X.; Stern, D.F.; Zhao, H. Transcriptional Profiles from Paired Normal Samples Offer Complementary Information on Cancer Patient Survival--Evidence from TCGA Pan-Cancer Data. Sci. Rep. 2016, 6, 20567. [Google Scholar] [CrossRef] [PubMed]
  14. Dhanasekaran, R.; Deutzmann, A.; Mahauad-Fernandez, W.D.; Hansen, A.S.; Gouw, A.M.; Felsher, D.W. The MYC oncogene—The grand orchestrator of cancer growth and immune evasion. Nat. Rev. Clin. Oncol. 2022, 19, 23–36. [Google Scholar] [CrossRef]
  15. Bai, M.K.; Costopoulos, J.S.; Christoforidou, B.P.; Papadimitriou, C.S. Immunohistochemical detection of the c-myc oncogene product in normal, hyperplastic and carcinomatous endometrium. Oncology 1994, 51, 314–319. [Google Scholar] [CrossRef]
  16. Geisler, J.P.; Geisler, H.E.; Manahan, K.J.; Miller, G.A.; Wiemann, M.C.; Zhou, Z.; Crabtree, W. Nuclear and cytoplasmic c-myc staining in endometrial carcinoma and their relationship to survival. Int. J. Gynecol. Cancer 2004, 14, 133–137. [Google Scholar] [CrossRef]
  17. Meinsohn, M.C.; Smith, O.E.; Bertolin, K.; Murphy, B.D. The Orphan Nuclear Receptors Steroidogenic Factor-1 and Liver Receptor Homolog-1: Structure, Regulation, and Essential Roles in Mammalian Reproduction. Physiol. Rev. 2019, 99, 1249–1279. [Google Scholar] [CrossRef]
  18. Michalek, S.; Brunner, T. Nuclear-Mitochondrial crosstalk: On the role of the nuclear receptor liver receptor homolog-1 (NR5A2) in the regulation of mitochondrial metabolism, cell survival, and cancer. IUBMB Life 2021, 73, 592–610. [Google Scholar] [CrossRef]
  19. Dube, C.; Bergeron, F.; Vaillant, M.J.; Robert, N.M.; Brousseau, C.; Tremblay, J.J. The nuclear receptors SF1 and LRH1 are expressed in endometrial cancer cells and regulate steroidogenic gene transcription by cooperating with AP-1 factors. Cancer Lett. 2009, 275, 127–138. [Google Scholar] [CrossRef]
  20. Yang, J.; Antin, P.; Berx, G.; Blanpain, C.; Brabletz, T.; Bronner, M.; Campbell, K.; Cano, A.; Casanova, J.; Christofori, G.; et al. Guidelines and definitions for research on epithelial-mesenchymal transition. Nat. Rev. Mol. Cell. Biol. 2020, 21, 341–352. [Google Scholar] [CrossRef]
  21. Seo, J.; Ha, J.; Kang, E.; Cho, S. The role of epithelial-mesenchymal transition-regulating transcription factors in anti-cancer drug resistance. Arch. Pharm. Res. 2021, 44, 281–292. [Google Scholar] [CrossRef]
  22. Zhang, P.; Hu, P.; Shen, H.; Yu, J.; Liu, Q.; Du, J. Prognostic role of Twist or Snail in various carcinomas: A systematic review and meta-analysis. Eur. J. Clin. Investig. 2014, 44, 1072–1094. [Google Scholar] [CrossRef]
  23. Kyo, S.; Sakaguchi, J.; Ohno, S.; Mizumoto, Y.; Maida, Y.; Hashimoto, M.; Nakamura, M.; Takakura, M.; Nakajima, M.; Masutomi, K.; et al. High Twist expression is involved in infiltrative endometrial cancer and affects patient survival. Hum. Pathol. 2006, 37, 431–438. [Google Scholar] [CrossRef] [PubMed]
  24. Abouhashem, N.S.; Ibrahim, D.A.; Mohamed, A.M. Prognostic implications of epithelial to mesenchymal transition related proteins (E-cadherin, Snail) and hypoxia inducible factor 1alpha in endometrioid endometrial carcinoma. Ann. Diagn. Pathol. 2016, 22, 1–11. [Google Scholar] [CrossRef] [PubMed]
  25. Shen, J.; Chen, Q.; Li, N.; Bai, X.; Wang, F.; Li, B. TWIST1 expression and clinical significance in type I endometrial cancer and premalignant lesions: A retrospective clinical study. Medicine 2020, 99, e23397. [Google Scholar] [CrossRef] [PubMed]
  26. Blechschmidt, K.; Kremmer, E.; Hollweck, R.; Mylonas, I.; Hofler, H.; Kremer, M.; Becker, K.F. The E-cadherin repressor snail plays a role in tumor progression of endometrioid adenocarcinomas. Diagn. Mol. Pathol. 2007, 16, 222–228. [Google Scholar] [CrossRef]
  27. Herrmann, J.L.; Byekova, Y.; Elmets, C.A.; Athar, M. Liver kinase B1 (LKB1) in the pathogenesis of epithelial cancers. Cancer Lett. 2011, 306, 1–9. [Google Scholar] [CrossRef]
  28. Yang, G.; Rosen, D.G.; Liu, G.; Yang, F.; Guo, X.; Xiao, X.; Xue, F.; Mercado-Uribe, I.; Huang, J.; Lin, S.H.; et al. CXCR2 promotes ovarian cancer growth through dysregulated cell cycle, diminished apoptosis, and enhanced angiogenesis. Clin. Cancer Res. 2010, 16, 3875–3886. [Google Scholar] [CrossRef]
  29. Matsuo, Y.; Ochi, N.; Sawai, H.; Yasuda, A.; Takahashi, H.; Funahashi, H.; Takeyama, H.; Tong, Z.; Guha, S. CXCL8/IL-8 and CXCL12/SDF-1alpha co-operatively promote invasiveness and angiogenesis in pancreatic cancer. Int. J. Cancer 2009, 124, 853–861. [Google Scholar] [CrossRef]
  30. Gabellini, C.; Trisciuoglio, D.; Desideri, M.; Candiloro, A.; Ragazzoni, Y.; Orlandi, A.; Zupi, G.; Del Bufalo, D. Functional activity of CXCL8 receptors, CXCR1 and CXCR2, on human malignant melanoma progression. Eur. J. Cancer 2009, 45, 2618–2627. [Google Scholar] [CrossRef]
  31. Liu, Z.; Yang, L.; Xu, J.; Zhang, X.; Wang, B. Enhanced expression and clinical significance of chemokine receptor CXCR2 in hepatocellular carcinoma. J. Surg. Res. 2011, 166, 241–246. [Google Scholar] [CrossRef]
  32. Yung, M.M.; Tang, H.W.; Cai, P.C.; Leung, T.H.; Ngu, S.F.; Chan, K.K.; Xu, D.; Yang, H.; Ngan, H.Y.; Chan, D.W. GRO-α and IL-8 enhance ovarian cancer metastatic potential via the CXCR2-mediated TAK1/NFkappaB signaling cascade. Theranostics 2018, 8, 1270–1285. [Google Scholar] [CrossRef] [PubMed]
  33. Henriques, T.B.; Dos Santos, D.Z.; Dos Santos Guimaraes, I.; Tessarollo, N.G.; Lyra-Junior, P.C.M.; Mesquita, P.; Pádua, D.; Amaral, A.L.; Cavadas, B.; Pereira, L.; et al. Inhibition of CXCR2 plays a pivotal role in re-sensitizing ovarian cancer to cisplatin treatment. Aging 2021, 13, 13405–13420. [Google Scholar] [CrossRef] [PubMed]
  34. Wilson, C.; Purcell, C.; Seaton, A.; Oladipo, O.; Maxwell, P.J.; O’Sullivan, J.M.; Wilson, R.H.; Johnston, P.G.; Waugh, D.J. Chemotherapy-Induced CXC-chemokine/CXC-chemokine receptor signaling in metastatic prostate cancer cells confers resistance to oxaliplatin through potentiation of nuclear factor-kappaB transcription and evasion of apoptosis. J. Pharmacol. Exp. Ther. 2008, 327, 746–759. [Google Scholar] [CrossRef] [PubMed]
  35. Armstrong, C.W.D.; Coulter, J.A.; Ong, C.W.; Maxwell, P.J.; Walker, S.; Butterworth, K.T.; Lyubomska, O.; Berlingeri, S.; Gallagher, R.; O’Sullivan, J.M. Clinical and functional characterization of CXCR1/CXCR2 biology in the relapse and radiotherapy resistance of primary PTEN-deficient prostate carcinoma. NAR Cancer. 2020, 2, zcaa012. [Google Scholar] [CrossRef]
  36. Kassim, S.K.; El-Salahy, E.M.; Fayed, S.T.; Helal, S.A.; Helal, T.; Azzam, E.-D.; Khalifa, A. Vascular endothelial growth factor and interleukin-8 are associated with poor prognosis in epithelial ovarian cancer patients. Clin. Biochem. 2004, 37, 363–369. [Google Scholar] [CrossRef]
  37. Wei, L.; Liu, Y.; Ma, Y.; Ding, C.; Zhang, H.; Lu, Z.; Gu, Z.; Zhu, C. C-X-C chemokine receptor 2 correlates with unfavorable prognosis and facilitates malignant cell activities via activating JAK2/STAT3 pathway in non-small cell lung cancer. Cell Cycle. 2019, 18, 3456–3471. [Google Scholar] [CrossRef]
  38. Zhao, J.; Ou, B.; Feng, H.; Wang, P.; Yin, S.; Zhu, C.; Wang, S.; Chen, C.; Zheng, M.; Zong, Y.; et al. Overexpression of CXCR2 predicts poor prognosis in patients with colorectal cancer. Oncotarget 2017, 8, 28442–28454. [Google Scholar] [CrossRef]
  39. Sui, P.; Hu, P.; Zhang, T.; Zhang, X.; Liu, Q.; Du, J. High expression of CXCR-2 correlates with lymph node metastasis and predicts unfavorable prognosis in resected esophageal carcinoma. Med. Oncol. 2014, 31, 809. [Google Scholar] [CrossRef]
  40. Mehravar, M.; Ghaemimanesh, F.; Poursani, E.M. An Overview on the Complexity of OCT4: At the Level of DNA, RNA and Protein. Stem Cell Rev. Rep. 2021, 17, 1121–1136. [Google Scholar] [CrossRef]
  41. Zhang, Q.; Han, Z.; Zhu, Y.; Chen, J.; Li, W. The Role Specific Mechanism of OCT4 in Cancer Stem Cells: A Review. Int. J. Stem Cells 2020, 13, 312–325. [Google Scholar] [CrossRef]
  42. Saha, S.K.; Jeong, Y.; Cho, S.; Cho, S.G. Systematic expression alteration analysis of master reprogramming factor OCT4 and its three pseudogenes in human cancer and their prognostic outcomes. Sci. Rep. 2018, 8, 14806. [Google Scholar] [CrossRef] [PubMed]
  43. Mohiuddin, I.S.; Wei, S.J.; Kang, M.H. Role of OCT4 in cancer stem-like cells and chemotherapy resistance. Biochim. Biophys. Acta Mol. Basis Dis. 2020, 1866, 165432. [Google Scholar] [CrossRef] [PubMed]
  44. Bhatt, S.; Stender, J.D.; Joshi, S.; Wu, G.; Katzenellenbogen, B.S. OCT-4: A novel estrogen receptor-α collaborator that promotes tamoxifen resistance in breast cancer cells. Oncogene 2016, 35, 5722–5734. [Google Scholar] [CrossRef] [PubMed]
  45. Tsialikas, J.; Romer-Seibert, J. LIN28: Roles and regulation in development and beyond. Development 2015, 142, 2397–2404. [Google Scholar] [CrossRef]
  46. Balzeau, J.; Menezes, M.R.; Cao, S.; Hagan, J.P. The LIN28/let-7 Pathway in Cancer. Front. Genet. 2017, 8, 31. [Google Scholar] [CrossRef]
  47. Donkers, H.; Bekkers, R.; Galaal, K. Diagnostic value of microRNA panel in endometrial cancer: A systematic review. Oncotarget 2020, 11, 2010–2023. [Google Scholar] [CrossRef]
  48. McCluggage, W.G.; Connolly, L.E.; McBride, H.A.; Kalloger, S.; Gilks, C.B. HMGA2 is commonly expressed in uterine serous carcinomas and is a useful adjunct to diagnosis. Histopathology 2012, 60, 547–553. [Google Scholar] [CrossRef]
  49. Wei, L.; Liu, X.; Zhang, W.; Wei, Y.; Li, Y.; Zhang, Q.; Dong, R.; Kwon, J.S.; Liu, Z.; Zheng, W.; et al. Overexpression and oncogenic function of HMGA2 in endometrial serous carcinogenesis. Am. J. Cancer Res. 2016, 6, 249–259. [Google Scholar]
  50. Ma, J.; Li, D.; Kong, F.F.; Yang, D.; Yang, H.; Ma, X.X. miR-302a-5p/367-3p-HMGA2 axis regulates malignant processes during endometrial cancer development. J. Exp. Clin. Cancer Res. 2018, 37, 19. [Google Scholar] [CrossRef]
  51. Montserrat, N.; Mozos, A.; Llobet, D.; Dolcet, X.; Pons, C.; de Herreros, A.G.; Matias-Guiu, X.; Prat, J. Epithelial to mesenchymal transition in early stage endometrioid endometrial carcinoma. Hum. Pathol. 2012, 43, 632–643. [Google Scholar] [CrossRef] [PubMed]
  52. Palumbo Junior, A.; de Sousa, V.P.L.; Esposito, F.; De Martino, M.; Forzati, F.; Moreira, F.C.B.; Simão, T.A.; Nasciutti, L.E.; Fusco, A.; Ribeiro Pinto, L.F.; et al. Overexpression of HMGA1 Figures as a Potential Prognostic Factor in Endometrioid Endometrial Carcinoma (EEC). Genes 2019, 10, 372. [Google Scholar] [CrossRef]
  53. Naito, Y.; Yoshioka, Y.; Yamamoto, Y.; Ochiya, T. How cancer cells dictate their microenvironment: Present roles of extracellular vesicles. Cell. Mol. Life Sci. 2017, 74, 697–713. [Google Scholar] [CrossRef]
  54. Minciacchi, V.R.; Spinelli, C.; Reis-Sobreiro, M.; Cavallini, L.; You, S.; Zandian, M.; Li, X.; Mishra, R.; Chiarugi, P.; Adam, R.M.; et al. MYC Mediates Large Oncosome-Induced Fibroblast Reprogramming in Prostate Cancer. Cancer Res. 2017, 77, 2306–2317. [Google Scholar] [CrossRef]
  55. Balaj, L.; Lessard, R.; Dai, L.; Cho, Y.J.; Pomeroy, S.L.; Breakefield, X.O.; Skog, J. Tumour microvesicles contain retrotransposon elements and amplified oncogene sequences. Nat. Commun. 2011, 2, 180. [Google Scholar] [CrossRef] [PubMed]
  56. Yan, W.; Wu, X.; Zhou, W.; Fong, M.Y.; Cao, M.; Liu, J.; Liu, X.; Chen, C.H.; Fadare, O.; Pizzo, D.P.; et al. Cancer-Cell-Secreted exosomal miR-105 promotes tumour growth through the MYC-dependent metabolic reprogramming of stromal cells. Nat. Cell. Biol. 2018, 20, 597–609. [Google Scholar] [CrossRef]
  57. Johnston, L.A. Socializing with MYC: Cell competition in development and as a model for premalignant cancer. Cold Spring Harb. Perspect. Med. 2014, 4, a014274. [Google Scholar] [CrossRef] [PubMed]
  58. Slaughter, D.P.; Southwick, H.W.; Smejkal, W. Field cancerization in oral stratified squamous epithelium; clinical implications of multicentric origin. Cancer 1953, 6, 963–968. [Google Scholar] [CrossRef]
  59. Di Giacomo, S.; Sollazzo, M.; de Biase, D.; Ragazzi, M.; Bellosta, P.; Pession, A.; Grifoni, D. Human Cancer Cells Signal Their Competitive Fitness Through MYC Activity. Sci. Rep. 2017, 7, 12568. [Google Scholar] [CrossRef]
  60. Raeder, M.B.; Birkeland, E.; Trovik, J.; Krakstad, C.; Shehata, S.; Schumacher, S.; Zack, T.I.; Krohn, A.; Werner, H.M.; Moody, S.E.; et al. Integrated genomic analysis of the 8q24 amplification in endometrial cancers identifies ATAD2 as essential to MYC-dependent cancers. PLoS ONE 2013, 8, e54873. [Google Scholar] [CrossRef]
  61. Zhou, J.; Suzuki, T.; Kovacic, A.; Saito, R.; Miki, Y.; Ishida, T.; Moriya, T.; Simpson, E.R.; Sasano, H.; Clyne, C.D. Interactions between prostaglandin E(2), liver receptor homologue-1, and aromatase in breast cancer. Cancer Res. 2005, 65, 657–663. [Google Scholar] [CrossRef] [PubMed]
  62. Annicotte, J.S.; Chavey, C.; Servant, N.; Teyssier, J.; Bardin, A.; Licznar, A.; Badia, E.; Pujol, P.; Vignon, F.; Maudelonde, T.; et al. The nuclear receptor liver receptor homolog-1 is an estrogen receptor target gene. Oncogene 2005, 24, 8167–8175. [Google Scholar] [CrossRef]
  63. Chand, A.L.; Herridge, K.A.; Howard, T.L.; Simpson, E.R.; Clyne, C.D. Tissue-Specific regulation of aromatase promoter II by the orphan nuclear receptor LRH-1 in breast adipose stromal fibroblasts. Steroids 2011, 76, 741–744. [Google Scholar] [CrossRef] [PubMed]
  64. Simpson, E.R.; Mahendroo, M.S.; Means, G.D.; Kilgore, M.W.; Hinshelwood, M.M.; Graham-Lorence, S.; Amarneh, B.; Ito, Y.; Fisher, C.R.; Michael, M.D.; et al. Aromatase cytochrome P450, the enzyme responsible for estrogen biosynthesis. Endocr. Rev. 1994, 15, 342–355. [Google Scholar] [PubMed]
  65. Smuc, T.; Rizner, T.L. Aberrant pre-receptor regulation of estrogen and progesterone action in endometrial cancer. Mol. Cell. Endocrinol. 2009, 301, 74–82. [Google Scholar] [CrossRef] [PubMed]
  66. Xiao, L.; Wang, Y.; Liang, W.; Liu, L.; Pan, N.; Deng, H.; Li, L.; Zou, C.; Chan, F.L.; Zhou, Y. LRH-1 drives hepatocellular carcinoma partially through induction of c-myc and cyclin E1, and suppression of p21. Cancer Manag. Res. 2018, 10, 2389–2400. [Google Scholar] [CrossRef] [PubMed]
  67. Lessl, M.; Klotzbuecher, M.; Schoen, S.; Reles, A.; Stockemann, K.; Fuhrmann, U. Comparative messenger ribonucleic acid analysis of immediate early genes and sex steroid receptors in human leiomyoma and healthy myometrium. J. Clin. Endocrinol. Metab. 1997, 82, 2596–2600. [Google Scholar] [CrossRef]
  68. Aran, D.; Camarda, R.; Odegaard, J.; Paik, H.; Oskotsky, B.; Krings, G.; Goga, A.; Sirota, M.; Butte, A.J. Comprehensive analysis of normal adjacent to tumor transcriptomes. Nat. Commun. 2017, 8, 1077. [Google Scholar] [CrossRef] [PubMed]
  69. Trujillo, K.A.; Heaphy, C.M.; Mai, M.; Vargas, K.M.; Jones, A.C.; Vo, P.; Butler, K.S.; Joste, N.E.; Bisoffi, M.; Griffith, J.K. Markers of fibrosis and epithelial to mesenchymal transition demonstrate field cancerization in histologically normal tissue adjacent to breast tumors. Int. J. Cancer. 2011, 129, 1310–1321. [Google Scholar] [CrossRef]
  70. Contreras, C.M.; Gurumurthy, S.; Haynie, J.M.; Shirley, L.J.; Akbay, E.A.; Wingo, S.N.; Schorge, J.O.; Broaddus, R.R.; Wong, K.K.; Bardeesy, N.; et al. Loss of Lkb1 provokes highly invasive endometrial adenocarcinomas. Cancer Res. 2008, 68, 759–766. [Google Scholar] [CrossRef]
  71. Co, N.N.; Iglesias, D.; Celestino, J.; Kwan, S.Y.; Mok, S.C.; Schmandt, R.; Lu, K.H. Loss of LKB1 in high-grade endometrial carcinoma: LKB1 is a novel transcriptional target of p53. Cancer 2014, 120, 3457–3468. [Google Scholar] [CrossRef] [PubMed]
  72. Pena, C.G.; Nakada, Y.; Saatcioglu, H.D.; Aloisio, G.M.; Cuevas, I.; Zhang, S.; Miller, D.S.; Lea, J.S.; Wong, K.K.; DeBerardinis, R.J.; et al. LKB1 loss promotes endometrial cancer progression via CCL2-dependent macrophage recruitment. J. Clin. Investig. 2015, 125, 4063–4076. [Google Scholar] [CrossRef] [PubMed]
  73. Karaayvaz, M.; Zhang, C.; Liang, S.; Shroyer, K.R.; Ju, J. Prognostic significance of miR-205 in endometrial cancer. PLoS ONE 2012, 7, e35158. [Google Scholar] [CrossRef] [PubMed]
  74. Torres, A.; Torres, K.; Pesci, A.; Ceccaroni, M.; Paszkowski, T.; Cassandrini, P.; Zamboni, G.; Maciejewski, R. Diagnostic and prognostic significance of miRNA signatures in tissues and plasma of endometrioid endometrial carcinoma patients. Int. J. Cancer. 2013, 132, 1633–1645. [Google Scholar] [CrossRef]
  75. Zhou, X.; Zhou, Y.P.; Huang, G.R.; Gong, B.L.; Yang, B.; Zhang, D.X.; Hu, P.; Xu, S.R. Expression of the stem cell marker, Nanog, in human endometrial adenocarcinoma. Int. J. Gynecol. Pathol. 2011, 30, 262–270. [Google Scholar] [CrossRef]
  76. Paul, E.N.; Burns, G.W.; Carpenter, T.J.; Grey, J.A.; Fazleabas, A.T.; Teixeira, J.M. Transcriptome Analyses of Myometrium from Fibroid Patients Reveals Phenotypic Differences Compared to Non-Diseased Myometrium. Int. J. Mol. Sci. 2021, 22, 3618. [Google Scholar] [CrossRef]
  77. Maclean, A.; Kamal, A.; Adishesh, M.; Alnafakh, R.; Tempest, N.; Hapangama, D.K. Human Uterine Biopsy: Research Value and Common Pitfalls. Int. J. Reprod. Med. 2020, 2020, 9275360. [Google Scholar] [CrossRef]
  78. Troester, M.A.; Lee, M.H.; Carter, M.; Fan, C.; Cowan, D.W.; Perez, E.R.; Pirone, J.R.; Perou, C.M.; Jerry, D.J.; Schneider, S.S. Activation of host wound responses in breast cancer microenvironment. Clin. Cancer Res. 2009, 15, 7020–7028. [Google Scholar] [CrossRef]
  79. Ge, L.; Meng, W.; Zhou, H.; Bhowmick, N. Could stroma contribute to field cancerization? Med. Hypotheses 2010, 75, 26–31. [Google Scholar] [CrossRef]
  80. Chatterjee, S.; Basak, P.; Buchel, E.; Safneck, J.; Murphy, L.C.; Mowat, M.; Kung, S.K.; Eirew, P.; Eaves, C.J.; Raouf, A. Breast Cancers Activate Stromal Fibroblast-Induced Suppression of Progenitors in Adjacent Normal Tissue. Stem Cell Rep. 2018, 10, 196–211. [Google Scholar] [CrossRef]
  81. Amirrad, F.; Pytak, P.A.; Sadeghiani-Pelar, N.; Nguyen, J.P.T.; Cauble, E.L.; Jones, A.C.; Bisoffi, M. Prostate field cancerization and exosomes: Association between CD9, early growth response 1 and fatty acid synthase. Int. J. Oncol. 2020, 56, 957–968. [Google Scholar] [CrossRef] [PubMed]
Figure 1. The studied samples from endometrial cancer (a,b) and cancer-free leiomyoma cases (c); a, paired tumor (T, red) and cancer cell-free tumor-adjacent samples (TA, blue); b, paired samples of tumors (Tc, red) and tumor-adjacent samples containing cancer cells (TAc, blue and red); c, control tissues, endometrial samples from cancer-free patients with leiomyomas (Control, Ctrl, green).
Genes 13 01611 g001
Figure 2. MYC, NR5A2, TWIST1, and SNAI1 expression levels in tumors (T, red) and tumor-adjacent tissues without (TA, blue) or with (TAc, blue-dashed) cancer cell content in patients with EC, and in endometrial tissue in cancer-free patients with leiomyoma (Control, green).
Genes 13 01611 g002
Figure 3. STK11, CXCR2, HMGA2, and LIN28A expression levels in tumors (T, red) and tumor-adjacent tissues without (TA, blue) or with (TAc, blue-dashed) cancer cell content in patients with EC, and in tumor-adjacent tissues in cancer-free patients with leiomyoma (Control, green).
Genes 13 01611 g003
Figure 4. POU5F1 (isoforms A, B, B1) and miR-205-5p expression levels in tumors (T, red) and tumor-adjacent tissues without (TA, blue) or with (TAc, blue-dashed) cancer cell content in patients with EC, and in endometrial tissue in cancer-free patients with leiomyoma (Control, green).
Genes 13 01611 g004
Table 1. Characteristics of endometrial cancer patients.
Patients with Cancer Cell-Free Tumor-Adjacent Tissues (TA), n = 26
No.Patient No.AgeHistologic TypeGradeStage *
11257Endometrioid adenocarcinoma3IA
22370Endometrioid adenocarcinoma2IA
32457Endometrioid adenocarcinoma2/1IA
42584Endometrioid adenocarcinoma1IIIC
52672Endometrioid adenocarcinoma3IIIC
62958Clear cell adenocarcinoma3IB
73247Clear cell adenocarcinoma2IB
83360Endometrioid adenocarcinoma1IB
93561Endometrioid adenocarcinoma1IA
103670Clear cell adenocarcinoma 2IIIC
114170Serous carcinoma 1II
124273Endometrioid adenocarcinoma1IIA
134467Endometrioid adenocarcinoma1IA
145266Carcinosarcoma3IB
155475Endometrioid adenocarcinoma2IB
165650Endometrioid adenocarcinoma1IA
175857Endometrioid adenocarcinoma2II
185973Endometrioid adenocarcinoma2IB
196069Endometrioid adenocarcinoma2IA
206157Endometrioid adenocarcinoma2IA
216268Clear cell adenocarcinoma-IB
226353Endometrioid adenocarcinoma2IA
236768Endometrioid adenocarcinoma3IA
246975Endometrioid adenocarcinoma1II
257153Endometrioid adenocarcinoma3III
267365Endometrioid adenocarcinoma1IB
Patients with tumor-adjacent samples containing cancer cells (TAc), n = 23
No.Patient no.AgeHistologic typeGradeStage
11153Endometrioid adenocarcinoma1IB
21655Endometrioid adenocarcinoma1IB
31754Endometrioid adenocarcinoma2IB
41875Carcinosarcoma3I
51972Carcinosarcoma3I
62061Carcinosarcoma2/3I
72263Endometrioid adenocarcinoma1III
82750Endometrioid adenocarcinoma2I
93153Endometrioid adenocarcinoma2IB
103485Endometrioid adenocarcinoma1II
113852Endometrioid adenocarcinoma1II
123960Endometrioid adenocarcinoma1IIA
134074Endometrioid adenocarcinoma 2II
144675Endometrioid adenocarcinoma partim mucinosum1II
154780Endometrioid adenocarcinoma1II
164861Endometrioid adenocarcinoma1II
175078Endometrioid adenocarcinoma1IB
185374Endometrioid adenocarcinoma2IB
195763Endometrioid adenocarcinoma1IB
206454Endometrioid adenocarcinoma2IB
216572Carcinosarcoma3II
226673Endometrioid adenocarcinoma2IB
236876Endometrioid adenocarcinoma2IB
* FIGO (International Federation of Gynecology and Obstetrics) staging system.
Table 2. Gene expression in tumor-adjacent tissues (TA) and tumors in patients with EC (T and Ts) and in endometrial tissue (TA and TAc) in cancer-free patients with leiomyoma (Control).
p-Values (Green Marks Statistical Significance)
MYCNR5A2TWIST1SNAI1STK11CXCR2HMGA2LIN28APOU5F1 isoform APOU5F1 isoform BPOU5F1 isoform B1miR-205-5p
T vs TA0.0002<0.0001<0.0001<0.00010.00020.20790.04930.00390.00680.0010.2914<0.0001
Tc vs TAc0.00310.01010.00110.00270.01960.24670.1186>0.99990.68750.6010.1207<0.0001
T vs Control0.20530.0058<0.00010.18570.02340.0160.04210.00170.21740.67740.8409<0.0001
TA vs Control0.0001<0.00010.0947<0.00010.15060.00020.5311>0.9999<0.00010.41740.64320.1921
Tc vs Control0.95110.03820.01070.09480.08680.0078<0.00010.04550.01320.42410.8659<0.0001
TAc vs Control0.00790.00020.6637<0.0001>0.9999<0.00010.00530.22430.00380.92240.3426<0.0001
T vs Tc0.19130.6840.45910.48040.64070.72830.17150.20390.16430.99210.81940.5314
TA vs TAc0.23560.16520.05260.89730.18450.26890.09460.21510.38340.36580.71250.0001
T vs TAc0.0015<0.00010.00010.00010.00590.01320.88170.03610.0470.45790.41760.0003
TA vs Tc0.00220.00020.00030.00370.0010.46810.00340.04180.13910.09020.6152<0.0001
Medians of 2−ΔCt values
MYCNR5A2TWIST1SNAI1STK11CXCR2HMGA2LIN28APOU5F1isoform APOU5F1isoform BPOU5F1isoform B1miR-205-5p
T0.047870.00230.003570.00350.020070.000340.00566003.26 × 10−52.73 × 10−50.06781
TA0.116790.008880.010780.01240.036720.000370.00401001.28 × 10−53.13 × 10−50.00269
Tc0.061170.002130.003620.004440.021140.000290.00819005.63 × 10−53.33 × 10−50.09382
TAc0.093430.006750.008020.011580.033730.000840.00609001.66 × 10−52.22 × 10−50.01471
Control0.050870.003950.008530.002250.036650.000150.0041407.10 × 10−52.67 × 10−53.44 × 10−50.00199
HEX: #92d14f; RGB: rgba(146, 209, 79, 255).
Publisher’s Note: MDPI stays neutral with regard to jurisdictional claims in published maps and institutional affiliations.

