Article

Phylogeography of Toona ciliata (Meliaceae) Complex in China Inferred from Cytonuclear Markers

1
College of Forestry and Landscape Architecture, South China Agricultural University, Guangzhou 510642, China
2
Guangdong Key Laboratory for Innovative Development and Utilization of Forest Plant Germplasm, South China Agricultural University, Guangzhou 510642, China
*
Author to whom correspondence should be addressed.
Genes 2023, 14(1), 116; https://doi.org/10.3390/genes14010116
Submission received: 30 November 2022 / Revised: 23 December 2022 / Accepted: 27 December 2022 / Published: 31 December 2022
(This article belongs to the Special Issue Molecular Mechanisms of Adaptive Evolution in Trees)

Abstract

:
Toona ciliata is an important timber species but is recognized as an endangered species at level II in China. Its genetic conservation is of increasing concern. Provenance trials and other breeding programs were conducted to develop seed transfer rules and multiplications. Here, we investigated twenty-nine populations sampled across the natural distribution of the T. ciliata complex using mtDNA and nrDNA ITS (ribosomal internal transcribed spacer) markers. Haplotype diversity was h = 0.190 ± 0.202 and nucleotide diversity was π = 0.000383 ± 0.000536 for mtDNA marker. Nucleotide diversity for ITS sequences was 0.00837 ± 0.000783. Haplotypes exhibited phylogeographic structure in spatial distribution. The extent of genetic differentiation was significant (Fst = 0.6994 ± 0.0079 for ITS and 0.8870 ± 0.0077 for mtDNA marker). Isolation by distance (IBD) and by elevation (IBE) occurred among populations. Phylogenetic relationships from mtDNA marker indicated three genetically distinct regions, each without IBD effects. Compared with pollen flow, seed flow was strongly impeded in the western region, but extensive in the central region, and less impeded in the eastern region. Most populations did not exhibit expansion, with only a few populations showing expansion after bottleneck effects. We discussed a strategy of region-based genetic conservation and proposed to conserve multiple populations in the western and eastern regions and a few populations in the central region.

1. Introduction

T. ciliata is a deciduous or semi-deciduous tree in the Toona genus of the Meliaceae family and an important timber species in southern China [1]. It is naturally distributed in subtropical and tropical regions, including India, Malaysia, Indonesia, and other tropical regions. The species mainly occurs at elevations between 300 and 2600 m in China and on some arid and barren hillsides, with relatively wet and fertile soils and an annual average temperature of 15~22 °C. The species can attain 35 m in height and about 1 m in diameter at breast height (DBH) under a habitat of wet acid soil or calcareous soil with good drainage. One remarkable characteristic is that T. ciliata has high-quality wood, with a tough and straight texture, beautiful patterns, dark reddish-brown heartwood, and light sapwood, and is also known as Chinese mahogany [2,3,4]. T. ciliata is an ideal material for art processes and antique furniture in China and has a significant economic value [5]. However, T. ciliata is currently recognized as an endangered species at level II because of over exploitation and low natural regeneration [6,7]. Its genetic conservation is now of increasing concern and has been the subject of provenance trials aimed at delineating seed zones and developing seed transfer rules [8]. Other breeding programs have also been extensively conducted to improve multiplications of this species [9,10].
Based on the leaf and flower morphological traits, T. ciliata is taxonomically classified into five varieties, namely T. ciliata var. ciliata, T. ciliata var. yunnanensis, T. ciliata var. pubescens, T. ciliata var. sublaxiflora, and T. ciliata var. henryi [1]. Although there is debate about the taxonomic status of these five taxa, classification of these varieties could conceptually and practically complicate conservation of this endangered species [11]. Here, we bring these varieties together as the T. ciliata complex. Previous studies of population genetic structure were mostly conducted in terms of the T. ciliata complex rather than a single variety, showing significant population differentiation using either the sequence-related amplified polymorphism (SRAP) ( F s t = 0.7924) [12] or the simple sequence repeat (SSR) markers ( F s t = 0.35) [13]. There were significant effects of isolation by distance (IBD) across range-wide populations of T. ciliata complex. Zhan et al. further classified the range-wide populations into western and eastern regions across the natural distribution of T. ciliata complex [13]. T. ciliata var. pubescens was probably the only variety whose population genetic structure was studied using molecular markers [14]. Nevertheless, the ecological and evolutionary processes underlying the pattern of population genetic diversity of T. ciliata complex have not been studied in depth, which limits us to develop an appropriate strategy for genetic conservation.
Studies pertinent to genetic conservation of T. ciliata complex also include its reproductive system which was shown to be a predominantly outcrossing system, with selfing and inbreeding [15]. Inbreeding depression occurred in natural populations and could result in a decline in population density of natural forests and low regeneration [7]. In addition, previous phylogeny studies indicated that T. ciliata was divergent from other species of the same family at a wide range of evolutionary times (7.4–48.4 Mya) [16,17,18,19]. We recently showed that T. ciliata was divergent from its close species T. sinensis of the same genus at about 6–25 Mya using the whole genome sequences [20,21]. These studies help us to understand the taxonomic position of T. ciliata in the Meliaceae family and the significance of conserving T. ciliata from a broader perspective.
The purposes of this study were to investigate phylogeographic variation across range-wide populations of T. ciliata complex, with emphasis on inferring gene flow underlying the observed phylogenetic pattern, and to discuss genetic conservation of the species. Previous studies with SRAP and SSR markers were mainly confined to population structure of T. ciliata complex and did not infer the evolutionary processes underlying the observed pattern [12,13]. This provided us with preliminary information on making a strategy of genetic conservation but limited our insights into the evolutionary processes. In this study, we investigated the population genetic structure of T. ciliata complex using both nuclear and organelle genetic markers. For nuclear genomes, we selected a ribosomal internal transcribed spacer (ITS) marker that has been applied to population genetic analysis of plant species [22,23] and phylogeny among species in Meliaceae [16]. Its overall variability is generally lower than that of SSR markers but could likely be greater than that of SRAP markers [24]. For organelle genomes, we used both chloroplast (cpDNA) and mitochondrial DNA (mtDNA) markers that are maternally inherited. Here, we reported the results derived from both nrDNA and mtDNA markers. The results from cpDNA markers will be present separately. Gene flow is mediated through different vectors for nuclear ITS markers (both seed and pollen flow) versus for mtDNA markers (only seed flow) among populations in the T. ciliata complex. A combination of cytonuclear markers helps to infer the relative rate of pollen to seed flow among natural populations [25,26].
In addition, we investigated the potential historical range expansion or contraction, which could provide additional information on genetic conservation. Although postglacial impacts on the distribution of T. ciliata complex are unknown in South China, potential historical changes in populations size could yield different extents of genetic variation, as implied by postglacial colonization of some plant species [27,28,29,30]. The bottleneck effect, among common phenomena in species’ range shifting, can produce several population genetic patterns, such as a reduction in haplotype and nucleotide diversity [24]. Through analyzing these patterns, we tested the bottleneck effects of all investigated populations of the T. ciliata complex. This information was then combined with population structure and gene flow to develop a strategy for genetic conservation.

2. Materials and Methods

2.1. Population Sampling and DNA Extraction

Leaf samples were collected from 29 populations in 11 provinces, covering the range-wide distribution of T. ciliata complex in China (Table 1, Figure 1). Parent trees for collecting leaf samples were separated at least 50 m away in natural forest stands. A total of 500 individuals were analyzed in this study, ranging from 3 to 30 samples per population. The sample size in this study was less than that used by Li et al. [12] where a total of 853 individuals were analyzed. Most DNA samples extracted from healthy leaves were prepared and frozen by Li et al. [12]. Supplementary samples were collected in 2018 from the provenance trials at Zengcheng Experiment Station (113°37′ E, 23°14′ N, and 20.3 m above sea level) and Yuejin North Experiment Station, South China Agricultural University (113°37′ E, 23°16′ N, and 42.3 m above sea level). Supplementary DNA samples were extracted from leaves on living plants by following the CTAB 2X protocol [31]. The quality of DNA extraction was checked by 0.8% (w/v) agarose gel electrophoresis. All quantified DNA samples were stored at −20 °C for polymerase chain reaction (PCR) amplification.

2.2. Primer Screening, Amplification and Sequencing

For the mitochondrial genome, we tested twenty pairs of primers, with fourteen pairs from the literature [32,33,34] and six pairs designed in this study. Primer sequences were detailed in Table S1.
For the nuclear genome, we selected ITS fragment as marker [35], which covers the region of ITS5a-ITS4. The forward and reverse primers are CCTTATCATTTAGAGGAAGGAG and TCCTCCGCTTATTGATATGC, respectively.
The PCR amplification was carried out in a 25 μL reaction volume that contained 1μL template DNA, 1 μL of each forward and reverse primer, 12.5 μL 2×ES Taq Mastermix (including Es Taq DNA polymerase, 3 mM MgCl2 and 400 μM each dNTP) and 9.5 μL ddH2O. The amplifications were performed in Dongsheng Thermal Cycler (EDC-810, Suzhou, China). The PCR amplification for ITS and mtDNA primers was conducted as follows: preheating at 95 °C for 3 min, 32 cycles at 95 °C for 1 min, annealing at 50 °C for 1 min, and elongation at 72 °C for 1.5 min, followed by a final extension at 72 °C for 30 s. The amplified DNA fragments were subsequently sent to Sangon Biotech (Shanghai) for Sanger sequencing. All sequence data obtained by the company were checked with Chromatogram Explorer 3.2 software. The sequences with high quality and no mixed peak signals were used for downstream analyses.

2.3. Analysis of Genetic Diversity

The sequenced fragments of both ITS and mtDNA markers from 29 populations were aligned by MEGA7 [36], removing the parts with heterozygous interferences caused by unstable signals at the front and end. For indel (gap) polymorphisms observed in mtDNA fragments, the insertion and deletion were treated as the fifth nucleotide site and coded as mutant substitutions. Ultimately, we obtained two datasets from 29 populations for analysis, one for concatenated sequences from mitochondrial genome and the other from nuclear ITS sequences.
We used DNAsp v5 [37] to estimate haplotype diversity (h), nucleotide diversity ( π ), and effective population size-scaled mutation ( θ = 4 N e μ ) [38,39,40]. TCS v1.21 [41] was used to draw the evolutionary network among mitochondrial haplotypes.

2.4. Population Genetic Structure

Population genetic differentiation was measured using several indices, including F s t [42], N s t [43,44], G s t [40] and ϕ s t [45]. Both G s t and ϕ s t are analogous to F s t in biological meaning except using for multiple alleles (>2) and haploid sequence data, respectively. We used Arlequin v3.0 [46] and DNAsp v5 [37] to estimate these parameters. We tested whether N s t was larger than G s t or not to infer if a phylogeographic structure occurred [43].
Isolation by distance (IBD) was tested through regression analysis of F s t / ( 1 F s t ) on the logarithm of geographic distance [47,48]:
F s t 1 F s t = a + b · ln ( geographic   distance )
A significant difference of the regression coefficient b from zero indicates the presence of IBD effects. Note that the geographical distance between two populations was calculated using their longitude and latitude coordinates (Table 1). A Mantel’s test was also conducted to examine the relationship between F s t and the geographic distance [49].
Correlation between F s t and the difference in elevation between populations was tested to check if there were effects of isolation by elevation (IBE).
Nei’s genetic distance was calculated between populations [50]. Phylogenetic relationships among individuals and among populations were reconstructed by MEGA 7 [36].

2.5. Population Demography

To identify demographic changes, we tested neutrality of markers using Tajima’s D [51] and Fu’s F [52] tests. Analysis of mismatch distribution was performed by Arlequin v3.0 [46]. Under the null hypothesis that a population expanded after bottleneck effects, significant negative values of Tajima’s D and Fu’s F statistics could be expected.
We analyzed mismatch distribution using the ITS sequences for those populations with significant Tajima’s D or Fu’s F values [46]. A unimodal distribution of the frequency of observed number of pairwise different sites, which fits for a single-peaked Poisson distribution, would signal population expansion after bottleneck effects. Statistical testing was ducted using the sum of square deviations (SSD) and Harpending’s raggedness index (Rag) to check if the expected SSD (or Rag) was greater than the observed SSD (or Rag) [53]. Other parameters were estimated, including θ 0 = 2 N 0 μ , θ 1 = 2 N 1 μ , where N 0 and N 1 are the population sizes before and after population expansion, and τ   ( t )   , the time elapsed since a sudden expansion.

2.6. Ratio of Pollen to Seed Flow

We assessed the extent of gene flow of T. ciliata complex based on population genetic structure. Under the assumption of the classical island model [54], F s t for haploid and diploid markers is expressed as Fst(haploid) = 1/(1 + 2Nem) and Fst(diploid) = 1/(1 + 4Nem), respectively, where m is the migration rate and Ne is the effective population size. MtDNA marker is maternally inherited and only seed flow contributes to its gene flow. The nrDNA ITS marker is biparentally inherited and both seed and pollen flow contribute to its gene flow. According to Ennos [25] and Hu and Ennos [26], population genetic differentiation coefficients for nuclear markers, denoted by   F s t ( n ) , and for maternal markers, denoted by F s t ( m ) , are respectively given by
F s t ( n ) = 1 1 + 4 N e ( m s + m p / 2 )
F s t ( m ) = 1 1 + 2 N e m s
where ms is the rate of seed flow and mp is the rate of pollen flow. From Ennos [25], the relative rate of pollen to seed flow is estimated from Equations (2) and (3):
m p m s = ( 1 F s t ( n ) ) F s t ( m ) ( 1 F s t ( m ) ) F s t ( n ) 2 .
To estimate the standard deviation of the point estimate of mp/ms, let X = ( 1 F s t ( n ) ) F s t ( m ) and Y = ( 1 F s t ( m ) ) F s t ( n ) . We assume that the covariance c o v ( F s t ( n ) , F s t ( m ) ) is negligible, similar to Hu et al. [55]. Therefore, the variances of X and Y are derived as
V ( X ) = F ¯ s t ( m ) 2 V ( F s t ( n ) ) + ( 1 F ¯ s t ( n ) ) 2 V ( F s t ( m ) ) + V ( F s t ( m ) ) V ( F s t ( n ) ) ,
V ( Y ) = F ¯ s t ( n ) 2 V ( F s t ( m ) ) + ( 1 F ¯ s t ( m ) ) 2 V ( F s t ( n ) ) + V ( F s t ( m ) ) V ( F s t ( n ) ) .
The variance V ( F s t ( m ) F s t ( n ) ) is
V ( F s t ( m ) F s t ( n ) ) = F ¯ s t ( m ) 2 V ( F s t ( n ) ) + F ¯ s t ( n ) 2 V ( F s t ( m ) ) + V ( F s t ( m ) ) V ( F s t ( n ) ) .
The covariance c o v ( X , Y ) is estimated as
c o v ( X ,   Y ) = F ¯ s t n ( 1 F ¯ s t ( m ) ) V ( F s t ( m ) ) F ¯ s t ( m ) ( 1 F ¯ s t n ) V ( F s t ( n ) ) + V ( F s t ( m ) ) V ( F s t ( n ) )
From Lynch and Walsh [56], the variance of mp/ms is estimated by
V ( m p m s ) = V ( X Y ) = ( X ¯ Y ¯ ) 2 [ V ( X ) X ¯ 2 + V ( Y ) Y ¯ 2 2 c o v ( X ,   Y ) X ¯ Y ¯ ] .
The Jacknife method was applied to estimate variances of F s t ( m ) and F s t ( n ) with FSTAT [57], which were then used to calculate the variance V   ( m P / m S ) according to Equation (9).

3. Results

3.1. Haplotype Analysis

Among the twenty pairs of mtDNA primers investigated (Table S1), two primers for cox1−nad1 and 26S−rRNA−tRNA−Leu were successfully screened for generating polymorphisms among individuals. Sequences of these two fragments were aligned and concatenated to produce a length of 1242 bp for downstream analyses (Table S2 for 500 individuals). Across 500 sampled individuals, 14 haplotypes were identified (H1–H14) (Figure 2). The two most frequent haplotypes (H02 and H09) accounted for 55% of all samples. H2 was the most common haplotype and occurred in 12 populations. Figure 1 shows the geographical distribution of different haplotypes across 29 populations, with the number of haplotypes per population ranging from one to four (Figure 1).
Table 2 shows the haplotype and nucleotide diversity in 29 populations. The haplotype diversity ranged from 0.000 to 0.508, with the average diversity of 0.190 (±0.202). Population Simao (SM) in Yunnan Province, had the highest diversity, h = 0.5078, followed by Huangshan (HS, h = 0.50) in Anhui Province and Nanping (NP, h = 0.50) in Fujian Province. The nucleotide diversity was relatively higher in Yunfu (YF, π = 0.00171) in Guangdong Province, Jinggangshan (JG, 0.00173) in Jiangxi Province, and Wuyishan (WY, 0.00148) in Fujian Province, and less than 0.001 in the remaining twenty-nine populations. Average nucleotide diversity was 0.000383 (±0.000536).
We obtained 467 haploid ITS sequences after removing some sequences of low quality (Table S3). The length of aligned haploid ITS sequences was 622 bp. Nucleotide diversity ranged from 0.0011 in Xianju (XJ) in Zhejiang Province to 0.0322 in Baoshan (BS) in Yunnan Province, with the average diversity of 0.00837 (±0.000783). The effective population size-scaled mutation rate θ ranged from 0.0024 in Xianju (XJ) to 0.038 in BS, with the mean of 0.01262 (±0.009653). Populations HS ( θ = 0.036) and WY ( θ = 0.032) also maintained higher population diversity (Table 2).

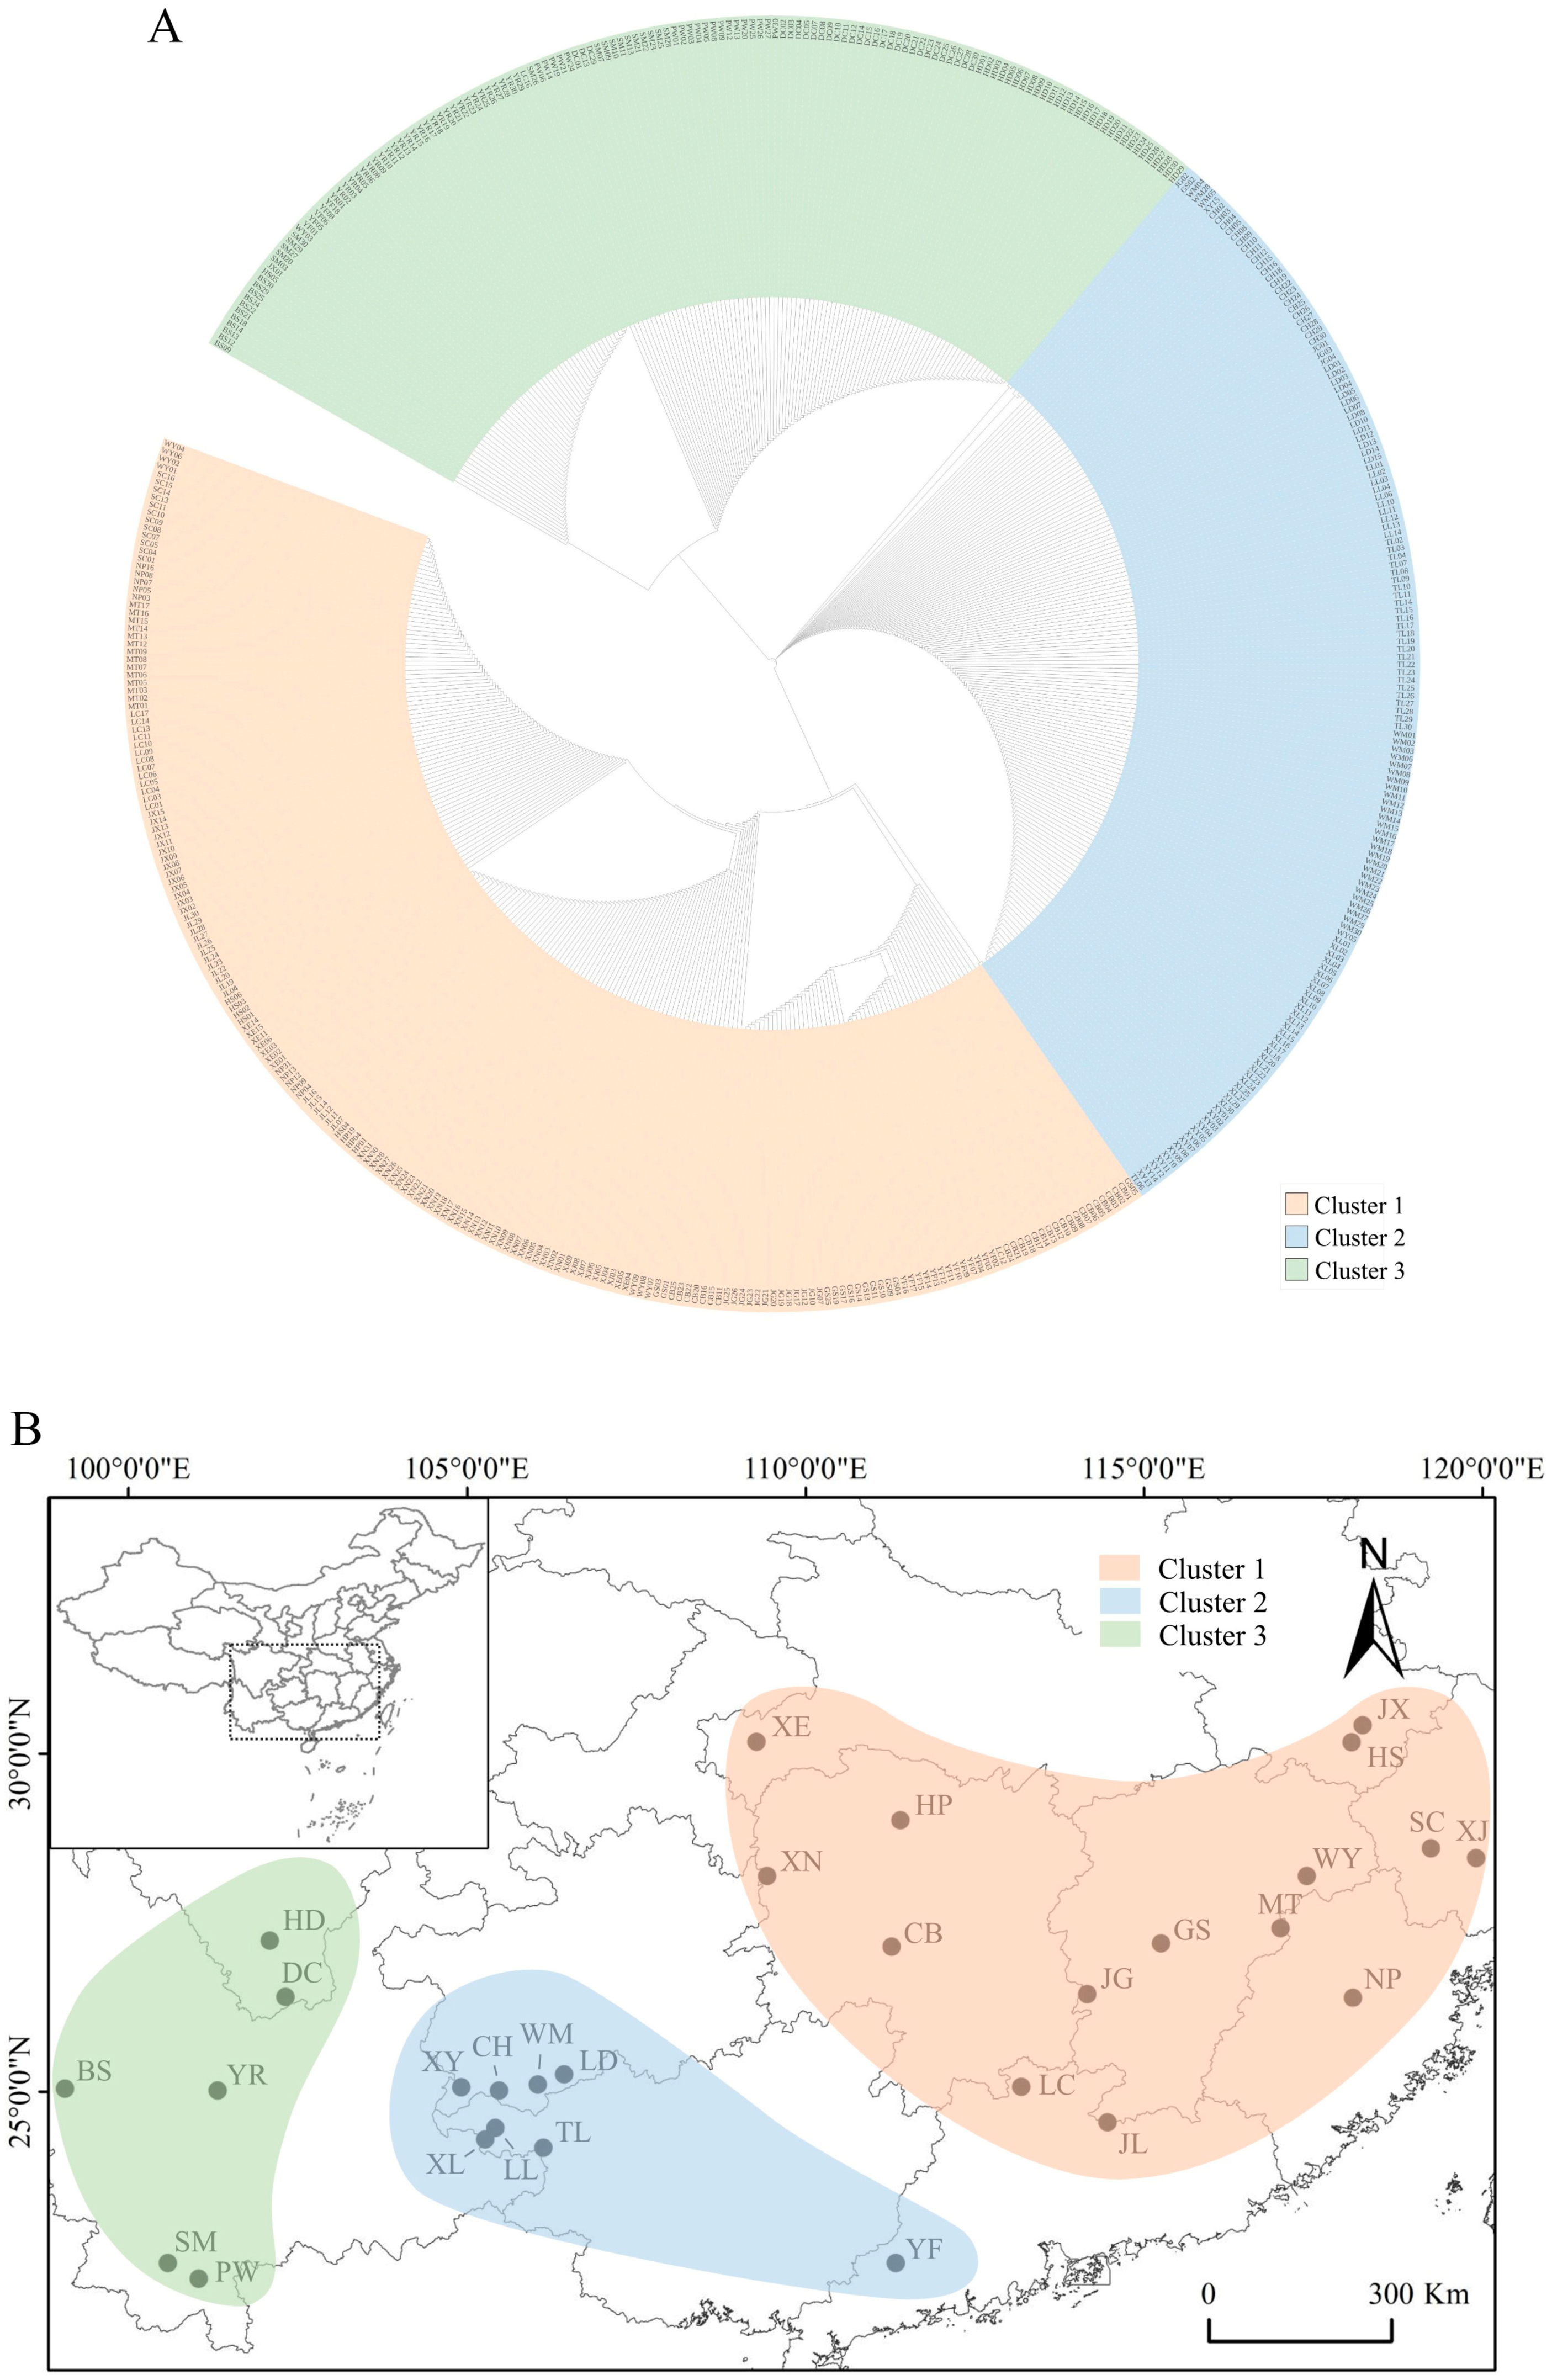
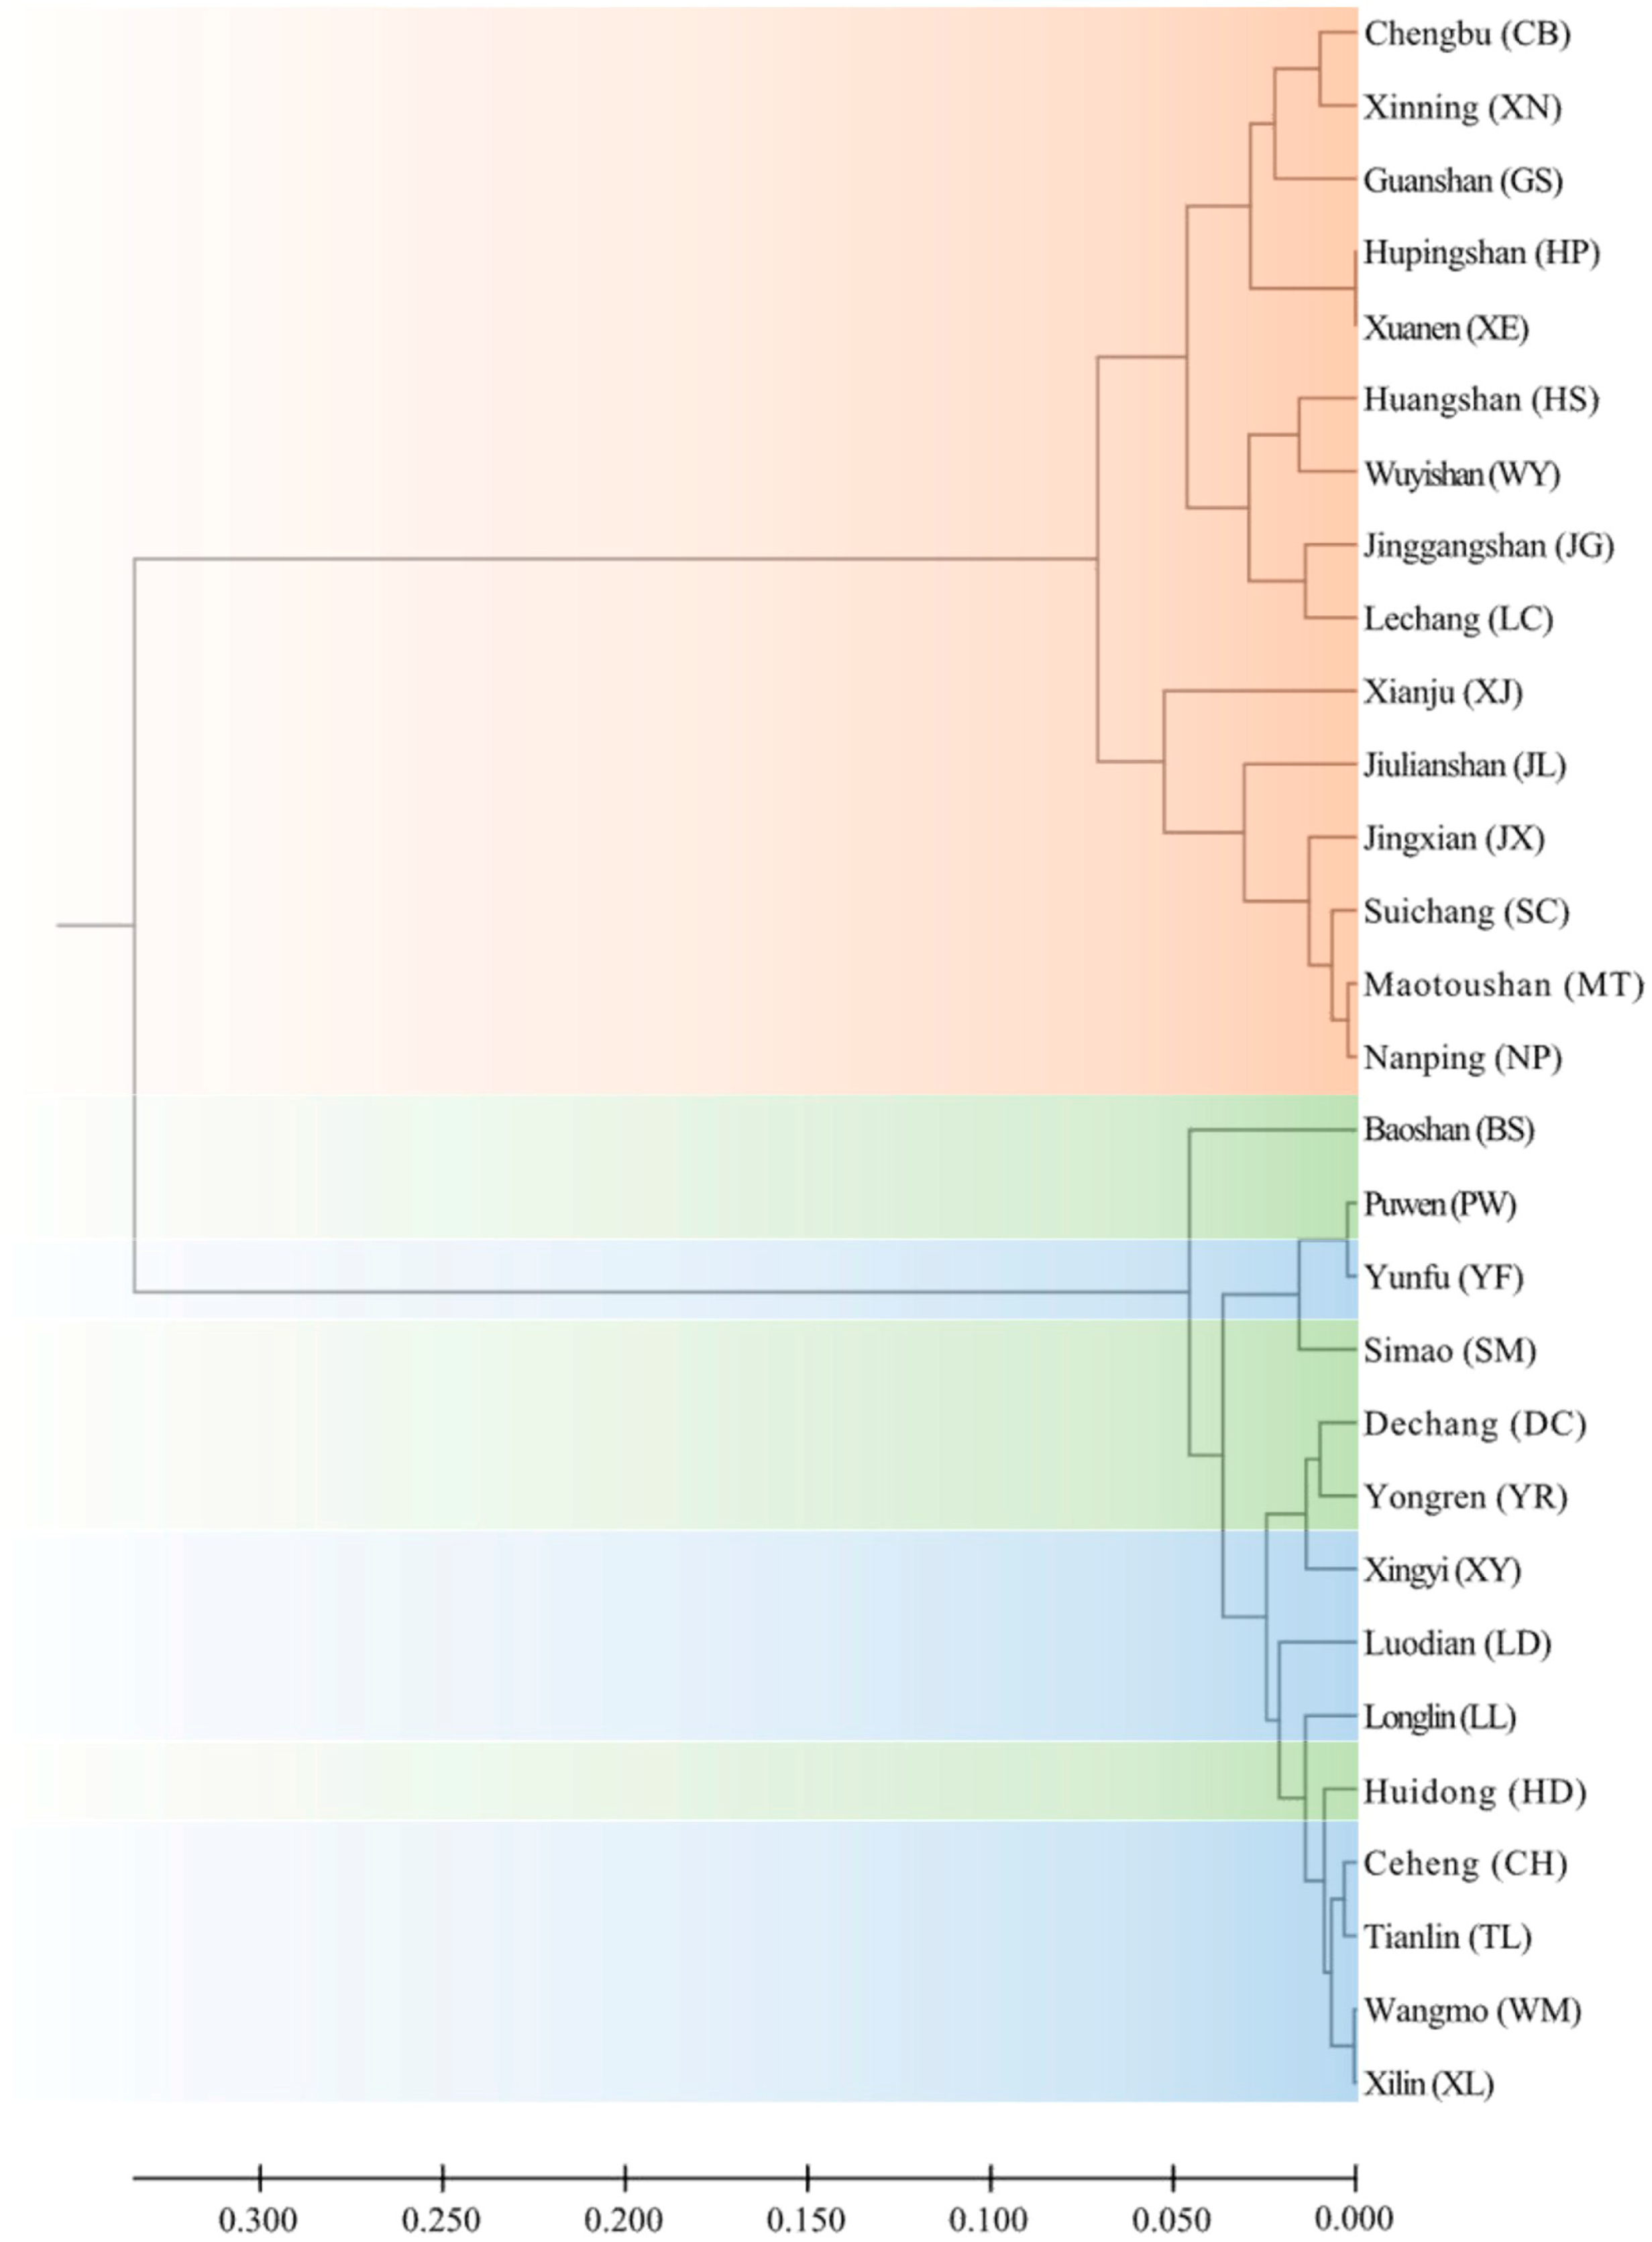
3.2. Population Genetic Structure

Analysis of molecular variance (AMOVA) indicated that significant genetic differentiation occurred among populations (Table 3). Estimates of ϕ s t using mtDNA markers were 0.8858 for cox1−nad1, 0.8901 for 26S−rRNA−tRNA−Leu, and 0.8884 for their concatenated sequences. The estimate of ϕ s t   using nrDNA ITS marker was 0.7143.
Population differentiation based on sequence divergence ( N s t ) for mtDNA marker was 0.8670, while population differentiation based on allele frequency ( G s t ) was 0.7744. N s t was significantly greater than G s t (p < 0.05). Likewise, the N s t estimate for haploid nrDNA ITS sequences was 0.6957, which was significantly greater than G s t (=0.0918). Both analyses indicated that phylogeographic structure occurred for haplotype distribution in space (Figure 1 for mtDNA marker).
Figure 3 indicates that a significant relationship existed between F s t / ( 1 F s t ) and geographic distance, where F s t / ( 1 F s t ) = 2.8412 + 4.5181 ln (distance), R 2 = 0.0464 (p-value = 0.00016) for the concatenated mtDNA sequences, and F s t / ( 1 F s t ) = 0.6275 + 1.4463 ln (distance), R 2 = 0.0895, and p-value = 1.57 × 10⁻⁹ for ITS sequences. These results indicated that significant IBD effects occurred among range-wide populations of T. ciliata complex.
Phylogenetic relationships among individuals using mtDNA markers indicated that three clusters were explicitly grouped among 500 individuals (Figure 4A), When mapped to their geographic positions, these three clusters respectively represented the eastern, central, and western regions of the natural distribution of T. ciliata complex (Figure 4B). For instance, the mtDNA haplotype H09 that was dominated in the central region did not occur in either the eastern region or the western region (Figure 1). The eastern region covered Anhui, Fujian, Hubei, Hunan, Jiangxi, Zhejiang, and Eastern Guangdong Provinces. The central region covered Guangxi, Guizhou, and Southwest Guangdong Provinces. The western region mainly included Sichuan and Yunnan Provinces. The mtDNA haplotype and nucleotide diversity, on average, were greater in the eastern region ( h = 0.2511 ± 0.2068, π = 0.00052 ± 0.00057) than in the western region ( h = 0.1803 ± 0.2227, π = 0.00021 ± 0.00031) or in the central region ( h = 0.0819 ± 0.1439, π = 0.00025 ± 0.00059). However, the nucleotide diversity for ITS sequences was π = 0.00842 ± 0.0087 and θ = 0.0124 ± 0.0112 in the eastern region, π = 0.0069 ± 0.0022 and θ = 0.012 ± 0.0038 in the central region, and π = 0.0102 ± 0.0108 and θ = 0.0140 ± 0.0120 in the western region.
Regression analyses indicated that IBD effects were insignificant within each of three regions. However, significant IBD effects occurred among populations within the combined eastern and central regions (p-value = 7.8 × 10⁻⁵) or within the combined western and central regions (p-value = 6.7 × 10⁻⁷). This supported that the natural distribution of T. ciliata complex could be divided into three genetically differential groups in terms of mtDNA marker.
Analysis of genetic differentiation indicated that there was significant difference between the eastern and central regions ( ϕ s t = 0.7799 for the mtDNA marker and 0.8106 for ITS marker, p-value < 0.001), between the central and western regions for mtDNA marker ( ϕ s t = 0.6252, p-value < 0.001) but not for ITS marker ( ϕ s t = 0.004, p-value = 0.06), and between the eastern and western regions ( ϕ s t = 0.7100 for mtDNA marker, 0.7938 for ITS marker, p-value < 0.001). Differentiation among three regions was significant ( ϕ s t = 0.9015 for mtDNA marker, 0.7143 for ITS marker, p-value < 0.001).
Phylogenetic relationship from ITS sequences indicated that two clusters could be grouped among twenty-nine populations (Figure 5). One cluster corresponded to the eastern region derived from the concatenated mtDNA marker, while the other cluster corresponded to the combined central and western regions (Figure 4). Analysis of IBD effects indicated that there were no significant effects in the eastern region, F s t / ( 1 F s t ) = 0.1183 + 0.0246 ln (distance) ( R 2 = 0.0096, p-value = 0.3189), but significant effects in the combined central and western region, F s t / ( 1 F s t ) = 0.0621 + 0.0356 ln (distance) ( R 2 = 0.1211, p-value = 0.0007).
A significantly positive correlation occurred between F s t and elevation with 29 populations (the correlation coefficient r = 0.2111, p-value = 0.00022 for the mtDNA marker; r = 0.1312, p-value = 0.0094 for the ITS marker). However, correlation between F s t and elevation was insignificant in both the western (r=0.0176, p-value = 0.9566) and central (r = 0.2668, p-value = 0.4018) regions, but significant in the eastern region (r = −0.2644, p-value = 0.0219) for the mtDNA marker. Similarly, correlation between F s t and elevation was insignificant in the western and central regions (r = 0.0198, p-value = 0.8554) but significant in eastern region (r = −0.2141, p-value = 0.0372) for the ITS marker.

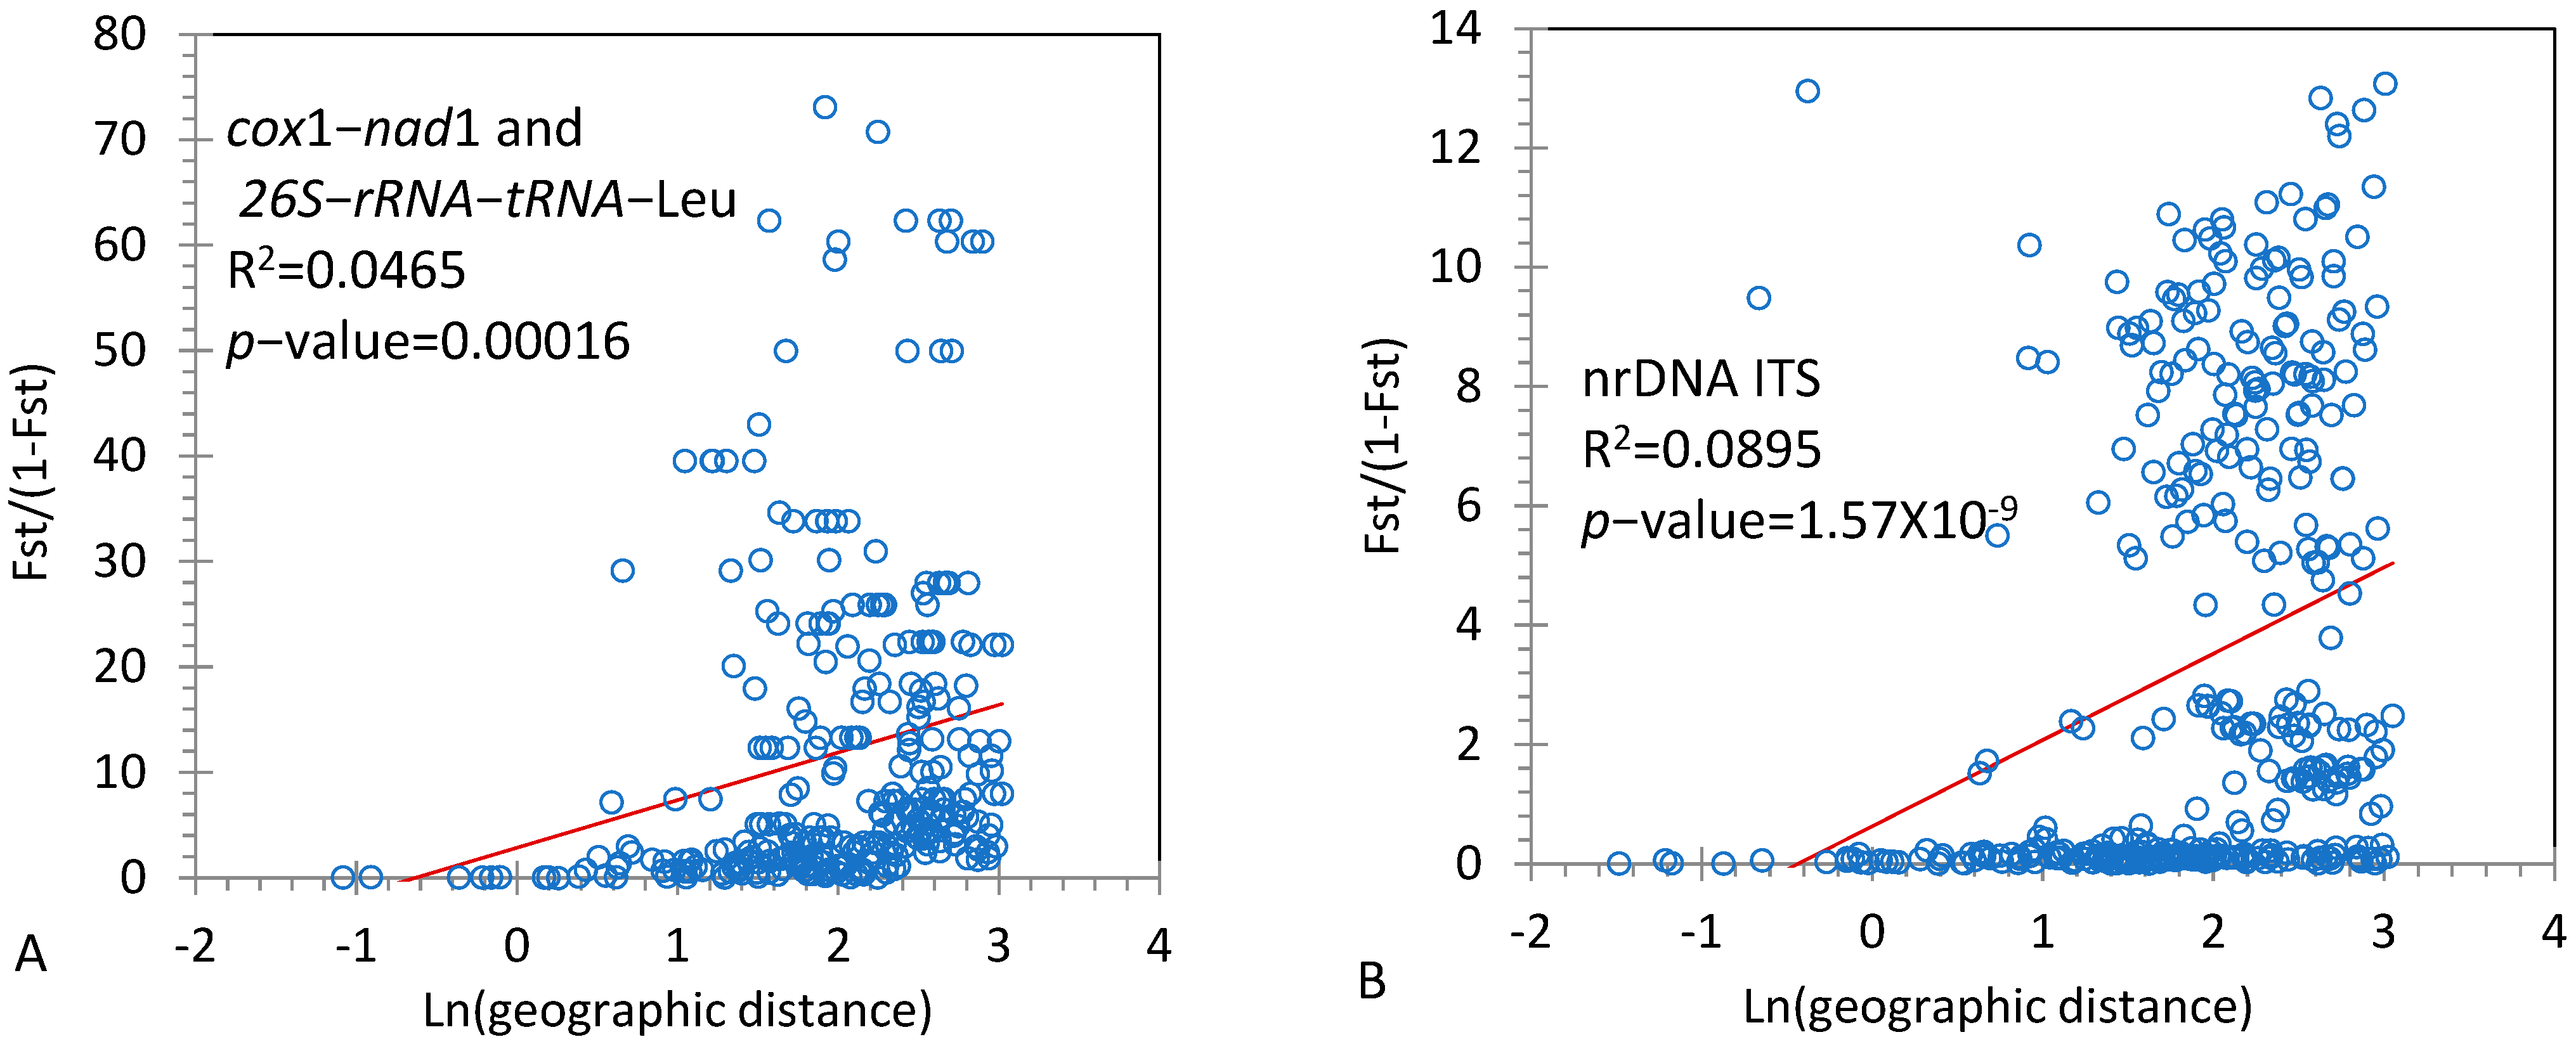
3.3. Relative Rate of Pollen to Seed Flow

Based on population genetic differentiation derived from both ITS and mtDNA markers and Equations (4) and (9), we calculated the relative rate of pollen to seed flow (Table 4). Pollen flow was much greater than seed flow in the western region ( m P / m S = 31.4134 ± 13.2330) and in the combined western and central regions (47.9628 ± 0.8091). Both seed and pollen flow were comparable, or seed flow could be even more extensive than pollen flow in the central region (−1.495 ± 0.0454). Pollen flow was slightly greater than seed flow in the eastern region (3.2270 ± 2.5527) and in the global region (1.3741 ± 0.2925). In general, pollen flow is more frequent in the western region but less frequent in the eastern region in the natural distribution of T. ciliata complex.

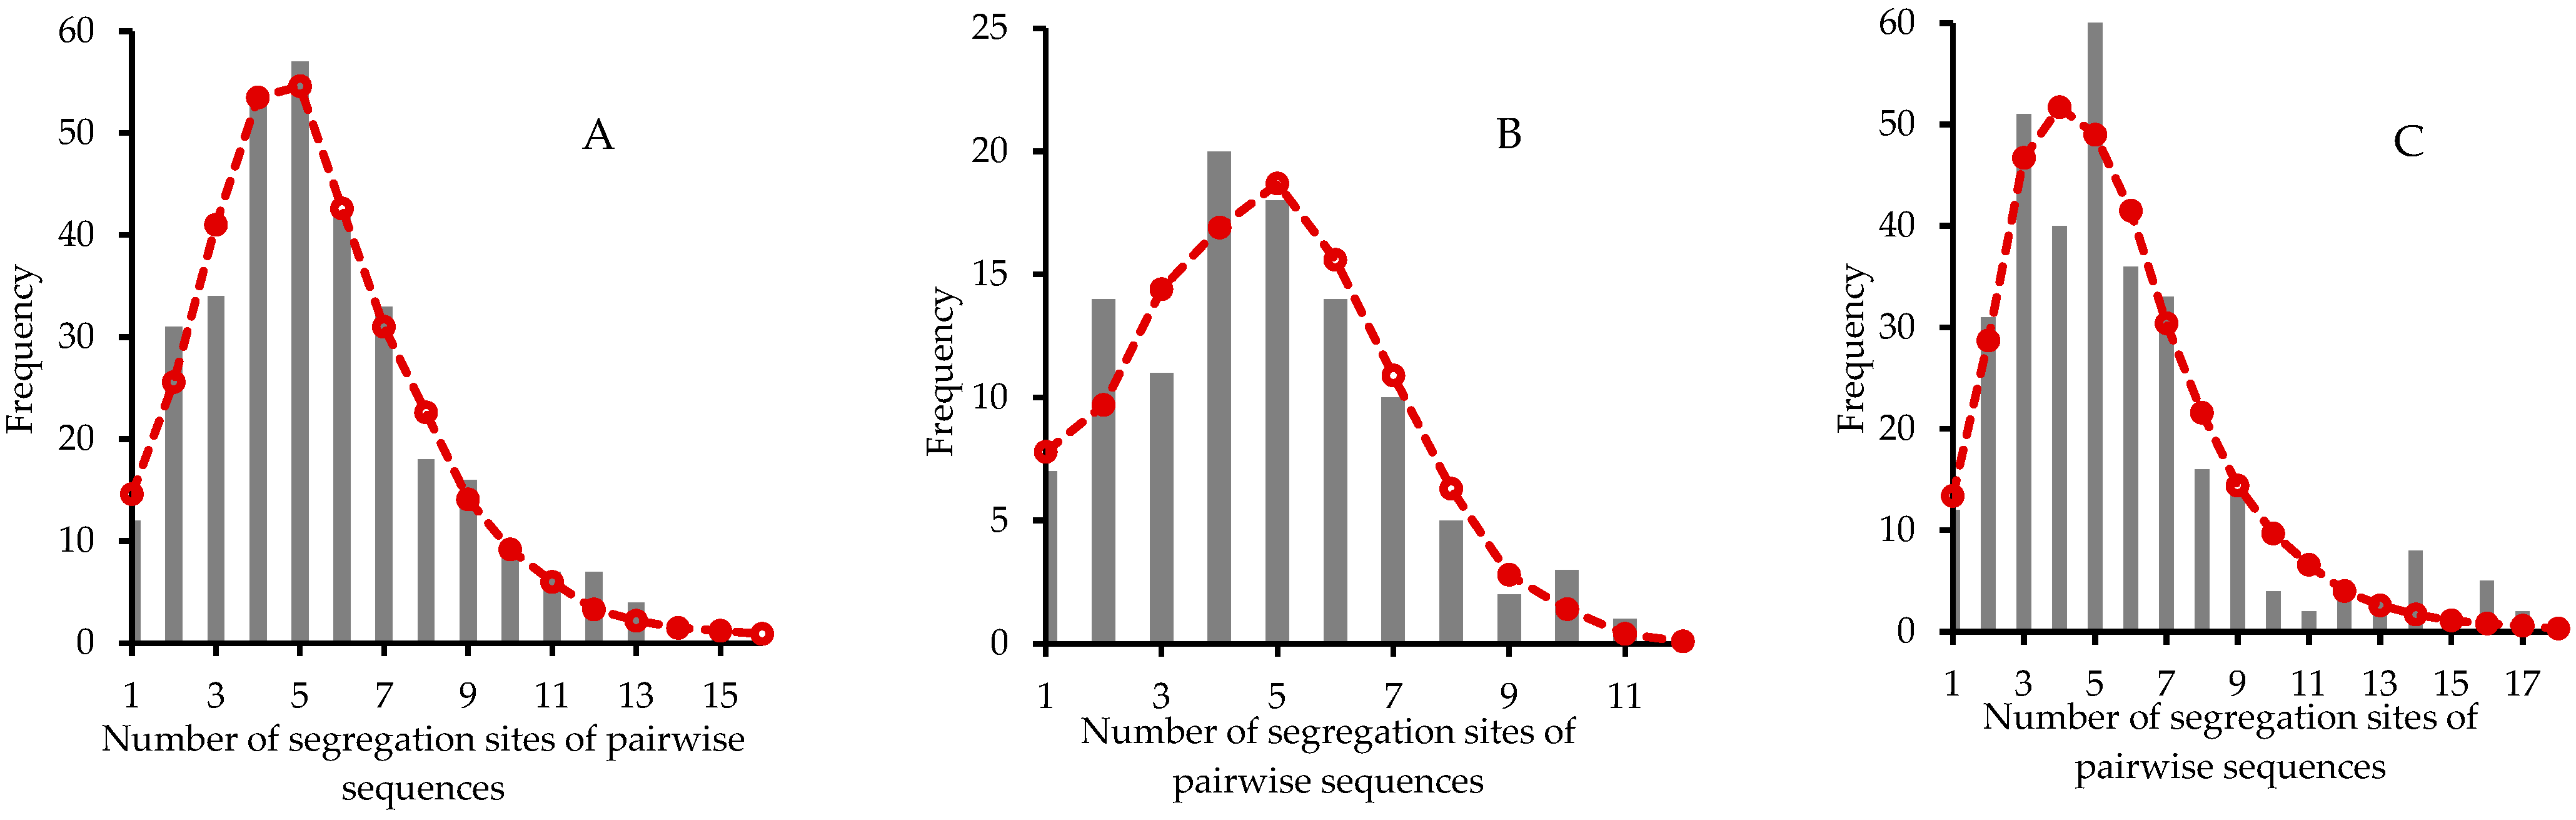
3.4. Population Demographic Analyses

Neutrality test with the ITS sequences indicated that both Tajima’s D and Fu’s F values were negative in most populations (Table 2). Seven populations had significant Tajima’s D values (p-value < 0.05) while nine populations had significant Fu’s F values (p-value < −0.05). Only three populations exhibited significantly negative values of both Tajima’s D and Fu’s F values, including Xilin (XL) in Guangxi Province, Luodian (LD), and Wangmo (WM) in Guizhou Province. The three populations were in the central region and potentially underwent an expansion after bottleneck effects. In general, the whole population-based test did not show a significant departure from neutrality when the significance level was adjusted by Bonferroni correction ( α = 0.05/29 = 0.0017).
Analysis of mismatch distribution indicated that populations with significant Tajima’s D or Fu’s F did not substantially expand (Table S2) although these populations except TL and XJ fit for a single-peaked Poisson distribution (Table S2; p-value > 0.05). Figure 6 shows the mismatch distribution of three populations (XL, LD and WM) with significant values of two tests. With population XL, the sum of squared deviation (SSD) was 0.002 (p-value = 0.84) and Harpending’s raggedness index (Rag) was 0.013 (p-value = 0.86). Other estimates of parameters were θ 1 = 2 N 1 μ = 37.285 >   θ 0 = 2 N 0 μ = 1.552, and the time elapsed since a sudden expansion episode τ = 2 μ t = 3.131. Similarly, with population LD, we obtained SSD = 0.003 (p-value = 0.94), Rag = 0.020 (p-value = 0.92), θ 1 = 14.214, θ 0 = 0.028, and τ   = 4.205. With population WM, estimates of demographic expansion were SSD = 0.005 (p-value = 0.53), Rag = 0.023 (p-value = 0.55), θ 1 = 50.859, θ 0 = 1.872, and τ   = 2.607. These local populations possibly underwent an expansion after bottleneck effects to different extents. Thus, in general, T. ciliata complex potentially underwent a weak expansion in some local regions but did not exhibit a substantially global expansion.

4. Discussion

4.1. Genetic Diversity

In this study, we used both nrDNA ITS and mtDNA markers to investigate phylogeographic pattern of T. ciliata complex. Both marker analyses indicated the presence of phylogeographic structure ( N s t > G s t ). Different haplotypes were not randomly distributed in space. The average haplotype diversity was h = 0.190 ± 0.202 and the average nucleotide diversity was π = 0.000383 ± 0.000536 for mtDNA markers. The average nucleotide diversity was π = 0.00837 ± 0.000783 for ITS sequences. The haplotype diversity for mtDNA marker was the highest in the eastern region, followed by the eastern region and then the central region. The genetic diversity in the central region was also the smallest among three regions for ITS sequences.
No significant deviation from neutrality was detected in nrDNA ITS sequences in most populations. The overall level of nucleotide diversity derived from ITS sequences in T. ciliata complex was greater than those found in other plant species, such as Primula obconica (average π = 0.00122 for Eastern group and 0.00739 for Yunnan group of Lineage A; 0.00144 for Sichuan group and 0.00164 for Central group of Lineage B) [58], Tamarix Chinese ( π = 0.00217) [23] and Achyranthes bidentata ( π = 0.00188) [59], but smaller than or comparable to Spiraea alpina ( π ranging from 0 to 0.01) [22]. The overall level of haplotype or nucleotide diversity derived from mtDNA markers was relatively smaller than those found in other angiosperms, such as Cucurbita moschata (average π = 0.0023, h = 0.316) [60], Medicago sativa ( h = 0.583 for whole cultivated pool and h = 0.821 for wild pool) [61], and Fagus crenata ( h = 0.833) [62]. Our results suggest that a smaller genetic diversity of mtDNA marker but a certain level of genetic diversity of nrDNA ITS marker were present in the extant natural populations of this endangered species.

4.2. Population Genetic Structure

Analysis of genetic structure indicated that significant and substantial genetic variation occurred among populations within T. ciliata complex. The results from nrDNA ITS marker consolidate previous findings derived from nuclear SRAP and SSR markers [12,13] where two clusters of populations (eastern and western regions) were classified in the natural distribution of T. ciliata complex. However, the results from mtDNA markers suggest three genetically differential regions. These three regions have three levels of elevations that increase from the eastern region (617.34 ± 264.19 m) to the central region (732.37 ± 250.87 m) and to the western region (1407.67 ± 321.81 m). Although IBD effects were significant across 29 populations, they were absent within each of three regions in terms of mtDNA markers. This suggests that geographical distance did not significantly impede seed dispersal within each region, but globally impeded seed dispersal in the natural distribution of T. ciliata complex.
The difference in genetic structure between mtDNA and nrDNA markers is related to the effects of pollen flow on genetic variation of nrDNA markers and to the reproductive ecology of T. ciliata. Its predominantly outcrossing system enhances pollen flow [15]. Pollen dispersal is realized mainly through wind whereas seed dispersal is mediated by wind and animals in T. ciliata. Generally, pollen dispersal can travel a longer distance than seed dispersal for predominantly outcrossing species [25]. Gene flow for the maternally inherited mtDNA markers is mediated through seed dispersal only. As expected in theory [25,26], population genetic differentiation was greater for mtDNA markers than for nrDNA markers in western and eastern regions. However, this was not the case in the central region where F s t ( n ) for the ITS marker was smaller than F s t ( m ) for the mtDNA marker. One possible explanation is that both seed and pollen dispersal were extensive in the central region, yielding small population differentiation (Table 4). When seed flow was more restricted within the central region while pollen flow was less restricted, including alien genes immigrated from distant regions, this could lead F s t ( n ) to be greater than F s t ( m ) . The populations investigated in the central region are located at elevations below 1200 m and are in the southern region between the Hengduan and Xuefeng Mountains. Physical barrier to seed dispersal could be weak in the south region. The insignificant correlations between F s t ( n ) and elevation or between F s t ( m ) and elevation support that elevation did not significantly affect seed or pollen flow in the central region. However, barrier would be strong to westward seed dispersal due to high plateaus and mountains at elevations above 1000 m. Thus, long distance gene flow from the central region to the western region is less frequent than the reverse directional gene flow. This could probably explain why F s t ( n ) was greater than F s t ( m ) in the central region.
In the western region, barriers to seed dispersal could be strong due to the Hengduan Mountains (7556 m above sea level at the highest peak). Populations investigated in this study cover both the north (HD, and DC) and south (SM and PW) regions of the Hengduan Mountains. Populations BS and YR are almost in the middle region of the Hengduan Mountains. Barrier to seed flow is expected to be greater than that to pollen flow although elevation did not significantly affect population genetic differentiation. This is because all populations except PW are located at comparable elevations (above 1300 m). As a result, the ratio of pollen to seed flow was much greater than 1 (Table 4 ).
In the eastern region, IBD effects were insignificant for both mtDNA and nrDNA ITS markers, implying that barriers to both seed and pollen flow were weak. Most investigated populations except WY are located at elevations below 1000 m. As expected, the ratio of pollen to seed flow was not much greater than 1, implying the presence of a certain level of seed flow among populations. The negative correlation between F s t ( n ) and elevation, or between F s t ( m ) and elevation, implies weak barriers to seed and pollen flow in the eastern region.
IBD effects were significant at the global level, implying limited seed and pollen flow. In addition, significant correlation between F s t ( n ) (or F s t ( m ) ) and elevation implies effects of elevation on population differentiation at the global level as well. This is analogous to the case of Machilus pauhoi [63], where high mountains as a physical barrier to gene flow generated substantial population genetic differentiation.

4.3. Genetic Conservation

Analyses of Tajima’s D and Li and Fu’s F imply that most populations did not undergo recent expansion. Only three populations (XL, LD, and WM) had significantly negative values of Tajima’s D and Fu and Li’s F. Analysis of mismatch distribution supported that these populations potentially had expansion after bottleneck effects. These results imply that T. ciliata complex could undergo recent expansion in some local regions. One caution is that we only used nrDNA ITS sequences to detect bottleneck effects, which could limit the power of disentangling selection and demography due to their similar footprints in DNA polymorphism. The demographic change causes the entire genome variation while selection brings about regional variations along genomes. Thus, further analysis with multiple genes could help to elucidate these two processes [24].
Previous simulations with the model of maximum entropy (MaxEnt) using 19 climate variables predicted that the most adaptive regions for T. ciliata would not substantially shift from 2000 to 2050 year, relative to the adaptive regions in 1950–2000 year [64]. Future climate changes could expand northward in some local regions but shrink in southern regions for most subtropical or tropical species, which is often addressed under climate changes [30,65]. Hu [64] showed that annual and seasonal temperatures are the most key factors to influence the distribution of T. ciliata, followed by seasonal precipitation. Based on the MaxEnt model, Zhang et al. [66] predicted that the adaptive region for T. ciliata var. ciliata would potentially expand as climate changes in the future. However, Zhang et al. [67] predicted that the adaptive region for T. ciliata var. pubescens would shrink in Yunnan Province. These results suggest that the natural distribution of T. ciliata complex would not substantially shift in the future.
The phylogeographic patterns derived from both nrDNA and mtDNA markers provide insight into genetic conservation of this endangered species. In general, we need to consider multiple regions because of the significant IBD effects at the global scale and substantial genetic differentiation among regions. In both western and eastern regions, multiple populations deserve conservation because a certain level of population genetic differentiation occurred for both nuclear and organelle markers within each region. Those populations with higher haplotype diversity deserve protection. However, only a couple of populations could be appropriate for conservation in the central region. This is because population genetic differentiation was small for both nuclear and mitochondrial markers. The haplotype diversity within populations was low as well. Gene flow was extensive within the central region.
Division into three regions is probably supported from the results in a provenance trial of T. ciliata complex [8]. This experiment was set up in December of 2013 at Yuejin North Experiment Station, South China Agricultural University. The climate condition of the experimental station belongs to the subtropical monsoon marine, with the annual average temperature of 20~22 °C and the annual rainfall of about 1696.5 mm. Eighteen populations investigated in this study were covered, including four populations from the western region (BS, YR, SM, and PW), seven populations from the central region (YF, LL, TL, XL, LD, WM, and XY), and seven populations from the eastern region (HS, NP, LC, XE, CB, GS, and JG). The mean height of one-year-old seedlings was 89.63 ± 3.46 m for the western populations, 83.48 ± 11.32 m for the central populations, and 29.66 ± 10.51 m for the eastern populations. The same pattern occurred for mean diameter at breast heights (DBH), with the largest DBH from the western populations (25.50 ± 0.67 mm), followed by the central populations (24.34 ± 1.87 mm) and then the eastern populations (10.50 ± 2.41 mm). These results imply the appropriateness of classification of three regions. Thus, a comprehensive strategy could be developed by combing patterns of population structure with the information from provenance trials [68,69].
Our results indicate that pollen flow was more frequent than seed flow in the western and central regions but was slightly greater than seed flow in the eastern region. This could be related to the pattern of mating systems of T. ciliata complex, which was obtained in a separate study with different samples even in the same location [15]. A complete outcrossing system occurred in the populations from the western and central regions (BS, YR, SM and TL), but a predominantly outcrossing system, with selfing and inbreeding, occurred in the populations from the eastern region (NP and GS) [15]. Partial selfing and inbreeding bring about low-quality of seeds and cause low natural regeneration [7]. As discussed by Zhou et al. [15], practices of conventional forest management, such as selective logging and clear-cutting, could yield interbreeding among relatives. These practices of conventional forest management erode genetic diversity and destroy habitats. Thus, attention to the role of mating system is important for in situ conservation, especially in the eastern region, as implied by this study.

5. Conclusions

T. ciliata is an endangered tree species in China due to over cutting and its low natural regeneration. Currently, an important concern is its genetic conservation. In this study, we used both mtDNA and nrDNA ITS markers to elucidate the phylogeographic pattern of T. ciliata complex. We investigated twenty-nine populations that covered the range-wide distribution of T. ciliata complex in China. Specific conclusions could be drawn below: (1) Haplotypes of mtDNA markers were not randomly distributed in space and phylogeographic structure existed. (2) Population genetic differentiation was significant and most genetic variation occurred among populations. Isolations by distance (IBD) and by elevation (IBE) were present at the global scale. (3) Phylogenetic relationship derived from mtDNA markers indicated three genetically distinct regions each without significant IBD effects. The results from nrDNA ITS sequences showed two regions, consolidating previous findings using nrDNA SRAP and SSR markers. (4) The haplotype diversity was the largest in the western region, followed by the eastern region and the central region. Nucleotide diversity was the smallest in the central region. (5) The rate of pollen to seed flow was large in the western region but small in the central region. The rate of pollen to seed flow was slightly greater than 1 in the eastern region. (6) Most populations did not undergo expansion, with only a few populations showing expansion after bottleneck effects. Based on these phylogeographic patterns, we discussed a strategy of region-based genetic conservation and proposed to conserve multiple populations in the western and eastern regions and a few populations in the central region.

Supplementary Materials

The following supporting information can be downloaded at: https://www.mdpi.com/article/10.3390/genes14010116/s1. Table S1: Twenty pairs of primers from mitochondrial DNA tested in T. ciliata complex. Table S2: Five hundred samples of alignment sequences each of which was a concatenated sequence of cox1−nad1 and 26SrRNAtRNA−Leu segments. Table S3: Four hundred and sixty-seven samples of ITS alignment sequences. Table S4: Estimates of parameters of mismatch distribution and statistical tests.

Author Contributions

Y.X. analyzed data and prepared original draft; X.-X.Z. conducted experiment and analyzed data; Y.H. conducted experiment; P.L. provided experiment samples; X.W., Z.-H.H. and Y.-W.L. provided logistic assistance; X.-Y.C. provided experiment support; X.-S.H. designed the study, acquired funding, and edited the manuscript. All authors have read and agreed to the published version of the manuscript.

Funding

This research was funded by National Natural Science Foundation of China, grant number 32171819, and South China Agricultural University, grant number 4400-K16013.

Institutional Review Board Statement

Not applicable.

Informed Consent Statement

Not applicable.

Data Availability Statement

All data sets used in this study were provided in Tables S2 and S3 in Supplementary Materials.

Acknowledgments

We thank three anonymous reviewers for comments on the earlier version of this article.

Conflicts of Interest

The authors declare no conflict of interest. The funders had no role in the design of the study; in the collection, analyses, or interpretation of data; in the writing of the manuscript, or in the decision to publish the results.

References

  1. Chen, S.K.; Li, H.; Chen, B.-Y. Meliaceae. In Flora of China 43; Science Press: Beijing, China, 1997; pp. 40–43. [Google Scholar]
  2. Styles, B.T. The flower biology of Meliaceae and its bearing on tree breeding. Silvae Genet. 1972, 21, 175–182. [Google Scholar]
  3. Edmonds, J.M. The potential value of Toona species (Meliaceae) as multipurpose and plantation trees in Southeast Asia. Commonw. For. Rev. 1993, 72, 181–186. [Google Scholar]
  4. Edmonds, J.M.; Staniforth, M. Toona sinensis (Meliaceae). Curtiss Bot. Mag. 1998, 15, 186–193. [Google Scholar] [CrossRef]
  5. Cheng, D.S.; Cui, T.L. Utilization value and cultivation techniques of Toona sureni. For. By-Prod. Spec. China 2010, 4, 39–40. [Google Scholar] [CrossRef]
  6. Fu, L.K.; Jin, J.M. China Plant Red Data Book: Rare and Endangered Plants; Science Press: Beijing, China, 1992; Volume 1. [Google Scholar]
  7. Liang, R.L.; Liao, R.Y.; Dai, J. Endangered causes and protection strategy of Toona ciliata. Guangxi For. Sci. 2011, 40, 201–203. [Google Scholar] [CrossRef]
  8. Li, P.; Que, Q.M.; Wu, L.Y.; Zhu, Q.; Chen, X.Y. Growth rhythms of Toona ciliata seedlings from different provenances. J. South China Agri. Univ. 2017, 38, 96–102. [Google Scholar] [CrossRef]
  9. Liao, D.; Wu, J.; Shu, Y.; Cheng, Y.; Chen, M.; Chen, J.; Liu, Q.; Wu, Z. Tissue culture of Toona ciliata. Agric. Sci. Technol. 2017, 18, 2185–2187, 2196. [Google Scholar] [CrossRef]
  10. Lan, J.H.; Feng, L.X. Study on cutting propagation technology of rare timber species Toona ciliata Roem. J. Guangxi Agric. 2022, 37, 32–36, 48. [Google Scholar] [CrossRef]
  11. Ennos, R.A.; French, G.C.; Hollingsworth, P.M. Conserving taxonomic complexity. Trends Ecol. Evol. 2005, 20, 164–168. [Google Scholar] [CrossRef]
  12. Li, P.; Zhan, X.; Que, Q.M.; Qu, W.T.; Liu, M.Q.; OuYang, K.X.; Li, J.C.; Deng, X.M.; Zhang, J.J.; Liao, B.Y.; et al. Genetic diversity and population structure of Toona ciliata Roem. based on sequence-related amplified polymorphism (SRAP) markers. Forests 2015, 6, 1094–1106. [Google Scholar] [CrossRef] [Green Version]
  13. Zhan, X.; Li, P.; Hui, W.K.; Deng, Y.W.; Gan, S.M.; Sun, Y.; Zhao, X.H.; Chen, X.Y.; Deng, X.M. Genetic diversity and population structure of Toona ciliata revealed by simple sequence repeat markers. Biotechnol. Biotechnol. Equip. 2019, 33, 214–222. [Google Scholar] [CrossRef] [Green Version]
  14. Liu, J.; Jiang, J.M.; Chen, Y.T. Genetic diversity of central and peripheral populations of Toona ciliata var. pubescens, an endangered tree species endemic to China. Genet. Mol. Res. 2014, 13, 4579–4590. [Google Scholar] [CrossRef]
  15. Zhou, W.; Zhang, X.X.; Ren, Y.; Li, P.; Chen, X.Y.; Hu, X.S. Mating system and population structure in the natural distribution of Toona ciliata (Meliaceae) in South China. Sci. Rep. 2020, 10, 16998. [Google Scholar] [CrossRef]
  16. Mullner, A.N.; Pennington, T.D.; Koecke, A.V.; Renner, S.S. Biogeography of Cedrela (Mellaceae, Sapindales) in central and south America. Am. J. Bot. 2010, 97, 511–518. [Google Scholar] [CrossRef] [Green Version]
  17. Cavers, S.; Telford, A.; Arenal Cruz, F.; Perez Castaneda, A.J.; Valencia, R.; Navarro, C.; Buonamici, A.; Lowe, A.J.; Vendramin, G.G. Cryptic species and phylogeographical structure in the tree Cedrela odorata L. throughout the netotropics. J. Biogeogr. 2013, 40, 732–746. [Google Scholar] [CrossRef] [Green Version]
  18. Koecke, V.; Muellner-Riehl, A.N.; Pennington, T.D.; Schorr, G.; Schnitzler, J. Niche evolution through time and across continents: The story of neotropical Cedrela (Meliaceae). Am. J. Bot. 2013, 100, 1800–1810. [Google Scholar] [CrossRef]
  19. Koenen, E.J.; Clarkson, J.J.; Pennington, T.D.; Chatrou, L.W. Recently evolved diversity and convergent radiations of rainforest mahoganies (Meliaceae) shed new light on the origins of rainforest hyperdiversity. New Phytol. 2015, 207, 327–339. [Google Scholar] [CrossRef]
  20. Wang, X.; Xiao, Y.; He, Z.H.; Li, L.L.; Song, H.Y.; Zhang, J.J.; Cheng, X.; Chen, X.Y.; Li, P.; Hu, X.S. A chromosome-level genome assembly of Toona ciliata (Meliaceae). Genome Biol. Evol. 2022, 14, evac121. [Google Scholar] [CrossRef]
  21. Wang, X.; Xiao, Y.; He, Z.H.; Li, L.L.; Lv, Y.W.; Hu, X.S. Evolutionary divergence between Toona ciliata and Toona sinensis assayed with their whole genome sequences. Genes 2022, 13, 1799. [Google Scholar] [CrossRef]
  22. Hern, G.; Zhang, F.; Gao, Q.; Fu, P.C.; Xing, R.; Wang, J.; Liu, H.; Chen, S. Molecular phylogeography and intraspecific divergence of Spiraea alpina (Rosaceae) distributed in the Qinghai-Tibetan Plateau and adjacent regions inferred from nrDNA. Biochem. Syst. Ecol. 2014, 57, 278–286. [Google Scholar] [CrossRef]
  23. Sun, L.; Liu, G.; Lu, Y.; Zhang, B.; Zhang, G. Molecular data and ecological niche modelling reveal the phylogeographic pattern of the widespread shrub Tamarix chinensis Lour. (Tamaricaceae) in China. Kew Bull. 2020, 75, 41. [Google Scholar] [CrossRef]
  24. Freeland, J.R.; Petersen, S.D.; Kirk, H. Molecular Ecology; John Wiley & Sons, Ltd.: Publication, UK, 2011. [Google Scholar]
  25. Ennos, R.A. Estimating the relative rates of pollen and seed migration among plant populations. Heredity 1994, 72, 250–259. [Google Scholar] [CrossRef]
  26. Hu, X.S.; Ennos, R.A. Impacts of seed and pollen flow on population differentiation for plant genomes with three contrasting modes of inheritance. Genetics 1999, 152, 441–450. [Google Scholar] [CrossRef]
  27. Nota, K.; Klaminder, J.; Milesi, P.; Bindler, R.; Nobile, A.; van Steijn, T.; Bertilsson, S.; Svensson, B.; Hirota, S.K.; Matsuo, A.; et al. Norway spruce postglacial recolonization of Fennoscandia. Nat. Commun. 2022, 13, 1333. [Google Scholar] [CrossRef]
  28. Schulte, L.; Meucci, S.; Stoof-Leichsenring, K.R.; Heitkam, T.; Schmidt, N.; von Hippel, B.; Andreev, A.A.; Diekmann, B.; Biskaborn, B.K.; Wagner, B.; et al. Larix species range dynamics in Siberia since the Last Glacial captured from sedimentary ancient DNA. Commun. Biol. 2022, 5, 570. [Google Scholar] [CrossRef]
  29. Zhang, L.; Sun, F.F.; Ma, S.M.; Wang, C.C.; Wei, B.; Zhang, Y.L. Phylogeography of Amygdalus mongolica in relation to Quaternary climatic aridification and oscillations in northwestern China. PeerJ 2022, 10, 13345. [Google Scholar] [CrossRef]
  30. Kirschner, P.; Perez, M.F.; Zaveska, E.; Sanmartin, I.; Marquer, L.; Schlick-Steiner, B.C.; Alvarez, N.; Steiner, F.M.; Schonswetter, P. Congruent evolutionary responses of European steppe biota to late Quaternary climate change. Nat. Commun. 2022, 13, 1921. [Google Scholar] [CrossRef]
  31. Doyle, J.J.; Doyle, J.L. A rapid DNA isolation procedure for small quantities of fresh leaf material. Phytochemistry 1987, 19, 11–15. [Google Scholar]
  32. Demesure, B.; Sodzi, N.; Petit, R.J. A set of universal primers for amplification of polymorphic non-coding regions of mitochondrial and chloroplast DNA in plants. Mol. Ecol. 1995, 4, 129–131. [Google Scholar] [CrossRef]
  33. Dumolin-Lapegue, S.; Pemonge, M.H.; Petit, R.J. An enlarged set of consensus primers for the study of organelle DNA in plants. Mol. Ecol. 1997, 6, 393–397. [Google Scholar] [CrossRef]
  34. Duminil, J.; Pemonge, M.H.; Petit, R.J. A set of 35 consensus primer pairs amplifying genes and introns of plant mitochondrial DNA. Mol. Ecol. Notes 2002, 2, 428–430. [Google Scholar] [CrossRef]
  35. Mishra, P.; Kumar, A.; Rodrigues, V.; Shukla, A.K.; Sundaresan, V. Feasibility of nuclear ribosomal region ITS1 over ITS2 in barcoding taxonomically challenging genera of subtribe Cassiinae (Fabaceae). PeerJ 2016, 4, e2638. [Google Scholar] [CrossRef]
  36. Kumar, S.; Stecher, G.; Tamura, K. MEGA7: Molecular evolutionary genetics analysis version 7.0. Mol. Biol. Evol. 2016, 33, 1870–1874. [Google Scholar] [CrossRef]
  37. Librado, P.; Rozas, J. DnaSP v5: A software for comprehensive analysis of DNA polymorphism data. Bioinformatics 2009, 25, 1451–1452. [Google Scholar] [CrossRef] [Green Version]
  38. Watterson, G.A. On the number of segregating sites in genetical models without recombination. Theor. Popul. Biol. 1975, 7, 188–193. [Google Scholar] [CrossRef]
  39. Nei, M.; Li, W.H. Mathematical model for studying genetic variation in terms of restriction endonucleases. Proc. Natl. Acad. Sci. USA 1979, 76, 5269–5273. [Google Scholar] [CrossRef] [Green Version]
  40. Nei, M. Molecular Evolutionary Genetics; Columbia University Press: New York, NY, USA, 1987. [Google Scholar]
  41. Clement, M.; Posada, D.; Crandall, K.A. TCS: A computer program to estimate gene genealogies. Mol. Ecol. 2000, 9, 1657–1660. [Google Scholar] [CrossRef] [Green Version]
  42. Wright, S. The genetical structure of populations. Ann. Eugen. 1951, 15, 323–354. [Google Scholar] [CrossRef]
  43. Pons, O.; Petitt, R.J. Measuring and testing genetic differentiation with ordered versus unordered alleles. Genetics 1996, 144, 1237–1245. [Google Scholar] [CrossRef]
  44. Grivet, D.; Petit, R.J. Chloroplast DNA phylogeography of the hornbeam in Europe: Evidence for a bottleneck at the outset of postglacial colonization. Conserv. Genet. 2002, 4, 47–56. [Google Scholar] [CrossRef]
  45. Meirmans, P.G. Using the AMOVA framework to estimate a standardized genetic differentiation measure. Evolution 2006, 60, 2399–2402. [Google Scholar] [CrossRef] [PubMed]
  46. Excoffier, L.; Laval, G.; Schneider, S. Arlequin (version 3.0): An integrated software package for population genetics data analysis. Evol. Bioinform. 2005, 1, 47–50. [Google Scholar] [CrossRef] [Green Version]
  47. Wright, S. Isolation by distance. Genetics 1943, 28, 114–138. [Google Scholar] [CrossRef]
  48. Rousset, F. Genetic differentiation and estimation of gene flow from F-statistics under isolation by distance. Genetics 1997, 145, 1219–1228. [Google Scholar] [CrossRef]
  49. Mantel, N. The detection of disease clustering and a generalized regression approach. Cancer Res. 1967, 27, 109–220. [Google Scholar]
  50. Nei, M. Genetic distance between populations. Am. Nat. 1972, 106, 283–292. [Google Scholar] [CrossRef]
  51. Tajima, F. Statistical method for testing the neutral mutation hypothesis by DNA polymorphism. Genetics 1989, 123, 585–595. [Google Scholar] [CrossRef]
  52. Fu, Y.X. Statistical tests of neutrality of mutations against population growth, hitchhiking and background selection. Genetics 1997, 147, 915–925. [Google Scholar] [CrossRef]
  53. Rogers, A.R.; Harpending, H. Population growth makes waves in the distribution of pairwise genetic differences. Mol. Biol. Evol. 1992, 9, 552–569. [Google Scholar] [CrossRef]
  54. Wright, S. Evolution and the Genetics of Populations; University Chicago Press: Chicago, IL, USA, 1969; pp. 1191–1192. [Google Scholar]
  55. Hu, X.S.; Yeh, F.C.; Hu, Y.; Deng, L.T.; Ennos, R.A.; Chen, X.Y. High mutation rates explain low population genetic divergence at copy-number-variable loci in Homo sapiens. Sci. Rep. 2017, 7, 43178. [Google Scholar] [CrossRef] [Green Version]
  56. Lynch, M.; Walsh, B. Genetics and Analysis of Quantitative Traits; Sinauer Associates: Sunderland, UK, 1998; pp. 817–819. [Google Scholar]
  57. Goudet, J. FSTAT v-1.2: A computer program to calculate F-statistics. J. Hered. 1995, 86, 485–486. [Google Scholar] [CrossRef]
  58. Yan, H.F.; Zhang, C.Y.; Wang, F.Y.; Hu, C.M.; Ge, X.J.; Hao, G. Population expanding with the phalanx model and lineages split by environmental heterogeneity: A case study of Primula obconica in subtropical China. PLoS ONE 2012, 7, e41315. [Google Scholar] [CrossRef]
  59. Miao, C.Y.; Yang, J.; Mao, R.L.; Li, Y. Phylogeography of Achyranthes bidentata (Amaranthaceae) in China’s warm-temperate zone inferred from chloroplast and nuclear DNA: Insights into population dynamics in response to climate change during the Pleistocene. Plant Mol. Biol. Rep. 2017, 35, 166–176. [Google Scholar] [CrossRef]
  60. Hernández-Rosales, H.S.; Castellanos-Morales, G.; Sánchez-de la Vega, G.; Aguirre-Planter, E.; Montes-Hernández, S.; Lira-Saade, R.; Eguiarte, L.E. Phylogeographic and population genetic analyses of Cucurbita moschata reveal divergence of two mitochondrial lineages linked to an elevational gradient. Am. J. Bot. 2020, 107, 510–525. [Google Scholar] [CrossRef]
  61. Muller, M.H.; Prosoeri, M.; Santoni, S.; Ronfort, J. Inferences from mitochondrial DNA patterns on the domestication history of alfalfa (Medicago sativa). Mol. Ecol. 2003, 12, 2187–2199. [Google Scholar] [CrossRef] [Green Version]
  62. Tomaru, N.; Takahashi, M.; Tsumura, Y.; Takahashi, M.; Ohba, K. Intraspecific variation and phylogeographic patterns of Fagus crenata (Fagaceae) mitochondrial DNA. Am. J. Bot. 1998, 85, 629–636. [Google Scholar] [CrossRef]
  63. Zhu, Q.; Liao, B.Y.; Li, P.; Li, J.C.; Deng, X.M.; Hu, X.S.; Chen, X.Y. Phylogeographic pattern suggests a major eastward dispersal in the distribution of Machilus pauhoi in South China. PLoS ONE 2017, 12, 0184456. [Google Scholar] [CrossRef] [Green Version]
  64. Hu, Y. Phylogeographic Structure of Toona ciliata (Meliaceae) in China Inferred from cpDNA Markers and Ecological Niche Model Analyses. Master’s Thesis, South China Agricultural University, Guangzhou, China, 2019. [Google Scholar] [CrossRef]
  65. Tovar, C.; Carril, A.F.; Gutierrez, A.G.; Ahrends, A.; Fita, L.; Zaninell, P.; Flombaum, P.; Abarzúa, A.M.; Alarcón, D.; Aschero, V.; et al. Understanding climate change impacts on biome and plant distributions in the Andes: Challenges and opportunities. J. Biogeogr. 2022, 49, 1420–1442. [Google Scholar] [CrossRef]
  66. Zhang, C.H.; He, J.; Sun, Y.Y.; Li, K. Prediction of distributional change of Toona ciliata var. ciliata and application in regionalization of introduction based on MaxEnt. J. Yunnan Univ. 2018, 40, 164–173. [Google Scholar] [CrossRef]
  67. Zhang, C.H.; He, J.; Sun, Y.Y.; Li, K. Distributional change in suitable areas for T. ciliata var. pubescens based on MaxEnt. For. Res. 2018, 31, 120–126. [Google Scholar] [CrossRef]
  68. Hu, X.S.; Wu, R.L.; Han, Y.F. An approach to sustainable management of population genetic resources of trees: (II) Management analyses of plantation and natural population of some autochthonous tree species in China. For. Res. 2001, 14, 1–7. [Google Scholar]
  69. Salmela, M.J.; Cavers, S.; Wachowiak, W.; Cottrell, J.E.; Iason, G.R.; Ennos, R.A. Understanding the evolution of native pinewoods in Scotland will benefit their future management and conservation. Forestry 2010, 83, 535–545. [Google Scholar] [CrossRef]
Figure 1. A map shows the twenty-nine sample sites and the geographic distribution of the mtDNA haplotypes that were derived from concatenated sequences of cox1−nad1 and 26SrRNAtRNA− Leu. Pie charts show different proportions of haplotypes within each of 29 populations of T. ciliata complex. Hi (i = 1,2, …, 14) represents the ith haplotype. Each of fourteen colors in pie charts represents one haplotype (H1–H14).
Genes 14 00116 g001
Figure 2. A network of mitochondrial haplotypes that were identified from concatenated sequences of cox1−nad1 and 26S−rRNA−tRNA−Leu. The circle sizes are proportional to the haplotype frequencies in 500 individuals. Code Hi (i = 1, 2, …,14) represents the ith haplotype and each haplotype is an unique combination of multiple alleles at polymorphic nucleotide sites.
Genes 14 00116 g002
Figure 3. Effects of isolation by distance (IBD) among range-wide populations of T. ciliata complex. (A). Results from the concatenated sequences of cox1−nad1 and 26SrRNAtRNA−Leu from mitochondrial genome; (B). Results from nrDNA ITS sequences.
Genes 14 00116 g003
Figure 4. Phylogenetic relationships and geographic clusters of 29 populations. (A) is the phylogenetic relationships among 500 individuals derived from mtDNA markers, showing three clusters. (B) is the three regions of populations corresponding to the three clusters in the top figure.
Genes 14 00116 g004
Figure 5. Phylogenetic relationships among 29 populations derived from nrDNA ITS sequences in T. ciliata complex. UPGMA (unweighted pair-group method using arithmetic average) was used to draw clusters. The populations in three colors correspond to the three clusters derived from the mtDNA marker in Figure 4.
Genes 14 00116 g005
Figure 6. Analysis of mismatch distribution using haploid nrDNA ITS sequences. (A) population XL, (B) population LD, and (C) population WM. The bar lines are the observed frequencies under different numbers of segregation sites of pairwise sequences, whereas the red dashed lines represent the expected frequencies under a model of sudden population expansion [53].
Genes 14 00116 g006
Table 1. Locations and sample sizes of 29 populations of T. ciliata complex.
LocationCodeSample SizeLongitude (E)Latitude (N)Elevation (m)
Huangshan, AnhuiHS6118.0830.16499
Jingxian, AnhuiJX15118.2430.41366
Nanping, FujianNP10118.1026.38800
Lechang, GuangdongLC15113.2025.07359
Yunfu, GuangdongYF18111.3422.46340
Longlin, GuangxiLL10105.2024.46624
Tianlin, GuangxiTL26106.1324.17792
Xilin, GuangxiXL27105.0524.29899
Luodian, GuizhouLD14106.4425.25814
Ceheng, GuizhouCH22105.4824.59730
Wangmo, GuizhouWM30106.0525.10500
Xingyi, GuizhouXY15104.5425.061160
Xuanen, HubeiXE9109.2830.17632
Chengbu, HunanCB25111.2827.14737
Hupingshan, HunanHP3111.4129.01436
Xinning, HunanXN30109.4428.18650
Maotoushan, JiangxiMT14117.0327.411000
Wuyishan, FujianWY9117.4228.181200
Guanshan, JiangxiGS14115.2627.19337
Jinggangshan, JiangxiJG17114.1726.44400
Jiulianshan, JiangxiJL18114.4724.54610
Dechang, SichuanDC29102.3226.401325
Huidong, SichuanHD30102.0927.231862
Baoshan, YunnanBS1199.0625.041513
Yongren, YunnanYR29101.3225.011539
Simao, YunnanSM16100.5822.461317
Puwen, YunnanPW19101.0422.23890
Xianju, ZhejiangXJ7119.9228.45600
Suichang, ZhejiangSC12119.2528.59510
Table 2. Genetic diversity of T. ciliata complex derived from the concatenated sequences of mitochondrial cox1−nad1 and 26S−rRNA−tRNA−Leu, and the nrDNA ITS sequences.
PopulationmtDNA MarkerHaploid nrDNA ITSTajima’s D
(p-Value)
Fu’s F
(p-Value)
hππθ
HS0.5000.001080.027000.036−0.73 (0.29)2.07 (0.76)
JX0.1240.000320.008880.018−1.79 (0.03)−0.75 (0.35)
NP0.5000.000450.004130.006−0.76 (0.24)−1.54 (0.14)
LC0.2400.000650.015120.019−0.88 (0.18)−1.11 (0.27)
YF0.4010.001710.009060.014−1.50 (0.04)−1.00 (0.31)
LL0.0000.00000.005280.008−0.35 (0.41)−0.88 (0.28)
TL0.0740.000190.006090.009−0.93 (0.21)−16.71 (0.00)
XL0.0000.00000.005420.013−1.90 (0.02)−9.32 (0.00)
LD0.0000.00000.004810.008−1.58 (0.04)−4.70 (0.00)
CH0.0000.00000.006910.011−0.98 (0.19)−9.27 (0.00)
WM0.1800.000150.006140.014−1.88 (0.01)−10.88 (0.00)
XY0.0000.00000.011360.019−1.36 (0.08)−8.81 (0.00)
XE0.3460.000310.001860.003−0.80 (0.24)−0.40 (0.38)
CB0.4030.000340.006170.010−1.15 (0.14)−2.22 (0.17)
HP0.0000.00000.002200.003NANA
XN0.0000.00000.002660.005−1.16 (0.12)1.31 (0.79)
MT0.0000.00000.002460.003−0.20 (0.62)1.31 (0.77)
WY0.3700.001480.025260.032−0.65 (0.29)1.62 (0.73)
GS0.4590.001080.003600.006−1.24 (0.10)−1.41 (0.18)
JG0.3810.001730.018110.026−1.11 (0.11)−0.09 (0.46)
JL0.4440.000380.004410.012−1.74 (0.03)−1.73 (0.18)
DC0.1860.000150.007860.014−1.27 (0.10)−6.69 (0.01)
HD0.0000.00000.005150.008−0.92 (0.20)−8.37 (0.00)
BS0.0000.00000.032220.038−0.72 (0.22)2.12 (0.83)
YR0.0000.00000.005900.009−0.75 (0.26)−7.17 (0.00)
SM0.5080.000770.005150.008−1.52 (0.06)−6.90 (0.00)
PW0.3880.000330.005270.007−0.75 (0.25)−0.59 (0.39)
XJ0.0000.00000.001100.002−1.61 (0.04)−0.13 (0.44)
SC0.0000.00000.003300.005−0.18 (0.46)−0.73 (0.34)
Table 3. Analysis of molecular variance (AMOVA) using mtDNA and nrDNA ITS sequences of T. ciliata complex.
MarkerSource of Variationd.f.Sum of SquareVariance ComponentPercentage of Variance (%)Φstp-Value
cox1−nad1Among populations281599.2833.312988.580.88580.00
Within populations471201.1530.427111.42
Total4991800.4363.7400
26S−rRNA−tRNA−LeuAmong populations282527.3165.237089.010.89010.00
Within populations471304.6120.646710.99
Total4992831.9285.8837
cox1−nad1 and 26S−rRNA−tRNA−LeuAmong populations284126.6008.549988.840.88840.00
Within populations471505.7641.073811.16
Total4994632.3649.6237
ITSAmong populations283192.4086.950871.430.71430.00
Within populations4381217.7712.780328.57
Total4664410.1809.7311
Table 4. Estimates of the relative rate of pollen to seed flow in local and global regions of T. ciliata complex.
Western
Region
Central
Region
Western and
Central Region
Eastern
Region
Global
Region
Fst(n)0.13620.05060.10680.18100.6994
Sd(Fst(n))0.00160.00380.00030.02470.0079
Fst(m)0.84050.02620.85660.53600.8870
Sd(Fst(m))0.06000.00110.00220.12670.0077
mP/mS31.4134-1.495047.96283.22701.3741
Sd(mP/mS)13.23300.04540.80912.55270.2925
Disclaimer/Publisher’s Note: The statements, opinions and data contained in all publications are solely those of the individual author(s) and contributor(s) and not of MDPI and/or the editor(s). MDPI and/or the editor(s) disclaim responsibility for any injury to people or property resulting from any ideas, methods, instructions or products referred to in the content.

