Article

The Role of Pancreatic Fatty Acid Synthesis in Islet Morphology and Function after Caloric Restriction or Roux-En-Y Gastric Bypass Surgery in Mice

1
Department of Physiology, School of Medicine, Jinan University, 601 Huangpu Avenue West, Guangzhou 510632, China
2
Center for Clinical Epidemiology and Methodology (CCEM), Guangdong Second Provincial General Hospital, Guangzhou 510317, China
*
Author to whom correspondence should be addressed.
Submission received: 3 October 2022 / Revised: 11 December 2022 / Accepted: 19 December 2022 / Published: 20 December 2022
(This article belongs to the Special Issue Cellular and Developmental Biology of Lipid Metabolism)

Abstract

:
Background: Both caloric restriction (CR) and Roux-en-Y gastric bypass (RYGB) are practical interventions for type 2 diabetes mellitus (T2DM), while the molecular mechanisms of CR and RYGB regarding glycemic control are still poorly understood. Here, we explore the effects and underlying mechanisms of CR and RYGB on β-cell area and function. Methods: Average islet size was measured by histological analysis. The pancreatic lipid content was detected by using a commercial lipid assay kit. The expression levels of lipogenic transcription factors and enzymes in mouse pancreas were determined by quantitative PCR, Western blot, and immunofluorescence. Results: CR decreased the mean size of islets and pancreatic insulin production in both regular diet-fed and high-fat diet-fed mice. Increased β-cell apoptosis was detected in the calorie-restricted mice. Interestingly, the lipogenic transcription factors and enzymes such as SREBP1c, PPARγ, FASN and ACC were upregulated in the pancreas after CR. In contrast to CR, RYGB decreased the apoptosis of β-cells and the expression of fatty acid synthase. Conclusions: Pancreatic fatty acid synthesis is critical to the β-cell function after CR and RYGB.

1. Introduction

Diabetes rates have reached epidemic proportions [1]. A total of 90% of diabetic patients have T2DM [2]. T2DM are at high risk for neuropathy, retinopathy, nephropathy, and cardiovascular disease [3,4,5,6]. It is characterized by islet dysfunction and β-cell failure [7]. In the early stages, insulin resistance triggers a rise in β-cell mass and function. A continuously excessive β-cell workload progressively contributes to the dysfunction and eventual loss of β-cells [8,9,10]. Oxidative stress, glucotoxicity, lipotoxicity, and islet cell amyloid deposition lead to the loss of β-cells and islet dysfunction [11,12,13,14]. At present, both caloric restriction [15] and bariatric surgery [16] are effective treatments for T2DM. CR, a restriction in caloric intake, has been demonstrated to reverse both β-cell failure and insulin resistance [17,18,19,20]. RYGB, a commonly performed bariatric surgery, is used to treat T2DM. Improvement of islet morphology and function after gastric bypass has been observed in rodents [21,22], pigs [23], and humans [24].
The role of free fatty acid (FFA) in β-cell function is complex and vital. Sufficient circulating FFA is crucial for glucose-stimulated insulin secretion (GSIS) [25]. Transient increases in circulating FFA levels lead to supranormal GSIS [26]. However, studies illustrate that in vitro overexpression of SREBP1c or ACC in islets induces lipid accumulation in β-cells and reduces GSIS [27,28]. A sustained and excessive exposure of β-cell to FFA results in triglyceride (TG) accumulation and impaired GSIS, reduced insulin secretion, and induced the apoptosis and demise of β-cells [12,29,30].
Insulin resistance is a critical factor for the increase in circulating FFA in the development of T2DM. Conversely, elevated circulating FFA contributes to increased β-cell mass and function to compensate for insulin resistance [31]. Due to the importance of endogenous lipids in β-cell function, we hypothesized that pancreatic endogenous lipid synthesis is essential to the islet morphology and function in diet-induced obese diabetic mice (DIO) after CR and RYGB. In the present study, we examine the effects of dietary restriction and gastric bypass on the expression of fatty acid synthesis-related genes in the pancreas and the alterations of β-cell apoptosis in mice.

2. Materials and Methods

2.1. Materials

Rabbit anti-PPARγ, rabbit anti-ACC antibodies, and mouse anti-β-actin were purchased from Cell Signaling Technology (Beverly, MA, USA). Rabbit anti-fatty acid synthase, anti-death receptor Fas/CD95 antibodies, and mouse anti-SREBP1c were obtained from Abcam Inc. (Cambridge, MA, USA). Rabbit anti-active caspase-3 antibodies, and mouse anti-insulin were obtained from Servicebio (Wuhan, China). Goat anti-mouse FITC-conjugated IgG and DyLight 594 AffiniPure donkey anti-rabbit IgG were obtained from EarthOx LLC (San Francisco, CA, USA). The normal chow diet (D12450B) and the high-fat diet (D12492) were obtained from Research Diets, Inc. (New Brunswick, NJ, USA).

2.2. Animals and Treatments

Male C57BL/6J mice were kept in a controlled environment (12 h light-12 h dark cycle, 24 °C). The mice used in the current study were handled in conformity with the Guide for the Care and Use of Laboratory Animals published by the National Institutes of Health (NIH Publications No. 8023, revised 1978). All the protocols have been reviewed and approved by the Animal Care and Use Committee of Jinan University.
To evaluate the effects of CR on pancreatic morphology and function in normal chow diet-fed mice, 8-week-old male mice were randomly assigned to the ad libitum fed (NCD) group or to the group fed with 30% fewer calories than the average daily calories consumed by the ad libitum fed group (NCR). Tissues were harvested after 4 weeks of treatment (n = 5 per group).
To test the effects of CR on pancreas in high-fat diet-fed mice, 4-week-old mice were fed a high-fat diet ad libitum (HFD), or 30% less of the mean daily calories consumed by the high-fat diet ad libitum group (HCR) for 8 weeks (six mice per group).
To assess the effects of RYGB on pancreas in diabetic mice, 4-week-old mice were fed a HFD ad libitum for 16 weeks, then the animals were divided into the sham-group (n = 11) or the RYGB group (n = 9). After one month recovery period, tissues were harvested.

2.3. RYGB Procedures

The RYGB- and sham-operations were done as previously described [32].

2.4. Intraperitoneal Glucose Tolerance Test (IPGTT)

After 8 h fasting, mice received intraperitoneal injection of glucose at the dose of 1.5 g/kg body weight. Blood sugar levels were assessed at indicated time points after glucose administration with Glucotrend from Roche Diagnostics (Mannheim, Germany).

2.5. Measurement of Plasma Insulin

Blood samples were obtained in the presence of EDTA. Insulin was assayed using the enzyme immunoassay kits according to the manufacturer’s instructions.

2.6. Histological Analysis

Pancreas tissues were harvested, fixed in 4% paraformaldehyde, paraffin-embedded, cut into sections, and stained with hematoxylin-eosin according to standard procedures. Photomicrographs were taken under an inverted microscope (Leica, Germany). Islet sizes were measured using ImageJ software [33].

2.7. Immunohistochemistry

After citrate buffer antigen retrieval, pancreatic sections were blocked and then incubated overnight with rabbit anti-active caspase-3 (1:1000), anti-Fas (1:100), or anti-fatty acid synthase (1:150) combined with mouse anti-insulin (1:300). The tissue sections were then incubated with a mixture of secondary antibodies. Photomicrographs were taken and computerised image analysis was performed to quantify the fluorescence signals.

2.8. Determination of Triglycerides in the Pancreas

The triglyceride content in the pancreas tissue was detected according to the manufacturer’s instructions (Boxbio, Beijing, China).

2.9. Western Blot Analysis

Proteins were extracted from pancreatic tissues, separated with SDS-PAGE gels, and measured as previously described [32].

2.10. RNA Extraction, Quantitative Real-Time PCR

RNA was extracted and reverse-transcribed into cDNAs using RT-PCR kit (Takara). Real-time PCR was performed as previously described [32]. Gene-specific primer pairs used in current study are shown in Table 1.

2.11. Statistical Analysis

All the data are expressed as the mean ± S.E.M. Statistical analysis was performed by Student’s t-test. The data were considered significant when p < 0.05.

3. Results

3.1. Effects of CR on the Morphology of Islets and Pancreatic Lipogenic Gene Expression in Normal Mice

CR decreased the body weight but not the pancreas weight significantly (Figure 1a,b). IPGTT showed that NCR mice had lower glycemic excursions in response to i.p. glucose (Figure 1c). Plasma insulin levels (Figure 1d) and the insulin mRNA levels in the pancreas were significantly lower in the NCR group (Figure 1g). H-E staining and immunofluoresence staining of insulin on pancreas tissues indicated decreased average islet size (Figure 1e,f) and β-cell mass (Figure 1h,i) after nutritional intervention.
We further examined whether CR led to apoptosis in β-cells. We performed double immunofluorescence staining of insulin and cleaved caspase-3 (CC3), as well as insulin and death receptor Fas/CD95 on mouse pancreas tissues. As shown in Figure 2, immunofluorescence signals of CC3 (Figure 2a,b) and Fas/CD95 (Figure 2c,d) were increased in NCR mice islets, which co-localized with the insulin signals, suggesting increased β-cell apoptosis after CR.
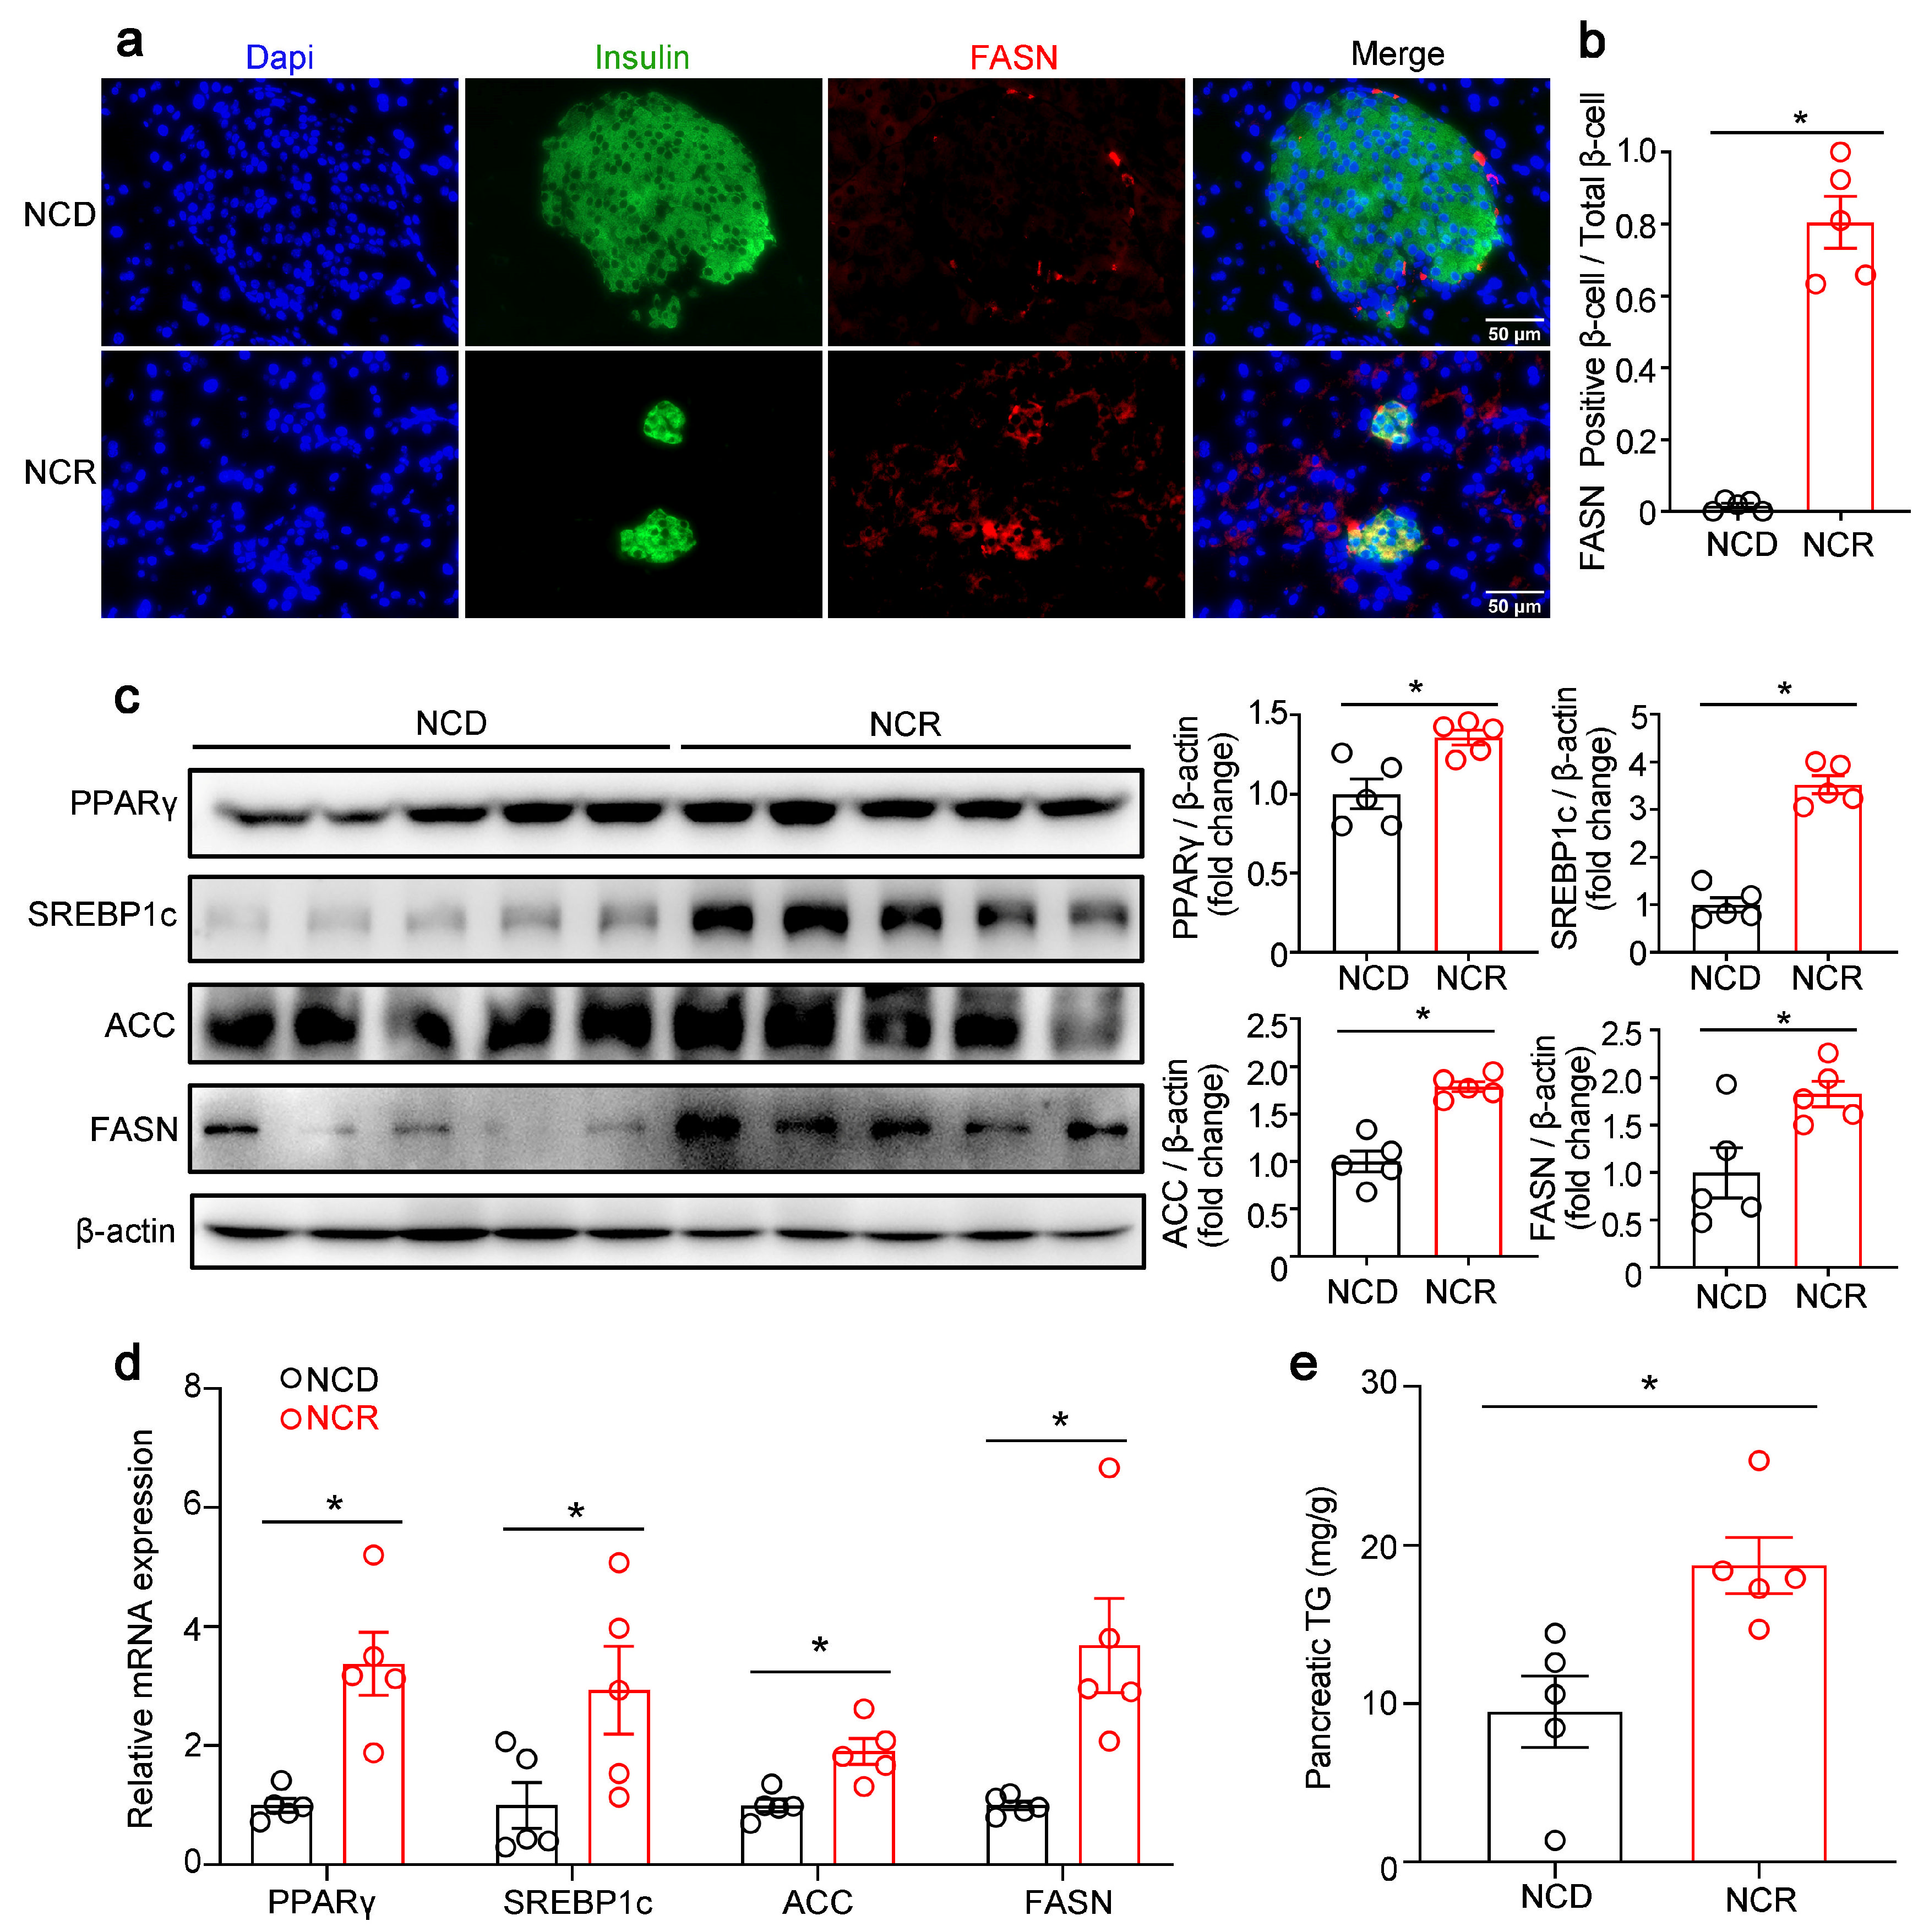
Previous studies reported that excessive exposure of β-cell to FFA impaired β-cell function and induced β-cell apoptosis. Therefore, we examined the lipid synthesis pathway in the NCD and NCR groups. Immunofluorescence staining showed that the fatty acid synthase (FASN) signal was increased in the β-cells of NCR mice (Figure 3a,b). Expression levels of lipogenic transcription factors such as SREBP1c and PPARγ and enzymes of lipid synthesis such as FASN and ACC were significantly upregulated in the NCR group (Figure 3a–d). Consistent with the upregulation of the lipid synthesis pathway, increased pancreatic triglyceride content was detected in NCR mice (Figure 3e).

3.2. Effects of CR on the Function and Morphology of Pancreatic Islets as well as Lipogenic Gene Expression in Diabetic Mice

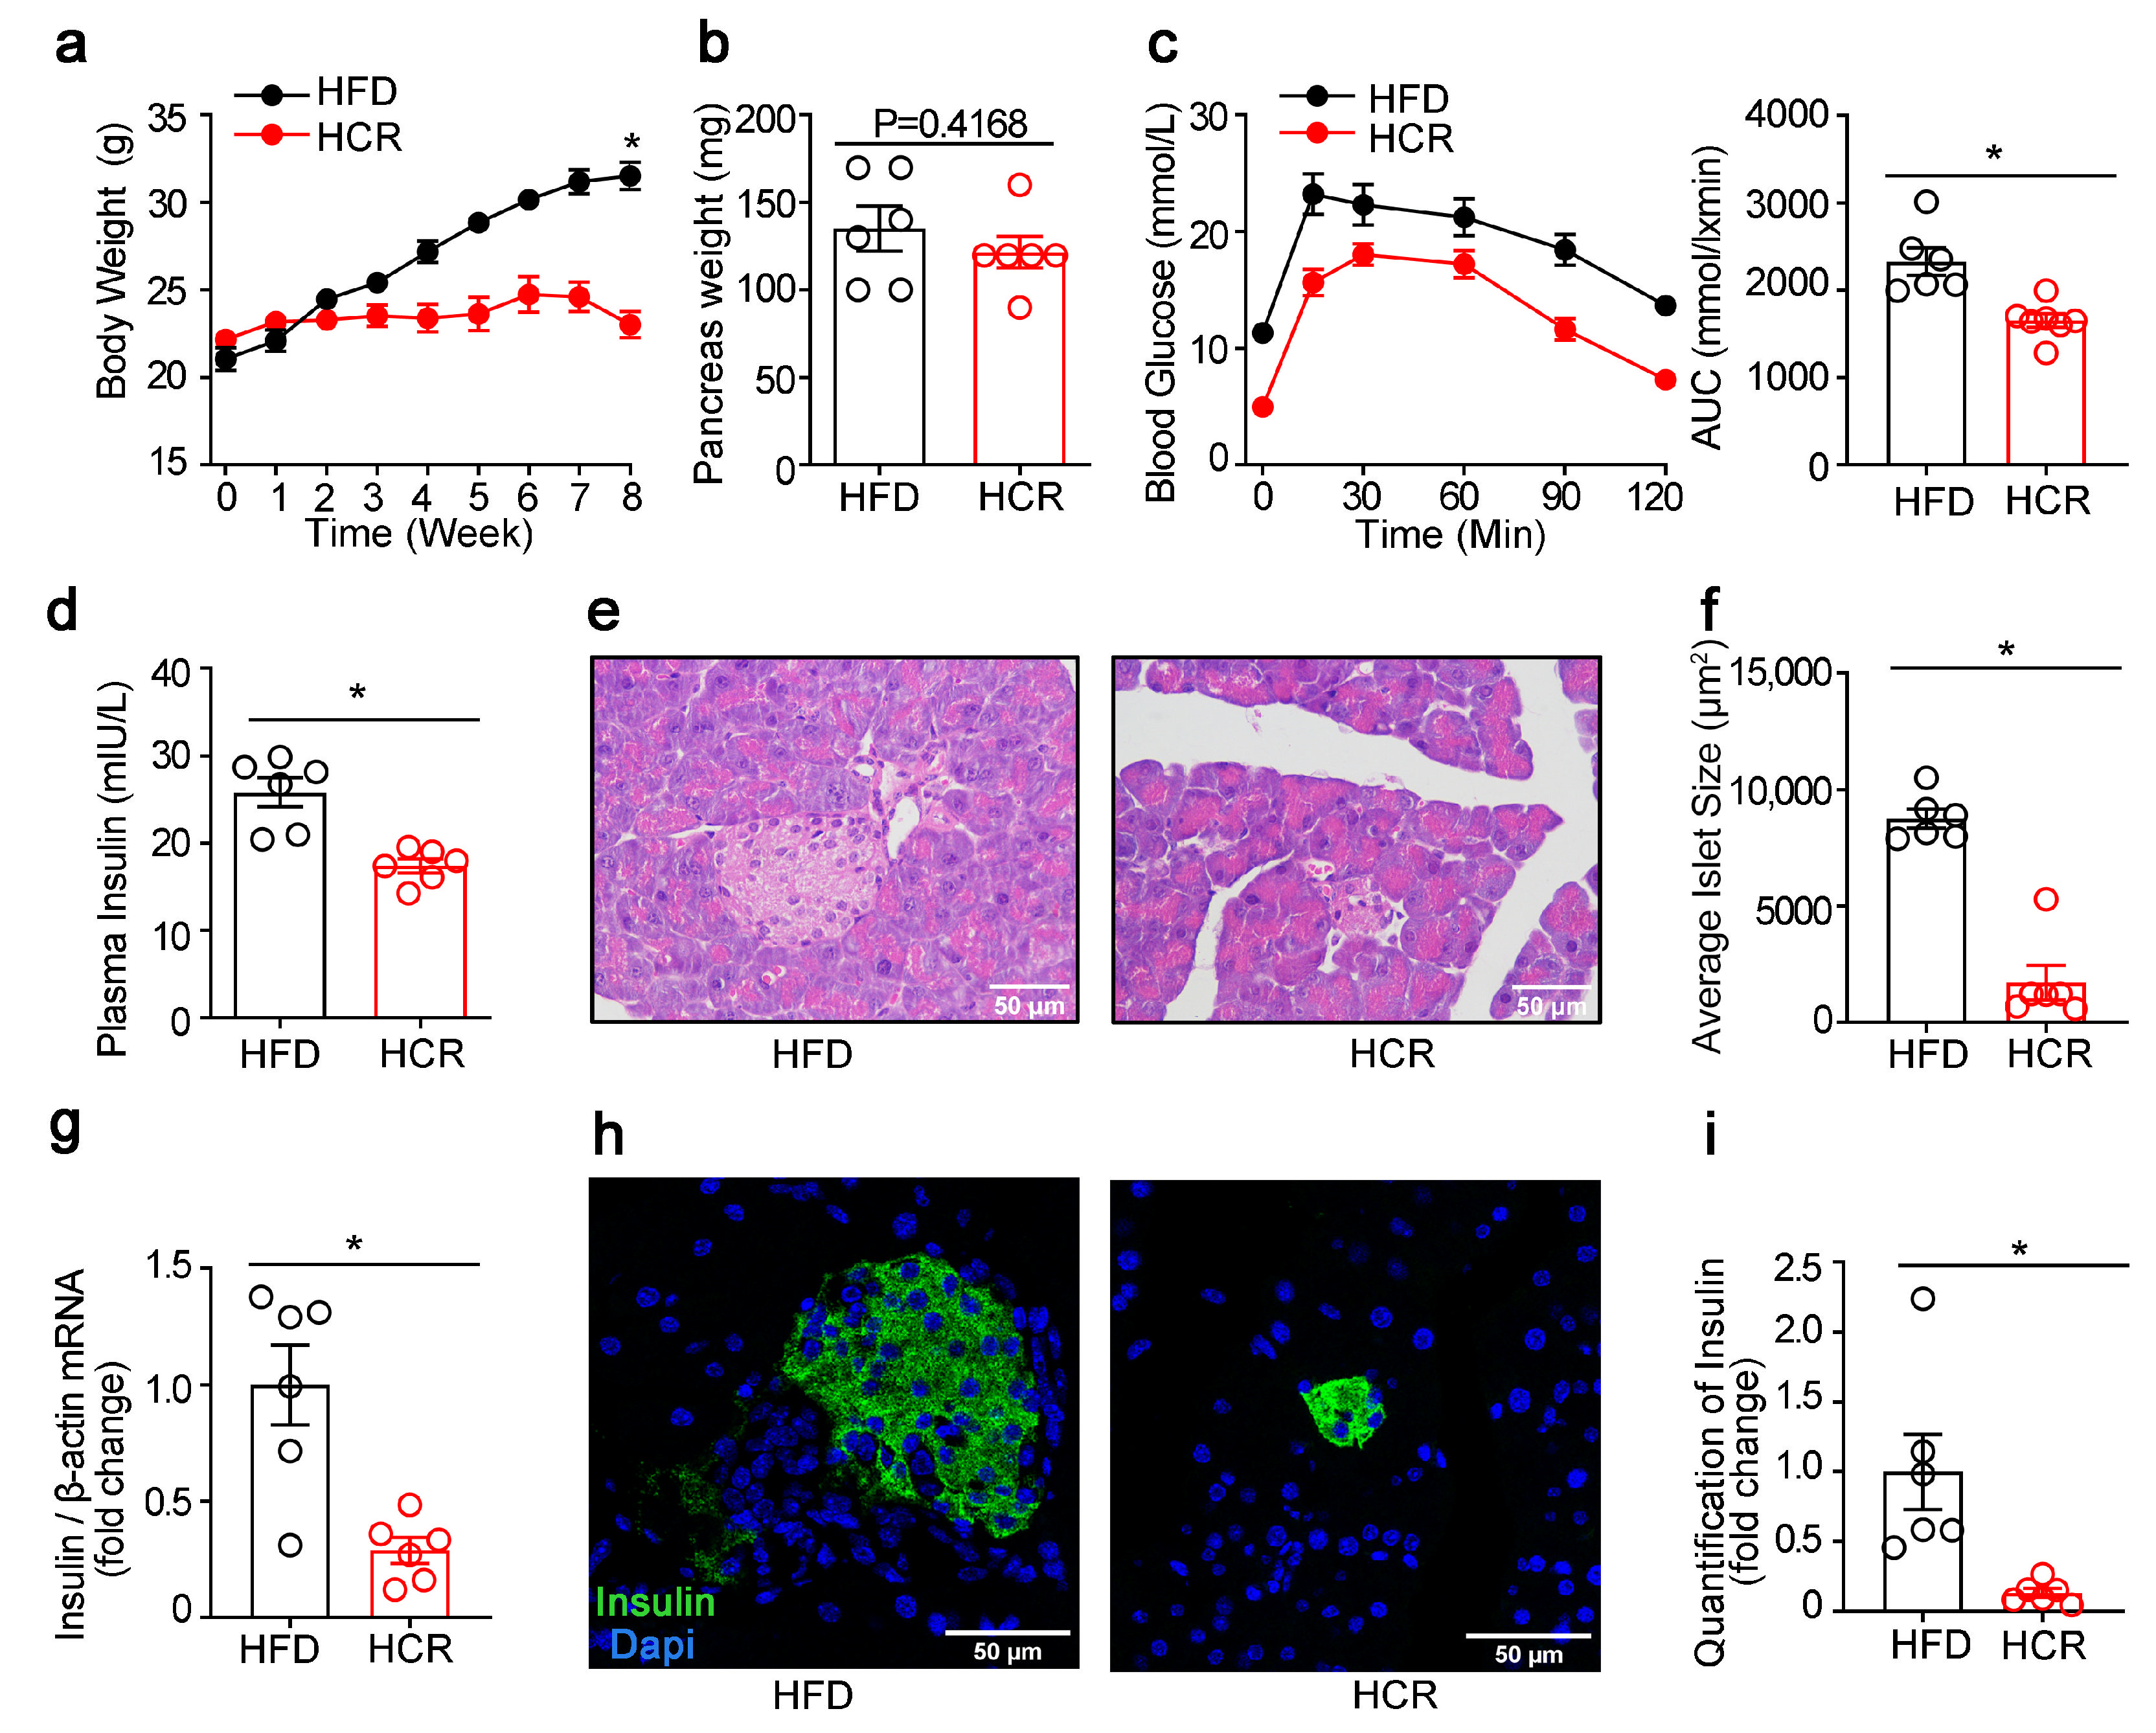
CR led to remarkable body weight losses even when the animals were exposed to a high-fat diet, but had no significant effect on pancreas weight (Figure 4a,b). Simultaneously, the impaired glucose metabolism was significantly improved in HCR mice (Figure 4c). Meanwhile, lower plasma insulin levels (Figure 4d) and insulin mRNA levels (Figure 4g), as well as smaller islet size (Figure 4e,f) and β-cell mass (Figure 4h,i) were observed in HCR mice as compared to HFD mice. Furthermore, double immunofluorescence staining for CC3 and insulin on pancreas tissue sections indicated increased β-cell apoptosis in HCR group (Figure 5a,b).
We next examined whether CR also activated lipogenic gene expression in the pancreas of HFD-fed mice. Immunofluorescence staining of FASN and insulin showed that FASN expression was markedly higher in the β-cell of HCR mice than that of HFD mice (Figure 6a,b). RT-qPCR and Western blot also showed upregulation of SREBP1c, PPARγ, FASN and ACC expression in the pancreas of HCR mice (Figure 6c,d).

3.3. Effects of RYGB on the Islet Morphology in Fatty Diet-Induced Diabetic Mice

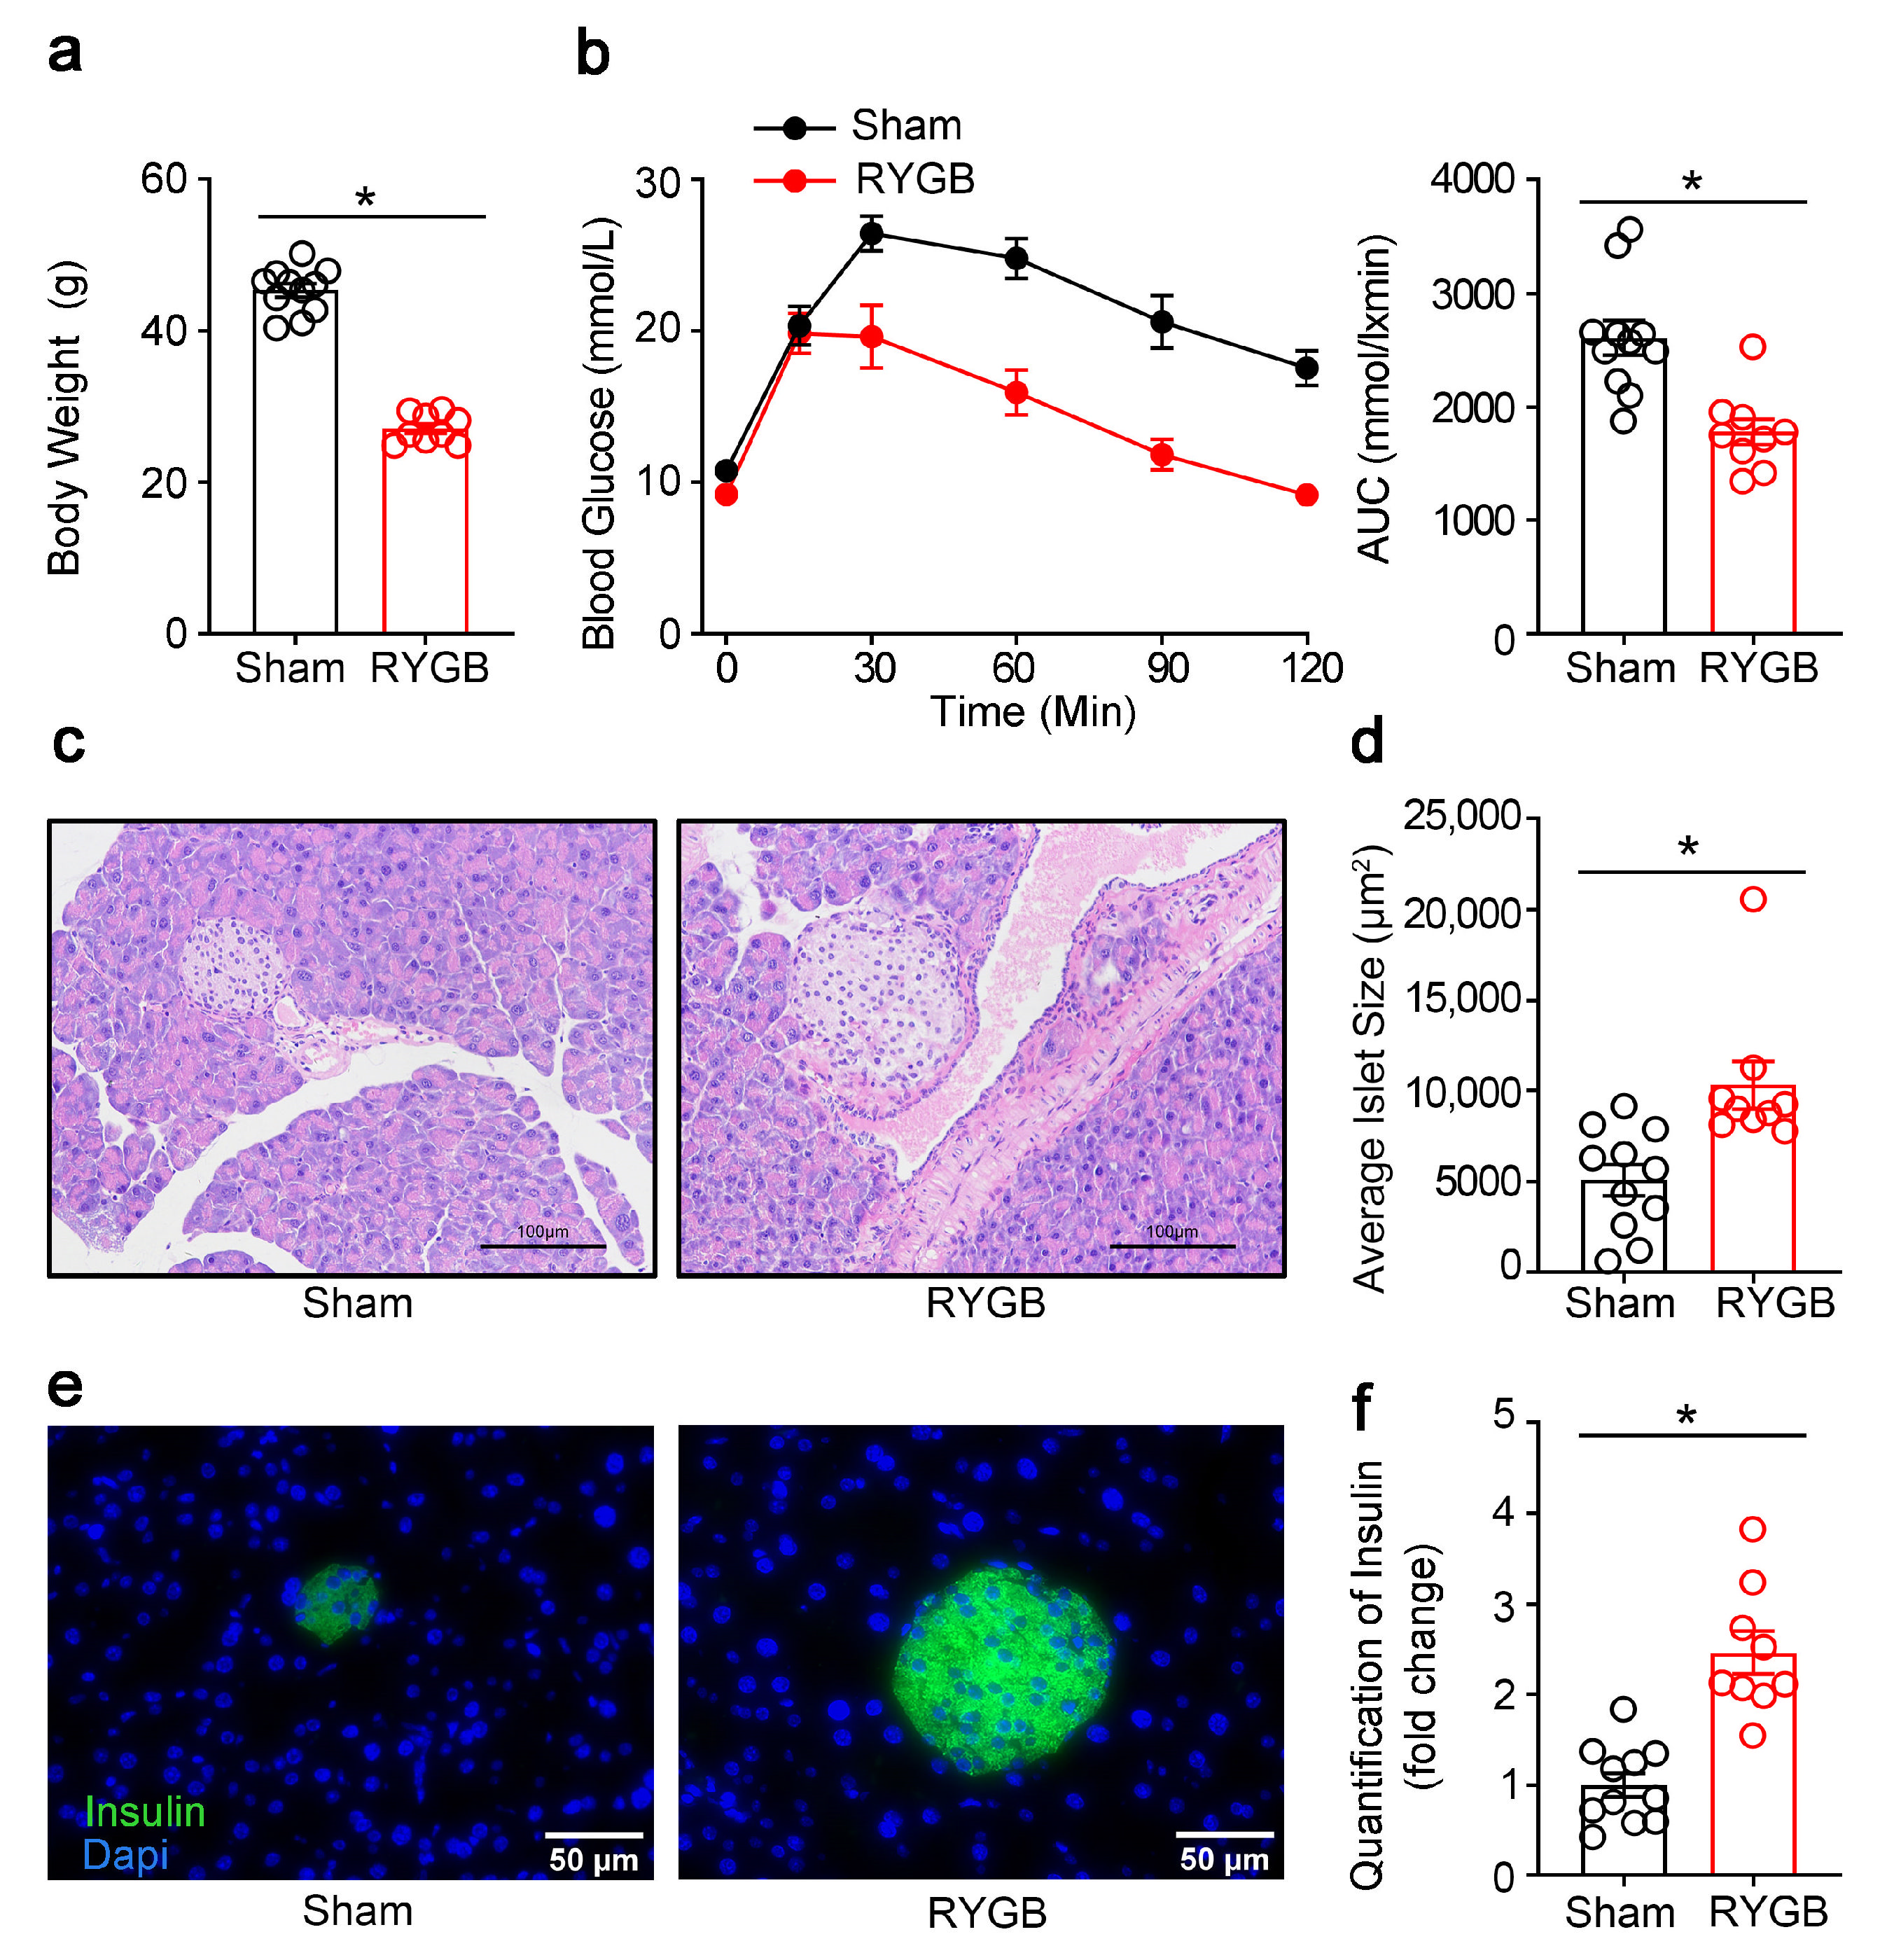
RYGB is an effective means for obesity and T2DM and has been found to have profound influence on glucose metabolism. We next investigated whether RYGB also affected β-cell mass and function. As shown in Figure 7, RYGB markedly decreased the body weight (Figure 7a) and improved the glucose intolerance induced by the high-fat diet (Figure 7b). Unlike CR in NCD and HFD, which led to smaller islet size and decreased β-cell mass, RYGB provoked a larger islet size (Figure 7c,d) and β-cell area (Figure 7e,f).
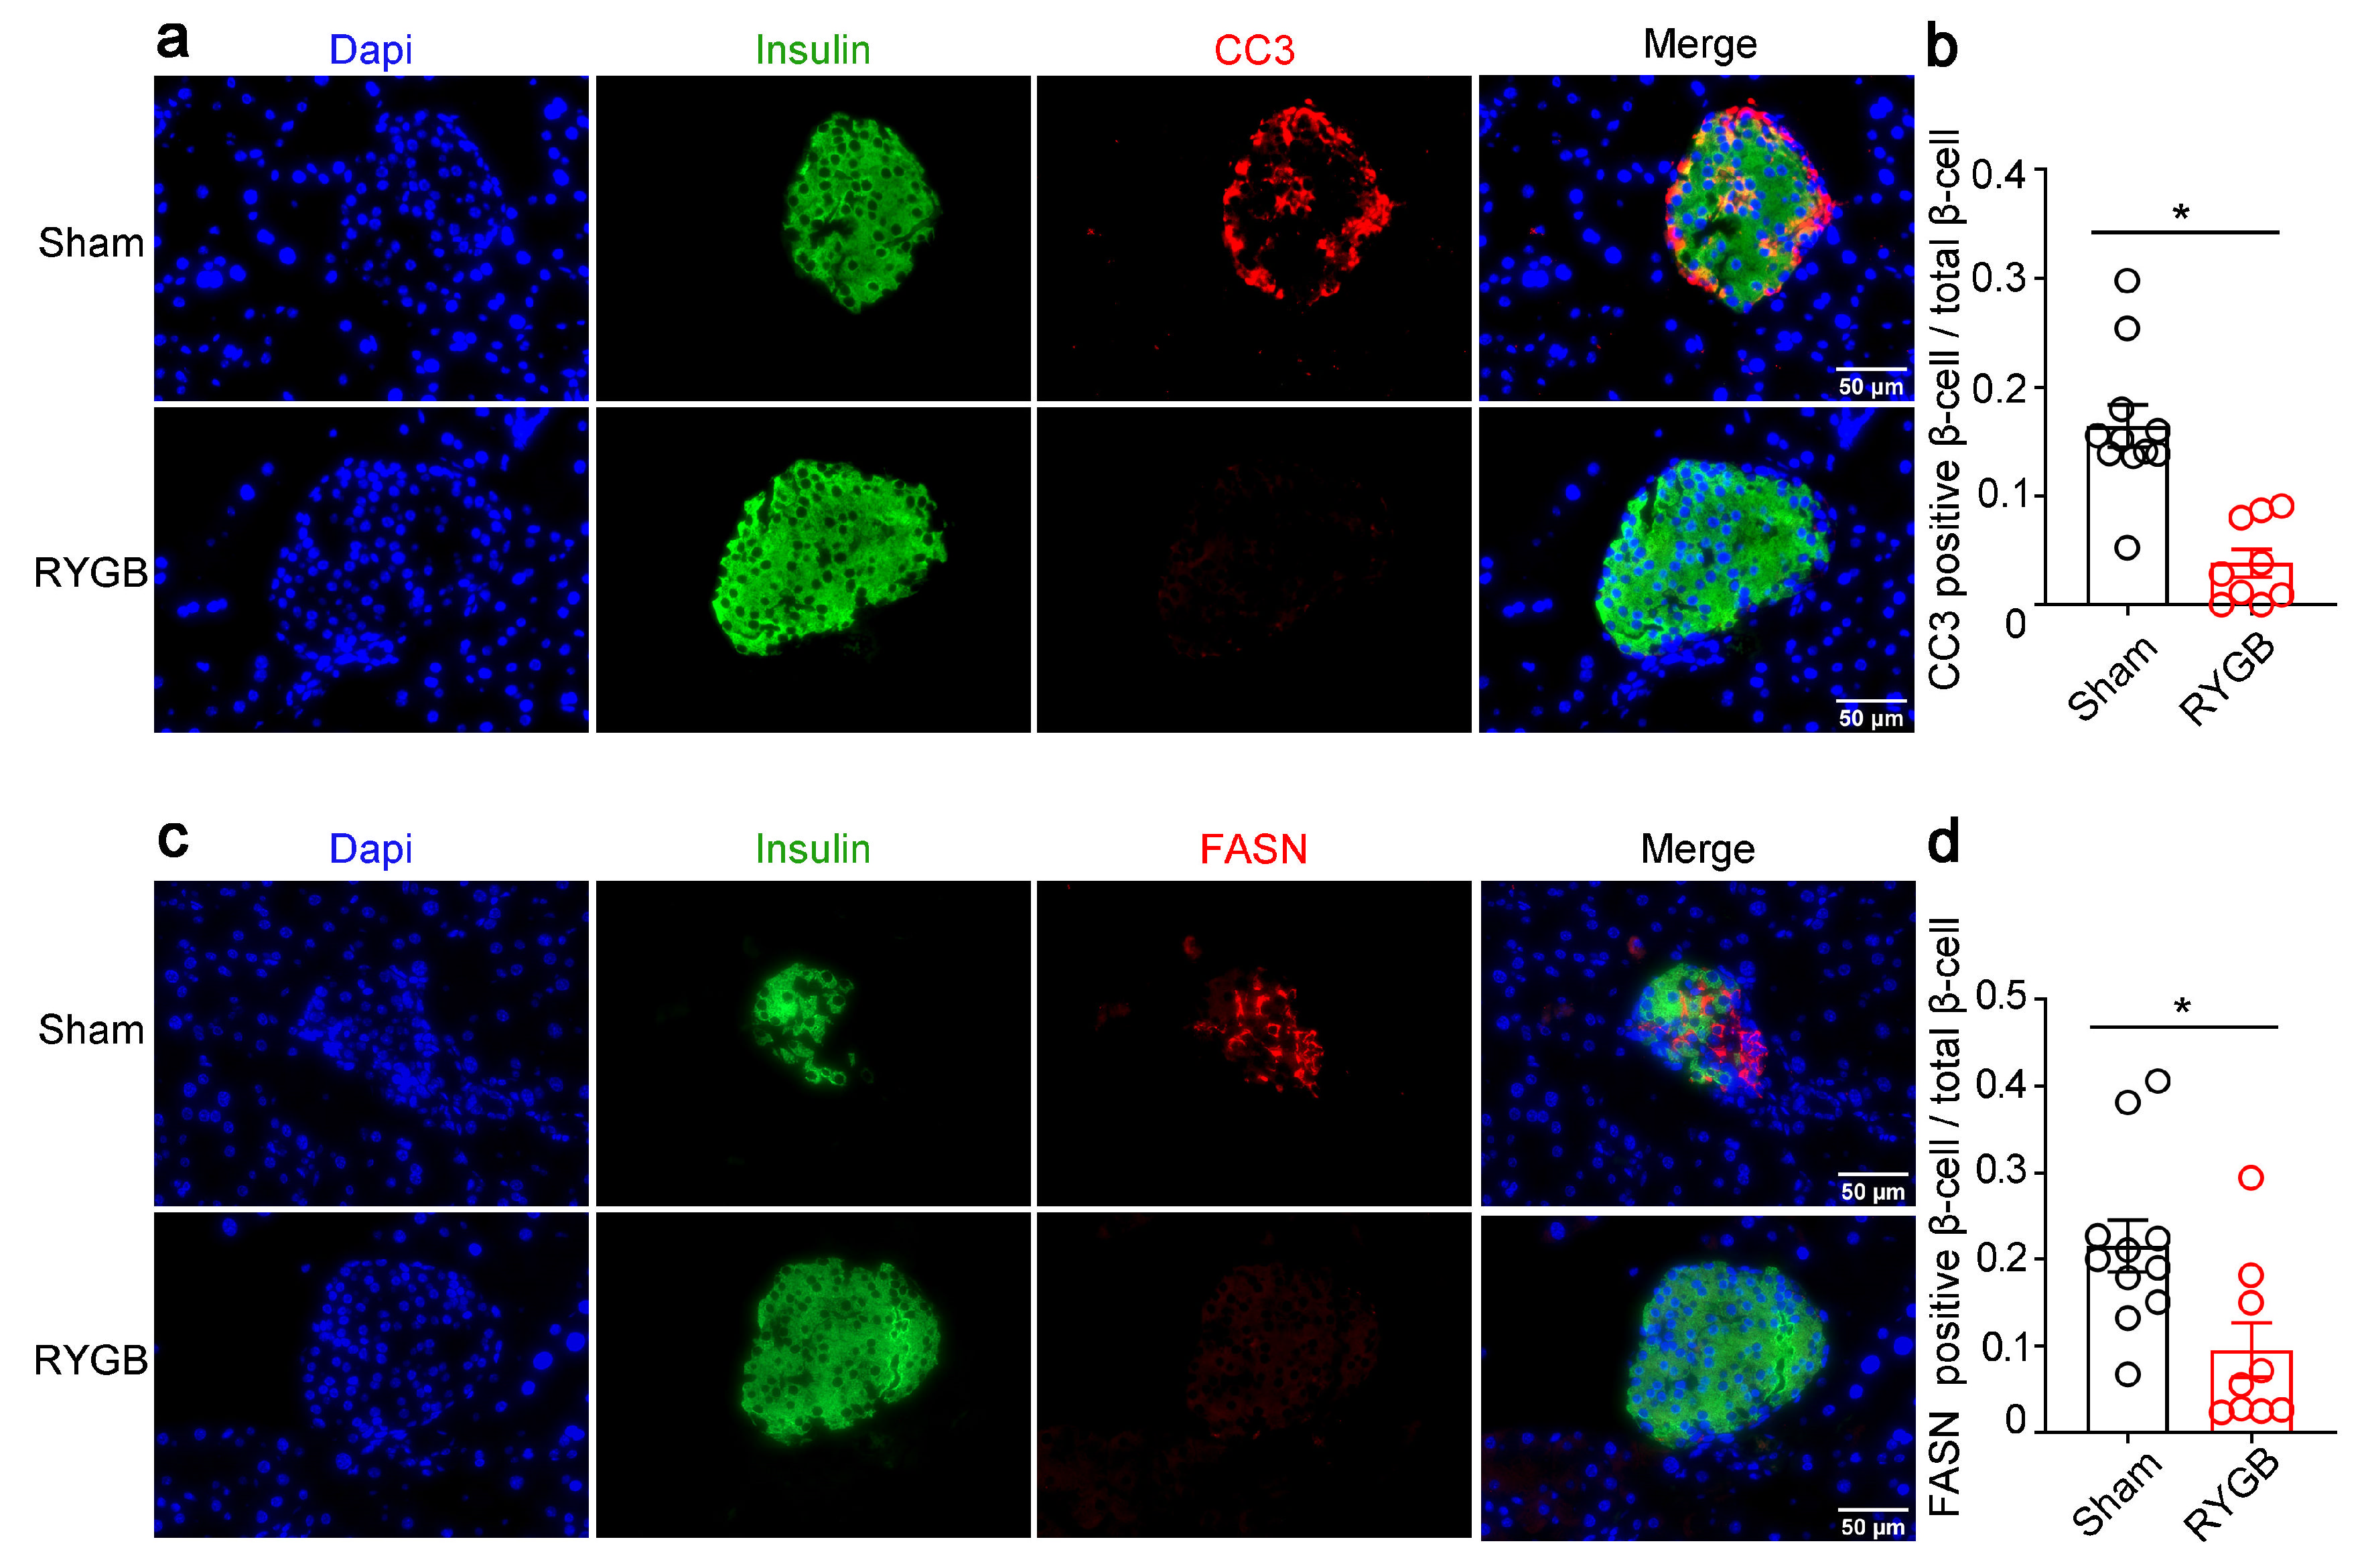
In concordance with the increased β-cell after RYGB, decreased β-cells apoptosis was observed in RYGB mice, as indicated by immunofluorescence staining of CC3 and insulin (Figure 8a,b). Moreover, immunofluorescence staining for fatty acid synthase (FASN) showed a decline in the expression of FASN in the β-cells in RYGB mice (Figure 8c,d), suggesting a downregulation of lipogenic pathway in β-cells after RYGB.

4. Discussion

The major finding in the current investigation is that the alterations in islet morphology and function after both CR and RYGB may be related to pancreatic lipid. Adequate intracellular lipid is essential for β-cell function in the context of energy deprivation. CR stimulates the pancreatic endogenous lipid synthesis and β-cell apoptosis and also decreases β-cell area and insulin production in both normal and diabetic obese mice. RYGB inhibits the lipogenic gene expression and decreases the apoptosis of β-cells in diabetic mice.
Several studies have indicated that changes in β-cell mass are associated with obesity and diabetes. β-cell mass in subjects with obesity is considered to first increase, then decline with T2DM progression [7,8,34]. It has been reported that many factors such as lipotoxicity, oxidative stress, proinflammatory cytokines, glucotoxicity, and islet cell amyloid deposition are involved in β-cell apoptosis in T2DM [11,12,13,14]. Prevention of the loss of β-cell mass in T2DM is crucial to the long-term treatment of this disease [35]. Dietary restriction is employed as a first-line therapy option for T2DM. CR improves insulin resistance and glucose intolerance, thereby improving T2DM [36]. It is also believed that CR improves glucose metabolism by changing the β-cell mass [17]. There are conflicting reports about the effects of CR on β-cell mass. This may be related to the duration and the degree of CR, as well as the animal model. Sheng et al. demonstrated that long-term CR, such as for a period of 3 months (0.1 g/g body weight/day), reduced β-cell dedifferentiation and ameliorated β-cell function in db/db mice [37]. Kanda et al. also reported that 6 weeks of CR increased β-cell mass, stimulated β-cell proliferation and differentiation, and inhibited apoptosis and stress, which was attributed to the upregulation of ERK-1, Nkx2-2, Nkx6-1, NeuroD, and Pdx-1, as well as the downregulation of caspase-activated DNase (CAD) in db/db mice [17]. However, Gao et al. demonstrated that 3 weeks of moderate (40%) CR decreased the supranormal islet size, improved hyperinsulinemia and insulin sensitivity, and completely restored glucose homeostasis via the upregulation of β-cell autophagy in DIO mice [38]. Nevertheless, the underlying mechanisms involved in the effects of CR on β-cell morphology and function have not been fully clarified. Under basal circumstances, β-cells do not express death receptor Fas/CD95 (Fas). However, during diabetes progression, many factors, such as amylin and IL-1β, induce upregulation of Fas, mediating β-cell apoptosis [14,39,40]. In the current study, we found that CR increased the expression of CC3 in islets, leading to the apoptosis of β-cells. CR decreased the β-cell area via increasing β-cell apoptosis in both NCD-fed and HFD-fed mice. Lower insulin secretion is needed to maintain glucose homeostasis in the context of energy deprivation. Loss of β-cells may contribute to the decline in insulin synthesis and secretion. Our data also demonstrate that, in spite of being fed with the high-fat diet, a 30% reduction in food intake maintained a normal body weight and blood sugar. However, limitations exist in the study design. Restriction was for 4 weeks in NCR, but 8 weeks in HCR. These might cause greater effect of CR on apoptosis in HCR than NCR.
RYGB is an effective therapy for obesity and T2DM [16]. The improvement in hyperglycemia after RYGB occurs within days after the operation. RYGB was found to increase the β-cell mass in rats [21]. The activation of glucagon-like peptide 1 (GLP-1) and its signaling pathway and the inhibition of the NLRP3 inflammasome in islets may contribute to improved glucose homeostasis after RYGB [41,42]. Our study demonstrated that the increased islet insulin content after RYGB may be due to the decreased apoptosis of β-cells. Decreased apoptosis provides an advantage to β-cell growth and survival.
During the chronic intake of more energy than is required every day, excess energy is converted to fat in the liver and transferred to peripheral tissues for storage, which will increase fat delivery to all tissues and the pancreatic islets to take up fat avidly [43,44]. The excess fatty acid uptake brings about dysfunction, apoptosis, and dedifferentiation of β-cells, eventually triggering T2DM [12,29,30]. On the other hand, short-term exposure of β-cells to FFA is capable of enhancing GSIS [26,45]. It is known that a temporary increased plasma FFA level is one of the hallmarks of the fasted state, after infusion of the antilipolytic agent, decreased plasma lipid essentially abolish GSIS in both fasted rats and humans. Thus, an adequate supply of FFA in the fasting state is critical for the normal functioning of islet β-cells [25,26]. Our in vivo data demonstrate that the expression of lipogenic genes in the pancreas was increased rather than decreased under the condition of chronic energy deficiency caused by CR. Up-regulation of lipogenic gene expression increases the rate of β-cell apoptosis and decreases the β-cell area and insulin secretions, thus maintaining blood glucose homeostasis during energy deficiency.
Steven et al. determined that RYGB reduced pancreatic triglycerides in T2DM [46]. We further investigated the molecular mechanism underlying the decrease in pancreatic lipid accumulation after RYGB. Our data show that the decline in FASN expression in β-cells after RYGB may help reduce lipid accumulation in β-cells and improve β-cell function in the context of energy surplus, thereby alleviating T2DM.

5. Conclusions

In conclusion, this study examined β-cell apoptosis and the expression of lipogenic genes in the pancreas after both CR and RYGB. The alterations in the β-cell mass and insulin secretion after both CR and RYGB may be related to pancreatic fatty acid. Our study provides new insights into the pathogenesis of diabetes and potential therapeutic approaches.

Author Contributions

G.X. designed the research; H.M., Y.L. (Yang Liu), M.Z., Z.Q., Y.L. (Yilin Li), Z.Z. and Y.L. (Yanting Li) performed the research; H.M., Y.L. (Yang Liu) and M.Z. analyzed the data; writing—original draft preparation, H.M. and G.X.; writing—review and editing, H.M. and G.X. All authors have read and agreed to the published version of the manuscript.

Funding

The National Natural Science Foundation of China (82170818, 81770794) and the Fundamental Research Funds for the Central Universities (21620423).

Institutional Review Board Statement

Animal studies were conducted in accordance with the Guidelines on Laboratory Animals of Jinan University and were reviewed and approved by the Animal Care and Use Committee of Jinan University (No:20181022-02).

Informed Consent Statement

Not applicable.

Data Availability Statement

All data are included in the article.

Conflicts of Interest

The authors declare no conflict of interest.

Abbreviations

CRCaloric restriction
RYGBRoux-en-Y gastric bypass
SREBP1cSterol regulatory element-binding protein-1c
FasDeath receptor Fas/CD95
FASNFatty acid synthase
ACCAcetyl-CoA carboxylase
FFAFree fatty acid
TGTriglyceride
CC3Cleaved caspase-3
GSISGlucose-stimulated insulin secretion

References

  1. Sun, H.; Saeedi, P.; Karuranga, S.; Pinkepank, M.; Ogurtsova, K.; Duncan, B.B.; Stein, C.; Basit, A.; Chan, J.C.N.; Mbanya, J.C.; et al. IDF Diabetes Atlas: Global, regional and country-level diabetes prevalence estimates for 2021 and projections for 2045. Diabetes Res. Clin. Pract. 2022, 183, 109119. [Google Scholar] [CrossRef] [PubMed]
  2. Chatterjee, S.; Khunti, K.; Davies, M.J. Type 2 diabetes. Lancet 2017, 389, 2239–2251. [Google Scholar] [CrossRef] [PubMed]
  3. Cheung, N.; Mitchell, P.; Wong, T.Y. Diabetic retinopathy. Lancet 2010, 376, 124–136. [Google Scholar] [CrossRef] [PubMed]
  4. de Boer, I.H.; Rue, T.C.; Hall, Y.N.; Heagerty, P.J.; Weiss, N.S.; Himmelfarb, J. Temporal trends in the prevalence of diabetic kidney disease in the United States. JAMA 2011, 305, 2532–2539. [Google Scholar] [CrossRef]
  5. Feldman, E.L.; Callaghan, B.C.; Pop-Busui, R.; Zochodne, D.W.; Wright, D.E.; Bennett, D.L.; Bril, V.; Russell, J.W.; Viswanathan, V. Diabetic neuropathy. Nat. Rev. Dis. Primers 2019, 5, 41. [Google Scholar] [CrossRef]
  6. Sarwar, N.; Gao, P.; Seshasai, S.R.; Gobin, R.; Kaptoge, S.; Di Angelantonio, E.; Ingelsson, E.; Lawlor, D.A.; Selvin, E.; Stampfer, M.; et al. Diabetes mellitus, fasting blood glucose concentration, and risk of vascular disease: A collaborative meta-analysis of 102 prospective studies. Lancet 2010, 375, 2215–2222. [Google Scholar]
  7. Butler, A.E.; Janson, J.; Bonner-Weir, S.; Ritzel, R.; Rizza, R.A.; Butler, P.C. Beta-cell deficit and increased beta-cell apoptosis in humans with type 2 diabetes. Diabetes 2003, 52, 102–110. [Google Scholar] [CrossRef] [Green Version]
  8. Tschen, S.I.; Dhawan, S.; Gurlo, T.; Bhushan, A. Age-dependent decline in beta-cell proliferation restricts the capacity of beta-cell regeneration in mice. Diabetes 2009, 58, 1312–1320. [Google Scholar] [CrossRef] [Green Version]
  9. Polonsky, K.S.; Given, B.D.; Van Cauter, E. Twenty-four-hour profiles and pulsatile patterns of insulin secretion in normal and obese subjects. J. Clin. Investig. 1988, 81, 442–448. [Google Scholar] [CrossRef]
  10. Costes, S.; Langen, R.; Gurlo, T.; Matveyenko, A.V.; Butler, P.C. β-Cell failure in type 2 diabetes: A case of asking too much of too few? Diabetes 2013, 62, 327–335. [Google Scholar] [CrossRef] [Green Version]
  11. Robertson, R.P. Chronic oxidative stress as a central mechanism for glucose toxicity in pancreatic islet beta cells in diabetes. J. Biol. Chem. 2004, 279, 42351–42354. [Google Scholar] [CrossRef] [PubMed]
  12. Kusminski, C.M.; Shetty, S.; Orci, L.; Unger, R.H.; Scherer, P.E. Diabetes and apoptosis: Lipotoxicity. Apoptosis 2009, 14, 1484–1495. [Google Scholar] [CrossRef] [PubMed]
  13. Haataja, L.; Gurlo, T.; Huang, C.J.; Butler, P.C. Islet amyloid in type 2 diabetes, and the toxic oligomer hypothesis. Endocr. Rev. 2008, 29, 303–316. [Google Scholar] [CrossRef] [PubMed] [Green Version]
  14. Maedler, K.; Sergeev, P.; Ris, F.; Oberholzer, J.; Joller-Jemelka, H.I.; Spinas, G.A.; Kaiser, N.; Halban, P.A.; Donath, M.Y. Glucose-induced beta cell production of IL-1beta contributes to glucotoxicity in human pancreatic islets. J. Clin. Investig. 2002, 110, 851–860. [Google Scholar] [CrossRef] [PubMed]
  15. Steven, S.; Hollingsworth, K.G.; Al-Mrabeh, A.; Avery, L.; Aribisala, B.; Caslake, M.; Taylor, R. Very Low-Calorie Diet and 6 Months of Weight Stability in Type 2 Diabetes: Pathophysiological Changes in Responders and Nonresponders. Diabetes Care 2016, 39, 808–815. [Google Scholar] [CrossRef] [PubMed] [Green Version]
  16. Mingrone, G.; Panunzi, S.; De Gaetano, A.; Guidone, C.; Iaconelli, A.; Nanni, G.; Castagneto, M.; Bornstein, S.; Rubino, F. Bariatric-metabolic surgery versus conventional medical treatment in obese patients with type 2 diabetes: 5 year follow-up of an open-label, single-centre, randomised controlled trial. Lancet 2015, 386, 964–973. [Google Scholar] [CrossRef]
  17. Kanda, Y.; Hashiramoto, M.; Shimoda, M.; Hamamoto, S.; Tawaramoto, K.; Kimura, T.; Hirukawa, H.; Nakashima, K.; Kaku, K. Dietary restriction preserves the mass and function of pancreatic β cells via cell kinetic regulation and suppression of oxidative/ER stress in diabetic mice. J. Nutr. Biochem. 2015, 26, 219–226. [Google Scholar] [CrossRef]
  18. Lim, E.L.; Hollingsworth, K.G.; Aribisala, B.S.; Chen, M.J.; Mathers, J.C.; Taylor, R. Reversal of type 2 diabetes: Normalisation of beta cell function in association with decreased pancreas and liver triacylglycerol. Diabetologia 2011, 54, 2506–2514. [Google Scholar] [CrossRef] [Green Version]
  19. Perry, R.J.; Peng, L.; Cline, G.W.; Wang, Y.; Rabin-Court, A.; Song, J.D.; Zhang, D.; Zhang, X.M.; Nozaki, Y.; Dufour, S.; et al. Mechanisms by which a Very-Low-Calorie Diet Reverses Hyperglycemia in a Rat Model of Type 2 Diabetes. Cell Metab. 2018, 27, 210–217.e3. [Google Scholar] [CrossRef] [Green Version]
  20. Schenk, S.; McCurdy, C.E.; Philp, A.; Chen, M.Z.; Holliday, M.J.; Bandyopadhyay, G.K.; Osborn, O.; Baar, K.; Olefsky, J.M. Sirt1 enhances skeletal muscle insulin sensitivity in mice during caloric restriction. J. Clin. Investig. 2011, 121, 4281–4288. [Google Scholar] [CrossRef] [Green Version]
  21. Zhang, S.; Guo, W.; Wu, J.; Gong, L.; Li, Q.; Xiao, X.; Zhang, J.; Wang, Z. Increased beta-Cell Mass in Obese Rats after Gastric Bypass: A Potential Mechanism for Improving Glycemic Control. Med. Sci. Monit. 2017, 23, 2151–2158. [Google Scholar] [CrossRef] [PubMed]
  22. Mosinski, J.D.; Aminian, A.; Axelrod, C.L.; Batayyah, E.; Romero-Talamas, H.; Daigle, C.; Mulya, A.; Scelsi, A.; Schauer, P.R.; Brethauer, S.A.; et al. Roux-en-Y gastric bypass restores islet function and morphology independent of body weight in ZDF rats. Am. J. Physiol. Endocrinol. Metab. 2021, 320, E392–E398. [Google Scholar] [CrossRef] [PubMed]
  23. Lindqvist, A.; Spégel, P.; Ekelund, M.; Garcia Vaz, E.; Pierzynowski, S.; Gomez, M.F.; Mulder, H.; Hedenbro, J.; Groop, L.; Wierup, N. Gastric bypass improves β-cell function and increases β-cell mass in a porcine model. Diabetes 2014, 63, 1665–1671. [Google Scholar] [CrossRef] [PubMed] [Green Version]
  24. Prasad, M.; Mark, V.; Ligon, C.; Dutia, R.; Nair, N.; Shah, A.; Laferrère, B. Role of the Gut in the Temporal Changes of β-Cell Function After Gastric Bypass in Individuals With and Without Diabetes Remission. Diabetes Care 2022, 45, 469–476. [Google Scholar] [CrossRef] [PubMed]
  25. Dobbins, R.L.; Chester, M.W.; Daniels, M.B.; McGarry, J.D.; Stein, D.T. Circulating fatty acids are essential for efficient glucose-stimulated insulin secretion after prolonged fasting in humans. Diabetes 1998, 47, 1613–1618. [Google Scholar] [CrossRef] [PubMed]
  26. Stein, D.T.; Esser, V.; Stevenson, B.E.; Lane, K.E.; Whiteside, J.H.; Daniels, M.B.; Chen, S.; McGarry, J.D. Essentiality of circulating fatty acids for glucose-stimulated insulin secretion in the fasted rat. J. Clin. Investig. 1996, 97, 2728–2735. [Google Scholar] [CrossRef] [PubMed]
  27. Diraison, F.; Parton, L.; Ferré, P.; Foufelle, F.; Briscoe, C.P.; Leclerc, I.; Rutter, G.A. Over-expression of sterol-regulatory-element-binding protein-1c (SREBP1c) in rat pancreatic islets induces lipogenesis and decreases glucose-stimulated insulin release: Modulation by 5-aminoimidazole-4-carboxamide ribonucleoside (AICAR). Biochem. J. 2004, 378, 769–778. [Google Scholar] [CrossRef]
  28. Andreolas, C.; da Silva Xavier, G.; Diraison, F.; Zhao, C.; Varadi, A.; Lopez-Casillas, F.; Ferré, P.; Foufelle, F.; Rutter, G.A. Stimulation of acetyl-CoA carboxylase gene expression by glucose requires insulin release and sterol regulatory element binding protein 1c in pancreatic MIN6 beta-cells. Diabetes 2002, 51, 2536–2545. [Google Scholar] [CrossRef]
  29. Dubois, M.; Kerr-Conte, J.; Gmyr, V.; Bouckenooghe, T.; Muharram, G.; D’Herbomez, M.; Martin-Ponthieu, A.; Vantyghem, M.C.; Vandewalle, B.; Pattou, F. Non-esterified fatty acids are deleterious for human pancreatic islet function at physiological glucose concentration. Diabetologia 2004, 47, 463–469. [Google Scholar] [CrossRef] [Green Version]
  30. Zhou, Y.P.; Grill, V.E. Long-term exposure of rat pancreatic islets to fatty acids inhibits glucose-induced insulin secretion and biosynthesis through a glucose fatty acid cycle. J. Clin. Investig. 1994, 93, 870–876. [Google Scholar] [CrossRef] [Green Version]
  31. Nolan, C.J.; Leahy, J.L.; Delghingaro-Augusto, V.; Moibi, J.; Soni, K.; Peyot, M.L.; Fortier, M.; Guay, C.; Lamontagne, J.; Barbeau, A.; et al. Beta cell compensation for insulin resistance in Zucker fatty rats: Increased lipolysis and fatty acid signalling. Diabetologia 2006, 49, 2120–2130. [Google Scholar] [CrossRef] [PubMed]
  32. Zhai, H.; Li, Z.; Peng, M.; Huang, Z.; Qin, T.; Chen, L.; Li, H.; Zhang, H.; Zhang, W.; Xu, G. Takeda G Protein-Coupled Receptor 5-Mechanistic Target of Rapamycin Complex 1 Signaling Contributes to the Increment of Glucagon-Like Peptide-1 Production after Roux-en-Y Gastric Bypass. EBioMedicine 2018, 32, 201–214. [Google Scholar] [CrossRef] [PubMed] [Green Version]
  33. Schneider, C.A.; Rasband, W.S.; Eliceiri, K.W. NIH Image to ImageJ: 25 years of image analysis. Nat. Methods. 2012, 9, 671–675. [Google Scholar] [CrossRef]
  34. Rahier, J.; Guiot, Y.; Goebbels, R.; Sempoux, C.; Henquin, J.-C. Pancreatic β-cell mass in European subjects with type 2 diabetes. Diabetes Obes. Metab. 2008, 10, 32–42. [Google Scholar] [CrossRef] [PubMed]
  35. Kahn, S.E.; Cooper, M.E.; Del Prato, S. Pathophysiology and treatment of type 2 diabetes: Perspectives on the past, present, and future. Lancet 2014, 383, 1068–1083. [Google Scholar] [CrossRef] [Green Version]
  36. Wang, P.; Zhang, R.Y.; Song, J.; Guan, Y.F.; Xu, T.Y.; Du, H.; Viollet, B.; Miao, C.Y. Loss of AMP-activated protein kinase-α2 impairs the insulin-sensitizing effect of calorie restriction in skeletal muscle. Diabetes 2012, 61, 1051–1061. [Google Scholar] [CrossRef] [PubMed] [Green Version]
  37. Sheng, C.; Li, F.; Lin, Z.; Zhang, M.; Yang, P.; Bu, L.; Sheng, H.; Li, H.; Qu, S. Reversibility of β-Cell-Specific Transcript Factors Expression by Long-Term Caloric Restriction in db/db Mouse. J. Diabetes Res. 2016, 2016, 6035046. [Google Scholar] [CrossRef] [PubMed] [Green Version]
  38. Gao, X.; Yan, D.; Zhao, Y.; Tao, H.; Zhou, Y. Moderate calorie restriction to achieve normal weight reverses β-cell dysfunction in diet-induced obese mice: Involvement of autophagy. Nutr. Metab. 2015, 12, 34. [Google Scholar] [CrossRef] [Green Version]
  39. Loweth, A.C.; Williams, G.T.; James, R.F.; Scarpello, J.H.; Morgan, N.G. Human islets of Langerhans express Fas ligand and undergo apoptosis in response to interleukin-1beta and Fas ligation. Diabetes 1998, 47, 727–732. [Google Scholar] [CrossRef]
  40. Zhang, S.; Liu, H.; Yu, H.; Cooper, G.J. Fas-associated death receptor signaling evoked by human amylin in islet beta-cells. Diabetes 2008, 57, 348–356. [Google Scholar] [CrossRef] [PubMed] [Green Version]
  41. Liu, Y.; Zhou, Y.; Wang, Y.; Geng, D.; Liu, J. Roux-en-Y gastric bypass-induced improvement of glucose tolerance and insulin resistance in type 2 diabetic rats are mediated by glucagon-like peptide-1. Obes. Surg. 2011, 21, 1424–1431. [Google Scholar] [CrossRef] [PubMed]
  42. Mocanu, A.O.; Mulya, A.; Huang, H.; Dan, O.; Schauer, P.R.; Dinischiotu, A.; Brethauer, S.A.; Kirwan, J.P. Effect of Roux-en-Y Gastric Bypass on the NLRP3 Inflammasome in Pancreatic Islets from Zucker Diabetic Fatty Rats. Obes. Surg. 2016, 26, 3076–3081. [Google Scholar] [CrossRef] [PubMed] [Green Version]
  43. Taylor, R. Pathogenesis of type 2 diabetes: Tracing the reverse route from cure to cause. Diabetologia 2008, 51, 1781–1789. [Google Scholar] [CrossRef] [Green Version]
  44. Lee, Y.; Lingvay, I.; Szczepaniak, L.S.; Ravazzola, M.; Orci, L.; Unger, R.H. Pancreatic steatosis: Harbinger of type 2 diabetes in obese rodents. Int. J. Obes. 2010, 34, 396–400. [Google Scholar] [CrossRef] [Green Version]
  45. Warnotte, C.; Gilon, P.; Nenquin, M.; Henquin, J.C. Mechanisms of the stimulation of insulin release by saturated fatty acids: A study of palmitate effects in mouse beta-cells. Diabetes 1994, 43, 703–711. [Google Scholar] [PubMed]
  46. Steven, S.; Hollingsworth, K.G.; Small, P.K.; Woodcock, S.A.; Pucci, A.; Aribisala, B.; Al-Mrabeh, A.; Daly, A.K.; Batterham, R.L.; Taylor, R. Weight Loss Decreases Excess Pancreatic Triacylglycerol Specifically in Type 2 Diabetes. Diabetes Care 2016, 39, 158–165. [Google Scholar] [CrossRef] [PubMed]
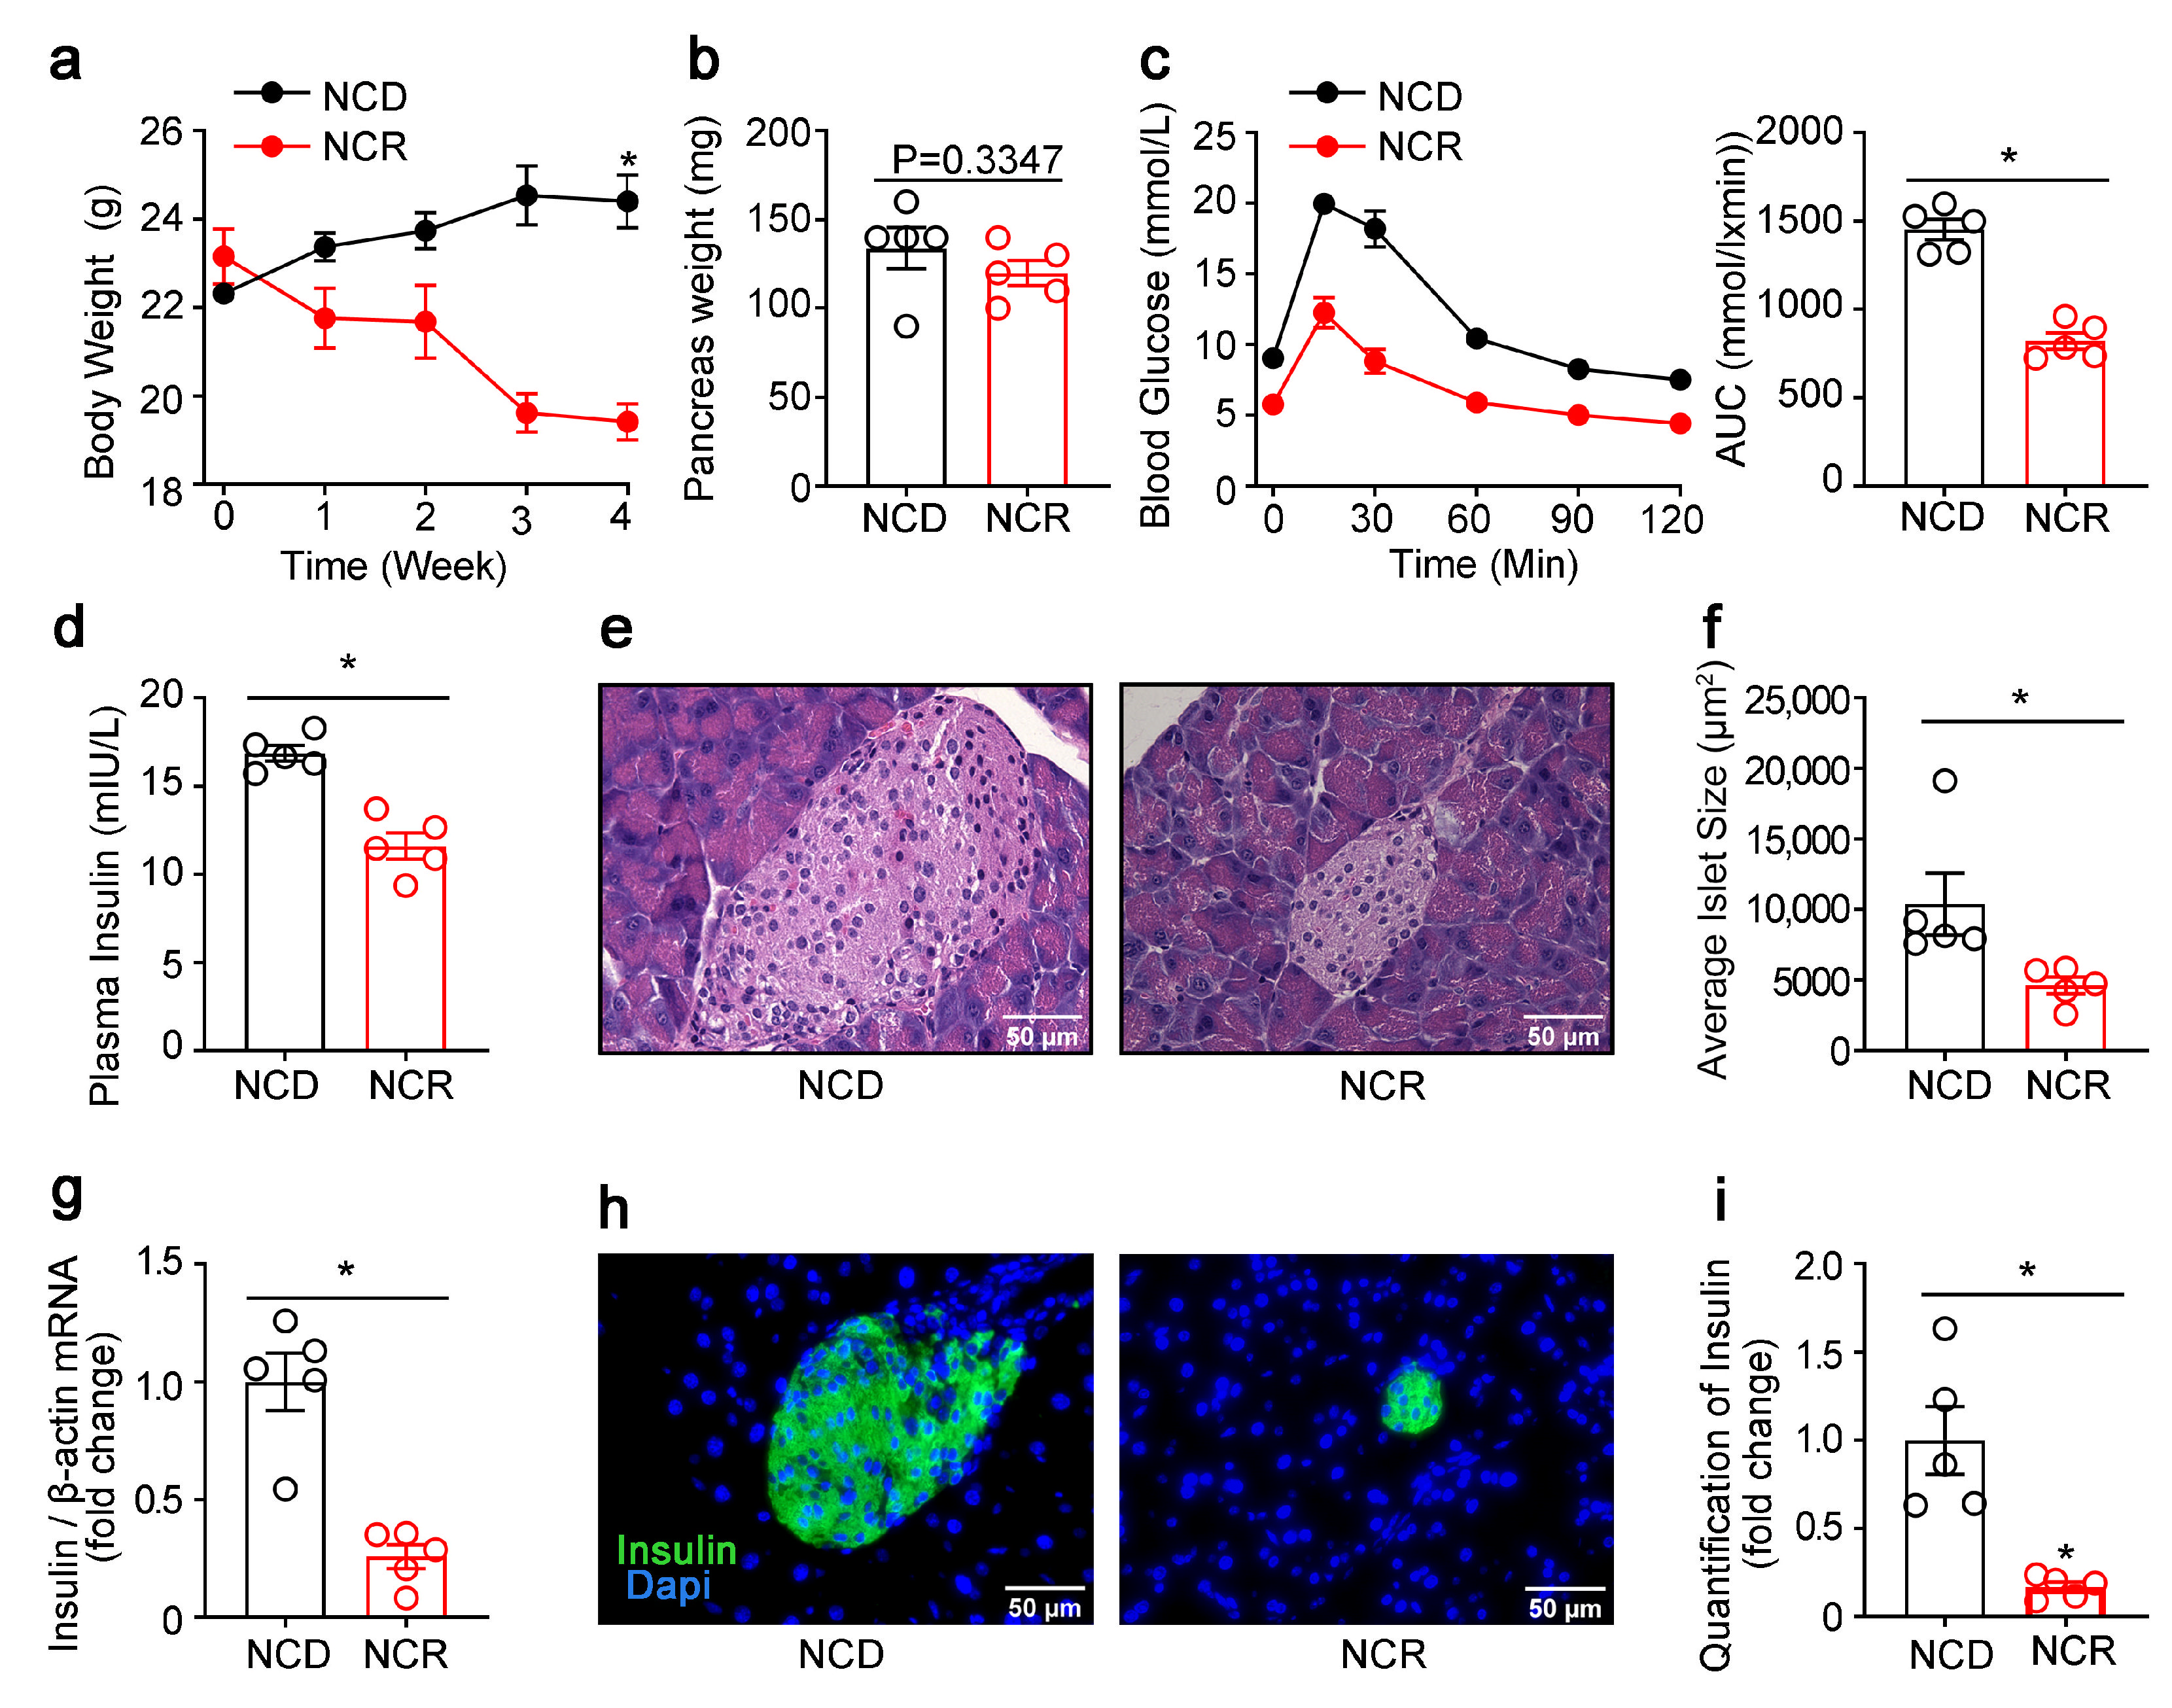
Figure 1. CR reduced β-cell area and insulin production in regular diet-fed mice. (a) Body weight curves of calorie-restricted NCD-fed mice. (b) Weight of the pancreas. (c) Intraperitoneal glucose tolerance test. (d) Insulin levels were measured at 15 min after glucose injection. (e) HE staining of pancreatic sections. (f) Quantification of islet size. (g) Insulin mRNA. (h) Immunofluorescence staining for insulin (insulin, green) in the pancreases of NCD or a diet restricted to 70% of the calories of the ad libitum group (NCR). Nuclei were stained with DAPI (blue). (i) Quantification of insulin. The results were expressed as mean values ± SEM. (Five mice per group) * p < 0.05 vs. NCD mice.
Genes 14 00005 g001
Figure 2. CR stimulated β-cell apoptosis in normal chow diet-fed mice. (a,c) Representative immunofluorescence images of cleaved caspase-3 (CC3, red), death receptor Fas/CD95 (Fas, red), and insulin (green). (b) Quantification of CC3-positive β-cells/total β-cells (β-cell apoptosis frequency). (d) Quantification of Fas-positive β-cells/total β-cells. The results were expressed as mean values ± SEM. (Five mice per group) * p < 0.05 vs. NCD mice.
Genes 14 00005 g002
Figure 3. CR increased the lipogenic gene expression in pancreas of normal chow diet-fed mice. (a) Representative immunofluorescence images of fatty acid synthase (FASN, red) and insulin (insulin, green). (b) Quantification of FASN-positive β-cells/total β-cells. (c) Representative Western blot of mouse pancreas. PPARγ, SREBP1c, ACC, and FASN were measured. Quantification of PPARγ, SREBP1c, ACC, and FASN. (d) PPARγ, SREBP1c, ACC, and FASN mRNA levels. (e) Pancreatic triglyceride. The results were expressed as mean values ± SEM. (n = 5 per group) * p < 0.05 vs. NCD mice.
Genes 14 00005 g003
Figure 4. CR decreased insulin production in diabetic mice. (a) Body weight curves of CR-treated high-fat diet-fed mice. (b) Weight of pancreas. (c) Intraperitoneal glucose tolerance test. (d) Plasma insulin at 15 min after glucose injection. (e) HE staining of pancreatic sections. (f) Quantification of islet size. (g) Insulin mRNA. (h) Immunofluorescence staining for insulin (green) in the pancreas of mice fed with HFD or HCR. (i) Quantification of insulin. The results were expressed as mean values ± SEM. (six mice per group), * p < 0.05 vs. HFD mice.
Genes 14 00005 g004
Figure 5. CR induced islet β-cell apoptosis in diabetic mice. (a) Representative immunofluorescence images of cleaved caspase-3 (CC3, red) and insulin (green). (b) Quantification of CC3-positive β-cells/total β-cells. The results were expressed as mean values ± SEM. (n = 6 per group), * p < 0.05 vs. HFD mice.
Genes 14 00005 g005
Figure 6. CR stimulated the lipogenic gene expression in pancreas of high-fat diet-fed mice. (a) Representative immunofluorescence images of fatty acid synthase (FASN, red) and insulin (green). (b) Quantification of FASN-positive β-cells/total β-cells. (c) Representative Western blot from HFD or HCR mouse pancreas. PPARγ, SREBP1c, ACC, and FASN were measured. Quantification of PPARγ, SREBP1c, ACC, and FASN. (d) PPARγ, SREBP1c, ACC, and FASN mRNA levels. The results were expressed as mean values ± SEM. (six mice per group), * p < 0.05 vs. HFD mice.
Genes 14 00005 g006
Figure 7. RYGB increased β-cell area in diet-induced diabetic mice. (a) Body weight of RYGB-treated diabetic mice. (b) Intraperitoneal glucose tolerance test. (c) HE staining of pancreatic sections. (d) Quantification of islet size. (e) Immunofluorescence staining for insulin (green) in the pancreas from the sham-operated or RYGB mice. (f) Quantification of insulin. The results were expressed as mean values ± SEM. (n = 11 for sham, n = 9 for RYGB), * p < 0.05 vs. sham-operated animals.
Genes 14 00005 g007
Figure 8. RYGB stimulated apoptosis of β-cells but decreased the expression of lipid synthesis genes. (a,c) Representative immunofluorescence images of the RYGB and sham-operated mice for cleaved caspase-3 (CC3, red), fatty acid synthase (FASN, red), and insulin (green). (b) Quantification of CC3-positive β-cells/total β-cells (β-cell apoptosis frequency). (d) Quantification of FASN-positive β-cells/total β-cells. The results were expressed as mean values ± SEM. (n = 11 for sham, n = 9 for RYGB), * p < 0.05 vs. sham mice.
Genes 14 00005 g008
Table 1. List and sequences of primers used in the RT-PCR experiments.
Upstream Primer (5′-3′)Downstream Primer (5′-3′)Accession Number(s)
PPARγTCAGCTCTGTGGACCTCTCCACCCTTGCATCCTTCACAAGXM_017321456.3
SREBP1cGGAGCCATGGATTGCACATTGGAAGTCACTGTCTTGGTTGTTGAXM_006532716.4
FASNTGGGTTCTAGCCAGCAGAGTACCACCAGAGACCGTTATGCNM_007988.3
ACCTGGTCGTGACTGCTCTGTGCGTAGCCGAGGGTTCAGTTCCXM_006531956.3
insulinCCTGGTGGAGGCTCTCTACCTCAGAGGGGTAGGCTGGGTAGTNM_001185084.2
β-actinCCACAGCTGAGAGGGAAATCAAGGAAGGCTGGAAAAGAGCNM_007393.5
Disclaimer/Publisher’s Note: The statements, opinions and data contained in all publications are solely those of the individual author(s) and contributor(s) and not of MDPI and/or the editor(s). MDPI and/or the editor(s) disclaim responsibility for any injury to people or property resulting from any ideas, methods, instructions or products referred to in the content.