Article

Genome-Wide Association Study of Egg Production Traits in Shuanglian Chickens Using Whole Genome Sequencing

1
Institute of Animal Husbandry and Veterinary, Hubei Academy of Agricultural Science, Wuhan 430064, China
2
Hubei Key Laboratory of Animal Embryo and Molecular Breeding, Hubei Academy of Agricultural Science, Wuhan 430064, China
*
Author to whom correspondence should be addressed.
Genes 2023, 14(12), 2129; https://doi.org/10.3390/genes14122129
Submission received: 28 October 2023 / Revised: 23 November 2023 / Accepted: 24 November 2023 / Published: 25 November 2023
(This article belongs to the Special Issue Poultry Genetics and Genomics)

Abstract

:
Egg production is the most important economic trait in laying hens. To identify molecular markers and candidate genes associated with egg production traits, such as age at first egg (AFE), weight at first egg (WFE), egg weight (EW), egg number (EN), and maximum consecutive egg laying days (MCD), a genome-wide analysis by whole genome sequencing was performed in Shuanglian chickens. Through whole genome sequencing and quality control, a total of 11,006,178 SNPs were obtained for further analysis. Heritability estimates ranged from moderate to high for EW (0.897) and MCD (0.632), and from low to moderate (0.193~0.379) for AFE, WFE, and EN. The GWAS results showed 11 genome-wide significant SNPs and 23 suggestive significant SNPs were identified to be associated with EN, MCD, WFE, and EW. Linkage disequilibrium analysis revealed twenty-seven SNPs associated with EN were located in a 0.57 Mb region on GGA10, and clustered into five blocks. Through functional annotation, three candidate genes NEO1, ADPGK, and CYP11A1, were identified to be associated with EN, while the S1PR4, LDB2, and GRM8 genes was linked to MCD, WFE, and EW, respectively. These findings may help us to better understand the molecular mechanisms underlying egg production traits in chickens and contribute to genetic improvement of these traits.

1. Introduction

Egg production is the most important economic trait in laying hens. In 2022, global chicken egg production was approximately 88.68 million tons, accounting for about 93% of the poultry egg production [1]. Egg production traits mainly include the egg number (EN), age at first egg (AFE), weight at first egg (WFE), and egg weight (EW). EN is the most important production performance indicator among these traits, which is directly related to egg production [2,3]. Furthermore, improving these egg production traits is the main objective in chicken breeding programs [4]. However, since these traits are commonly of low heritability, complex, and controlled by polygenes, the genetic progress obtained through conventional breeding approaches is minor [5]. Therefore, it is necessary to identify the key markers and genes associated with these traits for molecular breeding.
QTL mapping and genome-wide association study (GWAS) have been widely employed to detect many molecular markers for complex traits in chickens [6,7,8]. To date, a total of 540 QTLs have been reported to be associated with egg number (EN), 56 QTLs with age at first egg (AFE), and 393 QTLs with egg weight (EW) in the Chicken QTL database (https://www.animalgenome.org/cgi-bin/QTLdb/GG/index, accessed on 25 August 2023). However, the resolution of QTL mapping and GWAS is poor due to the wide confidence intervals for position, resulting in few detected causative genes associated with these traits. In addition, studies on candidate genes related to egg production traits are mainly focused on the endocrine hypothalamic-pituitary-gonadal (HPG) axis [9]. A number of candidate genes, including GnRH-I, NPY, GNRHR, GnIH, FSHR, PRL, PRLR, ESR, and VIP, have been identified by these association studies [10]. In novel genes mining by GWAS, related studies have only reported a few SNPs significantly associated with egg production traits, and most of these SNPs are located on chromosomes 1, 2, 3, 4, 5, 6, 9, and 21 [9,11,12,13,14]. Therefore, to better understand the molecular mechanisms underlying egg production performance, more candidate genes and SNPs need to be identified.
The Shuanglian chicken is a well-known indigenous breed in China, which has characteristics of early sexual maturity, good meat quality, disease resistance, and excellent egg quality. In the present study, GWAS was performed on 163 Shuanglian chickens to identify molecular markers and candidate genes affecting egg production traits by whole genome sequencing. These promising SNPs and genes could be helpful to engineer practical breeding programs for the improvement of egg production performance.

2. Materials and Methods

2.1. Ethics Statement

All the animal research activities in this study were approved by the Animal Care and Use Committee of the Institute of Animal Science and Veterinary Medicine, Hubei Academy of Agricultural Sciences (HBAAS20220216).

2.2. Population and Phenotyping Measurement

The population size of Shuanglian chickens was 163 in this study. All chickens were raised in stair-step individual cages at Jinshui Experimental Base (Wuhan, Hubei province, China) under the regular feeding and management conditions. We recorded the egg production every day. The phenotyping measurement includes six traits: age at first egg (AFE), weight at first egg (WFE), egg weight (EW), egg number at 40 weeks (EN40), egg number at 43 weeks (EN43), and maximum consecutive egg laying days (MCD). The phenotypic correlation between each pair of traits were evaluated using SPSS software 20. A blood sample of each chicken was collected and put into a corning tube with EDTA for preparing the genomic DNA.

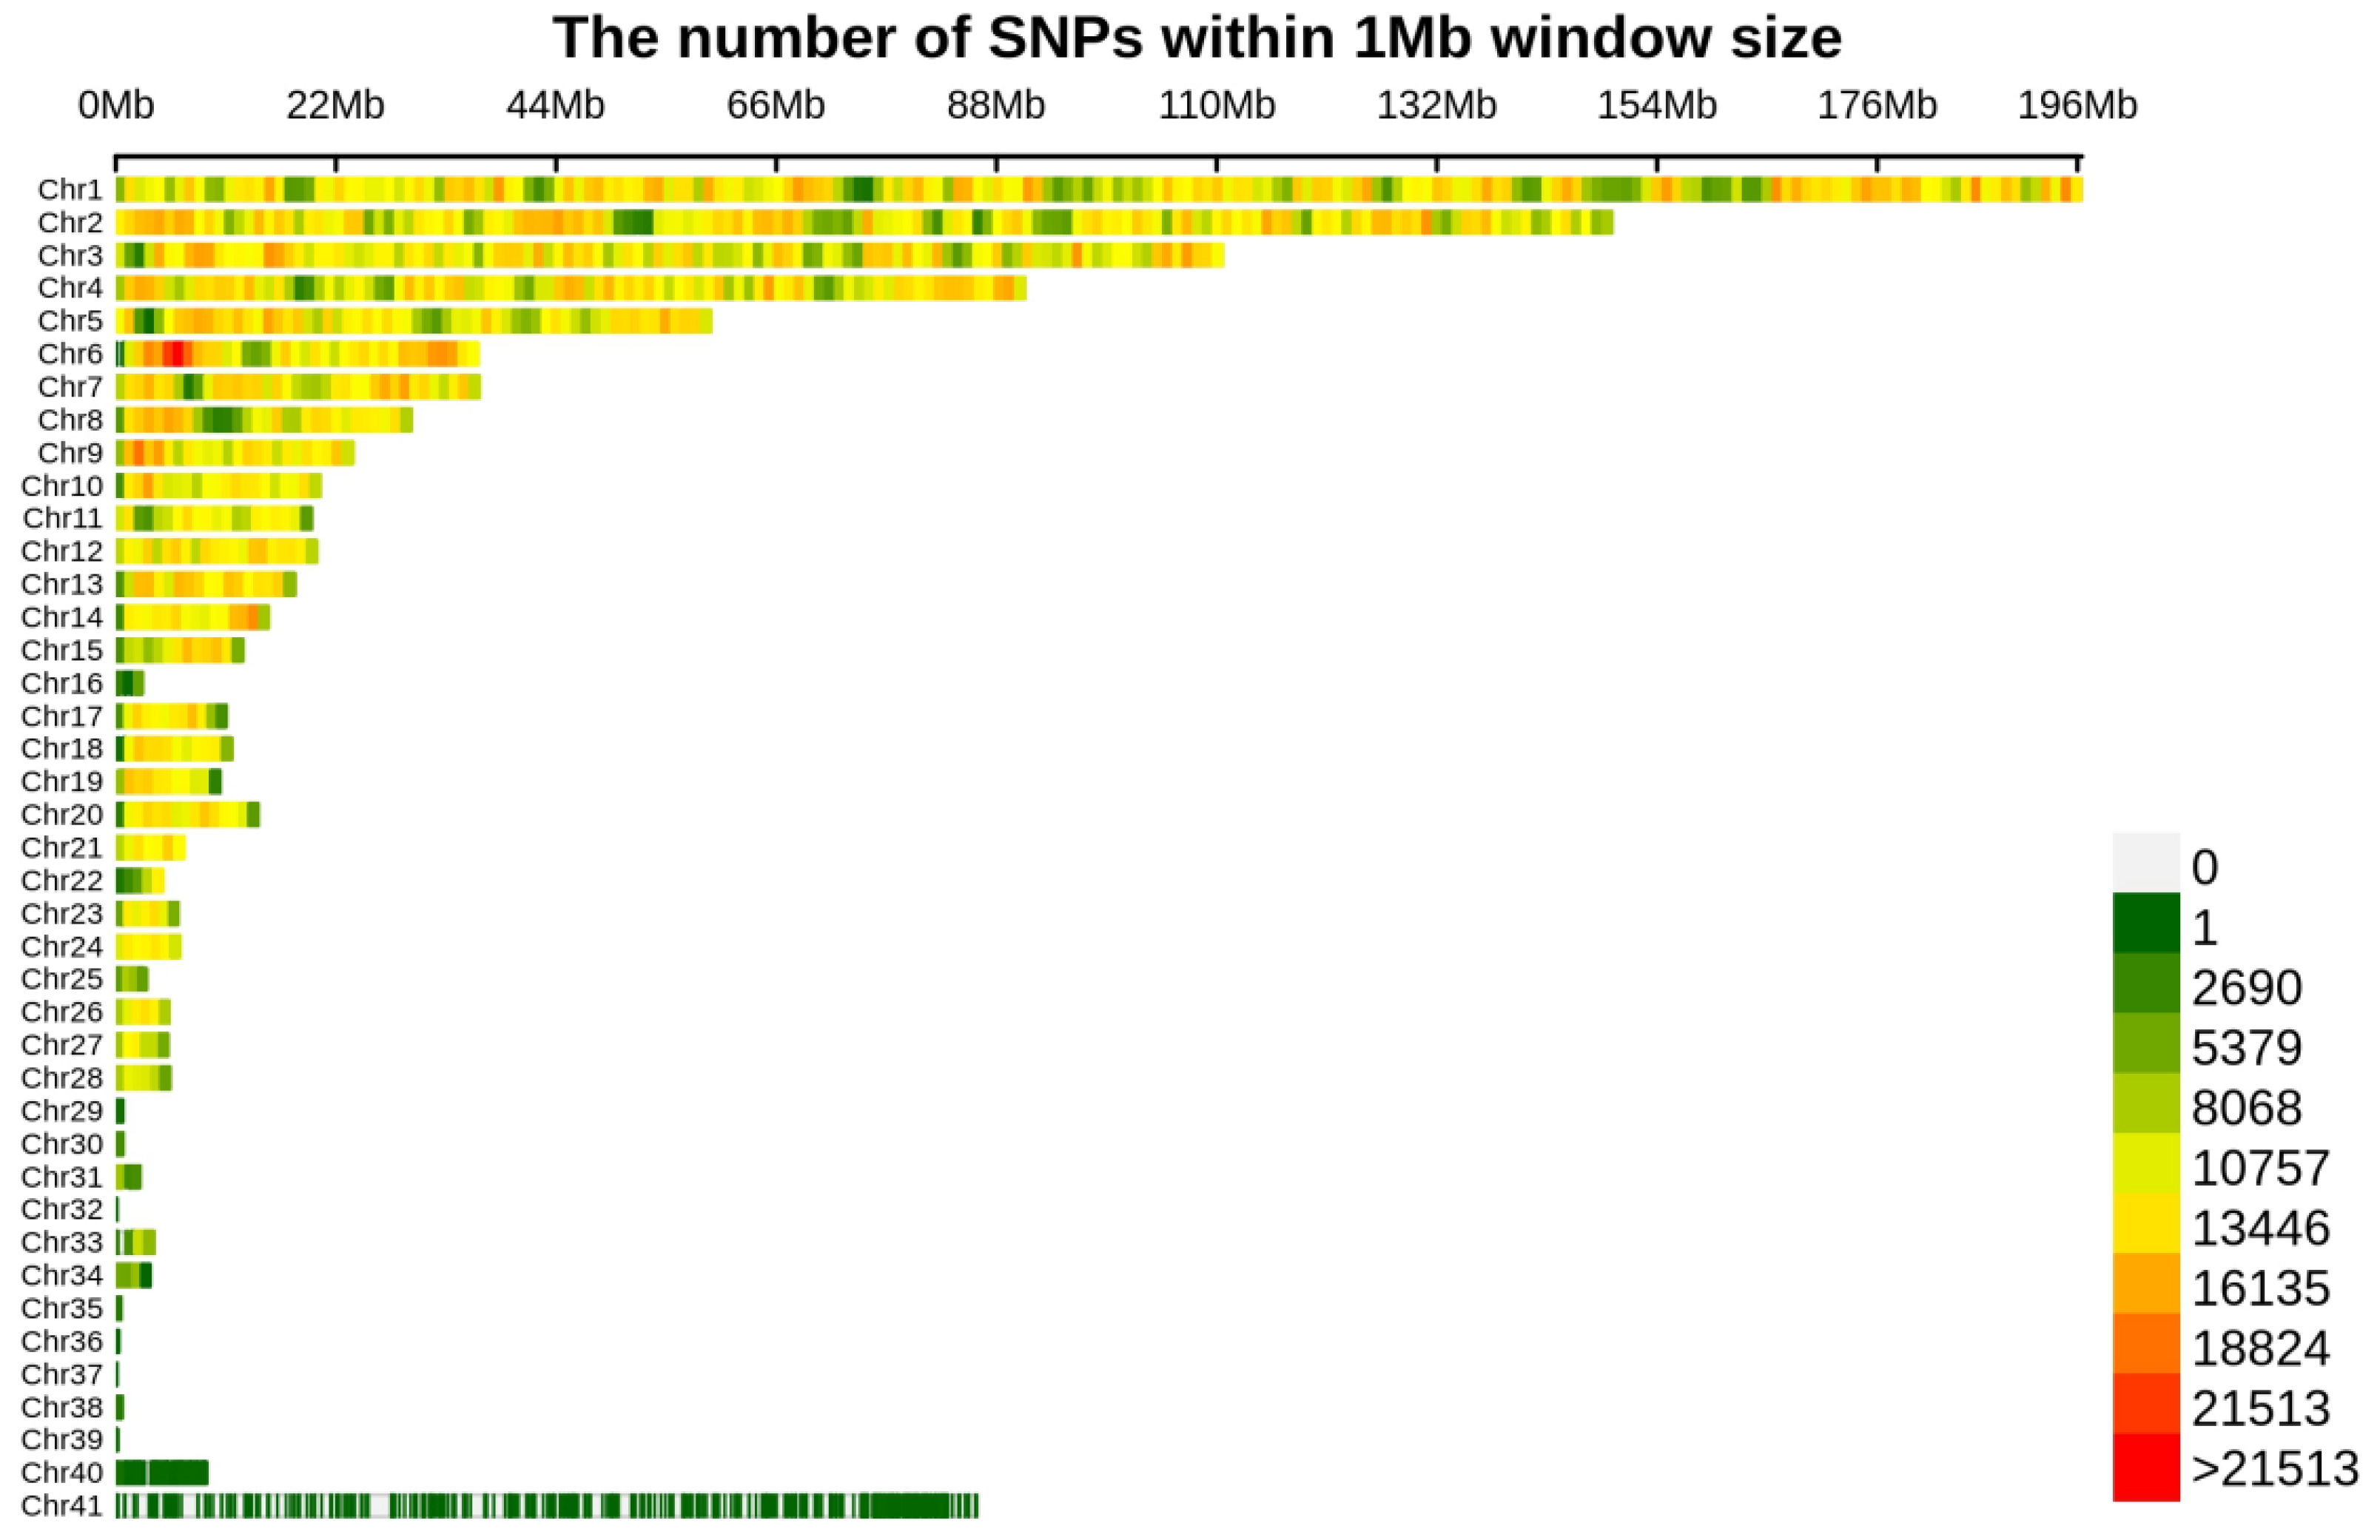
2.3. Whole Genome Sequencing and Quality Control

The genomic DNA was extracted using a standard technique of digestion with proteinase K followed by phenol-chloroform extraction and ethanol precipitation [15]. DNA concentration and purity were measured by NanoDrop 2000 Spectrophotometer (Thermo Scientific, Waltham, MA, USA). The DNA extract was stored at −80 °C for further analysis.
The genomic DNA of 163 chickens was sequenced in Beijing Compass Biotechnology Co. Ltd. (Beijing, China) High-quality paired-end 150 bp reads were obtained with a sequencing depth of 10× for each sample. All the reads were aligned against the GRCg7b reference (Ensembl release 110) using Burrow-Wheeler Alignment (BWA) software 0.1.17 [16]. The obtained reads were realigned using GATK software 4.1.8.1 [17]. The SNPs were then filtered with the following parameters: genotyping call rate < 0.95, minor allele frequency (MAF) < 0.05, and Hardy-Weinberg equilibrium (HWE) > 10−6 in PLINK1.90 [18]. The remaining SNPs with missing genotypes were imputed using the Beagle v5.0 procedure [19]. Finally, a total of 11,006,178 SNPs were obtained from 163 individuals.

2.4. Estimation of Genetic Parameters

Genetic parameters, including heritability and genetic correlation, were estimated based on average information-restricted maximum likelihood algorithm (AI-REML) in GCTA software 1.24.7 [20]. The estimate model was as follows:
y = X b + Z u + e
where y is the vector of phenotype; b is the fixed effect; X and Z are the matrices corresponding to b and u ; and e is the residual. u indicates the normal distribution ( u ~ N ( 0 ,   G j k σ u 2 ) ) that all the SNPs obey, in which σ u 2 is additive genetic variance, and G j k is constructed by genomic information:
G j k = 1 N i = 1 N ( X i j 2 p i ) ( X i k 2 p i ) 2 p i ( 1 p i )
where X i j is the copy number of the reference allele at the i th SNP of individual j ; X i k is the copy number of the reference allele at the i th SNP of individual k ; p i is the minor allele frequency of the i th SNP in the population; and N is the number of SNPs. The heritability of each trait was calculated as h 2 = σ g 2 σ g 2 + σ e 2 . Genetic correlation was calculated as:
r G = ( c o v G X Y ) σ G X 2 σ G Y 2
where r G represents the genetic correlation between trait X and Y ; c o v G X Y indicates the covariance of two traits; and σ G X 2 and σ G Y 2 indicate the variances of two traits, respectively.

2.5. Genome-Wide Association Study

The genome-wide association analysis was performed by mixed linear model in the GEMMA software 0.98.3 [21], and the model was as follows.
y = W a + X b + u + e
where y is the vector of phenotype; W is a matrix of covariates (including a column of 1 s and top three principal components of population structure); a is a vector of the corresponding coefficients including the intercept; X is a vector of SNP genotypes; b is the effect size of the SNP; u is a vector of individual random effects; e is a vector of errors. p-values were adjusted by the Bonferroni multiple test method, the threshold p-values of suggestive and genome-wide significance were calculated as 9.09 × 10⁻⁸ (1/11,006,178) and 4.54 × 10⁻⁹ (0.05/11,006,178), respectively.

2.6. Variance Explained by the Most Significant SNPs

Based on the most significant SNP associated with each trait, a linear regression model was constructed for analysis of variance:
Y = a + b X + e
where Y is the phenotype; X is the genotype of the SNP; and b is the effect value of the genotype; a is the intercept which represents the background value of individual phenotype after deducting the genotype effect; and e is the residual. Therefore, there are three variances in this model, and their relationship was as follows:
V a r Y = V a r b X + V a r e
where V a r Y is the variance of phenotype; V a r b X is the variance of genetic effect of the SNP; and V a r e is the variance of residual. The percentage of the phenotype variance explained by the most significant SNP was calculated as follows:
V a r S N P % = V a r b X / V a r Y

2.7. Linkage Disequilibrium Analysis and Identification of Candidate Genes

Linkage disequilibrium (LD) analysis was performed using LDBlockShow software 1.40 [22]. The candidate genes near the most significant SNPs or in the candidate genomic region were identified by the gene annotation information from Ensembl genome browser 110 (http://asia.ensembl.org/index.html, accessed on 25 August 2023). Kyoto Encyclopedia of Genes and Genomes (KEGG) and Gene Ontology (GO) analyses were employed to identify related pathways. KEGG and GO analyses were performed using OmicShare Tools (https://www.omicshare.com, accessed on 25 August 2023).

3. Results

3.1. Phenotype Data, Whole Genome Sequencing Data, and Population Structure

The phenotype data of age at first egg (AFE), weight at first egg (WFE), egg weight (EW), egg number at 40 weeks (EN40), egg number at 43 weeks (EN43), and maximum consecutive egg laying days (MCD) in the Shuanglian chicken population are shown in Table 1. Except for EW, the coefficient of variation (CV) of all traits is above 10%, with MCD having the highest CV (54.3%). Through whole genome sequencing and quality control, a total of 11,006,178 high-quality SNPs were obtained. The SNP density plot is presented in Figure 1. Principal component analysis (PCA) was carried out. And, the scatter plot of the first two principal components is displayed in Figure S1.

3.2. Estimation of Phenotypic and Genetic Parameters

Heritability, genetic correlation, and phenotypic correlations for AFE, WFE, EW, EN40, EN43, and MCD are shown in Table 2. Heritability of AFE, WFE, EW, EN40, EN43, and MCD was estimated to be within 0.193 and 0.897, with the heritability of egg weight (0.897) being the highest among them. The phenotypic correlation data indicated there was a significant correlation between most traits, AFE had a highly significant positive correlation with EW, and a highly significant negative correlation with EN. Similarly, a strong genetic correlation was observed among EN40, EN43, and MCD, the genetic correlation coefficient was almost 1, while the phenotypic correlation coefficient was also above 0.694.
The phenotypic correlation coefficients and genetic correlation coefficients among traits were located in the upper and lower triangle, respectively; the heritability of each trait was located in diagonal of the table. * indicates significant correlation (p < 0.05), ** (p < 0.01) and *** (p < 0.001) indicates extremely significant correlation, respectively.

3.3. Genome-Wide Association Analysis

The GWAS results of EN40, EN43, and MCD are shown in Figure 2, and the information of the significant SNPs is illustrated in Table 3.
GWAS results indicated 10 SNPs significantly associated with EN40 and EN43 were detected on chromosome 10 (GGA10), and the significant SNPs detected for these two traits were completely consistent, covering a 0.19 Mb (1.77 Mb−1.96 Mb) genomic region. The most significant SNP of EN40 was rs794599852 (G > A), located in the intron of NEO1 gene, and it explained 8.5% of the phenotypic variance. The most significant SNP of EN43 were rs737101872 (A > G), located in the intron of the ENSGALG00010025119 gene, and it explained 7.2% of the phenotypic variance. The most significant SNP of MCD was 28:1696604 (A > G), located in the upstream of the S1PR4 gene on GGA28, and it explained 22.8% of the phenotypic variance. In addition, nineteen suggestive significant SNPs were also found on GGA3, GGA4, and GGA10 to be associated with EN40; seventeen suggestive significant SNPs were also found on GGA1, GGA10, and GGA19 to be associated with EN43; one suggestive significant SNP related to EW and WFE was found on GGA1 and GGA4 (Figure S2, Table 4), respectively. Unfortunately, there was no genome-wide and suggestive significant SNP associated with AFE.

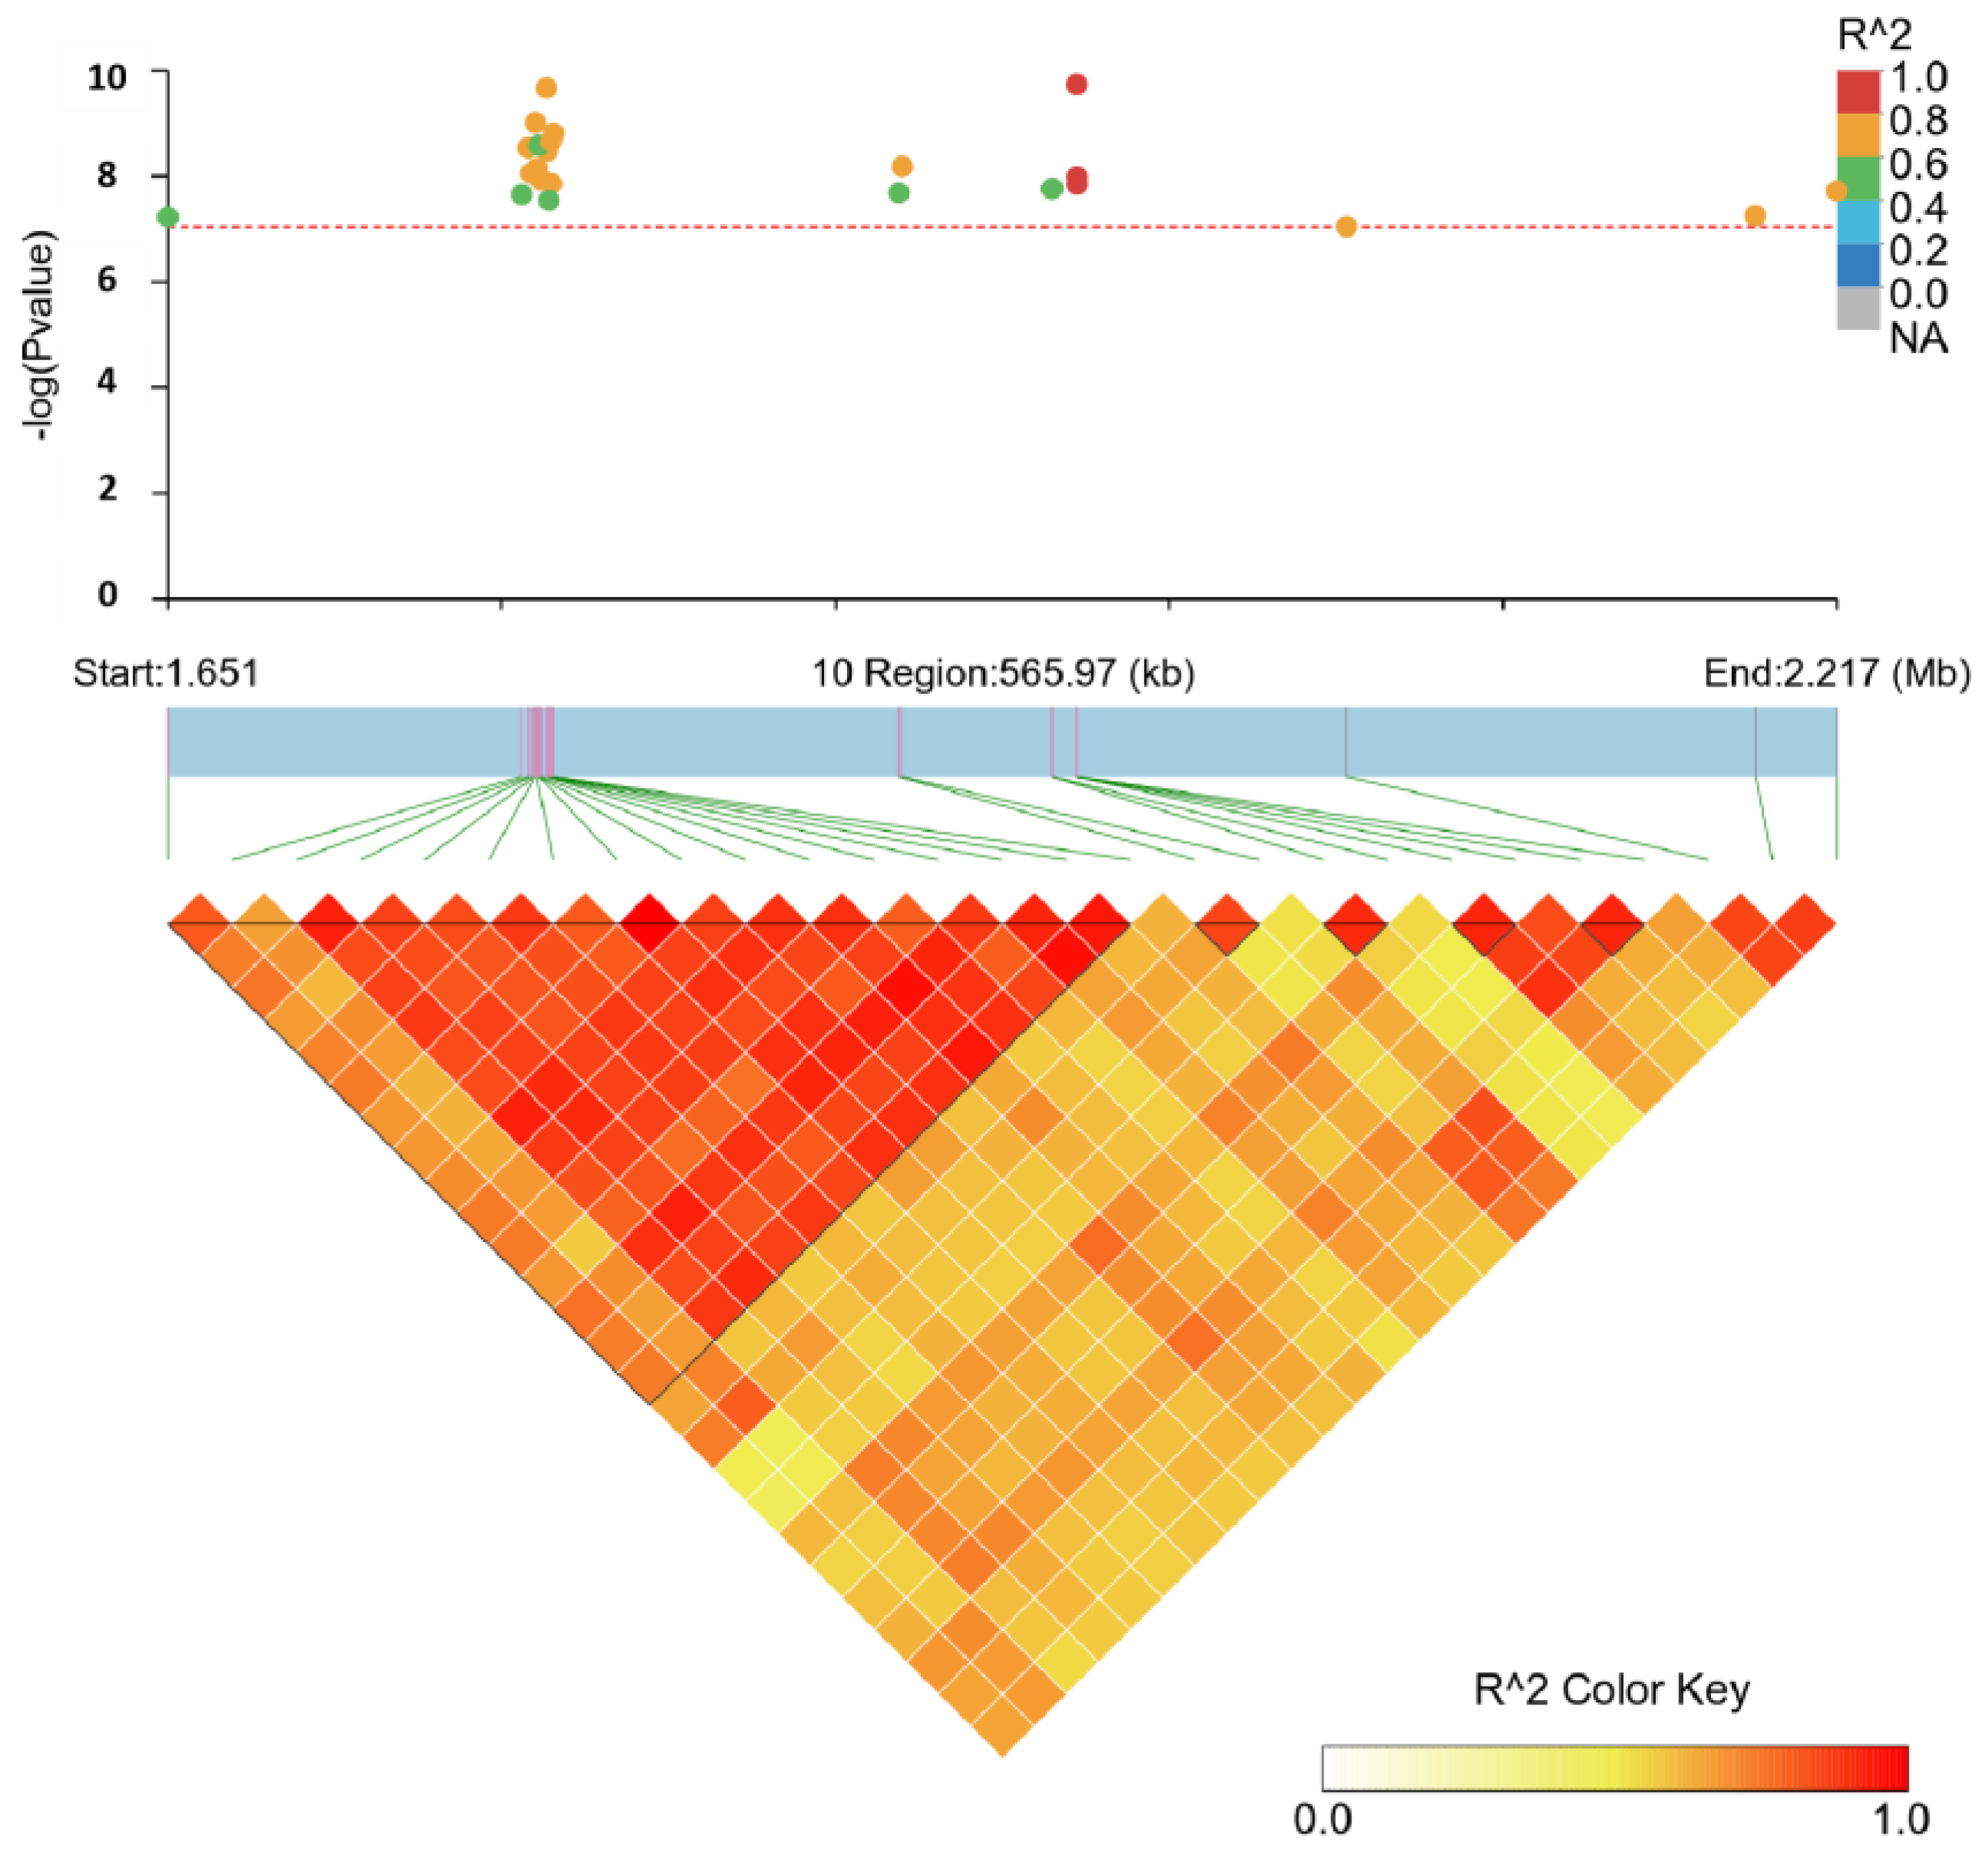
3.4. Linkage Disequilibrium Analysis

In order to fine-map the genomic region associated with EN, linkage disequilibrium analysis of the associated SNPs (10 significantly and 17 suggestively) on GGA10 was performed using LDBlockShow software 1.40 in Figure 3. The LD analysis revealed all genome-wide and suggestive significant SNPs associated with EN were located in the 0.57 Mb region, which were in strong LD status and were clustered into five blocks. Gene annotation data showed ten candidate genes (CELF6, BBS4, ADPGK, HEXA, ARIH1, PARP6, NEO1, HCN4, REC114, and NPTN) were identified in the block region.

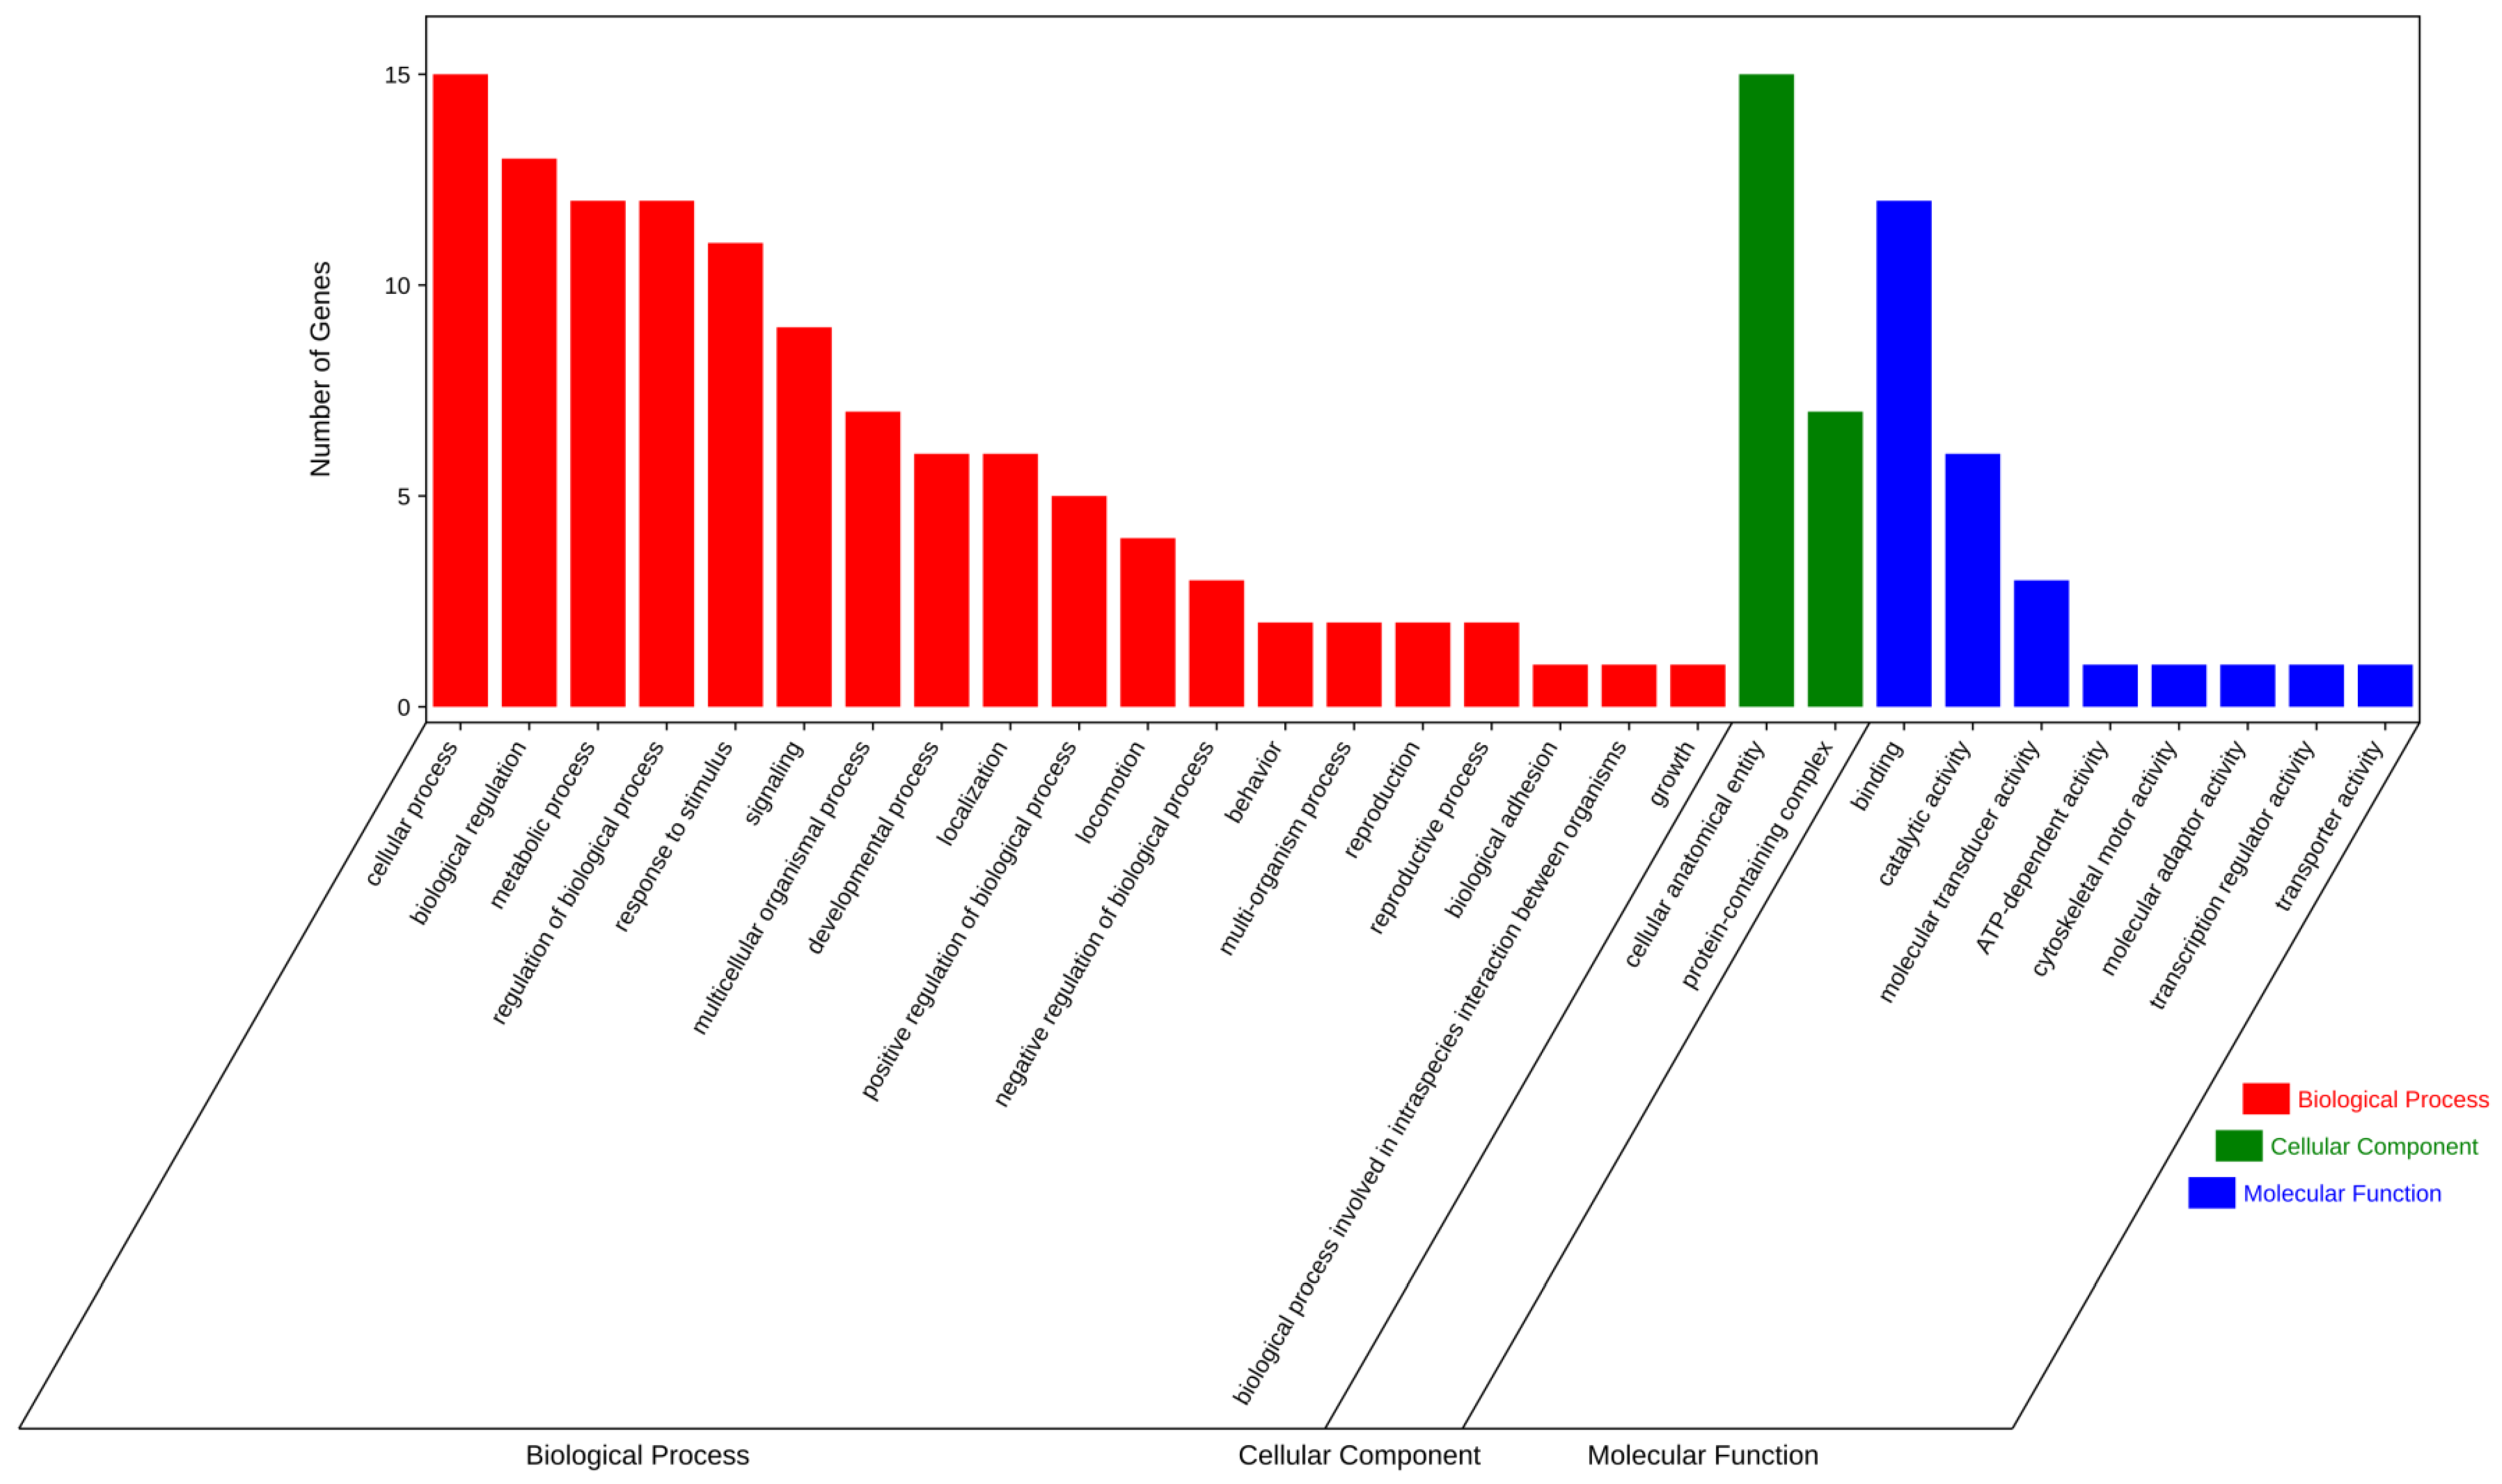
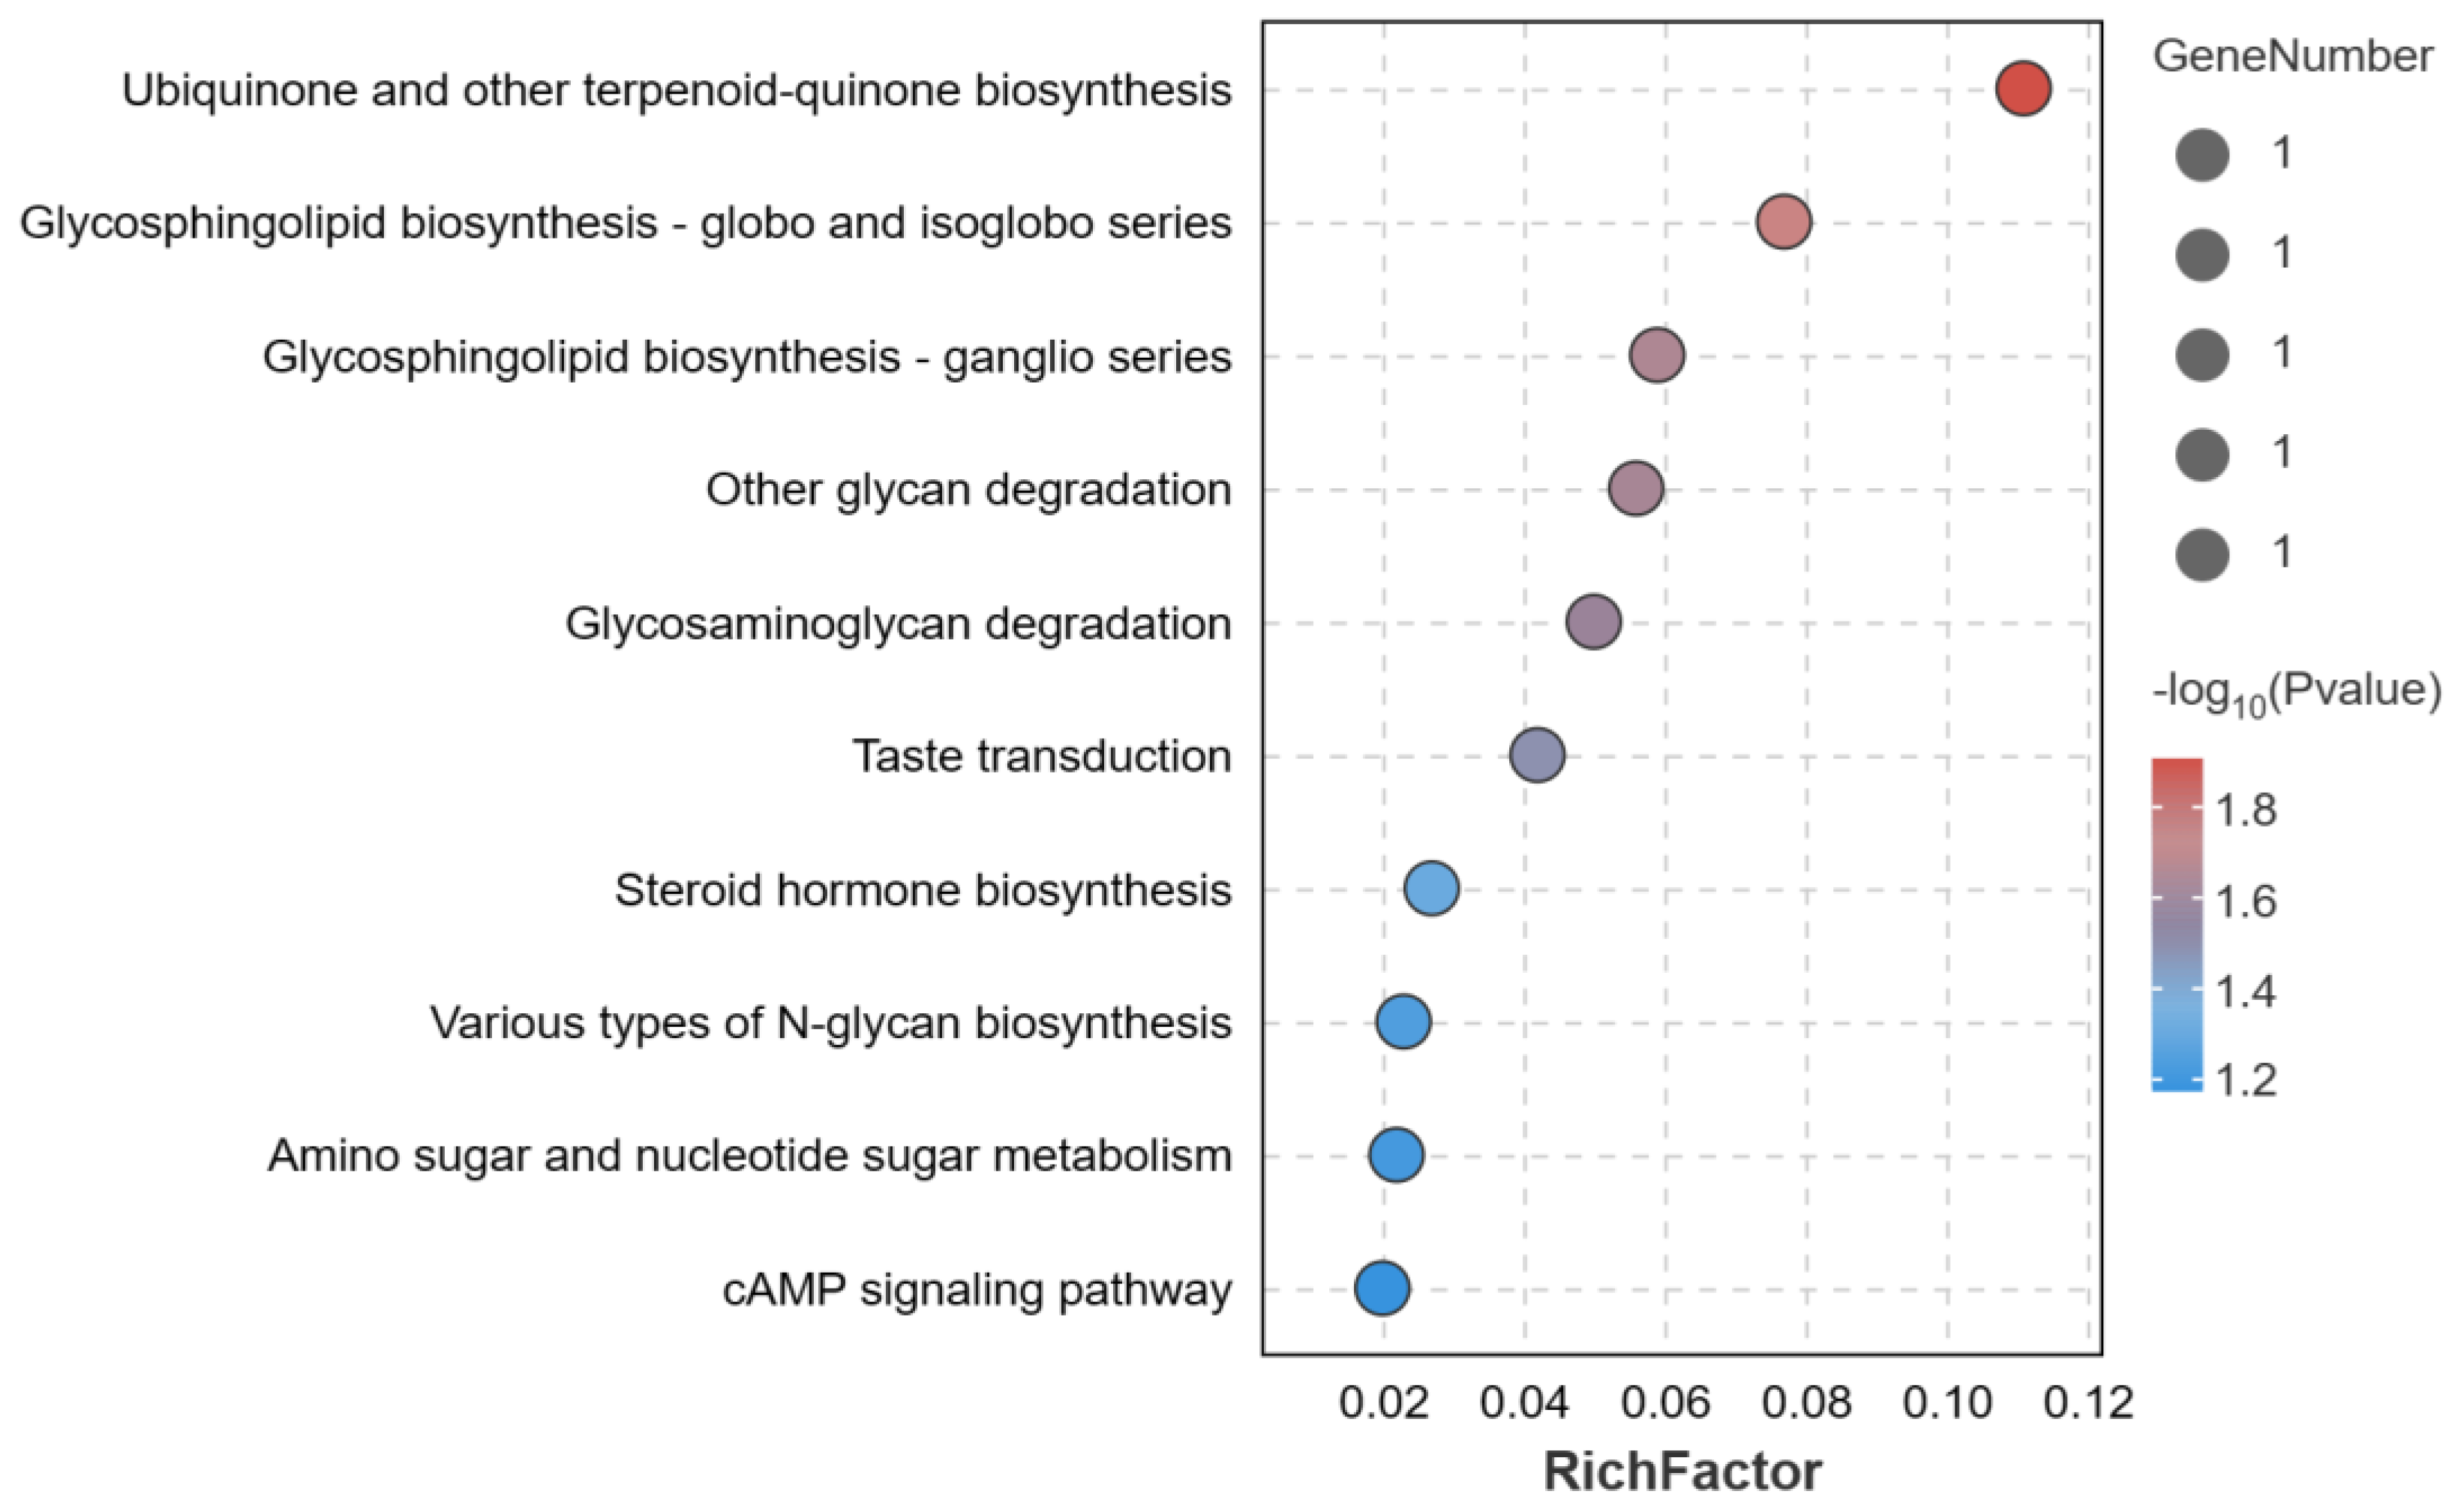
3.5. Enrichment Analysis

To gain insight into the function of these 34 significant SNPs associated with egg production traits, the corresponding candidate genes were used for GO and KEGG enrichment analysis. Most of these genes were significantly enriched in GO terms of biological processes (BP) and participated in cellular process (Figure 4). KEGG analysis revealed a total of seven significantly enriched pathways, mainly including the ubiquinone and other terpenoid-quinone biosynthesis, glycosphingolipid biosynthesis, and steroid hormone biosynthesis (Figure 5). More details of the GO and KEGG enrichment can be found in Tables S1 and S2.

4. Discussion

Egg production is not only an important economic trait, but also a complex quantitative trait, which is influenced by both genetics and environment, with genetics being the determining factor [9]. In this study, we present a GWAS to identify the candidate genes associated with egg production traits in a Shuanglian chicken population from China. In general, the important conditions for GWAS to achieve better results mainly include the number of markers, population structure, and relationships between individuals [23]. With the continuous development of high-throughput sequencing technology, the application of whole genome resequencing is becoming increasingly widespread. In this study, whole genome sequencing was used to obtain more genetic variation information. A total of 11,006,178 high-quality SNPs were finally obtained through quality control, which were evenly distributed on each chromosome. Based on high-quality SNPs, we analyzed the population structure and the relationship between individuals. The analysis of population structure indicated the population roughly fell into three subgroups. Therefore, in the construction of the GWAS model, the first three principal components from PCA were used as covariates, and the genetic relationship between individuals was also taken into consideration.
The coefficient of variation is an important indicator for measuring the uniformity of traits. In this study, the CV of AFE, WFE, MCD, EN40, and EN43 were all above 10%; the CV of MCD was 54.3%, indicating the significant phenotypic variations in these traits. In general, heritability is considered low if the value varies from 0 to 0.20, moderate at 0.20 to 0.40, and high at >0.40. Previous studies have shown the heritability of egg production traits was mostly between 0.160 and 0.640 [24,25], with the heritability of EN ranging from 0.160 to 0.250, indicating a low to moderate level of heritability. In this study, apart from EW (0.897), the heritability of AFE, WFE, MCD, EN40, and EN43 was within 0.193 and 0.632, indicating our estimation results of trait heritability were comparable to previous research. The high heritability of EW in this study indicated the genetic factor accounted for a large proportion of the phenotypic variation, which was conducive to revealing genetic characteristics of this trait in Shuanglian chickens.
The genetic correlation coefficient between AFE and EW, EN40, EN43, MCD were 0.678, −0.764, −0.789, and −0.442, respectively, suggesting a strong correlation among these traits. Moreover, the results of phenotypic correlation were consistent with those of genetic correlation, and there was a significant correlation between these traits, which indicated AFE could be used as a key indicator for predicting the EN. MCD can reflect the continuous production performance of the chicken population [26]; the genetic correlation coefficient between EN and MCD was almost 1 in this study, suggesting the higher the number of eggs produced by the population, the better the continuous production performance. Therefore, the AFE and MCD could be considered important indicators in the subsequent breeding of Shuanglian chickens, while balancing the WFE for joint breeding to further improve its production performance.
GWAS results indicated all the significant SNPs associated with EN40 and EN43 were located on chromosome 10, and these SNPs were all located in regulatory regions such as intron and intergenic regions, indicating regulatory mutation might be the determinants of phenotypic differences. In addition, the proportion of the phenotypic variance explained by the most significant SNP of EN40, EN43, and MCD was 8.5%, 7.2%, and 22.8%, respectively, implying our method for the identification of main candidate genes associated with these traits was powerful and effective. After LD analysis, all the genome-wide and suggestive significant SNPs associated with EN located in the 0.57 Mb region, which were in strong LD status and were clustered into five blocks. These blocks contained a total of 10 candidate genes: CELF6, BBS4, ADPGK, HEXA, ARIH1, PARP6, NEO1, HCN4, REC114, and NPTN. Through functional annotation, two candidate genes NEO1 and ADPGK were reported to be associated with reproductive performance. It was found the NEO1 gene was closely related to the fertility of humans and mice, and this gene was highly expressed in both ovaries and uterus [27,28]. The amino acid homology encoded by this gene in mice and chickens is as high as 94%, and the expression pattern of chicken NEO1 is similar to that of mouse [29]. ADPGK plays an important role instead of hexokinase in regulating energy metabolism [30]. It has also been confirmed to be related to the reproductive performance [31]. In addition, we also annotated the upstream and downstream 1 Mb regions of all genome-wide and suggestive significant SNPs and identified an important candidate gene CYP11A1 related to egg production performance. The CYP11A1 gene is the first hydrolytic enzyme that catalyzes the production of steroid hormones and is also the rate-limiting enzyme of this process. It plays an important role in the reproductive physiology of animals regulated by hormones [32]. According to previous studies, the LDB2 gene could regulate cell migration, and a 31-bp Indel within LDB2 gene was significantly associated with growth traits in the F2 resource chicken population and affected the expression of LDB2 in muscle tissue [33,34,35]. Furthermore, in studies with Lingxian white goose and goats, the LDB2 gene was also confirmed to be associated with growth and weight traits [36,37,38]. The above studies indicate the LDB2 gene is closely related to the weight traits of poultry and can be an important candidate gene for WFE of Shuanglian chickens in our study. For the EW trait, the GRM8 gene encodes a G protein-coupled receptor, involved in glutamatergic neurotransmission in the central nervous system, and it plays a role in intracellular signal transduction and cyclic adenylate signal cascade inhibition [39]. Previous studies found the GRM8 gene could participate in the generation of GABA, an inhibitory neurotransmitter in the brain and associated with egg weight [40,41]. In addition, the S1PR4 gene is a signaling lipid. It could regulate cell fate and participate in STAT3, MAPK, and Akt pathways [42], which were involved in regulating the cell cycle, proliferation and apoptosis of chicken follicular granulosa cells [43]. Perhaps, the S1PR4 and GRM8 genes may be potential candidate genes for MCD and EW traits, respectively.

5. Conclusions

In conclusion, the GWAS performed by whole genome sequencing in this study demonstrated 34 significant SNPs were identified to be associated with EN, MCD, WFE, and EW. Moreover, three genes NEO1, ADPGK, and CYP11A1 were identified as candidates associated with EN, while the S1PR4, LDB2, and GRM8 genes were linked to MCD, WFE, and EW, respectively. Our findings may help us to better understand the molecular mechanisms underlying egg production traits in chickens and contribute to genetic improvement of these traits.

Supplementary Materials

The following supporting information can be downloaded at: https://www.mdpi.com/article/10.3390/genes14122129/s1. Figure S1. The analysis of principal component. Figure S2. The GWAS result of AFE, WFE, and EW. Table S1. Enrichment analysis of candidate genes for egg production traits by GO. Table S2. Enrichment analysis of candidate genes for egg production traits by KEGG.

Author Contributions

J.P. conceived of and designed the experiments; Y.W., J.S. (Jie Shen), A.P., H.Z., J.S. (Jing Sun), Z.L., T.H. and J.D. participated in resource collection and investigation; M.F. performed the experiments and wrote the paper. All authors have read and agreed to the published version of the manuscript.

Funding

This study received support from the China Agriculture Research System of MOF and MARA (CARS-40, CARS-41), and Key Research and Development Plan Projects of Hubei Province (2023BBB008), and Hubei Academy of Agricultural Sciences Youth Science Foundation Project (2023NKYJJ18), and Hubei Provincial Science and Technology Innovation Team Project (EKT [2022] No. 72).

Institutional Review Board Statement

All the animal research activities in this study were approved by the Animal Care and Use Committee of the Institute of Animal Science and Veterinary Medicine, Hubei Academy of Agricultural Sciences (HBAAS20220216).

Informed Consent Statement

Not applicable.

Data Availability Statement

Data are contained within the article and supplementary materials.

Conflicts of Interest

The authors declare they have no conflict of interest.

References

  1. The Development Status and Trends of China’s Laying Hen Industry. Available online: https://zhuanlan.zhihu.com/p/628010784?utm_id=0 (accessed on 9 May 2023). (In Chinese).
  2. Liu, Z.; Yang, N.; Yan, Y.; Li, G.; Liu, A.; Wu, G.; Sun, C. Genome-wide association analysis of egg production performance in chickens across the whole laying period. BMC Genet. 2019, 20, 67. [Google Scholar] [CrossRef]
  3. Zhao, X.; Nie, C.; Zhang, J.; Li, X.; Zhu, T.; Guan, Z.; Chen, Y.; Wang, L.; Lv, X.Z.; Yang, W.; et al. Identification of candidate genomic regions for chicken egg number traits based on genome-wide association study. BMC Genom. 2021, 22, 610. [Google Scholar] [CrossRef] [PubMed]
  4. Xu, P.; Yuan, J.; Sun, C.; Dou, T.; Yi, G.; Qu, L.; Qu, L.; Wang, K.; Yang, N. Identification of Promising Mutants Associated with Egg Production Traits Revealed by Genome-Wide Association Study. PLoS ONE 2015, 10, e0140615. [Google Scholar]
  5. Fan, Q.C.; Wu, P.F.; Dai, G.J.; Zhang, G.X.; Zhang, T.; Xue, Q.; Shi, H.Q.; Wang, J.Y. Identification of 19 loci for reproductive traits in a local Chinese chicken by genome-wide study. Genet. Mol. Res. 2017, 16. [Google Scholar] [CrossRef] [PubMed]
  6. Liu, Z.; Sun, C.; Yan, Y.; Li, G.; Wu, G.; Liu, A.; Yang, N. Genome-Wide Association Analysis of Age-Dependent Egg Weights in Chickens. Front. Genet. 2018, 9, 128. [Google Scholar] [CrossRef] [PubMed]
  7. Pértille, F.; Moreira, G.C.M.; Zanella, R.; Nunes, J.d.R.d.S.; Boschiero, C.; Rovadoscki, G.A.; Mourão, G.B.; Ledur, M.C.; Coutinho, L.L. Genome-wide association study for performance traits in chickens using genotype by sequencing approach. Sci. Rep. 2017, 7, 41748. [Google Scholar] [CrossRef]
  8. Zhang, G.X.; Fan, Q.C.; Wang, J.Y.; Zhang, T.; Xue, Q.; Shi, H.Q. Genome-wide association study on reproductive traits in Jinghai Yellow Chicken. Anim. Reprod. Sci. 2015, 163, 30–34. [Google Scholar] [CrossRef] [PubMed]
  9. Du, Y.; Liu, L.; He, Y.; Dou, T.; Jia, J.; Ge, C. Endocrine and genetic factors affecting egg laying performance in chickens: A review. Br. Poultry Sci. 2020, 61, 538–549. [Google Scholar] [CrossRef]
  10. Hu, Y.D.; Huang, Q.K.; Zhu, Q.; Lan, D.; Feng, Z.Q.; Zhang, L.; Lan, X.; Ye, L.; Liu, Y.P.; He, M.; et al. Identification and association of single-nucleotide polymorphisms in gonadotropin-inhibitory hormone (GnIH) gene with egg production traits in Erlang mountainous chickens. Genet. Mol. Res. 2015, 14, 294–303. [Google Scholar] [CrossRef] [PubMed]
  11. Christoffels, A.; Liu, W.; Li, D.; Liu, J.; Chen, S.; Qu, L.; Zheng, J.; Xu, G.; Yang, N. A Genome-Wide SNP Scan Reveals Novel Loci for Egg Production and Quality Traits in White Leghorn and Brown-Egg Dwarf Layers. PLoS ONE 2011, 6, e28600. [Google Scholar]
  12. Goto, T.; Ishikawa, A.; Onitsuka, S.; Goto, N.; Fujikawa, Y.; Umino, T.; Nishibori, M.; Tsudzuki, M. Mapping quantitative trait loci for egg production traits in an F2 intercross of Oh-Shamo and White Leghorn chickens. Anim. Genet. 2011, 42, 634–641. [Google Scholar] [CrossRef]
  13. Wolc, A.; Arango, J.; Jankowski, T.; Dunn, I.; Settar, P.; Fulton, J.E.; O’Sullivan, N.P.; Preisinger, R.; Fernando, R.L.; Garrick, D.J.; et al. Genome-wide association study for egg production and quality in layer chickens. J. Anim. Breed. Genet. 2014, 131, 173–182. [Google Scholar] [CrossRef]
  14. Yuan, J.; Chen, S.; Shi, F.; Wu, G.; Liu, A.; Yang, N.; Sun, C. Genome-wide association study reveals putative role of gga-miR-15a in controlling feed conversion ratio in layer chickens. BMC Genom. 2017, 18, 699. [Google Scholar] [CrossRef]
  15. Nie, C.; Zhang, Z.; Zheng, J.; Sun, H.; Ning, Z.; Xu, G.; Yang, N.; Qu, L. Genome-wide association study revealed genomic regions related to white/red earlobe color trait in the Rhode Island Red chickens. BMC Genet. 2016, 17, 115. [Google Scholar] [CrossRef] [PubMed]
  16. Li, H.; Durbin, R. Fast and accurate short read alignment with Burrows-Wheeler transform. Bioinformatics 2009, 25, 1754–1760. [Google Scholar] [CrossRef] [PubMed]
  17. McKenna, A.; Hanna, M.; Banks, E.; Sivachenko, A.; Cibulskis, K.; Kernytsky, A.; Garimella, K.; Altshuler, D.; Gabriel, S.; Daly, M.; et al. The Genome Analysis Toolkit: A MapReduce framework for analyzing next-generation DNA sequencing data. Genome Res. 2010, 20, 1297–1303. [Google Scholar] [CrossRef] [PubMed]
  18. Purcell, S.; Neale, B.; Todd-Brown, K.; Thomas, L.; Ferreira, M.A.R.; Bender, D.; Maller, J.; Sklar, P.; de Bakker, P.I.W.; Daly, M.J.; et al. PLINK: A tool set for whole-genome association and population-based linkage analyses. Am. J. Hum. Genet. 2007, 81, 559–575. [Google Scholar] [CrossRef] [PubMed]
  19. Browning, S.R.; Browning, B.L. Rapid and Accurate Haplotype Phasing and Missing-Data Inference for Whole-Genome Association Studies By Use of Localized Haplotype Clustering. Am. J. Hum. Genet. 2007, 81, 1084–1097. [Google Scholar] [CrossRef] [PubMed]
  20. Yang, J.A.; Lee, S.H.; Goddard, M.E.; Visscher, P.M. GCTA: A Tool for Genome-wide Complex Trait Analysis. Am. J. Hum. Genet. 2011, 88, 76–82. [Google Scholar] [CrossRef]
  21. Zhou, X.; Stephens, M. Genome-wide efficient mixed-model analysis for association studies. Nat. Genet. 2012, 44, 821–824. [Google Scholar] [CrossRef]
  22. Dong, S.-S.; He, W.-M.; Ji, J.-J.; Zhang, C.; Guo, Y.; Yang, T.-L. LDBlockShow: A fast and convenient tool for visualizing linkage disequilibrium and haplotype blocks based on variant call format files. Brief. Bioinform. 2021, 22, bbaa227. [Google Scholar] [CrossRef] [PubMed]
  23. Raeesi, V.; Ehsani, A.; Torshizi, R.V.; Sargolzaei, M.; Masoudi, A.A.; Dideban, R. Genome-wide association study of cell-mediated immune response in chicken. J. Anim. Breed. Genet. 2017, 134, 405–411. [Google Scholar] [CrossRef] [PubMed]
  24. Luo, P.T.; Yang, R.Q.; Yang, N. Estimation of genetic parameters for cumulative egg numbers in a broiler dam line by using a random regression model. Poultry Sci. 2007, 86, 30–36. [Google Scholar] [CrossRef]
  25. Zhang, L.C.; Ning, Z.H.; Xu, G.Y.; Hou, Z.C.; Yang, N. Heritabilities and genetic and phenotypic correlations of egg quality traits in brown-egg dwarf layers. Poultry Sci. 2005, 84, 1209–1213. [Google Scholar] [CrossRef] [PubMed]
  26. Wang, H.; Cahaner, A.; Lou, L.; Zhang, L.; Ge, Y.; Li, Q.; Zhang, X. Genetics and breeding of a black-bone and blue eggshell chicken line. 2. Laying patterns and egg production in two consecutive generations. Poultry Sci. 2022, 101, 101679. [Google Scholar] [CrossRef]
  27. Rodriguez, A.; Pan, P.; Parkkila, S. Expression Studies of Neogenin and Its Ligand Hemojuvelin in Mouse Tissues. J. Histochem. Cytochem. 2006, 55, 85–96. [Google Scholar] [CrossRef]
  28. Rooda, I.; Hensen, K.; Kaselt, B.; Kasvandik, S.; Pook, M.; Kurg, A.; Salumets, A.; Velthut-Meikas, A. Target prediction and validation of microRNAs expressed from FSHR and aromatase genes in human ovarian granulosa cells. Sci. Rep. 2020, 10, 2300. [Google Scholar] [CrossRef]
  29. Sugihara, I.; Phan, K.D.; Croteau, L.-P.; Kam, J.W.K.; Kania, A.; Cloutier, J.-F.; Butler, S.J. Neogenin May Functionally Substitute for Dcc in Chicken. PLoS ONE 2011, 6, e22072. [Google Scholar]
  30. Imle, R.; Wang, B.-T.; Stützenberger, N.; Birkenhagen, J.; Tandon, A.; Carl, M.; Himmelreich, N.; Thiel, C.; Gröne, H.-J.; Poschet, G.; et al. ADP-dependent glucokinase regulates energy metabolism via ER-localized glucose sensing. Sci. Rep. 2019, 9, 14248. [Google Scholar] [CrossRef]
  31. Yao, R.; Lu, T.; Liu, J.; Li, W.; Weng, X.; Yue, X.; Li, F. Variants of ADPGK gene and its effect on the male reproductive organ parameters and sperm count in Hu sheep. Anim. Biotechnol. 2021, 34, 664–671. [Google Scholar] [CrossRef]
  32. Heidarzadehpilehrood, R.; Pirhoushiaran, M.; Abdollahzadeh, R.; Binti Osman, M.; Sakinah, M.; Nordin, N.; Abdul Hamid, H. A Review on CYP11A1, CYP17A1, and CYP19A1 Polymorphism Studies: Candidate Susceptibility Genes for Polycystic Ovary Syndrome (PCOS) and Infertility. Genes 2022, 13, 302. [Google Scholar] [CrossRef] [PubMed]
  33. Dou, D.; Shen, L.; Zhou, J.; Cao, Z.; Luan, P.; Li, Y.; Xiao, F.; Guo, H.; Li, H.; Zhang, H. Genome-wide association studies for growth traits in broilers. BMC Genom. Data 2022, 23. [Google Scholar] [CrossRef] [PubMed]
  34. Wei, C.; Hou, D.; Feng, Y.; Li, T.; Jing, Z.; Li, W.; Han, R.; Li, G.; Sun, G.; Tian, Y.; et al. Molecular characterization and a duplicated 31-bp indel within the LDB2 gene and its associations with production performance in chickens. Gene 2020, 761, 145046. [Google Scholar] [CrossRef] [PubMed]
  35. Zhang, Y.; Wang, Y.; Li, Y.; Wu, J.; Wang, X.; Bian, C.; Tian, Y.; Sun, G.; Han, R.; Liu, X.; et al. Genome-wide association study reveals the genetic determinism of growth traits in a Gushi-Anka F2 chicken population. Heredity 2020, 126, 293–307. [Google Scholar] [CrossRef]
  36. Guo, J.; Tao, H.; Li, P.; Li, L.; Zhong, T.; Wang, L.; Ma, J.; Chen, X.; Song, T.; Zhang, H. Whole-genome sequencing reveals selection signatures associated with important traits in six goat breeds. Sci. Rep. 2018, 8, 10405. [Google Scholar] [CrossRef] [PubMed]
  37. Zhang, L.; Wang, F.; Gao, G.; Yan, X.; Liu, H.; Liu, Z.; Wang, Z.; He, L.; Lv, Q.; Wang, Z.; et al. Genome-Wide Association Study of Body Weight Traits in Inner Mongolia Cashmere Goats. Front. Vet. Sci. 2021, 8, 752746. [Google Scholar] [CrossRef]
  38. Zheng, S.; Ouyang, J.; Liu, S.; Tang, H.; Xiong, Y.; Yan, X.; Chen, H. Genomic signatures reveal selection in Lingxian white goose. Poultry Sci. 2023, 102, 102269. [Google Scholar] [CrossRef]
  39. Scherer, S.W.; Soder, S.; Duvoisin, R.M.; Huizenga, J.J.; Tsui, L.C. The human metabotropic glutamate receptor 8 (GRM8) gene: A disproportionately large gene located at 7q31.3-q32.1. Genomics 1997, 44, 232–236. [Google Scholar] [CrossRef]
  40. Kessi, M.; Duan, H.; Xiong, J.; Chen, B.; He, F.; Yang, L.; Ma, Y.; Bamgbade, O.A.; Peng, J.; Yin, F. Attention-deficit/hyperactive disorder updates. Front. Mol. Neurosci. 2022, 15, 925049. [Google Scholar] [CrossRef]
  41. Ncho, C.-M.; Goel, A.; Jeong, C.-M.; Youssouf, M.; Choi, Y.-H. In Ovo Injection of GABA Can Help Body Weight Gain at Hatch, Increase Chick Weight to Egg Weight Ratio, and Improve Broiler Heat Resistance. Animals 2021, 11, 1364. [Google Scholar] [CrossRef]
  42. Jozefczuk, E.; Guzik, T.J.; Siedlinski, M. Significance of sphingosine-1-phosphate in cardiovascular physiology and pathology. Pharmacol. Res. 2020, 156, 104793. [Google Scholar] [CrossRef] [PubMed]
  43. Zhu, M.; Miao, S.; Zhou, W.; Elnesr, S.S.; Dong, X.; Zou, X. MAPK, AKT/FoxO3a and mTOR pathways are involved in cadmium regulating the cell cycle, proliferation and apoptosis of chicken follicular granulosa cells. Ecotoxicol. Environ. Safe 2021, 214, 112091. [Google Scholar] [CrossRef] [PubMed]
Figure 1. The density plot of SNPs.
Genes 14 02129 g001
Figure 2. Manhattan plots and quantile-quantile (Q-Q) plots of egg number at 40 weeks (EN40), egg number at 43 weeks (EN43), and maximum consecutive egg laying days (MCD). The solid and dashed line indicates the genome-wide and suggestive significance threshold, respectively. Red points indicate the genome-wide significant SNPs, green points indicate the suggestive significant SNPs.
Genes 14 02129 g002
Figure 3. Linkage disequilibrium analysis of genomic regions associated with EN.
Genes 14 02129 g003
Figure 4. GO annotation analysis for candidate genes.
Genes 14 02129 g004
Figure 5. KEGG pathway analysis for candidate genes.
Genes 14 02129 g005
Table 1. The phenotype data of AFE, WFE, EW, EN40, EN43, and MCD.
TraitsNMean ± SDMinimumMaximumCV
AFE (d)163131.7 ± 14.810616911.2
WFE (g)1631491.8 ± 195.11060202013.1
EW (g)16348.4 ± 4.038.064.68.2
EN40163111.3 ± 25.52918222.9
EN43163125.6 ± 28.02916522.3
MCD (d)16314.6 ± 7.934954.3
SD, standard deviation; CV, coefficient of variation (%).
Table 2. Estimation of phenotypic and genetic parameters with AFE, WFE, EW, EN40, EN43, and MCD.
TraitsAFEWFEEWEN43EN40MCD
AFE0.193−0.0060.283 ***−0.474 ***−0.512 ***−0.234 **
WFE−0.010.3790.208 **−0.311 ***−0.304 ***−0.269 ***
EW0.6780.3380.897−0.257 ***−0.261 ***−0.164 *
EN43−0.764−0.695−0.2830.2460.991 ***0.702 ***
EN40−0.789−0.704−0.27710.2420.694 ***
MCD−0.442−0.429−0.15110.632
Table 3. Information of the genome-wide significant SNPs associated with EN40, EN43, and MCD.
TraitChrSNPPos (bp) 1MAF 2Consequencep-ValueCandidate Gene
EN4010rs7945998521,959,1330.135intron variant1.79 × 10−10NEO1
10rs7944102981,959,1030.138intron variant1.84 × 10−10NEO1
10rs7371018721,779,4030.153intron variant2.16 × 10−10ENSGALG00010025119
10rs7337577871,775,4980.150intron variant9.77 × 10−10ENSGALG00010025119
10rs7332197751,781,6890.147intron variant1.54 × 10−9ENSGALG00010025119
10rs7326110811,780,9400.150intron variant2.19 × 10−9ENSGALG00010025119
10rs7371413961,776,8490.141intron variant2.63 × 10−9ENSGALG00010025119
10rs7323887481,776,8540.141intron variant2.63 × 10−9ENSGALG00010025119
10rs7387965031,773,0850.156intron variant2.91 × 10−9ENSGALG00010025119
10rs7327831391,779,7570.137intron variant3.31 × 10−9ENSGALG00010025119
EN4310rs7371018721,779,4030.153intron variant2.72 × 10−10ENSGALG00010025119
10rs7944102981,959,1030.138intron variant4.30 × 10−10NEO1
10rs7945998521,959,1330.135intron variant4.52 × 10−10NEO1
10rs7337577871,775,4980.15intron variant1.21 × 10−9ENSGALG00010025119
10rs7332197751,781,6890.147intron variant1.45 × 10−9ENSGALG00010025119
10rs7371413961,776,8490.141intron variant1.93 × 10−9ENSGALG00010025119
10rs7323887481,776,8540.141intron variant1.93 × 10−9ENSGALG00010025119
10rs7326110811,780,9400.15intron variant2.03 × 10−9ENSGALG00010025119
10rs7387965031,773,0850.156intron variant2.86 × 10−9ENSGALG00010025119
10rs7327831391,779,7570.137intron variant3.78 × 10−9ENSGALG00010025119
MCD2828:16966041,696,6040.064upstream_gene_variant8.70 × 10−10S1PR4
1 Pos (bp) indicates SNP position derived from the GRCg7b reference (Ensembl release 110). 2 MAF indicates the minor allele frequency of first listed marker.
Table 4. Information of the suggestive significant SNPs associated with EN, WFE, and EW.
TraitChrSNPPos (bp) 1MAF 2Consequencep-ValueCandidate Gene
EN403rs73367098680,457,9640.064intron variant6.45 × 10−8FILIP1
4rs1449871482,228,0070.095intron variant3.81 × 10−8ZFYVE28
1010:18999111,899,9110.12intron variant6.60 × 10−9NEO1
10rs7320152861,776,0940.147intron variant7.15 × 10−9ENSGALG00010025119
10rs7373150971,775,1740.16intron variant8.72 × 10−9ENSGALG00010025119
10rs140004161,774,1420.16splice donor variant8.77 × 10−9ENSGALG00010025119
10rs7940117071,959,1820.135intron variant1.04 × 10−8NEO1
10rs7351357181,777,5990.154intron variant1.19 × 10−8ENSGALG00010025119
10rs7407457671,781,0670.141intron variant1.39 × 10−8ENSGALG00010025119
10rs7941883321,959,2130.142intron variant1.42 × 10−8NEO1
10rs7375094511,950,9380.163intron variant1.69 × 10−8NEO1
10rs7377996271,950,6480.175intron variant1.73 × 10−8NEO1
10rs7407282602,216,9570.104intron variant1.89 × 10−8NPTN
1010:18987641,898,7640.104intron variant2.06 × 10−8NEO1
10rs7322818421,770,9380.123noncoding transcript exon variant2.22 × 10−8ENSGALG00010025119
10rs7357341051,780,2690.141intron variant2.89 × 10−8ENSGALG00010025119
1010:21892902,189,2900.104intergenic variant5.62 × 10−8HCN4 REC114
1010:16509891,650,9890.126intergenic variant5.97 × 10−8CELF6 HEXA
10rs7327247382,050,6160.12upstream gene variant8.93 × 10−8HCN4
EN431rs733976198182,156,1650.068intron variant3.71 × 10−8DYNC2H1
10rs7373150971,775,1740.16intron variant8.86 × 10−9ENSGALG00010025119
10rs140004161,774,1420.16splice donor variant9.13 × 10−9ENSGALG00010025119
10rs7320152861,776,0940.147intron variant1.11 × 10−8ENSGALG00010025119
10rs7940117071,959,1820.135intron variant1.52 × 10−8NEO1
10rs7351357181,777,5990.154intron variant1.54 × 10−8ENSGALG00010025119
1010:18999111,899,9110.12intron variant1.63 × 10−8NEO1
10rs7407457671,781,0670.141intron variant2.02 × 10−8ENSGALG00010025119
10rs7357341051,780,2690.141intron variant2.15 × 10−8ENSGALG00010025119
10rs7941883321,959,2130.142intron variant2.22 × 10−8NEO1
10rs7375094511,950,9380.163intron variant2.34 × 10−8NEO1
1010:18987641,898,7640.104intron variant2.76 × 10−8NEO1
10rs7377996271,950,6480.175intron variant3.54 × 10−8NEO1
10rs7322818421,770,9380.123noncoding transcript exon variant4.61 × 10−8ENSGALG00010025119
1010:16509891,650,9890.126intergenic variant6.88 × 10−8CELF6 HEXA
10rs7407282602,216,9570.104intron variant9.07 × 10−8NPTN
19rs158455435,400,2910.27intron variant7.23 × 10−8VKORC1L1
WFE4rs31765992075,866,8610.389intron variant1.62 × 10−8LDB2
EW1rs73602261521,149,2550.104intron variant5.55 × 10−8GRM8
1 Pos (bp) indicates SNP position derived from the GRCg7b reference (Ensembl release 110). 2 MAF indicates the minor allele frequency of first listed marker.
Disclaimer/Publisher’s Note: The statements, opinions and data contained in all publications are solely those of the individual author(s) and contributor(s) and not of MDPI and/or the editor(s). MDPI and/or the editor(s) disclaim responsibility for any injury to people or property resulting from any ideas, methods, instructions or products referred to in the content.

