
The Application of Genetic Risk Scores in Rheumatic Diseases: A Perspective
 and
and
Abstract
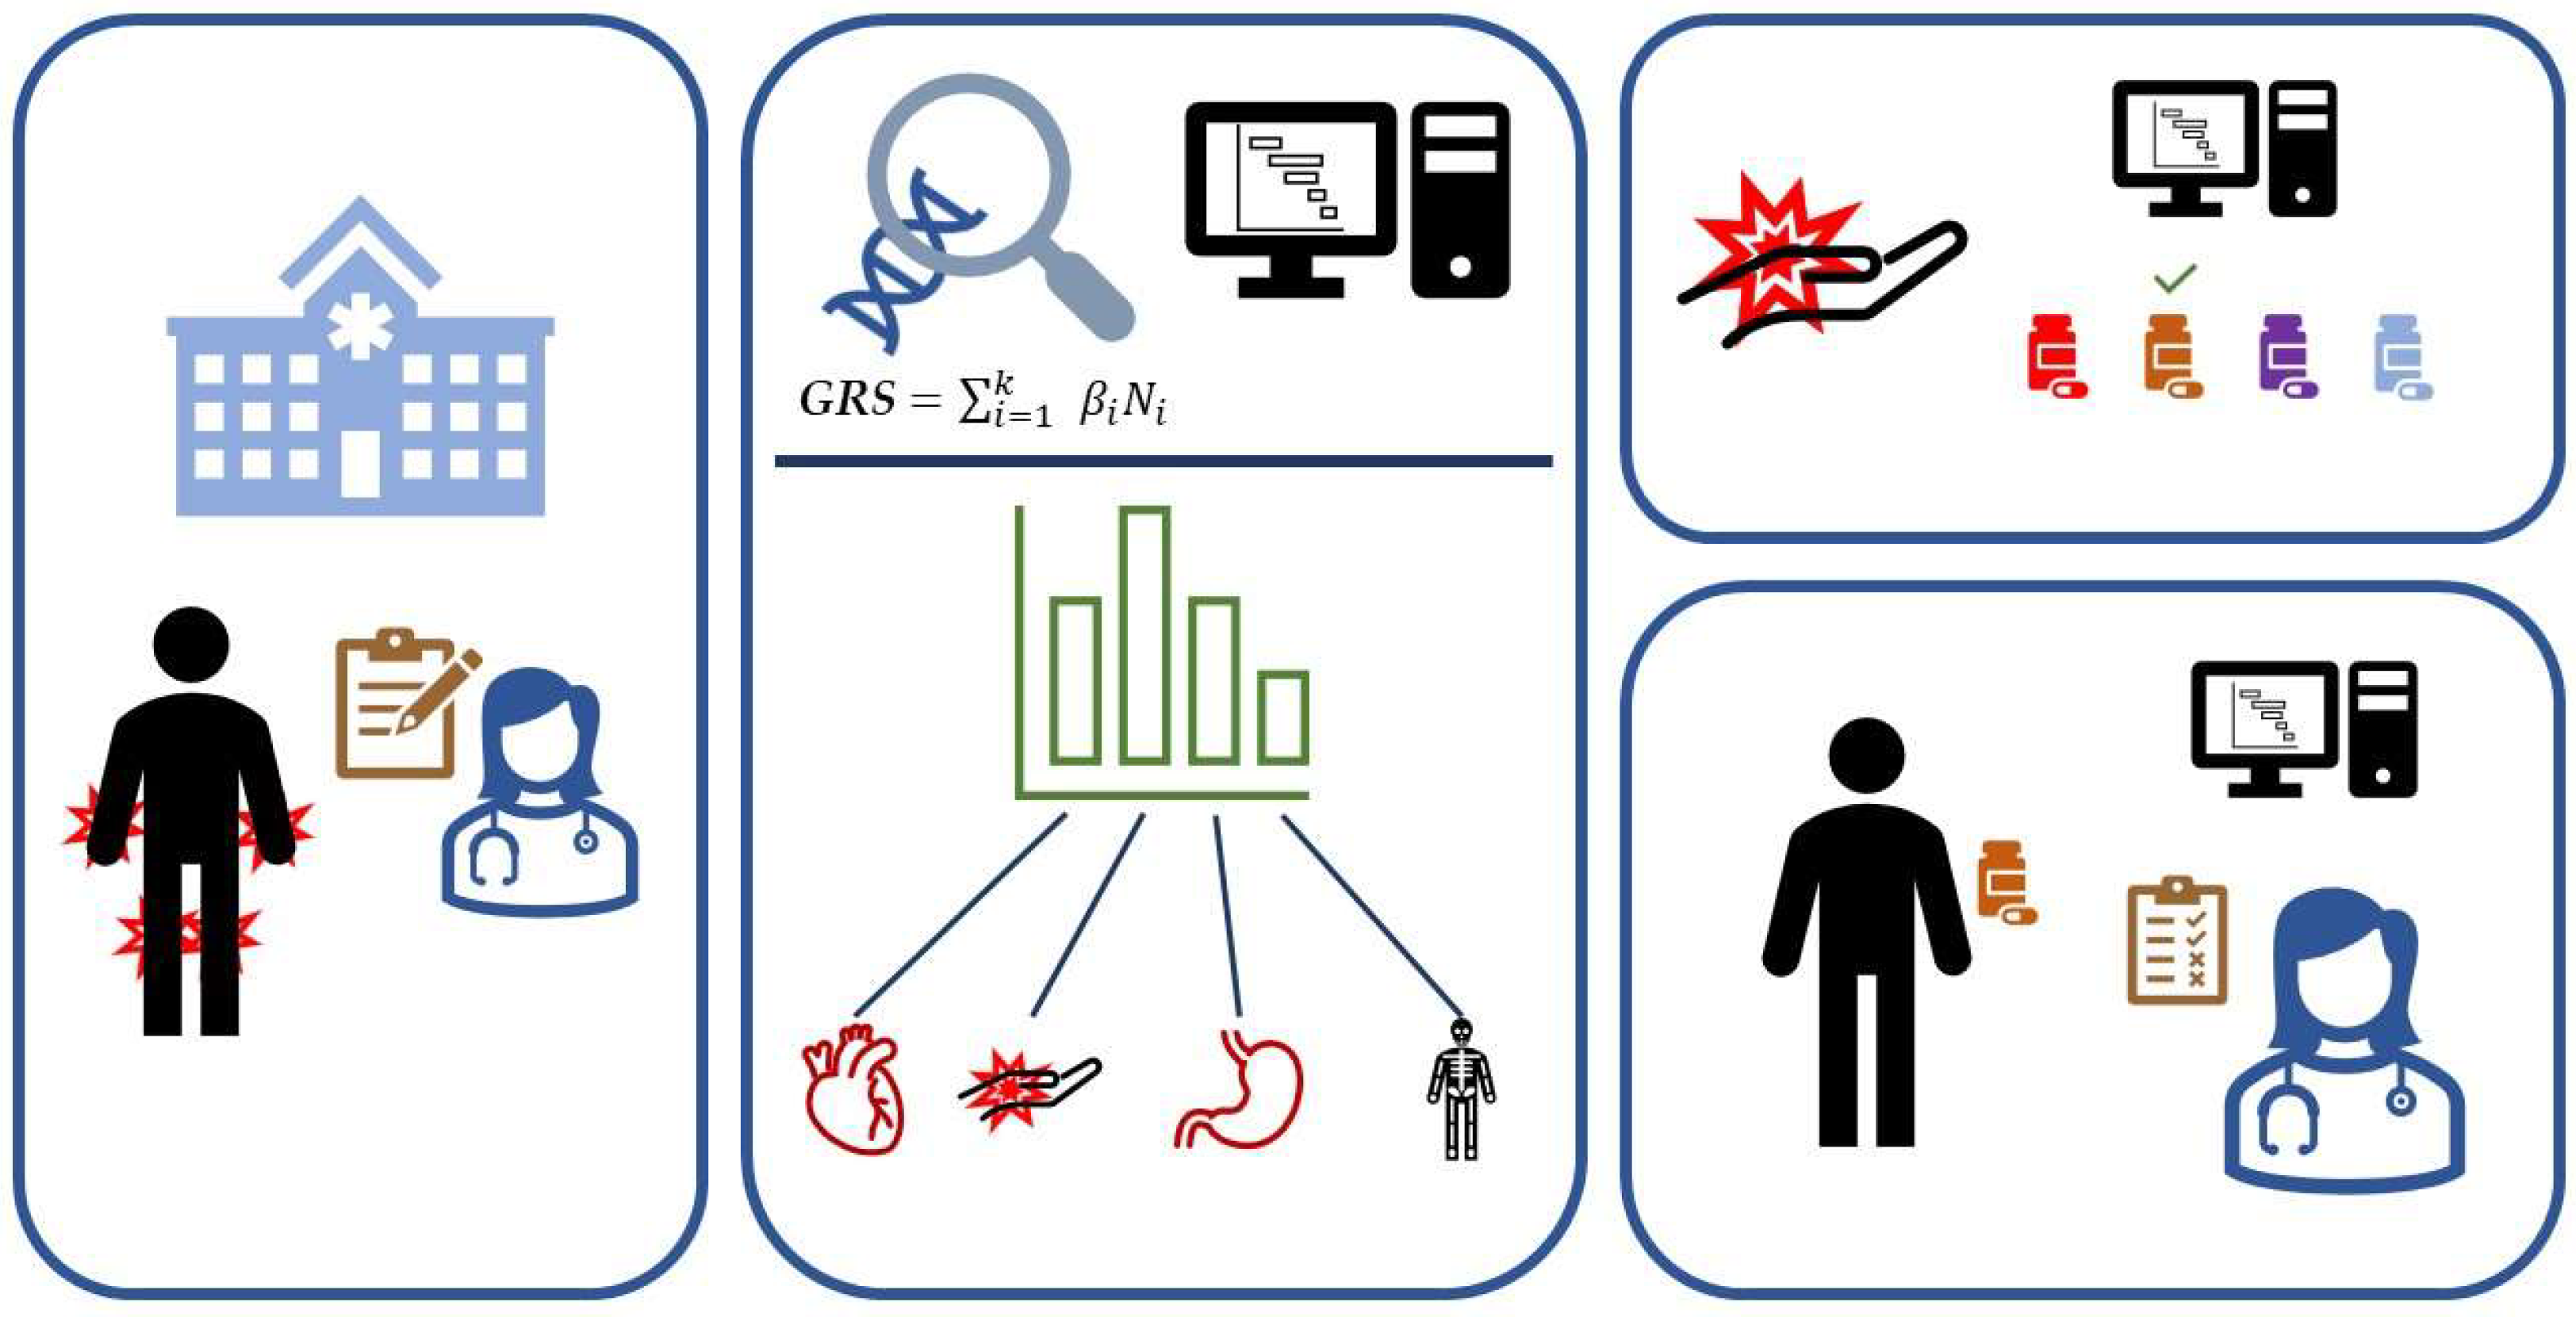
:1. Introduction
2. How to Calculate a GRS
3. What Is the GRS Used for, and Where Are We at for Rheumatic Diseases?
- I.
- Prediction of a single disease of interest and/or disease outcomes;
- II.
- Identification of genetic commonalities between two or more diseases;
- III.
- Differentiation between two or more diseases;
- IV.
- Exploring the interplay between GRSs and environmental factors;
- V.
- Studying the heritability and transferability of GRSs in populations and disease stages;
- VI.
- Detecting causal relationships using Mendelian randomization.
3.1. Prediction of Disease—Including Case Control Distinction, Treatment Effect, and Comorbidities
3.2. Identifying Genetic Commonalities between Diseases
3.3. Differentiation between Two or More Diseases
3.4. Interplay between GRS and Environmental Factors
3.5. Studying the Heritability and Transferability of Grss in Populations and Disease Stages
3.6. Detecting Causal Relationships Using Mendelian Randomisation
4. Discussion
4.1. Limitations and How to Overcome Them
4.2. Enabling Future Projects
4.3. Opportunities for Future Research
4.4. Integrating GRSs into Healthcare Pathways
4.5. Concluding Remarks
Author Contributions
Funding
Data Availability Statement
Conflicts of Interest
References
- Kirino, Y.; Remmers, E.F. Genetic Architectures of Seropositive and Seronegative Rheumatic Diseases. Nat. Rev. Rheumatol. 2015, 11, 401–414. [Google Scholar] [CrossRef] [PubMed]
- Patel, K.A.; Oram, R.A.; Flanagan, S.E.; De Franco, E.; Colclough, K.; Shepherd, M.; Ellard, S.; Weedon, M.N.; Hattersley, A.T. Type 1 Diabetes Genetic Risk Score: A Novel Tool to Discriminate Monogenic and Type 1 Diabetes. Diabetes 2016, 65, 2094–2099. [Google Scholar] [CrossRef] [PubMed]
- Zhang, J.; Fang, X.-Y.; Wu, J.; Fan, Y.-G.; Leng, R.-X.; Liu, B.; Lv, X.-J.; Yan, Y.-L.; Mao, C.; Ye, D.-Q. Association of Combined Exposure to Ambient Air Pollutants, Genetic Risk, and Incident Rheumatoid Arthritis: A Prospective Cohort Study in the UK Biobank. Environ. Health Perspect. 2023, 131, 037008. [Google Scholar] [CrossRef] [PubMed]
- Knevel, R.; Le Cessie, S.; Terao, C.C.; Slowikowski, K.; Cui, J.; Huizinga, T.W.J.; Costenbader, K.H.; Liao, K.P.; Karlson, E.W.; Raychaudhuri, S. Using Genetics to Prioritize Diagnoses for Rheumatology Outpatients with Inflammatory Arthritis. Sci. Transl. Med. 2020, 12, eaay1548. [Google Scholar] [CrossRef] [PubMed]
- Kachuri, L.; Chatterjee, N.; Hirbo, J.; Schaid, D.J.; Martin, I.; Kullo, I.J.; Kenny, E.E.; Pasaniuc, B.; Polygenic Risk Methods in Diverse Populations (PRIMED) Consortium Methods Working Group; Auer, P.L.; et al. Principles and Methods for Transferring Polygenic Risk Scores across Global Populations. Nat. Rev. Genet. 2023. [Google Scholar] [CrossRef] [PubMed]
- Sullivan, G.M.; Feinn, R. Using Effect Size—Or Why the P Value Is Not Enough. J. Grad. Med. Educ. 2012, 4, 279–282. [Google Scholar] [CrossRef]
- Privé, F.; Aschard, H.; Carmi, S.; Folkersen, L.; Hoggart, C.; O’Reilly, P.F.; Vilhjálmsson, B.J. Portability of 245 Polygenic Scores When Derived from the UK Biobank and Applied to 9 Ancestry Groups from the Same Cohort. Am. J. Hum. Genet. 2022, 109, 12–23. [Google Scholar] [CrossRef]
- Choi, S.W.; Heng Mak, T.S.; O’Reilly, P.F. A Guide to Performing Polygenic Risk Score Analyses. Nat. Protoc. 2018, 15, 2759–2772. [Google Scholar] [CrossRef]
- Chen, L.; Wang, Y.-F.; Liu, L.; Bielowka, A.; Ahmed, R.; Zhang, H.; Tombleson, P.; Roberts, A.L.; Odhams, C.A.; Cunninghame Graham, D.S.; et al. Genome-Wide Assessment of Genetic Risk for Systemic Lupus Erythematosus and Disease Severity. Hum. Mol. Genet. 2020, 29, 1745–1756. [Google Scholar] [CrossRef]
- Li, Z.; Wu, X.; Leo, P.J.; De Guzman, E.; Akkoc, N.; Breban, M.; Macfarlane, G.J.; Mahmoudi, M.; Marzo-Ortega, H.; Anderson, L.K.; et al. Polygenic Risk Scores Have High Diagnostic Capacity in Ankylosing Spondylitis. Ann. Rheum. Dis. 2021, 80, 1168–1174. [Google Scholar] [CrossRef]
- Cánovas, R.; Cobb, J.; Brozynska, M.; Bowes, J.; Li, Y.R.; Smith, S.L.; Hakonarson, H.; Thomson, W.; Ellis, J.A.; Abraham, G.; et al. Genomic Risk Scores for Juvenile Idiopathic Arthritis and Its Subtypes. Ann. Rheum. Dis. 2020, 79, 1572–1579. [Google Scholar] [CrossRef] [PubMed]
- Wells, P.M.; Adebayo, A.S.; Bowyer, R.C.E.; Freidin, M.B.; Finckh, A.; Strowig, T.; Lesker, T.R.; Alpizar-Rodriguez, D.; Gilbert, B.; Kirkham, B.; et al. Associations between Gut Microbiota and Genetic Risk for Rheumatoid Arthritis in the Absence of Disease: A Cross-Sectional Study. Lancet Rheumatol. 2020, 2, e418–e427. [Google Scholar] [CrossRef]
- Koch, S.; Schmidtke, J.; Krawczak, M.; Caliebe, A. Clinical Utility of Polygenic Risk Scores: A Critical 2023 Appraisal. J. Community Genet. 2023, 14, 471–487. [Google Scholar] [CrossRef] [PubMed]
- Slatkin, M. Linkage Disequilibrium—Understanding the Evolutionary Past and Mapping the Medical Future. Nat. Rev. Genet. 2008, 9, 477–485. [Google Scholar] [CrossRef] [PubMed]
- Ishigaki, K.; Sakaue, S.; Terao, C.; Luo, Y.; Sonehara, K.; Yamaguchi, K.; Amariuta, T.; Too, C.L.; Laufer, V.A.; Scott, I.C.; et al. Multi-Ancestry Genome-Wide Association Analyses Identify Novel Genetic Mechanisms in Rheumatoid Arthritis. Nat. Genet. 2022, 54, 1640–1651. [Google Scholar] [CrossRef] [PubMed]
- Lipsky, A.M.; Gausche-Hill, M.; Vienna, M.; Lewis, R.J. The Importance of “Shrinkage” in Subgroup Analyses. Ann. Emerg. Med. 2010, 55, 544–552.e3. [Google Scholar] [CrossRef] [PubMed]
- Ge, T.; Chen, C.-Y.; Ni, Y.; Feng, Y.-C.A.; Smoller, J.W. Polygenic Prediction via Bayesian Regression and Continuous Shrinkage Priors. Nat. Commun. 2019, 10, 1776. [Google Scholar] [CrossRef] [PubMed]
- Ma, W.; Lau, Y.-L.; Yang, W.; Wang, Y.-F. Random Forests Algorithm Boosts Genetic Risk Prediction of Systemic Lupus Erythematosus. Front. Genet. 2022, 13, 902793. [Google Scholar] [CrossRef]
- Ko, C.-L.; Lin, W.-Z.; Lee, M.-T.; Chang, Y.-T.; Lin, H.-C.; Wu, Y.-S.; Lin, J.-F.; Pan, K.-T.; Chang, Y.-C.; Lee, K.-H.; et al. Genome-Wide Association Study Reveals Ethnicity-Specific SNPs Associated with Ankylosing Spondylitis in the Taiwanese Population. J. Transl. Med. 2022, 20, 589. [Google Scholar] [CrossRef]
- Chang, Y.-S.; Lin, C.-Y.; Liu, T.-Y.; Huang, C.-M.; Chung, C.-C.; Chen, Y.-C.; Tsai, F.-J.; Chang, J.-G.; Chang, S.-J. Polygenic Risk Score Trend and New Variants on Chromosome 1 Are Associated with Male Gout in Genome-Wide Association Study. Arthritis Res. Ther. 2022, 24, 229. [Google Scholar] [CrossRef]
- Lin, C.-Y.; Chang, Y.-S.; Liu, T.-Y.; Huang, C.-M.; Chung, C.-C.; Chen, Y.-C.; Tsai, F.-J.; Chang, J.-G.; Chang, S.-J. Genetic Contributions to Female Gout and Hyperuricaemia Using Genome-Wide Association Study and Polygenic Risk Score Analyses. Rheumatology 2023, 62, 638–646. [Google Scholar] [CrossRef] [PubMed]
- Sumpter, N.A.; Takei, R.; Cadzow, M.; Topless, R.K.G.; Phipps-Green, A.J.; Murphy, R.; De Zoysa, J.; Watson, H.; Qasim, M.; Lupi, A.S.; et al. Association of Gout Polygenic Risk Score with Age at Disease Onset and Tophaceous Disease in European and Polynesian Men with Gout. Arthritis Rheumatol. 2023, 75, 816–825. [Google Scholar] [CrossRef] [PubMed]
- Sandoval-Plata, G.; Morgan, K.; Abhishek, A. Variants in Urate Transporters, ADH1B, GCKR and MEPE Genes Associate with Transition from Asymptomatic Hyperuricaemia to Gout: Results of the First Gout versus Asymptomatic Hyperuricaemia GWAS in Caucasians Using Data from the UK Biobank. Ann. Rheum. Dis. 2021, 80, 1220–1226. [Google Scholar] [CrossRef] [PubMed]
- Lai, B.; Yu, H.-P.; Chang, Y.-J.; Wang, L.-C.; Chen, C.-K.; Zhang, W.; Doherty, M.; Chang, S.-H.; Hsu, J.-T.; Yu, K.-H.; et al. Assessing the Causal Relationships between Gout and Hypertension: A Bidirectional Mendelian Randomisation Study with Coarsened Exposures. Arthritis Res. Ther. 2022, 24, 243. [Google Scholar] [CrossRef] [PubMed]
- McCormick, N.; O’Connor, M.J.; Yokose, C.; Merriman, T.R.; Mount, D.B.; Leong, A.; Choi, H.K. Assessing the Causal Relationships Between Insulin Resistance and Hyperuricemia and Gout Using Bidirectional Mendelian Randomization. Arthritis Rheumatol. 2021, 73, 2096–2104. [Google Scholar] [CrossRef]
- Clarke, S.L.N.; Jones, H.J.; Sharp, G.C.; Easey, K.E.; Hughes, A.D.; Ramanan, A.V.; Relton, C.L. Juvenile Idiopathic Arthritis Polygenic Risk Scores Are Associated with Cardiovascular Phenotypes in Early Adulthood: A Phenome-Wide Association Study. Pediatr. Rheumatol. 2022, 20, 105. [Google Scholar] [CrossRef] [PubMed]
- Lacaze, P.; Wang, Y.; Polekhina, G.; Bakshi, A.; Riaz, M.; Owen, A.; Franks, A.; Abidi, J.; Tiller, J.; McNeil, J.; et al. Genomic Risk Score for Advanced Osteoarthritis in Older Adults. Arthritis Rheumatol. 2022, 74, 1480–1487. [Google Scholar] [CrossRef] [PubMed]
- Morita, Y.; Kamatani, Y.; Ito, H.; Ikegawa, S.; Kawaguchi, T.; Kawaguchi, S.; Takahashi, M.; Terao, C.; Ito, S.; Nishitani, K.; et al. Improved Genetic Prediction of the Risk of Knee Osteoarthritis Using the Risk Factor-Based Polygenic Score. Arthritis Res. Ther. 2023, 25, 103. [Google Scholar] [CrossRef]
- Sedaghati-Khayat, B.; Boer, C.G.; Runhaar, J.; Bierma-Zeinstra, S.M.A.; Broer, L.; Ikram, M.A.; Zeggini, E.; Uitterlinden, A.G.; Van Rooij, J.G.J.; Van Meurs, J.B.J. Risk Assessment for Hip and Knee Osteoarthritis Using Polygenic Risk Scores. Arthritis Rheumatol. 2022, 74, 1488–1496. [Google Scholar] [CrossRef]
- Zhu, J.; Chen, W.; Hu, Y.; Qu, Y.; Yang, H.; Zeng, Y.; Hou, C.; Ge, F.; Zhou, Z.; Song, H. Physical Activity Patterns, Genetic Susceptibility, and Risk of Hip/Knee Osteoarthritis: A Prospective Cohort Study Based on the UK Biobank. Osteoarthr. Cartil. 2022, 30, 1079–1090. [Google Scholar] [CrossRef]
- Hindy, G.; Åkesson, K.E.; Melander, O.; Aragam, K.G.; Haas, M.E.; Nilsson, P.M.; Kadam, U.T.; Orho-Melander, M. Cardiometabolic Polygenic Risk Scores and Osteoarthritis Outcomes: A Mendelian Randomization Study Using Data From the Malmö Diet and Cancer Study and the UK Biobank. Arthritis Rheumatol. 2019, 71, 925–934. [Google Scholar] [CrossRef] [PubMed]
- Smith, M.P.; Ly, K.; Thibodeaux, Q.; Beck, K.; Yang, E.; Sanchez, I.; Nititham, J.; Bhutani, T.; Liao, W. Evaluation of a Genetic Risk Score for Diagnosis of Psoriatic Arthritis. J. Psoriasis Psoriatic Arthritis 2020, 5, 61–67. [Google Scholar] [CrossRef] [PubMed]
- Honda, S.; Ikari, K.; Yano, K.; Terao, C.; Tanaka, E.; Harigai, M.; Kochi, Y. Association of Polygenic Risk Scores With Radiographic Progression in Patients With Rheumatoid Arthritis. Arthritis Rheumatol. 2022, 74, 791–800. [Google Scholar] [CrossRef] [PubMed]
- Maurits, M.P.; Wouters, F.; Niemantsverdriet, E.; Huizinga, T.W.J.; Van Den Akker, E.B.; Le Cessie, S.; Van Der Helm-van Mil, A.H.M.; Knevel, R. The Role of Genetics in Clinically Suspect Arthralgia and Rheumatoid Arthritis Development: A Large Cross-Sectional Study. Arthritis Rheumatol. 2023, 75, 178–186. [Google Scholar] [CrossRef] [PubMed]
- Jones, H.J.; Hubbard, L.; Mitchell, R.E.; Jones, S.A.; Williams, N.M.; Zammit, S.; Hall, J. Association of Genetic Risk for Rheumatoid Arthritis with Cognitive and Psychiatric Phenotypes Across Childhood and Adolescence. JAMA Netw. Open 2019, 2, e196118. [Google Scholar] [CrossRef] [PubMed]
- Kasher, M.; Freidin, M.B.; Williams, F.M.; Cherny, S.S.; Malkin, I.; Livshits, G. Shared Genetic Architecture Between Rheumatoid Arthritis and Varying Osteoporotic Phenotypes. J. Bone Miner. Res. 2022, 37, 440–453. [Google Scholar] [CrossRef]
- Zhang, H.G.; McDermott, G.; Seyok, T.; Huang, S.; Dahal, K.; L’Yi, S.; Lea-Bonzel, C.; Stratton, J.; Weisenfeld, D.; Monach, P.; et al. Identifying Shared Genetic Architecture between Rheumatoid Arthritis and Other Conditions: A Phenome-Wide Association Study with Genetic Risk Scores. eBioMedicine 2023, 92, 104581. [Google Scholar] [CrossRef]
- Kwon, Y.; Ha, E.; Kwon, H.; Park, D.J.; Shin, J.; Joo, Y.B.; Chung, W.T.; Yoo, D.; Lee, H.; Kim, K.; et al. Higher Genetic Risk Loads Confer More Diverse Manifestations and Higher Risk of Lupus Nephritis in Systemic Lupus Erythematosus. Arthritis Rheumatol. 2023, 75, 1566–1572. [Google Scholar] [CrossRef]
- Reid, S.; Alexsson, A.; Frodlund, M.; Morris, D.; Sandling, J.K.; Bolin, K.; Svenungsson, E.; Jönsen, A.; Bengtsson, C.; Gunnarsson, I.; et al. High Genetic Risk Score Is Associated with Early Disease Onset, Damage Accrual and Decreased Survival in Systemic Lupus Erythematosus. Ann. Rheum. Dis. 2020, 79, 363–369. [Google Scholar] [CrossRef]
- Tangtanatakul, P.; Thumarat, C.; Satproedprai, N.; Kunhapan, P.; Chaiyasung, T.; Klinchanhom, S.; Wang, Y.-F.; Wei, W.; Wongshinsri, J.; Chiewchengchol, D.; et al. Meta-Analysis of Genome-Wide Association Study Identifies FBN2 as a Novel Locus Associated with Systemic Lupus Erythematosus in Thai Population. Arthritis Res. Ther. 2020, 22, 185. [Google Scholar] [CrossRef]
- Wang, Y.-F.; Zhang, Y.; Lin, Z.; Zhang, H.; Wang, T.-Y.; Cao, Y.; Morris, D.L.; Sheng, Y.; Yin, X.; Zhong, S.-L.; et al. Identification of 38 Novel Loci for Systemic Lupus Erythematosus and Genetic Heterogeneity between Ancestral Groups. Nat. Commun. 2021, 12, 772. [Google Scholar] [CrossRef] [PubMed]
- Kawai, V.K.; Shi, M.; Liu, G.; Feng, Q.; Wei, W.; Chung, C.P.; Walunas, T.L.; Gordon, A.S.; Linneman, J.G.; Hebbring, S.J.; et al. Pleiotropy of Systemic Lupus Erythematosus Risk Alleles and Cardiometabolic Disorders: A Phenome-Wide Association Study and Inverse-Variance Weighted Meta-Analysis. Lupus 2021, 30, 1264–1272. [Google Scholar] [CrossRef] [PubMed]
- Mars, N.; Lindbohm, J.V.; Della Briotta Parolo, P.; Widén, E.; Kaprio, J.; Palotie, A.; Ripatti, S. Systematic Comparison of Family History and Polygenic Risk across 24 Common Diseases. Am. J. Hum. Genet. 2022, 109, 2152–2162. [Google Scholar] [CrossRef] [PubMed]
- Speed, D.; Balding, D.J. MultiBLUP: Improved SNP-Based Prediction for Complex Traits. Genome Res. 2014, 24, 1550–1557. [Google Scholar] [CrossRef]
- Ota, M.; Fujio, K. Multi-Omics Approach to Precision Medicine for Immune-Mediated Diseases. Inflamm. Regen. 2021, 41, 23. [Google Scholar] [CrossRef]
- Shan, N.; Xie, Y.; Song, S.; Jiang, W.; Wang, Z.; Hou, L. A Novel Transcriptional Risk Score for Risk Prediction of Complex Human Diseases. Genet. Epidemiol. 2021, 45, 811–820. [Google Scholar] [CrossRef]
- Márquez, A.; Vidal-Bralo, L.; Rodríguez-Rodríguez, L.; González-Gay, M.A.; Balsa, A.; González-Álvaro, I.; Carreira, P.; Ortego-Centeno, N.; Ayala-Gutiérrez, M.M.; García-Hernández, F.J.; et al. A Combined Large-Scale Meta-Analysis Identifies COG6 as a Novel Shared Risk Locus for Rheumatoid Arthritis and Systemic Lupus Erythematosus. Ann. Rheum. Dis. 2017, 76, 286–294. [Google Scholar] [CrossRef]
- Klareskog, L.; Rönnelid, J.; Saevarsdottir, S.; Padyukov, L.; Alfredsson, L. The Importance of Differences; On Environment and Its Interactions with Genes and Immunity in the Causation of Rheumatoid Arthritis. J. Intern. Med. 2020, 287, 514–533. [Google Scholar] [CrossRef]
- Davey Smith, G.; Ebrahim, S. ‘Mendelian Randomization’: Can Genetic Epidemiology Contribute to Understanding Environmental Determinants of Disease?*. Int. J. Epidemiol. 2003, 32, 1–22. [Google Scholar] [CrossRef]
- Mo, A.; Marigorta, U.M.; Arafat, D.; Chan, L.H.K.; Ponder, L.; Jang, S.R.; Prince, J.; Kugathasan, S.; Prahalad, S.; Gibson, G. Disease-Specific Regulation of Gene Expression in a Comparative Analysis of Juvenile Idiopathic Arthritis and Inflammatory Bowel Disease. Genome Med. 2018, 10, 48. [Google Scholar] [CrossRef]
- Lewis, C.M.; Vassos, E. Polygenic Risk Scores: From Research Tools to Clinical Instruments. Genome Med. 2020, 12, 44. [Google Scholar] [CrossRef]
- Cherlin, S.; Plant, D.; Taylor, J.C.; Colombo, M.; Spiliopoulou, A.; Tzanis, E.; Morgan, A.W.; Barnes, M.R.; McKeigue, P.; Barrett, J.H.; et al. Prediction of Treatment Response in Rheumatoid Arthritis Patients Using Genome-wide SNP Data. Genet. Epidemiol. 2018, 42, 754–771. [Google Scholar] [CrossRef]
- Thanos, P.K.; Hanna, C.; Mihalkovic, A.; Hoffman, A.B.; Posner, A.R.; Busch, J.; Smith, C.; Badgaiyan, R.D.; Blum, K.; Baron, D.; et al. The First Exploratory Personalized Medicine Approach to Improve Bariatric Surgery Outcomes Utilizing Psychosocial and Genetic Risk Assessments: Encouraging Clinical Research. J. Pers. Med. 2023, 13, 1164. [Google Scholar] [CrossRef]
- Thanos, P.K.; Hanna, C.; Mihalkovic, A.; Hoffman, A.; Posner, A.; Butsch, J.; Blum, K.; Georger, L.; Mastrandrea, L.D.; Quattrin, T. Genetic Correlates as a Predictor of Bariatric Surgery Outcomes after 1 Year. Biomedicines 2023, 11, 2644. [Google Scholar] [CrossRef]

| Paper | Disease | Population | Results |
|---|---|---|---|
| Ko et al., 2022 [19] | AS (I) | A Taiwanese cohort was used for both training and testing purposes. | GRS was used to predict AS versus healthy controls. Of all GRS methods used, GenEpi had the highest performance with an AUC-ROC of 0.81, while LDpred2 had the lowest performance with an AUC-ROC of 0.76. |
| Li et al., 2021 [10] | AS (I) | Data were used comprising individuals of European, Chinese, Turkish, and Iranian descent. | GRSs performed better in disease prediction than other standard diagnostic tests for predicting AS versus healthy controls, with an AUC-ROC of 0.92. |
| Chang et al., 2022 [20] | Gout/AH (I) | A Taiwanese cohort was used, classifying individuals as either gout, AH, or normouricaemic. | A positive correlation was found between gout/AH GRS and the development of gout/AH as compared to normouricemia. |
| Lin et al., 2023 [21] | Gout/AH (I) | A Taiwanese cohort was used, classifying individuals as either gout, AH, or normouricaemic. | GRS explained 0.59–0.89% of the variance of the phenotype of gout/AH in females. |
| Sumpter et al., 2023 [22] | Gout (II) | Seven European, two East Polynesian, and one West Polynesian gout cohorts were used. | Gout GRS was associated with earlier onset of gout and tophaceous disease in men but not in women. |
| Sandoval-Plata et al., 2021 [23] | Gout vs. AH vs. healthy control (I, III) | The UK biobank was used, classifying individuals as either gout, AH, or normouricaemic. | Predicting gout versus AH in a hyperuricemic population using GRS gave an AUC-ROC of 58.5% while adding GRS to a model with demographic risk factors increased the AUC from 66.7% to 69.2%. |
| Lai et al., 2022 [24] | Gout and hypertension (VI) | The Taiwanese biobank was used. | Gout susceptibility seems to have a causal effect on hypertension. Hypertension, however, does not have a causal effect on gout. |
| McCormick et al., 2021 [25] | Hyperuricemia and hyperinsulinemia (VI) | Multiple available GWAS cohorts were used, including the CKDGen, MAGIC, and UKBiobank cohorts. | Provide evidence that hyperinsulinemia has a causal effect on hyperuricemia but not vice versa. |
| Cánovas 2020 [11] | JIA (I) | Three JIA cohorts from the UK, US, and Australia were used. Only the UK cohort was employed as a training set. | A model predicting JIA versus healthy controls based on JIA GRS achieved AUC-ROC’s of 0.67, 0.66, and 0.67 for the UK, US, and Australia cohorts, respectively. The highest prediction was seen for the oligoarthritis JIA subtype. |
| Clarke et al., 2022 [26] | JIA and Cardiovascular risk factors (II) | The ALSPAC cohort, a UK cohort encompassing mainly individuals of European descent, was used. | The GRS for JIA is associated with multiple cardiovascular risk factors, including higher diastolic blood pressure, blood insulin levels, insulin resistance index, log hsCRP, waist circumference, fat mass index, and body mass index. |
| Lacaze et al., 2022 [27] | OA (I) | An Australian cohort was used with patients of European descent. | Higher GRS was associated with an increased knee and hip replacement risk. Adding GRS to a prediction model for knee replacement (that includes multiple other variables) increased the AUC-ROC from 0.666 to 0.668. An AUC increase from 0.57 to 0.59 was observed for a similar model for hip replacement. |
| Morita et al., 2023 [28] | OA (I) | Both a Japanese cohort and a multi-ancestry cohort were used to construct the GRS. The GRS score was evaluated on the Japanese population. | The addition of a GRS based on multi-population GWAS to a prediction model with traditional risk factors increased the AUC-ROC from 0.74 to 0.75 (p = 0.03) on the prediction of OA versus controls. |
| Sedaghati-Khayat et al., 2022 [29] | OA (I) | Three Dutch cohorts were used, with OA cases and healthy controls. | Predicting OA using GRS yielded an AUC-ROC of 0.57 while adding GRS to a prediction model with clinical risk factors increased the AUC from 0.64 to 0.66. GRS was found to be associated with radiographic OA, clinical OA, and radiographic OA progression. A stronger association was found with clinical OA as compared to radiographic OA. |
| Zhu et al., 2022 [30] | OA (IV) | The UK biobank was used. | Various types of physical activity are associated with hip/knee OA. There is no interaction between types of physical activity and OA GRS on hip/knee OA, meaning that the effect of physical activity on OA was the same across individuals with different genetic susceptibilities. |
| Hindy et al., 2019 [31] | OA and cardiometabolic risk factors (VI) | The Malmö Diet and Cancer Study cohort and the UK Biobank were used. | Using Mendelian randomization, evidence is provided that elevations in low-density lipoprotein cholesterol reduce the risk of OA while also showing that an increased BMI increases the risk of OA. |
| Smith et al., 2020 [32] | PsA (III) | A US cohort containing individuals with either psoriasis only or psoriasis with PsA was used. | Weighted GRS achieved an AUC-ROC of 56.2% in discriminating between psoriasis with and without PsA in a population with psoriasis, with an AUC of 56.9% in an HLA-only model. |
| Honda et al., 2022 [33] | RA (I) | A large Japanese cohort was used for both training and testing. | The GRS based on RA susceptibility SNPs is significantly associated with the severity of radiographic progression within RA, with AUC-ROC values of 0.56–0.66. |
| Ishigaki et al., 2022 [15] | RA (I) | Multi-ancestry data was used from 37 cohorts, including individuals from European, East Asian, African, South Asian and Arab ancestries. | GRS based on multi-ancestry GWAS outperformed single-ancestry GWAS-based GRS in predicting multi-ancestry RA cases versus healthy controls. The multi-ancestry GRS had an AUC-ROC of 0.59–0.66. |
| Maurits et al., 2023 [34] | RA, CSA (I, II) | Individuals of European descent were included and classified as either RA, CSA, or healthy controls. | RA GRS differed significantly between healthy controls, CSA, and RA patients, increasing across these groups. Similar results were observed for the HLA-shared epitope. |
| Jones et al., 2019 [35] | RA and Cognitive/Psychiatric phenotypes (II) | The ALSPAC cohort, a UK cohort encompassing mainly individuals of European descent, was used. | There is an association between the GRS of RA and a lower total IQ at age 8, as well as symptoms of hyperactivity and inattention at ages 4–16. |
| Kasher et al., 2022 [36] | RA & Osteoporosis (II) | The UK biobank was used, selecting only individuals of European descent. | RA GRS is associated with osteoporotic fractures as well as total-, spine-, and forearm bone mineral density. It seems that pleiotropy is involved in the association between RA and osteoporosis. |
| Zhang et al., 2023 [37] | RA (II) | The UK biobank was used, only selecting individuals without evidence of RA. | Studied the association between RA GRS and multiple phenotypes. A total of 13 out of 20 phenotypic traits that were associated with the RA GRS were autoimmune-related traits. |
| Wells et al., 2020 [12] | RA (IV) | Cohorts from the UK and Switzerland were used, and individuals with RA were excluded from the analysis. | GRS for RA is positively associated with the gut bacteria Prevotella spp. This bacteria is also associated with preclinical RA phases in non-RA individuals. |
| Zhang et al., 2023 [3] | RA (IV) | The UK biobank was used, including only individuals of European descent. | Air pollution was positively associated with the risk of developing RA. The interaction between air pollution and the RA GRS score was not significant, although the risk of developing RA in individuals with the highest genetic risk score and highest air pollution exposure was twice that compared to individuals in the lowest-risk categories. |
| Kwon et al., 2023 [38] | SLE (I) | A Korean SLE cohort, encompassing patients with different SLE manifestations, was used. | A high GRS was associated with an earlier age of onset, higher anti-Sm antibody levels, and the development of LN. Predicting LN using GRS had an AUC-ROC of 0.56–0.60. |
| Ma et al., 2022 [18] | SLE (I) | Individuals of Chinese and European ancestry were studied, with SLE cases and healthy controls. | GRS achieved an AUC-ROC of 0.74 in discriminating SLE vs. healthy controls. A random forest method was developed that improved the AUC to 0.84. Machine learning shows potential for genetic prediction. |
| Chen et al., 2020 [9] | SLE (I) | Three European and two Chinese cohorts with SLE cases and healthy controls were studied, both for training and testing purposes. | GRS predicts SLE (versus healthy controls) and differentiates between SLE with and without renal disease. The AUC-ROC are 0.64–0.72 and 0.58–0.62, respectively. |
| Reid et al., 2019 [39] | SLE (I) | A Swedish cohort was used with SLE cases and healthy controls. | The AUC-ROC of predicting SLE using GRS was 0.78. A high GRS is associated with worse survival, organ damage, cardiovascular disease, proliferative nephritis, ESRD, and antiphospholipid antibodies in patients with SLE. |
| Tangtanatakul et al., 2020 [40] | SLE (I) | Data based on a Chinese cohort was used to construct the GRS, which was subsequently tested on a Thai cohort. | GRS constructed using data from a Chinese cohort yielded an AUC-ROC of 0.76 in discriminating SLE versus healthy controls when applied to a cohort from the Thai population. |
| Wang et al., 2021 [41] | SLE (I) | Data based on a European cohort was used to construct the GRS, which was subsequently tested on a Chinese cohort. | GRS was used to predict SLE versus healthy controls. Lassosum achieved an AUC-ROC between 0.62 and 0.64. LDpred produced similar results. Ancestry-matched predictors perform better with an AUC of 0.76. |
| Kawai et al., 2021 [42] | SLE & cardiometabolic disorders (II) | A US cohort was used, restricting the analysis to individuals of European descent. | SLE GRS was associated with an increased risk of type 1 diabetes and several other autoimmune phenotypes but not cardiometabolic disorders |
| Knevel et al., 2020 [4] | RA, SLE, SpA, PsA and gout (III) | Three US databases of ICD codes were used, only selecting individuals who were self-reported as white. | A new tool was developed to distinguish between multiple related rheumatic diagnoses (RA, SLE, SpA, PsA, and gout). This tool was tested on three independent cohorts, achieving AUC-ROCs of 0.69, 0.81, and 0.84. For all patients, at least one diagnosis could be ruled out, and in 45% of patients, a likely diagnosis was identified with a PPV of >64%. |
| Mars et al., 2022 [43] | Multiple diseases (V) | FinnGen study data, a large Finnish network combining genomic information with national health registries, was used. | Family history (FH) and GRS are independent and not interchangeable measures; instead, they provide complementary information on inherited disease susceptibility. GRS explains, on average, 10% of the effect of 1st-degree FH, and 1st-degree FH explains 3% of GRS. In most diseases, a high genetic risk combined with positive family history is associated with a higher risk. A low genetic risk compensated for risk through a positive family history. |
Disclaimer/Publisher’s Note: The statements, opinions and data contained in all publications are solely those of the individual author(s) and contributor(s) and not of MDPI and/or the editor(s). MDPI and/or the editor(s) disclaim responsibility for any injury to people or property resulting from any ideas, methods, instructions or products referred to in the content. |
© 2023 by the authors. Licensee MDPI, Basel, Switzerland. This article is an open access article distributed under the terms and conditions of the Creative Commons Attribution (CC BY) license (https://creativecommons.org/licenses/by/4.0/).
Share and Cite
Vaskimo, L.M.; Gomon, G.; Naamane, N.; Cordell, H.J.; Pratt, A.; Knevel, R. The Application of Genetic Risk Scores in Rheumatic Diseases: A Perspective. Genes 2023, 14, 2167. https://doi.org/10.3390/genes14122167
Vaskimo LM, Gomon G, Naamane N, Cordell HJ, Pratt A, Knevel R. The Application of Genetic Risk Scores in Rheumatic Diseases: A Perspective. Genes. 2023; 14(12):2167. https://doi.org/10.3390/genes14122167
Chicago/Turabian StyleVaskimo, Lotta M., Georgy Gomon, Najib Naamane, Heather J. Cordell, Arthur Pratt, and Rachel Knevel. 2023. "The Application of Genetic Risk Scores in Rheumatic Diseases: A Perspective" Genes 14, no. 12: 2167. https://doi.org/10.3390/genes14122167