Article

Spotlight on hTERT Complex Regulation in Cutaneous T-Cell Lymphomas

by
Joana Ropio
1,2,3,
Martina Prochazkova-Carlotti
1,
Rui Batista
4,5,6,
Ana Pestana
4,5,6,
Alain Chebly
1,7,8,
Jacky Ferrer
1,
Yamina Idrissi
1,
David Cappellen
1,9,
Cecília Durães
4,5,
Paula Boaventura
5,
João Vinagre
4,5,
Lamia Azzi-Martin
1,10,
Sandrine Poglio
1,
José Cabeçadas
11,
Manuel António Campos
4,5,6,12,
Marie Beylot-Barry
1,13,
Manuel Sobrinho-Simões
4,5,6,14,
Jean-Philippe Merlio
1,9,
Paula Soares
4,5,6,14,* and
Edith Chevret
1,*
1
BRIC (BoRdeaux Institute of onCology), UMR1312, INSERM, University of Bordeaux, 33000 Bordeaux, France
2
Institute of Biomedical Sciences of Abel Salazar, Porto University, 4050-313 Porto, Portugal
3
Faculty of Veterinary Medicine, Lusófona University, 1749-024 Lisbon, Portugal
4
Institute for Research and Innovation in Health (I3S), Porto University, 4200-135 Porto, Portugal
5
Institute of Molecular Pathology and Immunology of the University of Porto (IPATIMUP), Cancer Biology Group, Porto University, 4200-465 Porto, Portugal
6
Faculty of Medicine, Porto University, 4200-319 Porto, Portugal
7
Medical Genetics Unit, Faculty of Medicine, Saint Joseph University, Beirut 1104 2020, Lebanon
8
Higher Institute of Public Health, Saint Joseph University, Beirut 1104 2020, Lebanon
9
Tumor Bank and Tumor Biology Laboratory, Bordeaux University Hospital, 33075 Bordeaux, France
10
UFR des Sciences Médicales, Bordeaux University, 33076 Bordeaux, France
11
Dermatology Departement, Instituto Português de Oncologia de Lisboa (IPO-L), 1099-023 Lisbon, Portugal
12
Centro Hospitalar Vila Nova de Gaia/Espinho, E.P.E., Dermatology Departement, 4434-502 Vila Nova de Gaia, Portugal
13
Dermatology Department, Bordeaux University Hospital, 33075 Bordeaux, France
14
Department of Pathology, Faculty of Medicine, Porto University, 4200-319 Porto, Portugal
*
Authors to whom correspondence should be addressed.
Genes 2023, 14(2), 439; https://doi.org/10.3390/genes14020439
Submission received: 20 December 2022 / Revised: 5 February 2023 / Accepted: 6 February 2023 / Published: 8 February 2023
(This article belongs to the Section Molecular Genetics and Genomics)

Abstract

:
As a major cancer hallmark, there is a sustained interest in understanding the telomerase contribution to carcinogenesis in order to therapeutically target this enzyme. This is particularly relevant in primary cutaneous T-cell lymphomas (CTCL), a malignancy showing telomerase dysregulation with few investigative data available. In CTCL, we examined the mechanisms involved in telomerase transcriptional activation and activity regulation. We analyzed 94 CTCL patients from a Franco-Portuguese cohort, as well as 8 cell lines, in comparison to 101 healthy controls. Our results showed that not only polymorphisms (SNPs) located at the promoter of human telomerase reverse transcriptase (hTERT) gene (rs2735940 and rs2853672) but also an SNP located within the coding region (rs2853676) could influence CTCL occurrence. Furthermore, our results sustained that the post-transcriptional regulation of hTERT contributes to CTCL lymphomagenesis. Indeed, CTCL cells present a different pattern of hTERT spliced transcripts distribution from the controls, mostly marked by an increase in the hTERT β+ variants proportion. This increase seems to be associated with CTCL development and progression. Through hTERT splicing transcriptome modulation with shRNAs, we observed that the decrease in the α-β+ transcript induced a decrease in the cell proliferation and tumorigenic capacities of T-MF cells in vitro. Taken together, our data highlight the major role of post-transcriptional mechanisms regulating telomerase non canonical functions in CTCL and suggest a new potential role for the α-β+ hTERT transcript variant.

1. Introduction

Telomere shortening is considered to be a control mechanism limiting cells’ replicative capacity, inducing senescence once a critical level of shortening has occurred [1]. Therefore, cancer cells’ continuous proliferation requires the activation of a telomere maintenance mechanism. About 85% of human cancer cells activate the telomerase enzyme that adds telomeric repeats to chromosome ends, while the remaining 15% activate the Alternative Lengthening of Telomeres (ALT) mechanism [2,3]. Although numerous factors are involved in telomerase activity, hTERT (human TElomerase Reverse Transcriptase, the enzymes’ catalytic subunit) expression is its limiting factor in many cancers [4]. Beside its activity on telomere elongation, hTERT is also implicated in tumor formation and progression, since its expression is determinant to cell immortalization and resistance to senescence and apoptosis [5,6,7]. These telomere-independent functions are considered as telomerase non-canonical functions [8]. Thus, the regulation of the hTERT complex in cancer cells is highly controlled, involving numerous steps such as transcriptional and post-transcriptional mechanisms [9,10,11].
Non-coding mutations within the hTERT core promoter provided the first mechanism of cancer-specific telomerase (re)activation (Figure 1B) [12,13]. Two hotspot mutations, located at −124 C > T and −146 C > T (from the ATG start site), generate a new consensus binding site for ETS/TCFs transcription factors, which increases the hTERT transcription and activity two to four times [14]. This mechanism has strong clinical implications conferring a worse prognosis and poor survival in many cancers [2,15,16].
At the post-transcriptional level, hTERT pre-mRNA is subject to alternative splicing, which generates proteome diversity with different biological functions. To date, around 20 transcript variants have been identified [11,17,18]. Cells exhibiting telomerase activity co-express, at significant levels, different hTERT transcripts and evidence exists that hTERT alternative splicing may play a critical role in the regulation of telomerase activity [19,20,21]. The two most studied hTERT alternative splicing events occur within the telomerase catalytic reverse transcriptase (RT) domain, at α and β sites (Figure 2). The α site originates from a 36-long base pair (bp) in-frame deletion on exon 6, while the β site encompasses a 183 bp long deletion from exons 7 and 8 that generates a truncated protein (Figure 2) [22]. Splicing at α and β sites can occur separately or in combination, generating either α+β+, α−β+, α+β− or α−β− hTERT transcripts (Figure 2). Only the full-length RT domain hTERT transcript, α+β+, exhibits telomerase activity [23], while the other variants may exhibit different functions. The α−β+ variant is a negative regulator of telomerase activity [22]. The α+β− protein, as it conserves the RNA-binding motif, can also act as a negative regulator of telomerase activity alongside its capacity to protect cancer cells from cell death by apoptosis [22,24,25]. While the α−β− hTERT variant is described as the less expressed transcript, no specific function has been assigned to this hTERT variant yet [26].
Genetic variants of hTERT were also found to play a crucial role in the risk and prognosis of human cancers. Indeed, based on genome-wide association studies (GWAS), single nucleotide polymorphisms (SNPs) within the hTERT locus (5p15.33) have been consistently associated with an increased risk for developing various types of cancers [2,27]. hTERT SNPs are located either within its promoter, or in intronic and also exonic regions (Figure 1A). Usually, hTERT SNPs do not generate deleterious coding alleles; however, they are reportedly associated with telomere lengthening, such as rs2853672, rs2853676, and rs10069690 polymorphisms [28,29,30,31,32,33]. Meanwhile, polymorphic changes in the hTERT promoter sequence (rs2853669 and rs2735940) were found to influence the telomerase expression [34,35,36].
Primary cutaneous T-cell lymphomas (CTCL) are a heterogeneous group of non-Hodgkin lymphomas presenting in the skin with no evidence of extracutaneous disease at the time of diagnosis [37]. The most common subtypes, comprising 75% of CTCL, include mycosis fungoides (MF) (representing around 50% of CTCL cases), Sézary syndrome (SS), and CD30+ lymphoproliferative disorders (LPDs) [37]. Patients with MF usually experience an indolent disease with a 5 year disease-specific survival (DSS) of 88% [38]. However, a minority undergo a process of large-cell transformation (transformed mycosis fungoides, T-MF), which often heralds a more aggressive disease, with the cancer spreading to lymph nodes and/or internal organs [39,40]. SS is a rare aggressive leukemic type of CTCL, traditionally defined by the triad of pruritic erythroderma, generalized lymphadenopathy, and clonally related neoplastic T cells with cerebriform nuclei (Sézary cells) in the skin, lymph nodes, and peripheral blood [37,41]. The 5-year DSS in SS is around 36% [42]. LPDs comprise a spectrum of conditions with similar histologic and molecular features, but different clinical presentations. They include lymphomatoid papulosis (LyP) and primary cutaneous anaplastic large cell lymphomas (c-ALCL), both with a favorable prognosis and a 5-year DSS greater than 95% [37,43].
The deregulation of the telomerase expression and telomere length is a common feature of hematological diseases, including CTCL [44,45,46]. We previously demonstrated that telomerase is expressed in different CTCL subtypes (c-ALCL, T-MF and SS) and showed that short telomeres are a hallmark of the aggressive subtypes (T-MF and SS) [46]. Furthermore, our team also showed that besides the maintenance of the telomere length, telomerase exerts additional functions in CTCL [46].
In this work, we aimed to deepen the knowledge on the hTERT regulation in CTCL cells. We investigated the hTERT expression-regulating mechanism in order to understand the regulation of the telomerase functions. Our results represent a step forward towards a better understanding of the telomerase reactivation in neoplastic CTCL cells, taking into account the potential future therapeutic implications against telomerase in cancer cells.

2. Methods

2.1. Patients and Healthy Controls

All tumors included in this study, obtained from French and Portuguese institutions, were classified according to the criteria of the World Health Organization–European Organization for Research and Treatment of Cancer (WHO-EORTC) [37].
Tumor DNA and peripheral blood samples from 61 patients were collected from the dermatology department at Bordeaux University Hospital Center (CHU) (France) as well as 33 representative formalin-fixed paraffin-embedded (FFPE) samples from the pathology archives at Instituto Português de Oncologia de Lisboa (IPO-L) and Centro Hospitalar Vila Nova de Gaia/Espinho (Portugal). A total of 94 tumor samples were analyzed (29 ≤ age ≤ 87, mean age 65), including 22 LPDs (14 cALCL and 8 LyP), 39 MF (24 classic MF and 15 T-MF), and 33 SS. The institutional review board approved the manipulation of the CTCL patients’ samples (DC-2015-412). Peripheral blood from 101 healthy donors (24 ≤ age ≤ 85, mean age 60) was obtained from the Etablissement Français du Sang, Bordeaux (DC 2015 2412-18PLER012), and CHU of Bordeaux (France). Peripheral blood mononuclear cells (PBMC) from patients and healthy donors were isolated by PANCOLL® density gradient centrifugation (PAN-Biotech, Aidenbach, Germany).

2.2. CTCL Cell Lines

Experiments were performed on six classical CTCL cell lines, including four cALCL: Mac1, Mac2A, Mac2B (DSMZ), and FEPD (Prof. G. Delsol, Toulouse, France); one T-MF: MyLa (Dr K. Kaltoft, Aarhus, Denmark); and one SS: Hut78 (ATCC). Furthermore, we included two SS cell lines newly developed in our laboratory: L1 and L2 [47]. A human T-cell leukemia cell line, 1301 (Sigma-Aldrich), was used as a positive control for the amplification of the hTERT RT domain splicing variants. The cells were cultured in an RPMI 1640 media (Gibco, Waltham, MA, USA) supplemented with 1% penicillin–streptomycin (Gibco) and 10% fetal bovine serum (Eurobio, Les Ulis, France), except for the L1 and L2 cell lines, which were cultured as previously described [47]. All cell lines were incubated at 37 °C with 5% CO2 and regularly tested for mycoplasma contamination.

2.3. Telomerase Activity Estimation

The telomerase activity was assessed from the protein extracts by means of the TRAPeze® RT telomerase detection kit (Sigma-Aldrich, Saint-Quentin-Fallavier, France), according to the manufacturer’s instructions with some modifications, as previously described [46].

2.4. Nucleic Acid Isolation

Genomic DNA was extracted by the salt precipitation method, previously detailed in [48]. The total RNA was isolated using the Direct-zol™ RNA MiniPrep kit (ZYMO Research, Breisgau, Germany). Both the DNA and RNA concentrations were measured by a NanoDrop 2000 spectrophotometer. The DNAs quality was analyzed by classic agarose gel electrophoresis and the RNA quality was analyzed on Agilent 2200 TapeStation system. The DNA was stored at −20 °C and the RNA was stored at −80 °C, until a further genetic analysis.

2.5. Telomere Length Measurement

The telomere length was calculated from the DNA samples by means of the Absolute Human Telomere Length Quantification qPCR Assay Kit (ScienCell, Carlsbad, CA, USA), as previously described [48].

2.6. hTERT Hotspot Promoter Mutations Detection

The −146:C > T and −124:C > T hTERT promoter mutations were screened by PCR followed by direct Sanger sequencing in DNA samples, as previously described [15]. Primers used are available in Supplementary Table S1.

2.7. hTERT SNPs Genotyping

The SNPs were genotyped either by an allele-specific PCR or by TaqMan probes. hTERT SNPs rs2735940, rs2853672, rs2853676, and rs10069690 were genotyped by an allele-specific PCR. The allele-specific reactions were analyzed in the DNA samples, with each individual forward and reverse primer sets (Supplementary Table S1) and TakyonTM No Rox SYBR® MasterMix dTTP Blue (Eurogentec, Seraing, Belgium), according to the manufacturer’s instructions. All SNP amplification reactions were carried out in a Stratagene Mx3005P system (Agilent Technologies, Santa Clara, CA, USA) and followed the same qPCR program setup: initial denaturation step at 95 °C for 3 min, followed by 40 cycles of 95 °C for 20 s and 60 °C for 20 s, with signal acquisition. hTERT rs2853669 polymorphism was analyzed by means of the TaqMan SNP genotyping assay (Life Technologies) in an ABI Prism 7500 Fast system (Life Technologies, Carlsbad, CA, USA).

2.8. hTERT Splicing Variants Expression

In total, 1 µg of the total RNA was reverse transcribed using the SuperScript II reverse transcriptase kit (Invitrogen, Waltham, MA, USA), following the manufacturer’s instructions. The complementary DNA (cDNA) was amplified using specific primers (Supplementary Table S1) and TakyonTM No Rox SYBR® MasterMix dTTP Blue (Eurogentec, Seraing, Belgium). Amplifications were carried out on a Stratagene Mx3005P system and analyzed with MxPro 4.01 qPCR software Stratagene (Agilent Technologies, Santa Clara, CA, USA). The expression quantification was normalized to the expression level of the TATA box-binding protein (TBP) reference gene. The hTERT splicing variants were amplified as follows: initial denaturation step at 95 °C for 3 min, followed by 45 cycles of 95 °C for 20 sec and 60 °C for 60 s with signal acquisition. The 1301 cell line was used as a positive control and its dissociation curves were used as the reference (Supplementary Figure S1).

2.9. Lentiviral shRNA Construction and Production

Constructs sh1, sh2 (targeting hTERT β site), and the sh control (non-targeting) were cloned into a pLKO.1-Tomato (Addgene, Watertown, MA, USA) vector at the AgeI/EcoRI sites. shRNA primer sequences are available in Supplementary Table S2. Lentiviral vector construction maps are available in Supplementary Figure S2. Lentiviral vectors were used to transfect the HEK293T cells at Bordeaux University Vectorology platform, to induce viral production.

2.10. Lentiviral Cell Transduction

MyLa cells were transduced with the appropriate volume of virus to obtain 33% of transduced cells. After 10 days, positively transduced cells were selected by flow cytometry on the BD FACSAriaTM III sorter (BD Biosciences, San Jose, CA, USA).

2.11. Cell Proliferation Analysis

The cell proliferation capacity of transduced MyLa cells was measured by direct cell-counting in a hemocytometer (KOVA, Garden Grove, CA, USA). Furthermore, 2 × 10⁵ cells per well were seeded into 12-well plates and counted after 2, 5, 8, and 12 days of culture.

2.12. Cell Clonogenicity Analysis

Transduced MyLa cells were placed in soft agar in 6-well plates and tested for their capacities to form cell colonies. The soft agar technique was previously described [46].

2.13. Statistical Analysis

Statistical analyses were performed on GraphPad Prism software (version 8.0.1 (244)) and on SPSS 23 (IBM SPSS Statistics). hTERT RT domain splicing variants statistical analyses were performed on GraphPad Prism software. Data from the patients were collected from triplicate reactions from each sample. Data from the cell lines were collected from triplicate reactions from two independent biological experiments. The results were presented as the mean ± standard deviation. A paired Mann–Whitney test (nonparametric T-test) was used to compare the results.
Genotype frequencies for hTERT SNPs were obtained using SPSS 23. The compliance of the alleles with the Hardy–Weinberg equilibrium was measured at the level of the control population using a χ2 test. The comparison of the genotype frequencies between the groups was assessed by the unconditional logistic regression with SPSS 23. The odds ratios (OR) with respective confidence intervals (95% CI) were calculated considering the genotypic and the dominant models of inheritance. The significance level of the p-value was set to <0.05.

3. Results

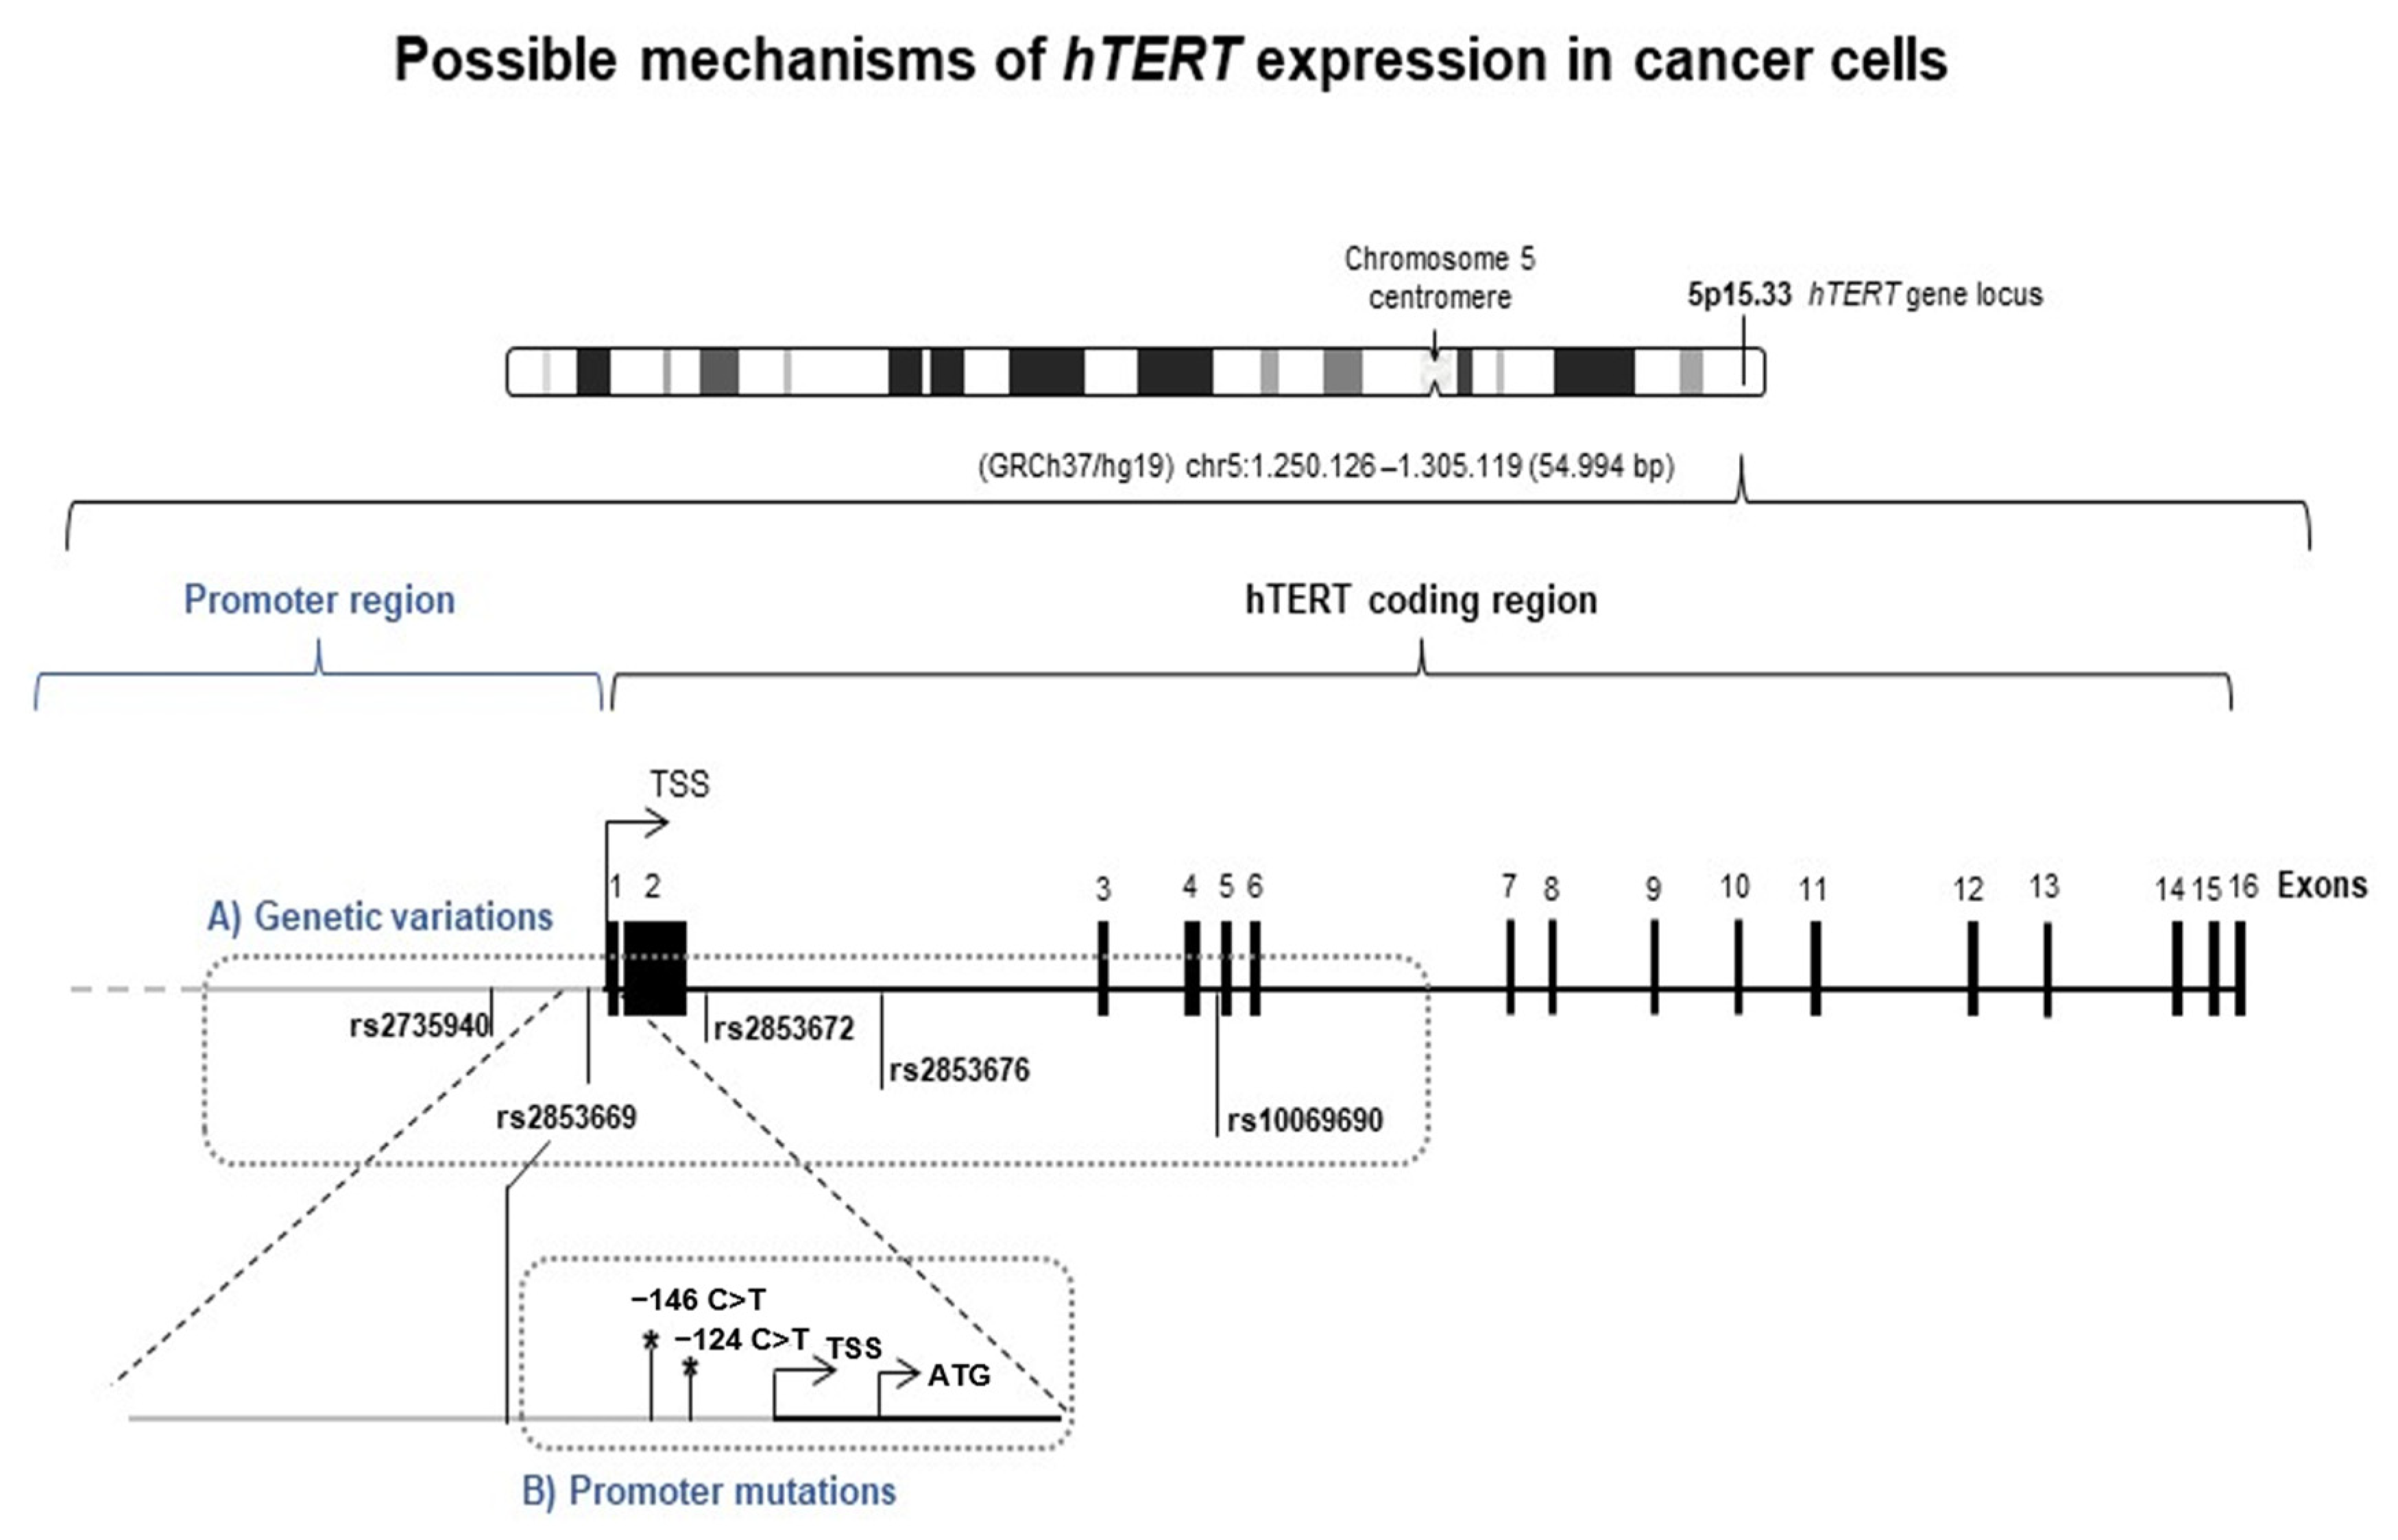
3.1. hTERT SNPs Are Associated with CTCL Risk in Patient Cells

Two hTERT promoter SNPs, rs2735940 T > C and rs2853669 T > C, along with three hTERT intronic SNPs, rs2853672 G > T, rs2853676 G > A, and rs10069690 C > T (Figure 1A), were genotyped in 101 healthy controls, as well as in 66 CTCL patients and 8 cell lines (Table 1). The distribution of all SNP genotypes in the control group were in accordance with Hardy–Weinberg equilibrium: rs2735940 T > C (χ2 = 0.06, p > 0.05), rs2853669 T > C (χ2 = 0.3, p > 0.05), rs2853672 G > T (χ2 = 0.3, p > 0.05), rs2853676 G > A (χ2 = 0.3, p > 0.05), and rs10069690 C > T (χ2 = 1.73, p > 0.05) (Table 1).
The results showed that the rs2853669 SNP genotype distribution was not different between the patients and the controls (Table 1). The genotyping of rs10069690 SNP revealed a decrease in the prevalence of the TT genotype in CTCL patients (OR (95%CI) = 0.14 (0.017–1.21), p = 0.074), although this was not statically significant. Hence, no impact on the CTCL risk was observed for these two hTERT SNPs. On the other hand, the genotyping of rs2735940 SNP revealed that this SNP can impact the risk of CTCL. Indeed, rs2735940 TC and CC genotypes were significantly more prevalent in the patients than in the controls (OR (95%CI) = 3.00, p = 0.010 and OR (95%CI) = 3.79, p = 0.011, respectively). Hence, the CTCL risk was significantly increased in the rs2735940 C allele carriers (OR (95%CI) = 3.20, p = 0.004) (Table 1). The CTCL risk was also significantly influenced by rs2853672 and rs2853676 SNPs when using the dominant model (Table 1). Additionally, for the rs2853672, the T allele enhanced the risk for CTCL by two times (OR (95%CI) = 2.18, p = 0.039); and for the rs2853676, the minor allele A was associated with a lower risk for CTCL (OR (95%CI) = 0.46, p = 0.028) (Table 1).
It is worth mentioning that each CTCL cell line presented a specific combination of these five polymorphisms (Supplementary Table S3).

3.2. hTERT Transcription Regulation in CTCL: hTERT Promoter Mutations Are a Rare Event in CTCL Patients

As the mechanism underlying the telomerase activation in CTCL started to be uncovered [49,50], we investigated the occurrence of the non-coding mutations within the hTERT core promoter.
The occurrence of the two hotspot hTERT promoter mutations, −124C > T and −146C > T (from the ATG) (Figure 1B), were first studied in the CTCL cell lines. Out of the eight cell lines screened, only one, the T-MF-derived cell line MyLa, harbored the −146C > T mutation (Table 2). The mutation was homozygous. This encouraged us to retrospectively investigate these mutations in a cohort of 8 patients with a history of MF that transformed to T-MF, along with 18 LPDs, 24 MF with no progression, and 17 SS patients. Among the CTCL cohort of 67 patients, only one SS patient harbored the −146 C > T mutation, which represented 5.9% of SS cases and 1.5% of all CTCL patients (Table 2).

3.3. hTERT Post-Transcription Regulation in CTCL Cells

We previously demonstrated that besides the maintenance of the telomere length, telomerase exerts additional functions in CTCL [46]. Therefore, we investigated the hTERT post-transcriptional regulation through an alternative splicing mechanism in order to investigate the implication of such mechanisms in the telomerase regulation in CTCL cells.

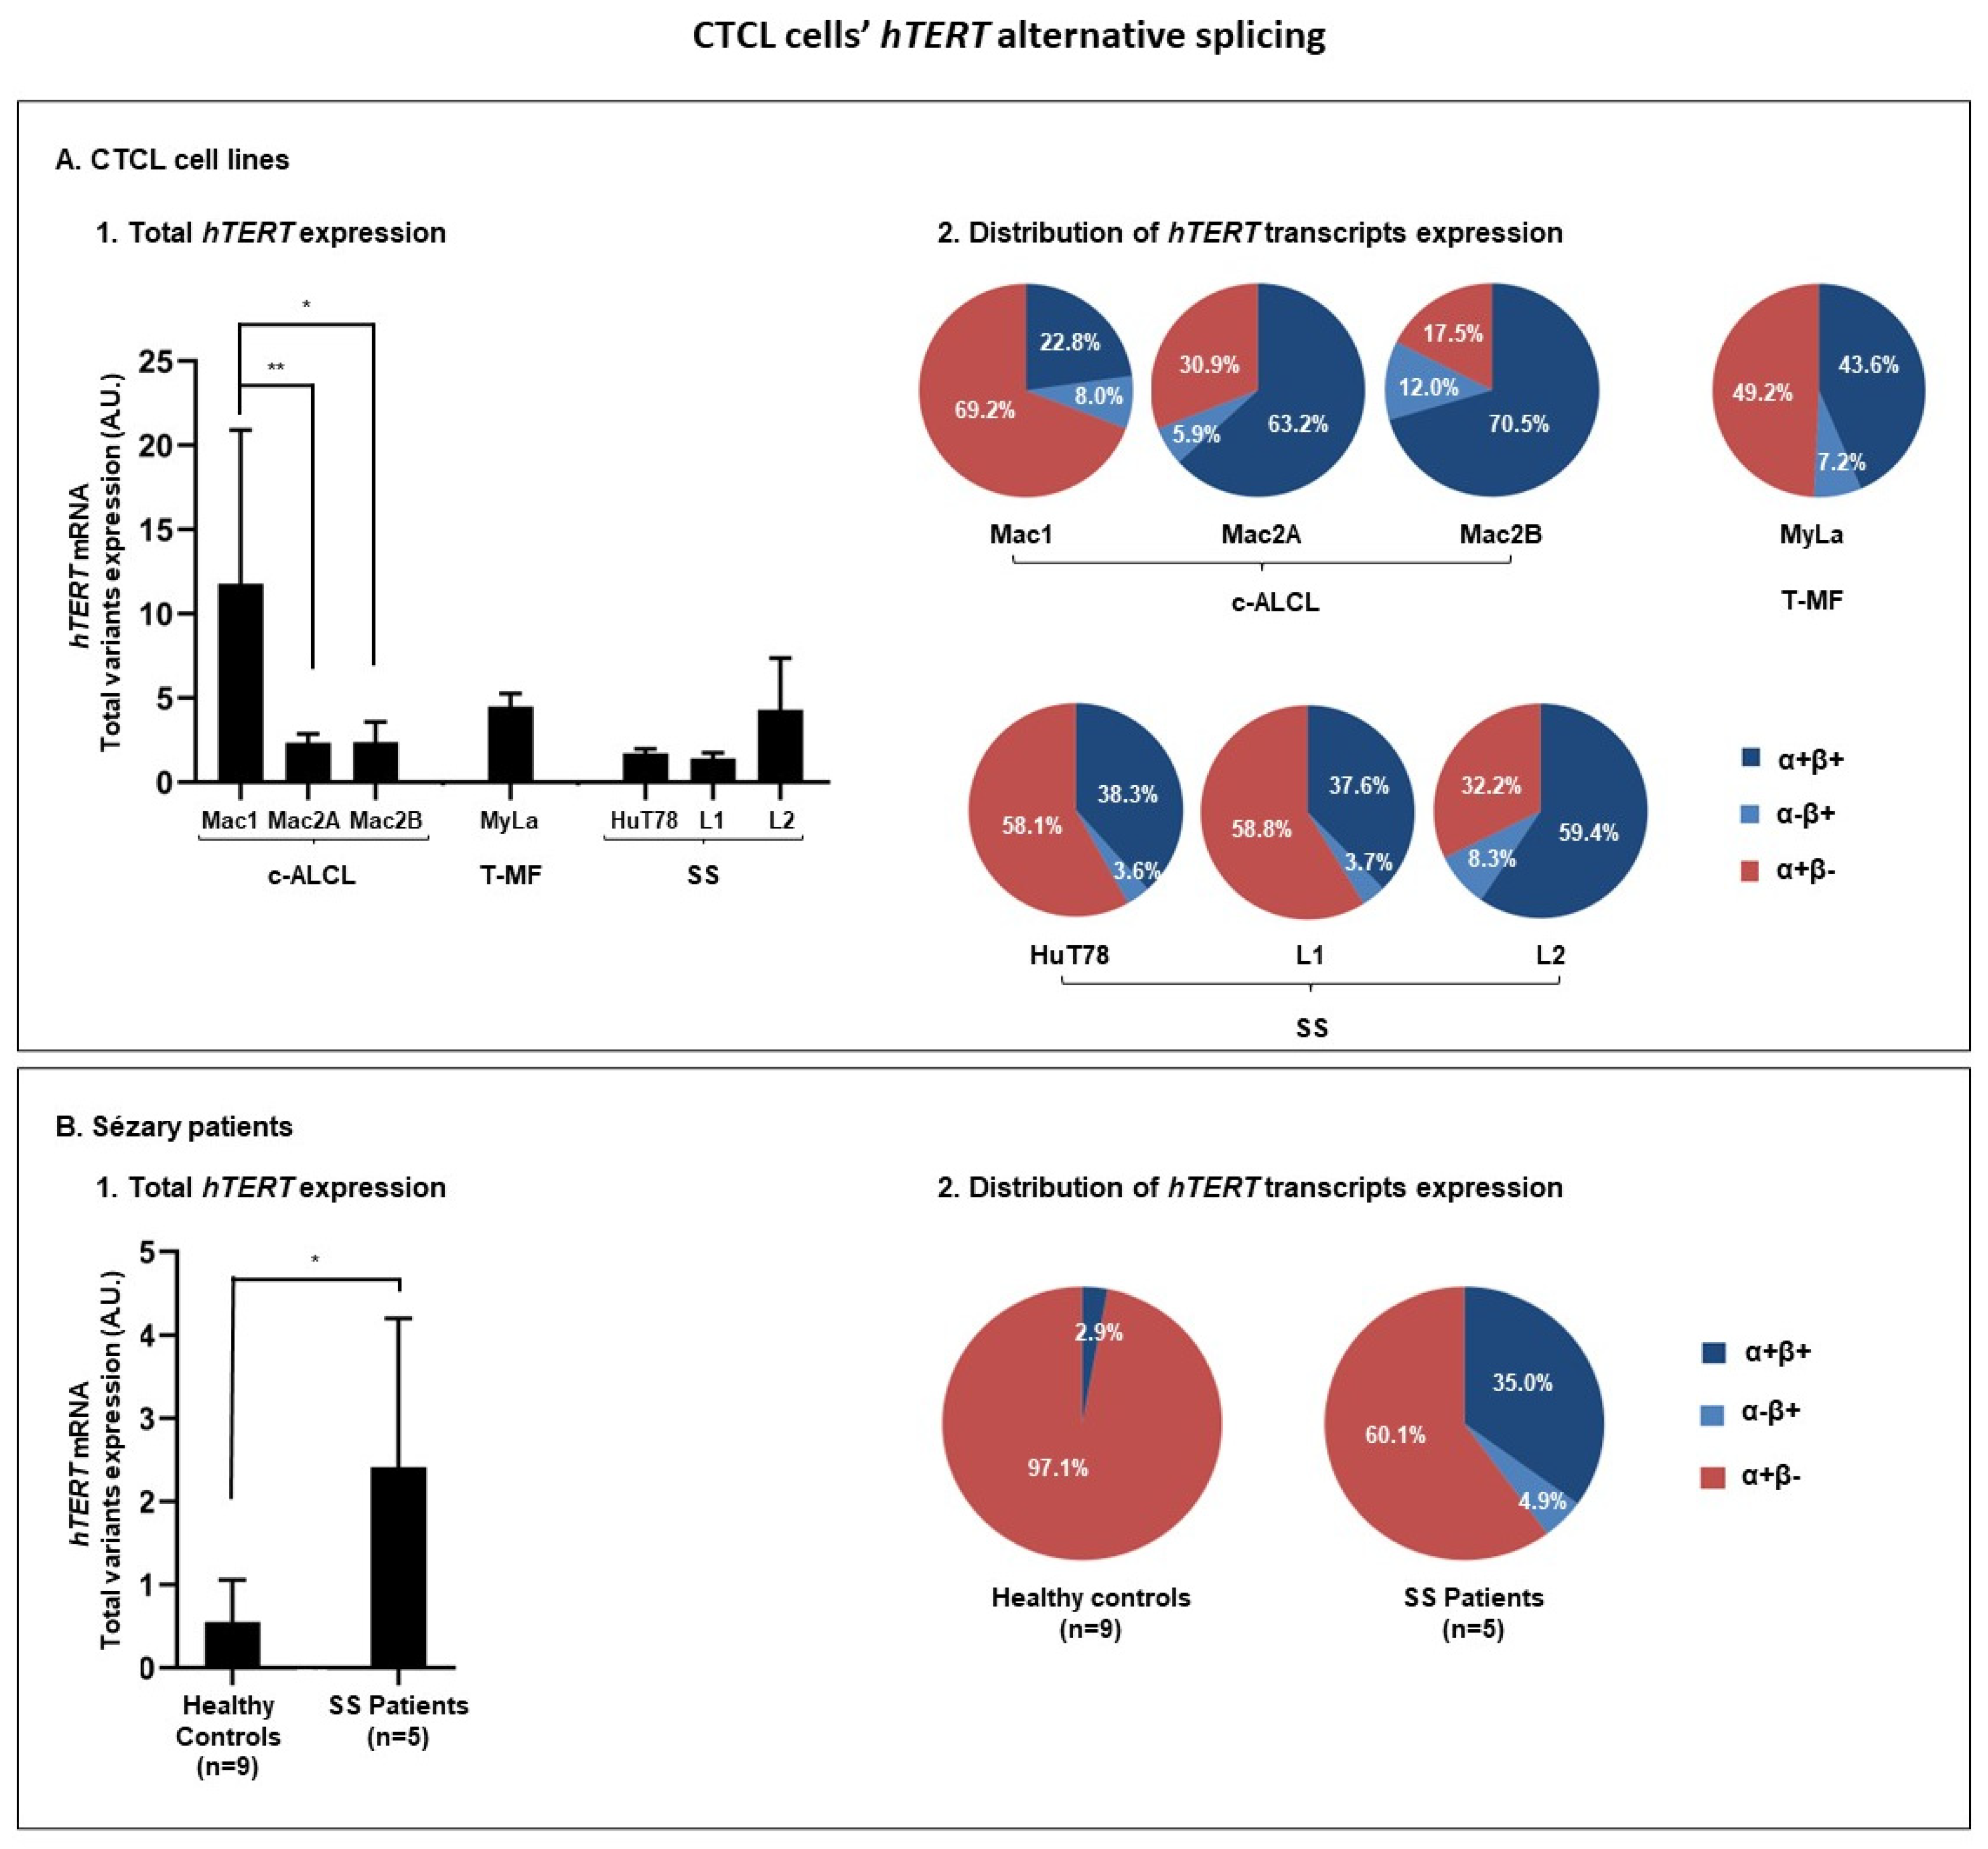
3.3.1. hTERT Is Subjected to Alternative Splicing in CTCL Cells

First, we studied the cell lines representative of the most common subtypes of CTCL: Mac1, Mac2A, and Mac2B for c-ALCL, MyLa for T-MF, and for SS HuT78, L1 and L2 (Figure 3A). Mac1, the only cell line with indolent behavior, was the cell line that expressed the highest levels of total hTERT variants (sum of α+β+, α−β+ and α+β−) (Figure 3A1).
The Mac2A and Mac2B cell lines were established from the same patient as Mac1, but during the aggressive terminal phase of the disease, and they express less total hTERT variants than Mac1 (Figure 3A1 and Table 3). Concordantly, Mac2A and Mac2B exhibited an hTERT transcripts distribution significantly different from Mac1 (Figure 3A2). Indeed, Mac2A and Mac2B presented a significant decrease in the α+β− variant, along with an important increase in the α+β+ variant, compared to Mac1 (Figure 3A2 and Table 3). MyLa, HuT78, L1, and L2, four aggressive CTCL cell lines, all expressed lower levels of total hTERT variants compared to the cell line with indolent behavior, Mac1 (Figure 3A1). Additionally, while comparing with Mac1 cells, the T-MF and SS cell lines presented a reduced α+β− variant expression, and an increased α+β+ variant expression. Interestingly, we did not detect any α−β− hTERT variant expression in all CTCL cell lines analyzed (Figure 3A2).
Then, we studied the hTERT splicing transcriptome in five SS patients compared to nine healthy donors used as the controls (Figure 3B). SS patients expressed significantly more total hTERT variants than the controls (Figure 3B1 and Table 3). Regarding the hTERT transcripts distribution, the healthy controls presented an almost exclusive expression of the hTERT α+β− variant (Figure 3B2 and Table 3). In contrast, SS patients presented a significative increase in the hTERT β+ variants proportion (α+β+ and α−β+) (p = 0.0126), mainly α+β+ (Figure 3B2 and Table 3). Indeed, compared to the healthy controls, the expression of the α+β− hTERT variant was significatively reduced in SS patients (p = 0.0290), while the expression of the α+β+ variant was increased (p = 0.2507) (Figure 3B2 and Table 3). Interestingly, the expression of the α−β+ variant was restricted to tumor cells (p = 0.0050) (Figure 3B2 and Table 3). The α−β− hTERT variant was neither detected in healthy controls nor in SS patient cells.

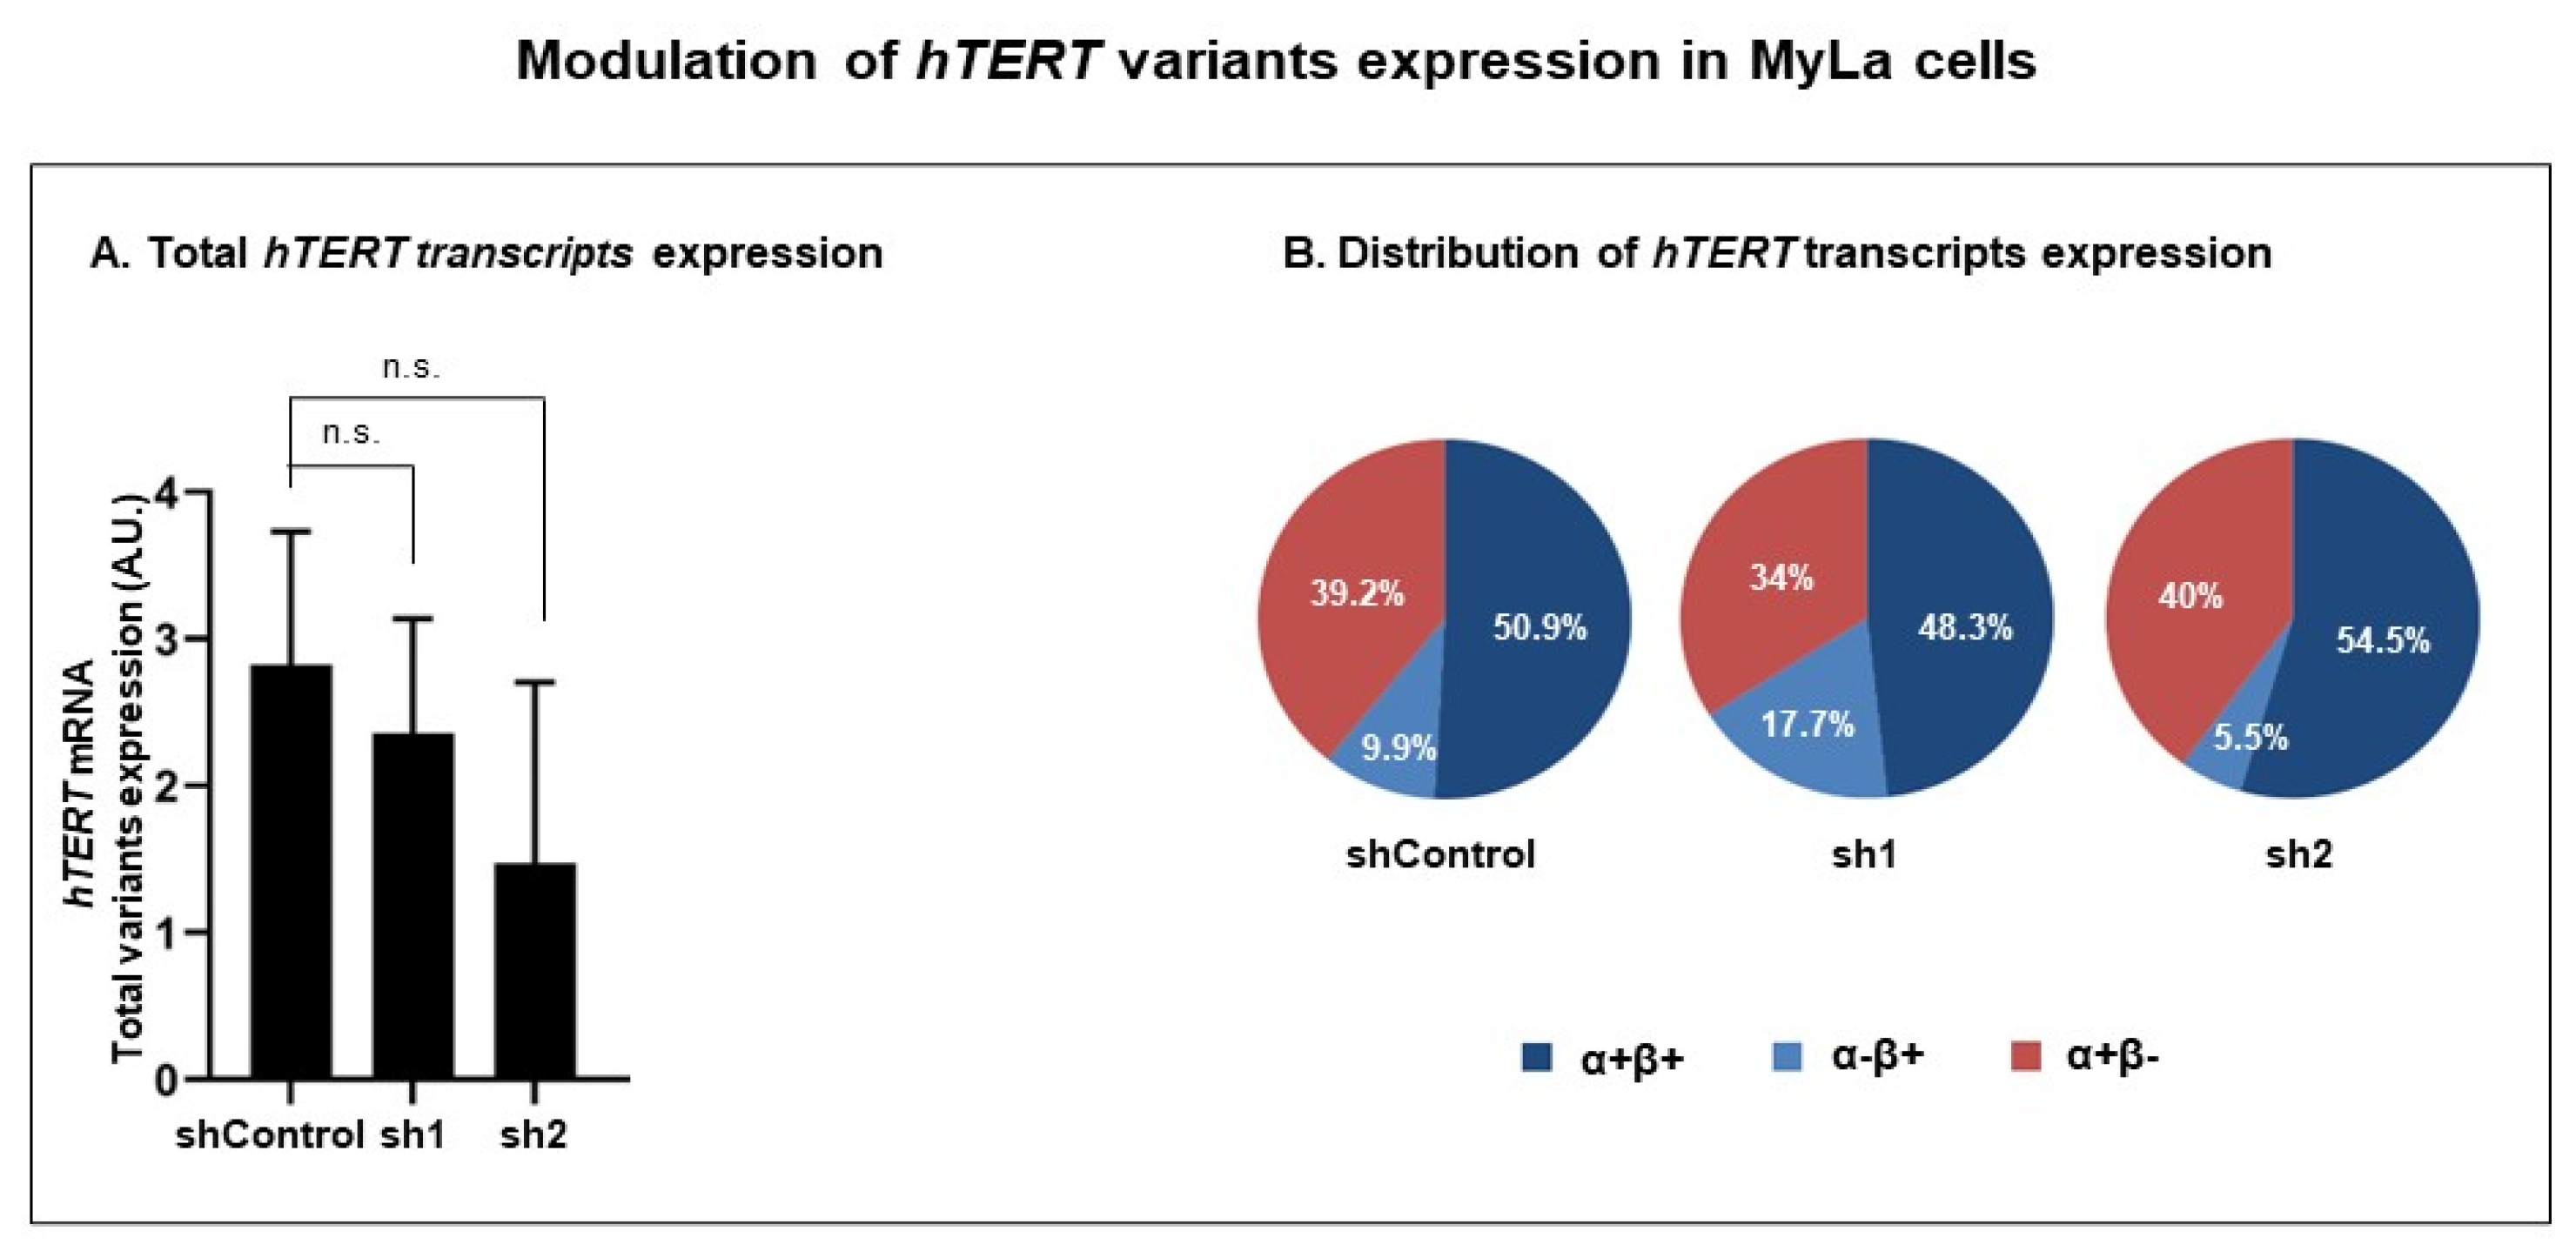
3.3.2. Modulation of RT Domain Transcriptome

As we found hTERT variants differently expressed in CTCL cells with indolent and aggressive behavior, we modulated the hTERT RT domain transcriptome in an aggressive cell line, with shRNAs targeting the hTERT β variants (Figure 4) in order to modulate the expression of the hTERT variants. We selected the MyLa cell line that consistently expresses both hTERT mRNA [46] and total hTERT variants (Figure 3A).
Although neither shRNA1 (sh1) nor shRNA2 (sh2) impacted significantly the total level of the hTERT variants (Figure 4A and Table 4), they induced a modulation of the hTERT transcripts distribution (Figure 4B and Table 4). The ShRNAs (sh1 and sh2) used neither impacted the expression of the α+β− transcript nor the expression of the full transcript, α+β+ (Figure 4B and Table 4). On the other hand, sh1 induced a significant increase in the expression of the α−β+ transcript (p = 0.0237), while sh2 induced a significant decrease in this transcript’s expression (p = 0.0003) (Figure 4B and Table 4).

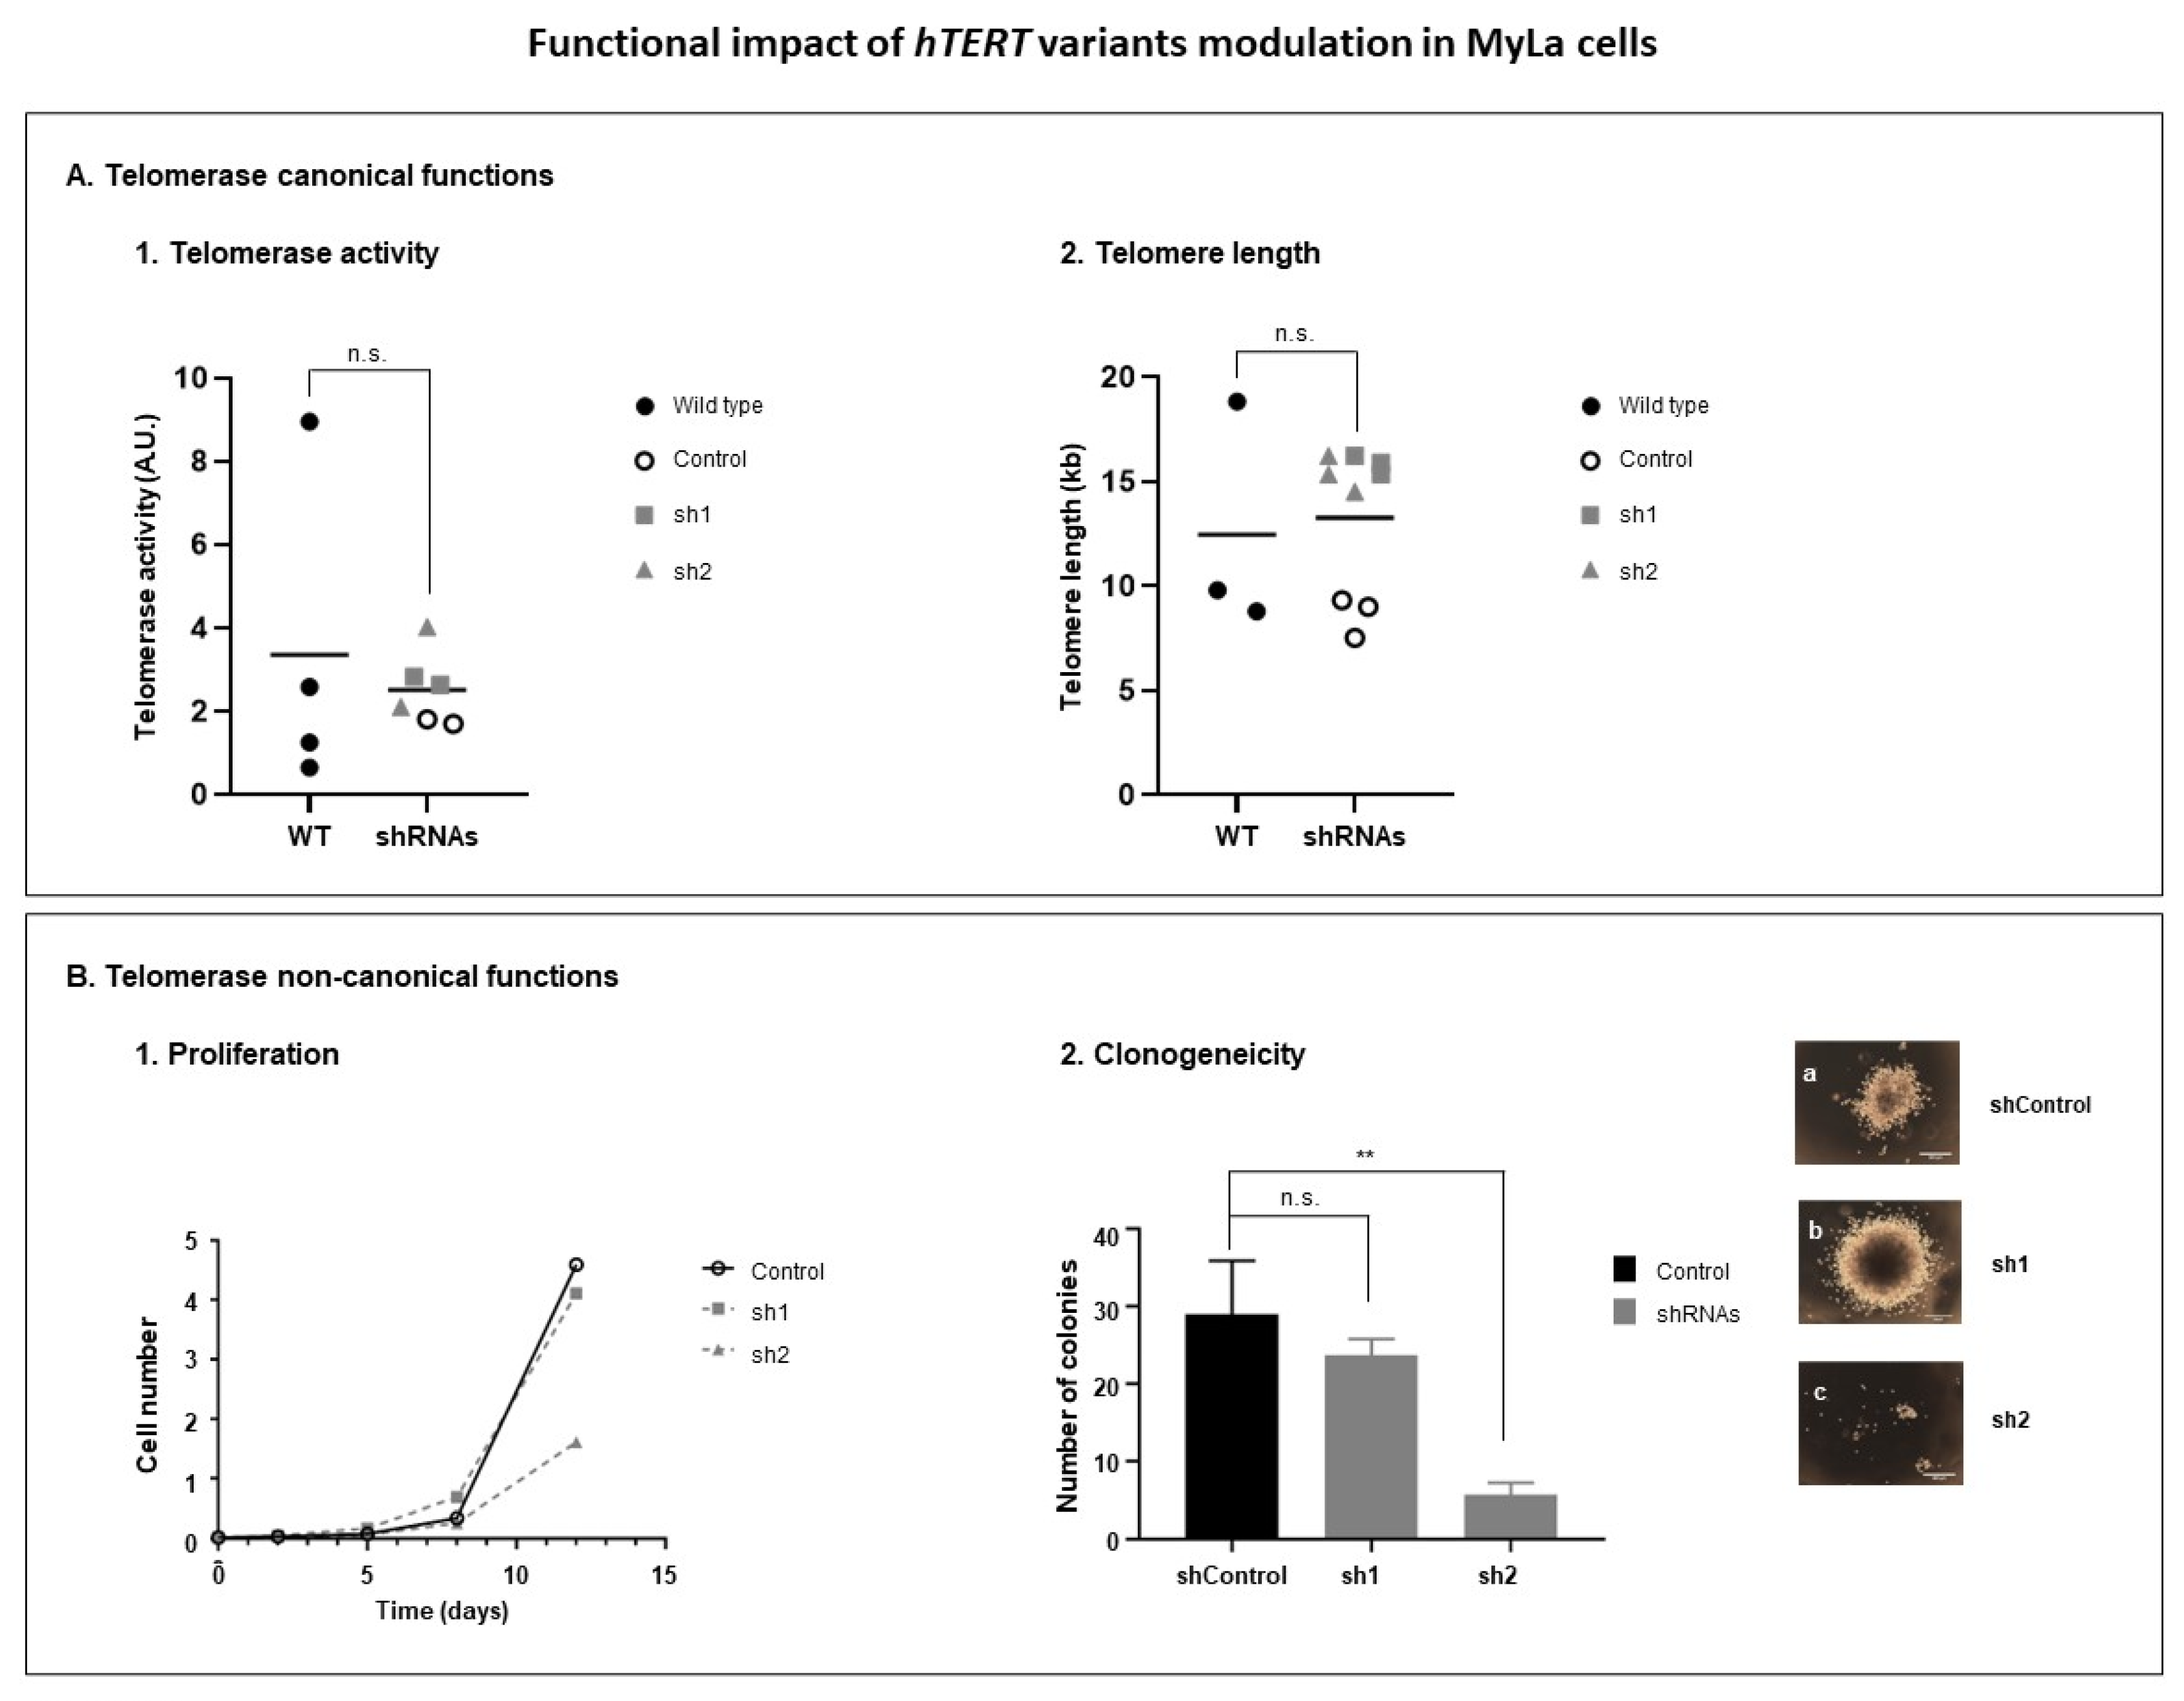
3.3.3. Modulation of hTERT Transcriptome Affects Telomerase Non-Canonical Functions

The functional impact of the hTERT transcriptome was evaluated on telomerase activities (Figure 5). The impact was first evaluated on the telomerase canonical functions, related with the telomere length. Thus, the telomerase activity and telomere length were evaluated in MyLa transduced cells compared with non-transduced cells (Wild type, WT) (Figure 5A). Concerning the telomerase activity, no impact was observed (p = 0.6095) (Figure 5A1). Concordantly, no impact was observed on the telomere length (p = 0.9727) (Figure 5A2). We then analyzed the impact of the hTERT transcriptome modulation on the telomerase non-canonical functions, focusing on the cell proliferation and cell clonogenic capacities (Figure 5B). On MyLa cells, sh1 induced no effect on the cell proliferative capacities, while on the cells transduced with sh2, we observed a strong decrease in the cell proliferative capacities (Figure 5B1). Concordantly, sh1 induced no effect on the cell clonogenic capacities (p = 0.2707), while sh2 significantly decreased the number of colonies formed by MyLa cells (p = 0.0047) (Figure 5B2).

4. Discussion

As a major hallmark in cancer, telomerase has been extensively investigated in order to understand its contribution in cancer, with the hope that it could potentially be targeted for cancer treatment [51,52]. This is particularly relevant in CTCL, a group of malignancies known to be telomerase-positive [46]. However, little is known about the molecular basis of the hTERT transcriptional activation and regulation in CTCL, which can be potentially useful for diagnostic, prognostic, and therapeutic purposes.
Genome-wide association studies (GWAS) of cancer etiology have identified variants in the hTERT gene that can impact the outcome of numerous subtypes of cancers. Such information paved the way to understand the associations between common genetic variants and human diseases or specific phenotypes [27,53]. Based on our results, CTCL can be added to the list of cancers to which hTERT single nucleotide polymorphisms (SNPs) are associated with disease risk. hTERT SNPs do not generate deleterious coding alleles; instead, they are reportedly associated with the telomere length [28,29,30,31,32,33]. Advanced stage CTCL present telomere length deregulation, which is a coherent argument to find hTERT SNPs associated with disease risk [46]. Additionally, hTERT promoter SNPs can influence the gene expression by altering the promoter transcription activity [27,53]. Thus, our data are in favor of a potential role for hTERT SNP rs2735940 T>C in influencing the hTERT expression. More studies are needed in order to establish this correlation and investigate the role of rs2735940 T>C in CTCL clinical development.
Previous investigation revealed that copy number alteration/rearrangements of the hTERT locus are not involved in the telomerase activation in CTCL [46]. On the other hand, the occurrence of somatic mutations within the hTERT promoter, a recurring event described in several cancers, has never been investigated in CTCL cells [54]. Our results revealed that these hotspot mutations are rare in CTCL. Surprisingly, when detected, hTERT promoter mutation occurred at only one position (−146 bp from the ATG start site), and it was restricted to aggressive CTCL subtypes. Knowing that CTCL tumors are classified among hematologic malignancies, our results are in concordance with what is already published regarding the statement that somatic hTERT promoter mutations are rare in hematologic cancers [15,55,56].
Aside the telomerase canonical function on the telomere elongation, telomerase also exhibits other non-canonical functions largely implicated in the initiation and progression of cancer [46,57]. The pre-mRNA alternative splicing of hTERT is one of the mechanisms that, despite regulating the telomerase activity, may also play a role in other cellular functions [11,18]. Herein, we reported, for the first time, that hTERT is subjected to alternative splicing in CTCL cells. Focusing the analysis of the hTERT expression on the expression of hTERT α and β variants, we could discriminate between indolent and aggressive CTCL subtypes, and we could also observe that the distribution of hTERT transcripts in Sézary patients is substantially different from the healthy controls. It is worth mentioning the great diversity in the distribution of the hTERT transcripts in Sézary patients (Supplementary Figure S3), corroborating that the genetics of Sézary syndrome are diverse and complex [58,59,60]. Nevertheless, on the one hand, we observed an increase in the proportion of hTERT β+ variants (α+β+ and α−β+) in CTCL cells compared to the healthy controls. On the other hand, advanced tumor-stage CTCL cells presented a significant decrease in the α+β− expression, the most abundant hTERT transcript in healthy T lymphocytes and indolent tumor cells. Interestingly, the α−β+ transcript was exclusively observed in CTCL cells. Thus, we hypothesize that the increase in the hTERT β+ variants (α+β+ and α−β+) may be associated with disease development and progression. We believe that the sh1 construction did not produce reliable results; consequently, we focused on the results produced by the sh2 construction. Therefore, based on the functional impact of the hTERT transcriptome modulation that we observed with sh2, the α−β+ hTERT variant in particular, we suggest that α−β+ might play an important role in CTCL cells. Indeed, when we achieved to decrease its expression, we observed a significant decrease in the cell proliferation and clonogenic capacities. The need for tissue and tumor-specific TERT isoform investigations was clearly stated [61], and our work reinforced this statement and confirmed that further investigations are needed to corroborate and strengthen our findings.
Recently, it was demonstrated that regulatory T-cells may suppress the proliferation of target human and murine T- and B-lymphocytes, and also NK cells, in a contact-independent manner, involving the activation of TERT alternative splicing [11]. Additionally, there are several pharmacological drugs that can modulate hTERT alternative splicing, and they are being evaluated as anti-cancer therapies [62]. The small-molecule ligand 12459 and compound CX-5461 were reported to downregulate the telomerase activity by altering the hTERT splicing patterns in lung carcinoma and glioblastoma cell lines, respectively [63,64]. The currently available therapies in CTCL are reported to control the disease; meanwhile, the only curative option is stem cell transplantation [65]. According to the findings reported here, CTCL may be considered as good candidates to test, in vitro as a first step, the efficacy of hTERT alternative splicing modulating drugs. This study provides an insight regarding hTERT contribution in CTCL lymphomagenesis. It identifies a possible genetic predisposition to CTCL based on the hTERT genetic variants and excludes the hTERT promoter mutations as a relevant mechanism in the telomerase reactivation in CTCL. Furthermore, this study provides the first insight into the hTERT transcript pattern in different CTCL subtypes and provides a glance at the impact of the α−β+ hTERT variant on cancer cells’ proliferation and tumorigenic capacities, in vitro. Altogether, our results enhance our knowledge regarding the telomerase implication in CTCL and provide new insights into its potential therapeutic targeting in this pathology.

Supplementary Materials

The following supporting information can be downloaded at: https://www.mdpi.com/article/10.3390/genes14020439/s1: Table S1. Primer sequences (5′ to 3′) and annealing temperature used for hTERT gene investigations: promoter mutations screening, SNPs genotyping, mRNA splicing variants expression. Table S2. Primer sequences (5′ to 3′) used for lentiviral short hairpin (sh) RNA vector cloning. Table S3. Genotyping results of rs2735940 T>C, rs2853669 T>C, rs2853672 G>T, rs2853676 G>A and rs10069690 C>T hTERT polymorphisms in CTCL cell lines. Figure S1. hTERT alternative splicing of 1301 cell line. Figure S2. Maps of pLKO.1 vectors used to insert hTERT β shRNA inserts. Figure S3. Sézary patient’s distribution of hTERT transcripts expression.

Author Contributions

J.R. performed the experiments and collected data helped by M.P.-C. and S.P. for cell culture and flow cytometry analysis; R.B., A.P. and J.V. for hTERT promoter mutations and SNP. analysis; J.F., A.C. and Y.I. for lentiviral construction and TRAP assay. D.C. contributed to primers design. M.B.-B., J.-P.M., M.S.-S., J.C. and M.A.C. contributed to patient recruitment and selection. C.D., L.A.-M. and P.B. did the SNP statistical analysis. J.R., M.P.-C., J.-P.M., M.S.-S., P.S. and E.C. analyzed and interpreted the data. E.C. and P.S. directed the study, obtained financial support and assisted in study design. J.R., A.C., P.S. and E.C. prepared and wrote the manuscript. J.-P.M., M.S.-S., P.S. and E.C. edited. All authors have read and agreed to the published version of the manuscript.

Funding

J.R. received funding from Programme Hubert Curien PESSOA, Programme d’Actions Universitaires Intégrées Luso-Françaises (PAUILF) and ERASMUS+. FCT (Fundação para a Ciência e a Tecnologia/Ministério da Ciência, Tecnologia e Ensino Superior) supported a PhD grant to RP (SFRH/BD/111321/2015) and AP (SFRH/BD/110617/2015). AC was supported by grants from Programme Hubert Curien CEDRE and ERASMUS+. This work was sponsored by grants from French Society of Dermatology (SFD), Ligue Contre le Cancer Comité Dordogne and foundation for cancer research (ARC). This article is partly supported by the project “Cancer Research on Therapy Resistance: From Basic Mechanisms to Novel Targets”—NORTE-01-0145-FEDER-000051, supported by Norte Portugal Regional Operational Programme (NORTE 2020), under the PORTUGAL 2020 Partnership Agreement, through the European Regional Development Fund (ERDF). Further funding (in part) by Programa Operacional Regional do Norte and co-funded by European Regional Development Fund under the project “The Porto Comprehensive Cancer Center” with the reference NORTE-01-0145-FEDER-072678—Consórcio PORTO.CCC—Porto.Comprehensive Cancer Center Raquel Seruca.

Acknowledgments

The authors thank Vect’UB, vectorology platform and UB’Facsility, cytometry platform (INSERM US 005—CNRS UMS 3427- TBM-Core, Bordeaux University, France) staffs, especially V. Guyonnet-Dupérat and A. Zouine. The authors also would like to thank the staff of Etablissement Français du Sang Bordeaux (France), especially JF Simoes.

Conflicts of Interest

The authors declare no conflict of interest.

References

  1. Hinds, P.; Pietruska, J.J.F. Senescence and tumor suppression. F1000Research 2017, 6, 2121. [Google Scholar] [CrossRef] [PubMed]
  2. Gaspar, T.B.; Sá, A.; Lopes, J.M.; Sobrinho-Simões, M.; Soares, P.; Vinagre, J. Telomere maintenance mechanisms in cancer. Genes 2018, 9, 241. [Google Scholar] [CrossRef] [PubMed]
  3. Blackburn, E.H.; Collins, K. Telomerase: An RNP enzyme synthesizes DNA. Cold Spring Harb. Perspect. Biol. 2011, 3, a003558. [Google Scholar] [CrossRef] [PubMed]
  4. Liu, Y.; Snow, B.; Hande, M.; Yeung, D.; Erdmann, N.; Wakeham, A.; Itie, A.; Siderovski, D.; Lansdorp, P.; Robinson, M. The telomerase reverse transcriptase is limiting and necessary for telomerase function in vivo. Curr. Biol. 2000, 10, 1459–1462. [Google Scholar] [CrossRef] [PubMed]
  5. Penna, G.C.; Pestana, A.; Cameselle, J.M.; Momesso, D.; de Andrade, F.A.; Vidal, A.P.A.; Junior, M.L.A.; Melo, M.; Fernandes, P.V.; Corbo, R. TERTp mutation is associated with a shorter progression free survival in patients with aggressive histology subtypes of follicular-cell derived thyroid carcinoma. Endocrine 2018, 61, 489–498. [Google Scholar] [PubMed]
  6. Low, K.C.; Tergaonkar, V. Telomerase: Central regulator of all of the hallmarks of cancer. Trends Biochem. Sci. 2013, 38, 426–434. [Google Scholar]
  7. Ding, D.; Zhou, J.; Wang, M.; Cong, Y.S. Implications of telomere-independent activities of telomerase reverse transcriptase in human cancer. FEBS J. 2013, 280, 3205–3211. [Google Scholar]
  8. Pestana, A.; Vinagre, J.; Sobrinho-Simões, M.; Soares, P. TERT biology and function in cancer: Beyond immortalisation. J. Mol. Endocrinol. 2017, 58, R129–R146. [Google Scholar] [CrossRef]
  9. Leão, R.; Apolónio, J.D.; Lee, D.; Figueiredo, A.; Tabori, U.; Castelo-Branco, P. Mechanisms of human telomerase reverse transcriptase (hTERT) regulation: Clinical impacts in cancer. J. Biomed. Sci. 2018, 25, 22. [Google Scholar]
  10. Gladych, M.; Wojtyla, A.; Rubis, B. Human telomerase expression regulation. Biochem. Cell Biol. 2011, 89, 359–376. [Google Scholar]
  11. Plyasova, A.A.; Zhdanov, D.D. Alternative Splicing of Human Telomerase Reverse Transcriptase (hTERT) and Its Implications in Physiological and Pathological Processes. Biomedicines 2021, 9, 526. [Google Scholar] [CrossRef] [PubMed]
  12. Horn, S.; Figl, A.; Rachakonda, P.S.; Fischer, C.; Sucker, A.; Gast, A.; Kadel, S.; Moll, I.; Nagore, E.; Hemminki, K. TERT promoter mutations in familial and sporadic melanoma. Science 2013, 339, 959–961. [Google Scholar] [PubMed]
  13. Huang, F.W.; Hodis, E.; Xu, M.J.; Kryukov, G.V.; Chin, L.; Garraway, L.A. Highly recurrent TERT promoter mutations in human melanoma. Science 2013, 339, 957–959. [Google Scholar] [PubMed]
  14. Heidenreich, B.; Rachakonda, P.S.; Hemminki, K.; Kumar, R. TERT promoter mutations in cancer development. Curr. Opin. Genet. Dev. 2014, 24, 30–37. [Google Scholar] [PubMed]
  15. Vinagre, J.; Almeida, A.; Pópulo, H.; Batista, R.; Lyra, J.; Pinto, V.; Coelho, R.; Celestino, R.; Prazeres, H.; Lima, L. Frequency of TERT promoter mutations in human cancers. Nat. Commun. 2013, 4, 2185. [Google Scholar]
  16. Bournaud, C.; Descotes, F.; Decaussin-Petrucci, M.; Berthiller, J.; de la Fouchardière, C.; Giraudet, A.-L.; Bertholon-Gregoire, M.; Robinson, P.; Lifante, J.-C.; Lopez, J.; et al. TERT promoter mutations identify a high-risk group in metastasis-free advanced thyroid carcinoma. Eur. J. Cancer 2019, 108, 41–49. [Google Scholar] [PubMed]
  17. Ulaner, G.A.; Hu, J.F.; Vu, T.H.; Giudice, L.C.; Hoffman, A.R. Tissue-specific alternate splicing of human telomerase reverse transcriptase (hTERT) influences telomere lengths during human development. Int. J. Cancer 2001, 91, 644–649. [Google Scholar] [CrossRef]
  18. Liu, X.; Wang, Y.; Chang, G.; Wang, F.; Wang, F.; Geng, X. Alternative splicing of hTERT Pre-mRNA: A potential strategy for the regulation of telomerase activity. Int. J. Mol. Sci. 2017, 18, 567. [Google Scholar] [CrossRef]
  19. Yi, X.; Shay, J.W.; Wright, W.E. Quantitation of telomerase components and hTERT mRNA splicing patterns in immortal human cells. Nucleic Acids Res. 2001, 29, 4818–4825. [Google Scholar]
  20. Lincz, L.F.; Mudge, L.-M.; Scorgie, F.E.; Sakoff, J.A.; Hamilton, C.S.; Seldon, M. Quantification of hTERT splice variants in melanoma by SYBR green real-time polymerase chain reaction indicates a negative regulatory role for the β deletion variant. Neoplasia 2008, 10, 1131. [Google Scholar]
  21. Zhdanov, D.; Vasina, D.; Orlova, V.; Gotovtseva, V.; Bibikova, M.; Pokrovsky, V.; Pokrovskayaa, M.; Aleksandrova, S.; Sokolov, N. Apoptotic endonuclease EndoG induces alternative splicing of telomerase catalytic subunit hTERT and death of tumor cells. Biochem. Suppl. Ser. B Biomed. Chem. 2016, 10, 310–321. [Google Scholar]
  22. Yi, X.; White, D.M.; Aisner, D.L.; Baur, J.A.; Wright, W.E.; Shay, J.W. An alternate splicing variant of the human telomerase catalytic subunit inhibits telomerase activity. Neoplasia 2000, 2, 433–440. [Google Scholar] [CrossRef] [PubMed]
  23. Sæbøe-Larssen, S.; Fossberg, E.; Gaudernack, G. Characterization of novel alternative splicing sites in human telomerase reverse transcriptase (hTERT): Analysis of expression and mutual correlation in mRNA isoforms from normal and tumour tissues. BMC Mol. Biol. 2006, 7, 26. [Google Scholar] [CrossRef] [PubMed]
  24. Colgin, L.M.; Wilkinson, C.; Englezou, A.; Kilian, A.; Robinson, M.O.; Redder, R.R. The hTERTα splice variant is a dominant negative inhibitor of telomerase activity. Neoplasia 2000, 2, 426. [Google Scholar] [PubMed]
  25. Listerman, I.; Sun, J.; Gazzaniga, F.S.; Lukas, J.L.; Blackburn, E.H. The major reverse transcriptase–incompetent splice variant of the human telomerase protein inhibits telomerase activity but protects from apoptosis. Cancer Res. 2013, 73, 2817–2828. [Google Scholar] [CrossRef] [PubMed]
  26. Jie, M.-M.; Chang, X.; Zeng, S.; Liu, C.; Liao, G.-B.; Wu, Y.-R.; Liu, C.-H.; Hu, C.-J.; Yang, S.-M.; Li, X.-Z. Diverse regulatory manners of human telomerase reverse transcriptase. Cell Commun. Signal. 2019, 17, 63. [Google Scholar] [PubMed]
  27. Baird, D.M. Variation at the TERT locus and predisposition for cancer. Expert Rev. Mol. Med. 2010, 12, e16. [Google Scholar]
  28. Yang, H.; Li, J.; Tang, R.; Liu, Y.; Shao, Y.; Huang, Q.; Shi, J. Telomere reverse transcriptase (TERT) rs2735940 increases cancer risk. Med. Sci. Monit. Int. Med. J. Exp. Clin. Res. 2015, 21, 612. [Google Scholar]
  29. Matsubara, Y.; Murata, M.; Yoshida, T.; Watanabe, K.; Saito, I.; Miyaki, K.; Omae, K.; Ikeda, Y. Telomere length of normal leukocytes is affected by a functional polymorphism of hTERT. Biochem. Biophys. Res. Commun. 2006, 341, 128–131. [Google Scholar]
  30. Shen, N.; Lu, Y.; Wang, X.; Peng, J.; Zhu, Y.; Cheng, L. Association between rs2853669 in TERT gene and the risk and prognosis of human cancer: A systematic review and meta-analysis. Oncotarget 2017, 8, 50864. [Google Scholar] [CrossRef]
  31. Liu, Z.; Wang, T.; Wu, Z.; Zhang, K.; Li, W.; Yang, J.; Chen, C.; Chen, L.; Xing, J. Association between TERT rs2853669 polymorphism and cancer risk: A meta-analysis of 9,157 cases and 11,073 controls. PLoS ONE 2018, 13, e0191560. [Google Scholar] [CrossRef] [PubMed] [Green Version]
  32. Gao, L.; Thakur, A.; Liang, Y.; Zhang, S.; Wang, T.; Chen, T.; Meng, J.; Wang, L.; Wu, F.; Jin, T. Polymorphisms in the TERT gene are associated with lung cancer risk in the Chinese Han population. Eur. J. Cancer Prev. 2014, 23, 497–501. [Google Scholar] [CrossRef] [PubMed]
  33. Cao, J.-L.; Yuan, P.; Abuduwufuer, A.; Lv, W.; Yang, Y.-H.; Hu, J. Association between the TERT genetic polymorphism rs2853676 and cancer risk: Meta-analysis of 76 108 cases and 134 215 controls. PLoS ONE 2015, 10, e0128829. [Google Scholar] [CrossRef]
  34. Matsubara, Y.; Murata, M.; Watanabe, K.; Saito, I.; Miyaki, K.; Omae, K.; Ishikawa, M.; Matsushita, K.; Iwanaga, S.; Ogawa, S. Coronary artery disease and a functional polymorphism of hTERT. Biochem. Biophys. Res. Commun. 2006, 348, 669–672. [Google Scholar] [CrossRef]
  35. Batista, R.; Cruvinel-Carloni, A.; Vinagre, J.; Peixoto, J.; Catarino, T.A.; Campanella, N.C.; Becker, A.P.; de Almeida, G.C.; Matsushita, M.M.; Clara, C.; et al. The prognostic impact of TERT promoter mutations in glioblastomas is modified by the rs2853669 single nucleotide polymorphism. Int. J. Cancer 2016, 139, 414–423. [Google Scholar] [CrossRef] [PubMed]
  36. Helbig, S.; Wockner, L.; Bouendeu, A.; Hille-Betz, U.; McCue, K.; French, J.D.; Edwards, S.L.; Pickett, H.A.; Reddel, R.R.; Chenevix-Trench, G.; et al. Functional dissection of breast cancer risk-associated TERT promoter variants. Oncotarget 2017, 8, 67203. [Google Scholar]
  37. Willemze, R.; Cerroni, L.; Kempf, W.; Berti, E.; Facchetti, F.; Swerdlow, S.H.; Jaffe, E.S. The 2018 update of the WHO-EORTC classification for primary cutaneous lymphomas. Blood J. Am. Soc. Hematol. 2019, 133, 1703–1714. [Google Scholar]
  38. Kamijo, H.; Miyagaki, T. Mycosis fungoides and Sézary syndrome: Updates and review of current therapy. Curr. Treat. Options Oncol. 2021, 22, 10. [Google Scholar] [CrossRef]
  39. Sethi, T.K.; Montanari, F.; Foss, F.; Reddy, N. How we treat advanced stage cutaneous T-cell lymphoma–mycosis fungoides and Sézary syndrome. Br. J. Haematol. 2021, 195, 352–364. [Google Scholar]
  40. Vural, S.; Akay, B.N.; Botsalı, A.; Atilla, E.; Parlak, N.; Heper, A.O.; Şanlı, H. Transformation of mycosis fungoides/Sezary syndrome: Clinical characteristics and prognosis. Turk. J. Hematol. 2018, 35, 35. [Google Scholar]
  41. Cristofoletti, C.; Narducci, M.G.; Russo, G.J.C.C.O. Sézary Syndrome, recent biomarkers and new drugs. Chin Clin Oncol 2019, 8, 2. [Google Scholar] [CrossRef] [PubMed]
  42. García-Díaz, N.; Piris, M.Á.; Ortiz-Romero, P.L.; Vaqué, J.P. Mycosis fungoides and sézary syndrome: An integrative review of the pathophysiology, molecular drivers, and targeted therapy. Cancers 2021, 13, 1931. [Google Scholar]
  43. Kempf, W.; Torricelli, R.; Zettl, A.; Zimmermann, A.-K.; Berisha, A.; Ghielmini, M. Primary Cutaneous Anaplastic Lymphoma Kinase–Positive Large B-Cell Lymphoma. Am. J. Dermatopathol. 2019, 41, 602–605. [Google Scholar] [PubMed]
  44. Wang, L.; Xiao, H.; Zhang, X.; Wang, C.; Huang, H. The role of telomeres and telomerase in hematologic malignancies and hematopoietic stem cell transplantation. J. Hematol. Oncol. 2014, 7, 61. [Google Scholar]
  45. Ropio, J.; Merlio, J.-P.; Soares, P.; Chevret, E. Telomerase activation in hematological malignancies. Genes 2016, 7, 61. [Google Scholar]
  46. Chevret, E.; Andrique, L.; Prochazkova-Carlotti, M.; Ferrer, J.; Cappellen, D.; Laharanne, E.; Idrissi, Y.; Boettiger, A.; Sahraoui, W.; Ruiz, F.; et al. Telomerase functions beyond telomere maintenance in primary cutaneous T-cell lymphoma. Blood J. Am. Soc. Hematol. 2014, 123, 1850–1859. [Google Scholar] [CrossRef] [PubMed]
  47. Poglio, S.; Prochazkova-Carlotti, M.; Cherrier, F.; Gros, A.; Laharanne, E.; Pham-Ledard, A.; Beylot-Barry, M.; Merlio, J.-P. Xenograft and cell culture models of Sézary syndrome reveal cell of origin diversity and subclonal heterogeneity. Leukemia 2021, 35, 1696–1709. [Google Scholar] [CrossRef] [PubMed]
  48. Ropio, J.; Chebly, A.; Ferrer, J.; Prochazkova-Carlotti, M.; Idrissi, Y.; Azzi-Martin, L.; Cappellen, D.; Pham-Ledard, A.; Soares, P.; Merlio, J.P.; et al. Reliable blood cancer cells’ telomere length evaluation by qPCR. Cancer Med. 2020, 9, 3153–3162. [Google Scholar] [CrossRef] [Green Version]
  49. Chebly, A.; Ropio, J.; Peloponese, J.M.; Poglio, S.; Prochazkova-Carlotti, M.; Cherrier, F.; Ferrer, J.; Idrissi, Y.; Segal-Bendirdjian, E.; Chouery, E.; et al. Exploring hTERT promoter methylation in cutaneous T-cell lymphomas. Mol. Oncol. 2021, 16, 1931–1946. [Google Scholar]
  50. Chebly, A.; Prochazkova-Carlotti, M.; Idrissi, Y.; Bresson-Bepoldin, L.; Poglio, S.; Farra, C.; Beylot-Barry, M.; Merlio, J.-P.; Tomb, R.; Chevret, E. Targeting Epigenetic Modifiers Can Reduce the Clonogenic Capacities of Sézary Cells. Front. Oncol. 2021, 11, 775253. [Google Scholar]
  51. Jafri, M.A.; Ansari, S.A.; Alqahtani, M.H.; Shay, J.W. Roles of telomeres and telomerase in cancer, and advances in telomerase-targeted therapies. Genome Med. 2016, 8, 69. [Google Scholar] [CrossRef]
  52. Allegra, A.; Innao, V.; Penna, G.; Gerace, D.; Allegra, A.G.; Musolino, C. Telomerase and telomere biology in hematological diseases: A new therapeutic target. Leuk. Res. 2017, 56, 60–74. [Google Scholar]
  53. Mocellin, S.; Verdi, D.; Pooley, K.A.; Landi, M.T.; Egan, K.M.; Baird, D.M.; Prescott, J.; De Vivo, I.; Nitti, D. Telomerase reverse transcriptase locus polymorphisms and cancer risk: A field synopsis and meta-analysis. J. Natl. Cancer Inst. 2012, 104, 840–854. [Google Scholar]
  54. Heidenreich, B.; Kumar, R. TERT promoter mutations in telomere biology. Mutat. Res./Rev. Mutat. Res. 2017, 771, 15–31. [Google Scholar]
  55. Mosrati, M.A.; Malmström, A.; Lysiak, M.; Krysztofiak, A.; Hallbeck, M.; Milos, P.; Hallbeck, A.-L.; Bratthäll, C.; Strandéus, M.; Stenmark-Askmalm, M.; et al. TERT promoter mutations and polymorphisms as prognostic factors in primary glioblastoma. Oncotarget 2015, 6, 16663. [Google Scholar]
  56. Yan, S.; Han, B.; Wu, Y.; Zhou, D.; Zhao, Y. Telomerase gene mutation screening and telomere overhang detection in Chinese patients with acute myeloid leukemia. Leuk. Lymphoma 2013, 54, 1437–1441. [Google Scholar] [CrossRef]
  57. Liu, H.; Liu, Q.; Ge, Y.; Zhao, Q.; Zheng, X.; Zhao, Y. hTERT promotes cell adhesion and migration independent of telomerase activity. Sci. Rep. 2016, 6, 22886. [Google Scholar] [CrossRef]
  58. Chevret, E.; Merlio, J.-P. Sézary syndrome: Translating genetic diversity into personalized medicine. J. Investig. Dermatol. 2016, 136, 1319–1324. [Google Scholar] [CrossRef]
  59. Herrera, A.; Cheng, A.; Mimitou, E.P.; Seffens, A.; George, D.; Bar-Natan, M.; Heguy, A.; Ruggles, K.V.; Scher, J.U.; Hymes, K.; et al. Multimodal single-cell analysis of cutaneous T-cell lymphoma reveals distinct subclonal tissue-dependent signatures. Blood J. Am. Soc. Hematol. 2021, 138, 1456–1464. [Google Scholar]
  60. Najidh, S.; Tensen, C.P.; van der Sluijs-Gelling, A.J.; Teodosio, C.; Cats, D.; Mei, H.; Kuipers, T.B.; Out-Luijting, J.J.; Zoutman, W.H.; van Hall, T.; et al. Improved Sézary cell detection and novel insights into immunophenotypic and molecular heterogeneity in Sézary syndrome. Blood J. Am. Soc. Hematol. 2021, 138, 2539–2554. [Google Scholar]
  61. Subasri, M.; Shooshtari, P.; Watson, A.J.; Betts, D.H. Analysis of TERT Isoforms across TCGA, GTEx and CCLE Datasets. Cancers 2021, 13, 1853. [Google Scholar] [CrossRef] [PubMed]
  62. Bajaj, S.; Kumar, M.S.; Peters, G.; Mayur, Y. Targeting telomerase for its advent in cancer therapeutics. Med. Res. Rev. 2020, 40, 1871–1919. [Google Scholar] [PubMed]
  63. Gomez, D.; Lemarteleur, T.; Lacroix, L.; Mailliet, P.; Mergny, J.L.; Riou, J.F. Telomerase downregulation induced by the G-quadruplex ligand 12459 in A549 cells is mediated by hTERT RNA alternative splicing. Nucleic Acids Res. 2004, 32, 371–379. [Google Scholar] [CrossRef] [PubMed]
  64. Li, G.; Shen, J.; Cao, J.; Zhou, G.; Lei, T.; Sun, Y.; Gao, H.; Ding, Y.; Xu, W.; Zhan, Z. Alternative splicing of human telomerase reverse transcriptase in gliomas and its modulation mediated by CX-5461. J. Exp. Clin. Cancer Res. 2018, 37, 78. [Google Scholar] [CrossRef] [Green Version]
  65. Willemze, R.; Hodak, E.; Zinzani, P.; Specht, L.; Ladetto, M. Primary cutaneous lymphomas: ESMO Clinical Practice Guidelines for diagnosis, treatment and follow-up. Ann. Oncol. 2018, 29, iv30–iv40. [Google Scholar]
Figure 1. Possible mechanisms of hTERT expression in cancer cells. Telomerase activity in cancer cells is related to the acquired expression of hTERT gene located at the short arm of chromosome 5. hTERT transcription activation may be due to germline genetic variations and promoter hotspot mutations. (A) Localization of hTERT germline genetic polymorphisms associated with cancer risk in promoter (rs2735940 and rs2853669) and in gene coding region (rs2853672, rs2853676, rs10069690). The 16 exons of hTERT gene are represented by black vertical bars. (B) hTERT promoter hotspot mutations (*) −124 bp and −146 bp upstream the ATG. Genomic coordinates are based on build 37 (GRCh 37, hg19/Human). hTERT: human telomerase reverse transcriptase; bp: base pair.
Genes 14 00439 g001
Figure 2. Schematic representation of the main hTERT post-transcriptional events. The two main alternative splicing sites in hTERT RT domain are the α splice site in exon 6, which produces a 36 bp in-frame deletion; and the β splice site in exons 7 and 8, which results in a 182 bp deletion. Four possible combinations of hTERT alternative splicing are possible: α+β+, α−β+ (mentioned as β+ variants), and α+β− and α−β− (mentioned as β− variants). hTERT: human telomerase reverse transcriptase; RT: reverse transcriptase.
Genes 14 00439 g002
Figure 3. CTCL cells’ hTERT alternative splicing. (A) hTERT RT domain transcriptome analyzed in CTCL cell lines representative of different CTCL subtypes: Mac1, Mac2A, and Mac2B for c-ALCL, MyLa for T-MF, and HuT78, L1 and L2 for SS. (A1) hTERT transcripts expression levels. (A2) Distribution of hTERT transcripts expression. β+ variants are presented in blue and β− variants in red. (B) hTERT RT domain transcriptome analyzed in peripheral blood mononuclear cells from five SS patients, in comparison with nine healthy controls. (B1) hTERT transcripts expression. (B2) Distribution of hTERT transcripts expression. β+ variants are presented in blue and β- variants in red. A.U.: arbitrary unit; CTCL: cutaneous T-Cell lymphomas; c-ALCL: primary cutaneous anaplastic large cell lymphomas; T-MF: transformed mycosis fungoides; SS: Sézary syndrome; hTERT: human telomerase reverse transcriptase; RT: reverse transcriptase. Statistical significance: * p < 0.05 and ** p < 0.01.
Genes 14 00439 g003
Figure 4. Modulation of hTERT variants expression in MyLa cells. MyLa cells were transduced with shRNAs (sh1 and sh2) targeting hTERT β variants, and with a non-targeting shRNA (sh control). (A) hTERT transcripts expression. (B) Distribution of hTERT transcripts expression. β+ variants are presented in blue and β− variants in red. A.U.: arbitrary unit; shRNAs: short hairpin RNAs; hTERT: human telomerase reverse transcriptase.
Genes 14 00439 g004
Figure 5. Functional impact of hTERT variants modulation in MyLa cells. After one month of transduction with shRNAs, in MyLa cells, (A) telomerase canonical functions were evaluated through the assessment of (A1) telomerase activity and (A2) telomere length. In the same transduced cells, (B) telomerase non-canonical functions were evaluated, through the assessment of (B1) cell proliferation and (B2) cell colony formation capacities. Figures (ac), show colony images of MyLa control cells as well as transduced MyLa cells with sh1 and sh2, respectively. A.U.: arbitrary unit; shRNAs: short hairpin RNAs; hTERT: human telomerase reverse transcriptase. **: p < 0.05.
Genes 14 00439 g005
Table 1. Genotypic frequencies of rs10069690 C > T, rs2853676 G > A, rs2853672 G > T, rs2853669 T > C and rs2735940 T > C hTERT polymorphisms in CTCL cell lines, CTCL patients, and healthy controls.
Locus/GenotypeCell Lines n (%)Controls n (%)Patients n (%)OR (95% CI)p-Value
rs2735940n = 8n = 101n = 66
TT2 (25)40 (39.6)11 (16.7)1.00 a
TC6 (75)48 (47.5)39 (59.1)3.00 (1.31–6.89)0.010
CC013 (12.9)16 (24.2)3.79 (1.35–10.6)0.011
Dominant model
(C carrier vs. TT b)
61 (60.4)/11 (39.6)55 (83.3)/11 (16.7)3.20 (1.44–7.08)0.004
rs2853669n = 8n = 96n = 66
TT040 (41.7)28 (42.4)1.00 a
TC8 (100)42 (43.7)29 (43.9)0.84 (0.41–1.75)0.649
CC014 (14.6)9 (13.6)0.80 (0.29–2.21)0.660
Dominant model
(C carrier vs. TT b)
56 (58.3)/40 (41.7)38 (57.6)/28 (42.4)0.83 (0.42–1.64)0.595
rs2853672n = 8n = 101n = 66
GG2 (25)38 (37.6)16 (24.2)1.00 a
GT6 (75)50 (49.5)38 (57.6)2.04 (0.94–4.44)0.069
TT013 (12.9)12 (18.2)2.67 (0.94–7.62)0.063
Dominant model
(T carrier vs. GG b)
63 (62.4)/38 (37.6)50 (75.8)/16 (24.2)2.18 (1.04–4.58)0.039
rs2853676n = 8n = 101n = 66
GG4 (50)47 (46.5)40 (40.6)1.00 a
AG3 (37.5)42 (41.6)26 (39.4)0.59 (0.29–1.19)0.141
AA1 (12.5)12 (11.9)00.000.999
Dominant model
(A carrier vs. GG b)
54 (53.5)/47 (46.5)26 (39.4)/40 (60.6)0.46 (0.23–0.92)0.028
rs10069690n = 8n = 101n = 66
CC050 (49.5)36 (54.5)1.00 a
CT8 (100)38 (37.6)29 (43.9)1.28 (0.64–2.57)0.479
TT013 (12.9)1 (1.5)0.14 (0.017–1.21)0.074
Dominant model
(T carrier vs. CC b)
51 (50.5)/50 (49.5)30 (45.5)/36 (54.5)1.02 (0.52–1.98)0.963
a Reference value b reference genotype; p-values marked with bold indicate statistically significant p-values.
Table 2. hTERT promoter mutations analysis in CTCL cells.
Mutation Rate (%)Mutation
Patients1/67 (1.5%)
LPDs0/18 (0%)-
cALCL0/10 (0%)-
LyP0/8 (0%)-
MF0/32 (0%)-
MF0/24 (0%)-
T-MF0/8 (0%)-
SS1/17 (5.9%)−146 C > T
Cell lines1/8 (12.5%)
cALCL0/4 (0%)-
T-MF1/1 (100%)−146 C > T
SS0/3 (0%)-
CTCL: cutaneous T-cell lymphoma; LPDs: CD30+ lymphoproliferative disorders; cALCL: cutaneous anaplastic large cell lymphomas; LyP: lymphomatoid papulosis; MF: mycosis fungoides; T-MF: transformed mycosis fungoides; SS: Sézary syndrome; bp: base pair.
Table 3. hTERT transcripts expression level comparing indolent and aggressive phases in Mac cell lines, and also SS patients to healthy controls.
CellsTotal hTERT Transcripts
(Sum of α+β+, α−β+, and α+β−)
α+β+α−β+α+β−
% (p-Value)% (p Value)
Mac110022.88.069.2
Mac2A100 (0.0022)63.2 (0.5887)5.9 (0.0022)30.9 (0.0022)
Mac2B100 (0.0260)70.5 (0.1667)12.0 (0.0628)17.5 (0.0022)
Healthy
controls
100 2.90.097.1
SS patients100 (0.0120)35.0 (0.2507)4.9 (0.0050)60.1 (0.0290)
Statistical analysis of hTERT total transcripts expression and α+β+, α−β+, and α+β− hTERT transcripts proportions of Mac2A and Mac2B compared with Mac1 cells, as well as SS patients compared with healthy controls. p-values marked with bold indicate statistically significant p-values.
Table 4. hTERT transcripts expression analysis in transduced MyLa cells.
CellsTotal hTERT Transcripts
(Sum of α+β+, α−β+ and α+β−)
α+β+α−β+α+β−
% (p Value)% (p Value)
shControl 50.99.939.2
sh1100 (0.1797)48.3 (0.4857)17.7 (0.0237)34 (0.2196)
sh2100 (0.1797)54.5 (0.9448)5.5 (0.0003)40 (0.7255)
Statistical analysis of hTERT total transcripts expression and α+β+, α−β+, and α+β− hTERT transcripts proportions of MyLa cells transduced with sh1 and sh2 compared with MyLa shControl. P-values marked with bold indicate statistically significant p-values.
Disclaimer/Publisher’s Note: The statements, opinions and data contained in all publications are solely those of the individual author(s) and contributor(s) and not of MDPI and/or the editor(s). MDPI and/or the editor(s) disclaim responsibility for any injury to people or property resulting from any ideas, methods, instructions or products referred to in the content.

