Article

Clinical and Genetic Features of Korean Patients with Achromatopsia

1
Department of Ophthalmology, Seoul National University College of Medicine, Seoul National University Bundang Hospital, Seongnam 13620, Republic of Korea
2
Department of Ophthalmology, University of Ulsan College of Medicine, Asan Medical Center, Seoul 05505, Republic of Korea
3
Orthopia Eye Clinic, Seoul 06162, Republic of Korea
4
Institute of Vision Research, Department of Ophthalmology, Severance Hospital, Yonsei University College of Medicine, Seoul 03722, Republic of Korea
5
Institute of Vision Research, Department of Ophthalmology, Gangnam Severance Hospital, Yonsei University College of Medicine, Seoul 06273, Republic of Korea
*
Authors to whom correspondence should be addressed.
These authors contributed equally to this work.
Genes 2023, 14(2), 519; https://doi.org/10.3390/genes14020519
Submission received: 31 December 2022 / Revised: 14 February 2023 / Accepted: 14 February 2023 / Published: 18 February 2023
(This article belongs to the Special Issue Study of Inherited Retinal Disease (IRD))

Abstract

:
This multicenter study aimed to characterize Korean patients with achromatopsia. The patients’ genotypes and phenotypes were retrospectively evaluated. Twenty-one patients (with a mean age at the baseline of 10.9 years) were enrolled and followed up for a mean of 7.3 years. A targeted gene panel or exome sequencing was performed. The pathogenic variants of the four genes and their frequencies were identified. CNGA3 and PDE6C were equally the most prevalent genes: CNGA3 (N = 8, 38.1%), PDE6C (N = 8, 38.1%), CNGB3 (N = 3, 14.3%), and GNAT2 (N = 2, 9.5%). The degree of functional and structural defects varied among the patients. The patients’ age exhibited no significant correlation with structural defects. During the follow-up, the visual acuity and retinal thickness did not change significantly. In CNGA3-achromatopsia patients, a proportion of patients with a normal foveal ellipsoid zone on the OCT was significantly higher than that of patients with other causative genes (62.5% vs. 16.7%; p = 0.023). In PDE6C-achromatopsia patients, the same proportion was significantly lower than that of patients with other causative genes (0% vs. 58.3%; p = 0.003). Korean patients with achromatopsia showed similar clinical features but a higher prevalence of PDE6C variants than those of other ethnic groups. The retinal phenotypes of the PDE6C variants were more likely to be worse than those of other genes.

Graphical Abstract

1. Introduction

Achromatopsia (ACHM) is a rare genetic disease with an autosomal recessive (AR) inheritance. It is characterized by the cone-specific loss of the retinal anatomy and function. The disease presents with a decrease in daylight vision, which begins early in life. Its diagnosis is based on clinical presentations and genetic tests to identify variants in the known causative genes. Approximately 80–90% of cases have causative variants in CNGA3 and CNGB3 [1,2]. Others have variants in PDE6C, GNAT2, ATF6, and PDE6H [2]. However, the prevalence of each gene differs greatly according to region and ethnicity [2].
Because of its cone-specific loss-of-function, ACHM is considered a good candidate for gene replacement therapy. The severity and extent of photoreceptor (PR) damage are important factors in gene replacement therapy [3]. Many studies have depicted the genotypes and clinical presentations of ACHM in several populations [1,4,5,6,7] and have demonstrated methods to evaluate the remnant PR in patients with ACHM [1,8,9,10,11].
The clinical decisions for the timing of gene replacement therapy are influenced by the remodeling stages of the retina [3]. The retinal tissue is post-mitotic so that it is non-regenerating after irreversible damage occurs. Therefore, the natural history of the disease must be considered to not miss the optimal window for treatment. Although ACHM was traditionally categorized as a stationary cone dysfunction [12], many studies have reported evidence of its progression [4,9,10].
The genotypes and phenotypes of the variants in ACHM patients in Korea are not well known and are both important for the future implementation of gene therapy. We identified the genotypes, phenotypes, and their correlations in Korean patients with ACHM. Longitudinal changes in the retinal structure and function were also analyzed to elucidate the possible progression and its relationship to the genotype.

2. Materials and Methods

2.1. Patient Selection

We retrospectively reviewed the medical records of patients diagnosed with ACHM. Patients who visited two tertiary referral hospitals between January 2007 and December 2020 were enrolled. The diagnosis was based on genetic testing and clinical presentations, such as the early onset of poor visual acuity, infantile nystagmus, color vision defects, and abnormal cone responses with normal or subnormal rod responses on an electroretinogram (ERG) [13]. We first reviewed the records of patients who underwent genetic testing for causative variants in 6 known causative genes of ACHM. The clinical presentations were then reviewed to exclude patients who had clinical features that did not correspond to those of ACHM.

2.2. Ophalmic Examinations

Ophthalmic examinations, including the measurement of the best-corrected visual acuity (BCVA), refractive errors, a biomicroscopy with a slit-lamp microscope, and fundus examinations, were performed. Ancillary tests were conducted, including color fundus photography (VX-10a; KOWA, Tokyo, Japan), optical coherence tomography (OCT; SPECTRALIS HRA+OCT, Heidelberg Engineering, Heidelberg, Germany), and an ERG (1) (VERIS, Electro-Diagnostic Imaging, Milpitas, CA, USA) or (2) (Ret-eval, LKC, Gaithersburg, MD, USA). The ERG was recorded according to the International Guidelines of the International Society of Clinical Electrophysiology of Vision (ISCEV) [14,15]. Visual acuity and central retinal thickness (CRT) were compared between the baseline and last measurements. Visual acuity was converted to the logarithm of the minimum angle of resolution (LogMAR). Statistical tests were conducted on changes in the BCVA and CRT and the rates of the changes. The denominator of the rate of change was the period between the first and the last observations. Color vision tests were performed in some cases using an Ishihara pseudoisochromatic plate test or a Hardy–Rand–Rittler (HRR) pseudoisochromatic plate test.
Evaluation of rod functions in the scotopic ERG was based on the amplitude of the b-wave in DA 0.01 ERG. Cone functions were analyzed based on the amplitudes of a- and b-waves in an LA 3.0 ERG or the N1-P1 amplitude of a 30 Hz flicker ERG. The reference values were provided by the ERG equipment that was based on the accumulated normative data.
The existence of one or more inner layers in the fovea was noted as foveal hypoplasia, as described in the existing literature [1]. The severity of degeneration shown on the OCT was graded in four categories. Grade 1 was considered normal. Grade 2 was defined as disruptions in the photoreceptor layers, particularly in the inner segment of the ellipsoid (ISe) zones. Grade 3 was defined as the hyporeflective zone in the ISe. Grade 4 was defined as the atrophy of the outer retinal layer and retinal pigment epithelium. The same category has been described in the existing literature [1], except that we did not adopt a stage denoting the absence of the ISe.

2.3. Genotyping

Patient genotyping was performed using targeted gene panels or whole-exon sequencing. A customized target enrichment kit (Celemics, Seoul, Republic of Korea) was designed, covering the exon and splicing regions of 254 genes related to inherited retinal diseases. Segregation was performed when possible. Sequencing and bioinformatics analyses were performed according to processes described in the existing literature [16]. The pathogenicity of the variants was evaluated based on guidelines suggested by the American College of Medical Genetics (ACMG) [17]. Accession numbers of the transcripts were NM_001298.2 for CNGA3, NM_019098.4 for CNGB3, NM_006204.3 for PDE6C, and NM_005272.3 for GNAT2. To detect the deletion of exons, we used read depth-based detection of the copy number variations (CNVs). Analysis and visualization of CNV were conducted using Celemics CNV software (Celemics, Seoul, Republic of Korea) or ExomeDepth version 1.1.10 [18], after using a base-level read depth normalization algorithm designed by the authors [19].

2.4. Statistical Analysis

All statistical analyses were performed using Python (Python Language Reference, version 3.10.4) and using Pandas and SciPy libraries. Data were expressed as numbers, percentages, and the mean ± standard deviation. A one-tailed or two-tailed Boschloo’s exact test for non-numerical data was conducted to compare categorical variables. The p-value was compensated using the Bonferroni correction in multiple pairwise comparisons. A Mann–Whitney U test was used to compare continuous variables between the two groups based on the results of the normality tests. To compare paired samples of continuous variables, a Wilcoxon signed-rank test was used. A 95% confidence interval and 5% significance level were adopted. Results were considered statistically significant when a p-value of less than 0.05 was observed.

3. Results

3.1. Demographics and Clinical Presentation

Twenty-one patients with ACHM were enrolled. The demographic and clinical features are shown in Table 1. Thirteen patients were men, and eight patients were women. The mean age at the initial visit was 10.9 ± 12.9 (0.5–47.2) years. The patients were followed up for a mean of 7.3 ± 6.8 (0–25) years. The LogMAR-converted mean BCVAs at the initial visit were 1.01 ± 0.28 (0.52–1.52) in the right and 1.02 ± 0.26 (0.52–1.52) in the left eyes. The LogMAR-converted mean BCVAs at the last visit were 0.98 ± 0.2 (0.7–1.4) in the right and 0.97 ± 0.2 (0.7–1.4) in the left eyes. The mean changes of the LogMAR-converted BCVA were −0.05 ± 0.21 (−0.57–0.30) in the right and −0.05 ± 0.20 (−0.4–0.48) in the left eyes. In 18 patients, the BCVA was measured longitudinally. The mean follow-up duration was 7.4 ± 6.2 years. As shown in Figure 1, no significant changes in the BCVA were observed in either eye of those patients (right: p = 0.385; left: p = 0.239). Normalized to the follow-up duration, the changes in the BCVA per year were −0.017 ± 0.056 (−0.185–0.059) in the right and −0.02 ± 0.046 (−0.128–0.042) in the left eyes, which were not significant (right, p = 0.285; left, p = 0.114). All patients had infantile nystagmus, but the nystagmus in one patient (#13) had resolved spontaneously during early adolescence. The median refractive errors were −3.01 ± 6.42 (−14.25–7.00) diopters in the right and −2.89 ± 6.19 (−14.25–7.00) diopters in the left eyes. Twelve patients underwent color vision testing, which resulted in total color blindness. One patient (#21) failed to undergo the HRR pseudoisochromatic plate test. Another patient (#19) refused all ophthalmic examinations and ancillary tests except for genetic testing and OCT.

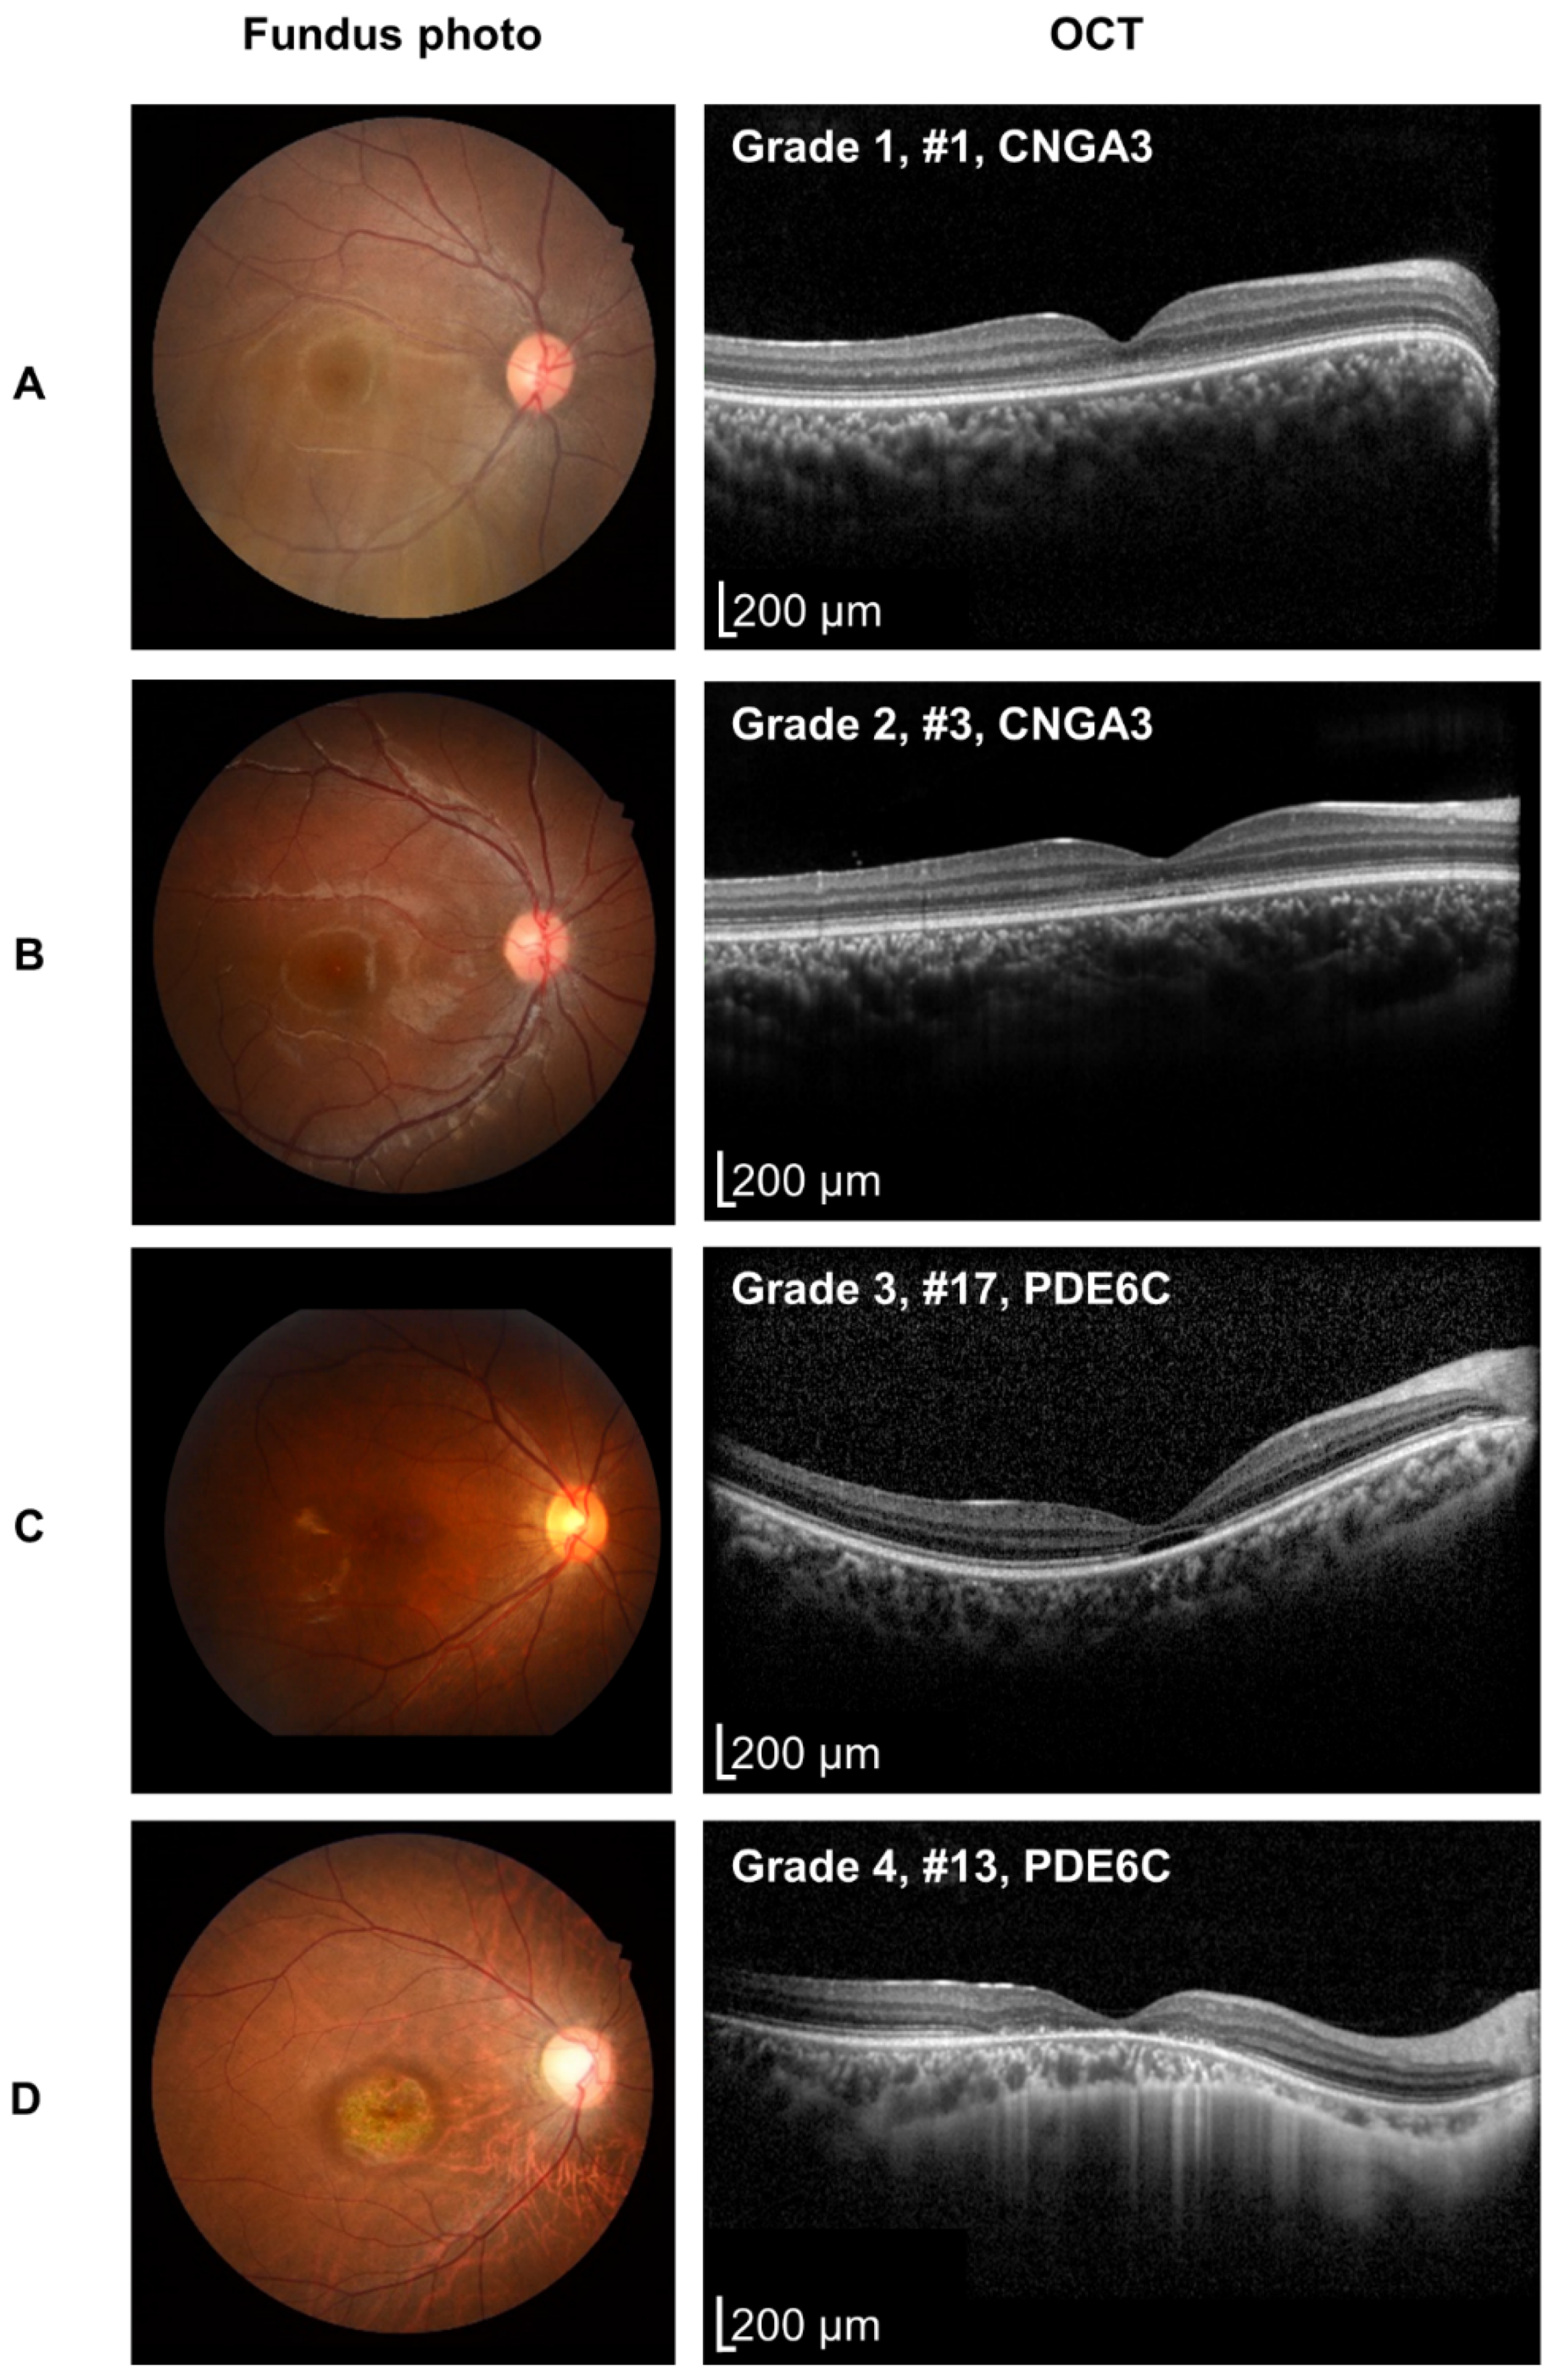
3.2. Retinal Phenotypes

Varying degrees of foveal abnormalities were observed. The representative fundus photographs and OCT images are shown in Figure 2. Seventeen patients (85%) revealed no abnormalities in the fundus photographs. One (5%, #4) patient had hypopigmentary changes of the retinal pigment epithelium (RPE); the other two (10%, #13, #16) had atrophy of the retina and RPE. OCT revealed a wide range of degeneration in the foveal photoreceptors (Table 1). At the latest visit to each patient, seven (35%) patients had a continuous ISe. Six patients (30%) experienced ISe disruptions. Four patients (20%) had hyporeflective zones. Three patients (15%) exhibited atrophy of the outer retina and the RPE. All patients had symmetry in both eyes on the OCT, except one (#4, right: ISe disruption; left: normal). One toddler (#10) did not cooperate with the OCT during the entire follow-up period. Foveal hypoplasia was identified in six patients on OCT (30%).
The measurement of the CRT was performed longitudinally for 13 patients. The mean follow-up duration was 5.0 ± 2.8 (1.1–11.9) years. At the first visit of each patient, when the OCT was conducted, the mean CRT was 187.8 ± 46.2 (102–242) μm in the right eyes and 186.9 ± 48.8 (101–243) μm in the left eyes. At the latest visit of each patient, when the OCT was conducted, the mean CRT was 186.8 ± 46.5 (101–238) μm in the right eyes and 182.5 ± 47.9 (102–238) μm in the left eyes. Figure 1B shows the changes in the CRT for each patient. There were significant changes in the CRT in the left eye (p = 0.04). However, the CRT in the right eye did not change (p = 0.329). After normalizing to the interval between the measurements, the mean rate of change was −0.5 ± 1.1 (−2.7–1.1) μm/year in the right eyes and −1.0 ± 1.7 (−4.9–1.0) μm/year in the left eyes. The mean rate of change was significant in the left eye (p = 0.02) but not in the right eye (p = 0.057).

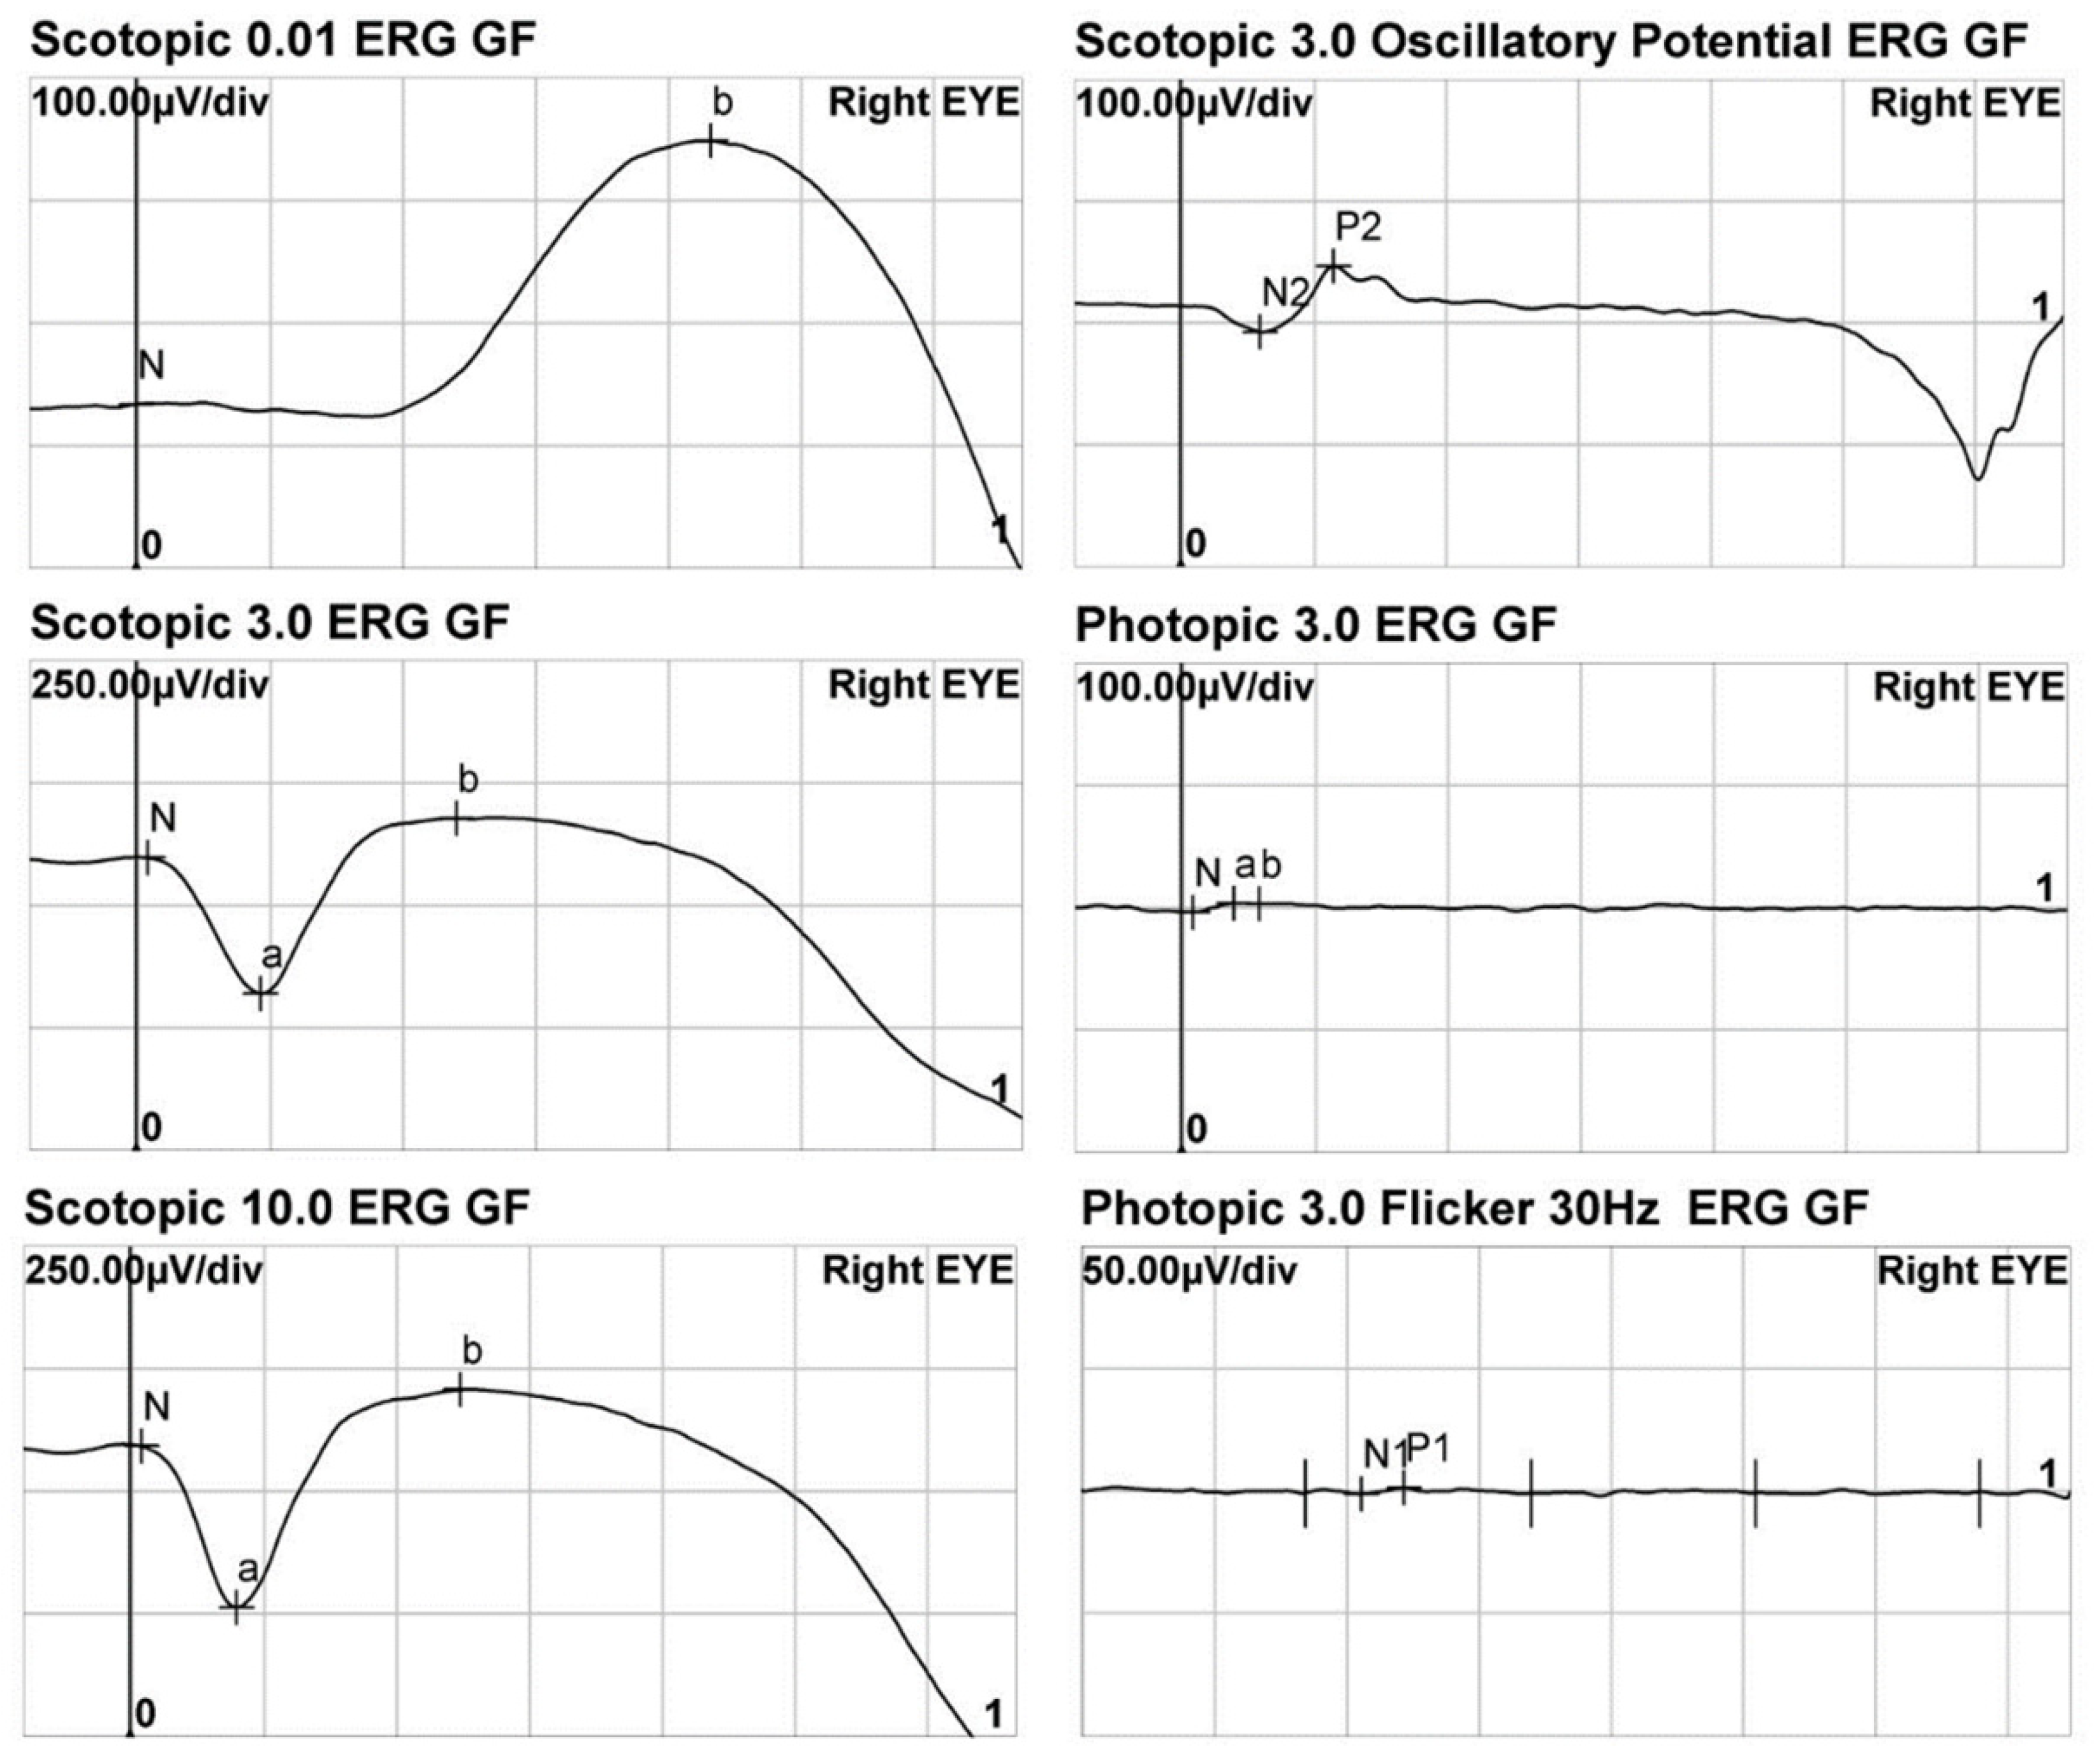
3.3. Electroretinogram
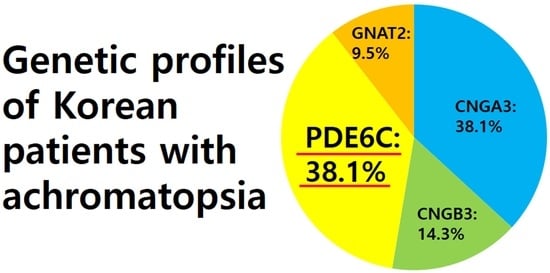
The ERG was conducted in 17 cases (Table 2). The representative images of the ERG are shown in Figure 3. The dark-adapted (DA) 0.01 ERG was observable in all of the patients. The mean amplitude of the b-wave in the DA 0.01 ERG was 69.7 ± 63.3 (7.9–215) μV in the right eyes and 69.5 ± 56.3 (8.3–196) μV in the left eyes. In 16 patients (94%), the light-adapted (LA) 3.0 ERG showed no measurable amplitudes of the a- and b-waves. In the flicker ERG, sixteen patients (94%) showed no measurable responses.

3.4. Genotypes

Biallelic variants were also identified in 21 patients. They had pathogenic variants in four common causative genes of ACHM. The causes of ACHM were defects in CNGA3 in eight patients (38.1%), CNGB3 in three patients (14.3%), PDE6C in eight patients (38.1%), and GNAT2 in two patients (9.5%) (Table 3). Ten patients were compound heterozygotes, and three were homozygotes. Since the segregation was not conducted in the other eight patients who were heterozygotes, it was unidentified whether they were compound heterozygotes. Eleven of these variants were novel. The predicted pathogenicity of nine novel variants was “Likely pathogenic” or “Pathogenic,” according to the ACMG classification. The other two novel variants were predicted to be of “Uncertain significance.” In the patients with CNGA3-ACHM, eleven variants were missenses (79%), two variants were frameshifts (14%), and the other variant was an initiation codon variant (7%). Two variants in CNGA3 were found in multiple patients: c.553C>G in patients #3 and #4 and c.1001C>T in patients #1 and #2. CNGA3:c.829C>T was detected in the homozygote. In patients with CNGB3-ACHM, three variants were splice-site variants (60%), one variant was a frameshift (20%), and the other was the deletion of exon 16 (20%). CNGB3:c.1928+2T>C was identified in a homozygote. In patients with PDE6C-ACHM, eleven variants (85%) were missense, one variant (8%) was a frameshift, and the other one (8%) was a deletion of exon 1. Two variants in PDE6C-ACHM were found in multiple patients: c.1771G>A in patients #12 and #16 and c.85C>T in patients #14 and #16. There were no homozygotes in patients with PDE6C-ACHM. In patients with variants in GNAT2, c.481C>T was found in two patients, #20 and #21 (67%). One patient was homozygous; the other had a frameshift variant (33%).

3.5. Correlations of Genotypes and Phenotypes

The correlation between the presence of ISe abnormalities and clinical features was evaluated (Table 4). Patients were stratified into four groups depending on their causative gene variants. Age (p = 0.43), BCVA (right: p = 0.443; left: p = 0.676), funduscopic findings (p = 0.535), and proportion of hypoplasia (p = 0.386) were not significantly different between the two groups of patients with CNGA3-ACHM and PDE6C-ACHM, respectively. Based on OCT findings, proportions of patients with ISe changes were denoted for each mutated gene. There was a significant difference in the proportion of patients with ISe changes between the groups of patients with CNGA3-ACHM and PDE6C-ACHM (p = 0.011) (Table 4). In patients with CNGA3-ACHM, the proportion of patients with no ISe change was significantly higher than that of the patients with variants in other causative genes (62.5% vs. 16.7%; p = 0.023) (Table S1). In patients with PDE6C-ACHM, the proportion of patients with ISe changes was different from that of the patients with causative variants in other genes (100% vs. 58.3%; p = 0.003). Multiple pairwise comparisons with adjustment were conducted between groups of patients with causative variants in each mutated gene (Table S2). The proportion of patients without ISe changes was higher in the group of patients with CNGA3-ACHM than that in the group of patients with PDE6C-ACHM (p = 0.005). The age of the patients was compared between the two groups that were separated by the existence of ISe changes in the OCT images, regardless of the causative genes. The mean ages of the groups of normal ISe and abnormal ISe were 12.5 ± 5.7 (6.4–23.9) and 22.0 ± 12.1 (7.6–47.2), respectively. The patients with a normal ISe were, on average, 9.5 years younger. However, the age did not differ significantly between the groups (p = 0.056). When compared to other causative genes, there were no significant differences in the proportion of patients with ISe changes in the groups of patients with CNGB3-ACHM and GNAT2-ACHM (Table S3).

4. Discussion

In the present study, we analyzed the genotypes and phenotypes of 21 Korean patients with ACHM. To our knowledge, this is the first study of the genotypes and phenotypes in Korean patients. This was required, given the rapid and active development of gene therapy for ACHM.
We found a high proportion of PDE6C variants in Korean patients with ACHM. The genotyping of Korean patients has identified variants in CNGA3, CNGB3, PDE6C, and GNAT2. The frequencies of CNGA3 and PDE6C were higher than those of other variants. Globally, the profiles of mutated genes vary widely in ACHM patients (Table 5) [1,4,7,30]. Koreans and Chinese are similar in the sense that they are East Asians. However, CNGA3 is the most prevalently mutated gene in Chinese patients with ACHM [7]. Among them, only 0.8% of patients have variants in PDE6C [7]. Although there was a large difference, we considered it acceptable. Hanany et al. [34] reported the predicted genetic prevalence of genes in patients with AR-inherited retinal diseases based on the reported cases in public databases. According to them, the predicted number of ACHM patients with biallelic variants in PDE6C was 4418, which was 21.5% of all patients with ACHM in East Asia. This implies that more than 21.5% of the patients with ACHM had PDE6C variants in East Asia, especially in nations other than China. This indicates a potential market for investigation in East Asia for the gene therapy of PDE6C-ACHM.
We compared the OCT stages in four groups of patients with different causative genes for ACHM. OCT revealed that all eight patients with PDE6C variants had varying degrees of abnormalities in the ISe. The mean age of the patients with PDE6C variants was 13.2 years, which was lower than that reported by Georgiou et al. [9]. In the PDE6C variants, this high tendency to have severe retinal phenotypes was significantly different from that in patients with other causative variants: CNGA3, CNGB3, and GNAT2 (Table S1). In contrast, the proportion of normal OCT findings was significantly higher in the CNGA3 variants (Table S1). The mean ages of the patients with CNGA3-ACHM and PDE6C-ACHM were not significantly different (Table 4). However, the overall OCT grades of the patients with PDE6C-ACHM were significantly higher than those of the patients with CNGA3-ACHM (Table S2). Thus, we expected a wide variation in the therapeutic window for gene therapy in Korean patients, given that the most common variants were CNGA3 and PDE6C.
In this study, a small proportion of patients had variants in CNGB3 and GNAT2. However, the genetic profiles of the CNGB3 variants coincided with those previously reported [27]. The variants in three patients with CNGB3-ACHM were nonsense, frameshift, and deletion of the exon variant. The loss of function in CNGB3 is associated with complete ACHM that results in a complete loss of cone responses, a VA lower than 20/200, and a complete loss of color vision [36]. Among the 12 patients who did not undergo the color vision test, we could not identify whether the ACHM was a complete type. Coincidentally, none of the three patients with CNGB3 variants underwent color vision testing. However, all had infantile nystagmus and optical vacancies in the layers of the outer retina on the OCT. Moreover, the mean LogMAR BCVAs were 1.12 ± 0.26 (0.82–1.43) in the right eye and 1.10 ± 0.17 (1.00–1.43) in the left eye at the last follow-up. These findings are relevant to the features of complete ACHM.
In addition to the lack of color vision tests in some cases, the small sample size is another limitation of this study. Because of the rare incidence of ACHM, it was unable to recruit a large number of patients, making the data prone to bias. Therefore, these limitations should be considered when interpreting the results of this study. Another limitation of this study is the lack of in-depth phenotyping of the retinal structure. Georgiou et al. [9] reported the usefulness of adapted optical scanning light ophthalmoscopy (AOSLO) for the in-depth phenotyping of ACHM. They revealed remnant PRs using AOSLO in a patient with a hyporeflective space at the fovea on the OCT. We revealed the fovea in four patients (22%) with hyporeflective spaces on the OCT images. They may have remnant PRs in the fovea that are more preserved than those shown in the OCT images. To select therapeutic targets in the future, more in-depth phenotyping using devices such as AOSLO will be necessary to avoid missing the therapeutic window.

5. Conclusions

To our knowledge, this was the first study to conduct genotyping, phenotyping, and analysis of their correlation in Korean patients with ACHM. We discussed the characteristic genetic prevalence and clinical presentation of ACHM in Korean patients. These findings should be considered for the future implementation of gene therapy in Korea.

Supplementary Materials

The following supporting information can be downloaded at: https://www.mdpi.com/article/10.3390/genes14020519/s1, Table S1. Number of patients in CNGA3 and PDE6C achromatopsia, grouped by structural changes obtained from OCT; Table S2. Results of pairwise comparison of one-sided, exact tests comparing features associated with structural changes; Table S3. Number of patients with structural changes obtained from OCT.

Author Contributions

Conceptualization, S.J.W. and J.H.; methodology, K.J. and J.H.; validation, S.J.W., J.H. and K.J.; formal analysis, Y.J.C.; resources, S.J.W., J.H., K.J., H.T.L. and S.S.K.; data curation, K.J. and S.J.W.; writing—original draft preparation, Y.J.C. and K.J.; writing—review and editing, S.J.W., J.H., K.J., H.T.L. and S.S.K.; visualization, Y.J.C.; supervision, S.J.W. and J.H.; project administration, S.J.W. All authors have read and agreed to the published version of the manuscript.

Funding

This research was supported by a research grant from Seoul National University’s Bundang Hospital (No. 02-2020-013 and No. 14-2018-019) and the National Research Foundation (NRF), grant 2020R1F1A107279512 and 2020R1C1C1007965, funded by the Korean government (the Ministry of Science, ICT, and Future Planning). The funding organization had no role in the design or conduct of this study.

Institutional Review Board Statement

This study followed the tenets of the Declaration of Helsinki and was approved by the Institutional Review Boards of Seoul National University’s Bundang Hospital (approval number: B-2205-755-107) and Gangnam Severance Hospital (approval number:3-2018-0026).

Informed Consent Statement

We obtained informed consent from all subjects in this study.

Data Availability Statement

The data presented in this study are available on request from the corresponding author. The data are not publicly available due to privacy.

Conflicts of Interest

The authors declare no conflict of interest.

References

  1. Sundaram, V.; Wilde, C.; Aboshiha, J.; Cowing, J.; Han, C.; Langlo, C.S.; Chana, R.; Davidson, A.E.; Sergouniotis, P.I.; Bainbridge, J.W.; et al. Retinal structure and function in achromatopsia: Implications for gene therapy. Ophthalmology 2014, 121, 234–245. [Google Scholar] [CrossRef] [PubMed] [Green Version]
  2. Michalakis, S.; Gerhardt, M.; Rudolph, G.; Priglinger, S.; Priglinger, C. Achromatopsia: Genetics and Gene Therapy. Mol. Diagn. Ther. 2022, 26, 51–59. [Google Scholar] [CrossRef] [PubMed]
  3. Cehajic-Kapetanovic, J.; Singh, M.S.; Zrenner, E.; MacLaren, R.E. Bioengineering strategies for restoring vision. Nat. Biomed. Eng. 2022. [Google Scholar] [CrossRef] [PubMed]
  4. Brunetti-Pierri, R.; Karali, M.; Melillo, P.; Di Iorio, V.; De Benedictis, A.; Iaccarino, G.; Testa, F.; Banfi, S.; Simonelli, F. Clinical and Molecular Characterization of Achromatopsia Patients: A Longitudinal Study. Int. J. Mol. Sci. 2021, 22, 1681. [Google Scholar] [CrossRef] [PubMed]
  5. Ouechtati, F.; Merdassi, A.; Bouyacoub, Y.; Largueche, L.; Derouiche, K.; Ouragini, H.; Nouira, S.; Tiab, L.; Baklouti, K.; Rebai, A.; et al. Clinical and genetic investigation of a large Tunisian family with complete achromatopsia: Identification of a new nonsense mutation in GNAT2 gene. J. Hum. Genet. 2011, 56, 22–28. [Google Scholar] [CrossRef] [PubMed] [Green Version]
  6. Saqib, M.A.; Awan, B.M.; Sarfraz, M.; Khan, M.N.; Rashid, S.; Ansar, M. Genetic analysis of four Pakistani families with achromatopsia and a novel S4 motif mutation of CNGA3. Jpn. J. Ophthalmol. 2011, 55, 676–680. [Google Scholar] [CrossRef]
  7. Sun, W.; Li, S.; Xiao, X.; Wang, P.; Zhang, Q. Genotypes and phenotypes of genes associated with achromatopsia: A reference for clinical genetic testing. Mol. Vis. 2020, 26, 588–602. [Google Scholar]
  8. Andreasson, S.; Tornqvist, K. Electroretinograms in patients with achromatopsia. Acta Ophthalmol. 1991, 69, 711–716. [Google Scholar] [CrossRef]
  9. Georgiou, M.; Robson, A.G.; Singh, N.; Pontikos, N.; Kane, T.; Hirji, N.; Ripamonti, C.; Rotsos, T.; Dubra, A.; Kalitzeos, A.; et al. Deep Phenotyping of PDE6C-Associated Achromatopsia. Investig. Ophthalmol. Vis. Sci 2019, 60, 5112–5123. [Google Scholar] [CrossRef] [Green Version]
  10. Greenberg, J.P.; Sherman, J.; Zweifel, S.A.; Chen, R.W.; Duncker, T.; Kohl, S.; Baumann, B.; Wissinger, B.; Yannuzzi, L.A.; Tsang, S.H. Spectral-domain optical coherence tomography staging and autofluorescence imaging in achromatopsia. JAMA Ophthalmol. 2014, 132, 437–445. [Google Scholar] [CrossRef]
  11. Scoles, D.; Flatter, J.A.; Cooper, R.F.; Langlo, C.S.; Robison, S.; Neitz, M.; Weinberg, D.V.; Pennesi, M.E.; Han, D.P.; Dubra, A.; et al. Assessing Photoreceptor Structure Associated with Ellipsoid Zone Disruptions Visualized with Optical Coherence Tomography. Retina 2016, 36, 91–103. [Google Scholar] [CrossRef] [PubMed] [Green Version]
  12. Berger, W.; Kloeckener-Gruissem, B.; Neidhardt, J. The molecular basis of human retinal and vitreoretinal diseases. Prog. Retin. Eye Res. 2010, 29, 335–375. [Google Scholar] [CrossRef] [PubMed] [Green Version]
  13. Kohl, S.; Jägle, H.; Wissinger, B.; Zobor, D. Achromatopsia. In GeneReviews(®); Adam, M.P., Everman, D.B., Mirzaa, G.M., Pagon, R.A., Wallace, S.E., Bean, L.J.H., Gripp, K.W., Amemiya, A., Eds.; University of Washington: Seattle, WA, USA, 1993. [Google Scholar]
  14. Marmor, M.F.; Fulton, A.B.; Holder, G.E.; Miyake, Y.; Brigell, M.; Bach, M.; International Society for Clinical Electrophysiology of Vision. ISCEV Standard for full-field clinical electroretinography (2008 update). Doc. Ophthalmol. 2009, 118, 69–77. [Google Scholar] [CrossRef] [PubMed] [Green Version]
  15. McCulloch, D.L.; Marmor, M.F.; Brigell, M.G.; Hamilton, R.; Holder, G.E.; Tzekov, R.; Bach, M. ISCEV Standard for full-field clinical electroretinography (2015 update). Doc. Ophthalmol. 2015, 130, 1–12. [Google Scholar] [CrossRef] [Green Version]
  16. Jin, K.W.; Joo, K.; Woo, S.J. Clinical Characterization of Korean Patients with Pseudoxanthoma Elasticum and Angioid Streaks. Genes 2021, 12, 1207. [Google Scholar] [CrossRef]
  17. Richards, S.; Aziz, N.; Bale, S.; Bick, D.; Das, S.; Gastier-Foster, J.; Grody, W.W.; Hegde, M.; Lyon, E.; Spector, E.; et al. Standards and guidelines for the interpretation of sequence variants: A joint consensus recommendation of the American College of Medical Genetics and Genomics and the Association for Molecular Pathology. Genet. Med. 2015, 17, 405–424. [Google Scholar] [CrossRef] [Green Version]
  18. Plagnol, V.; Curtis, J.; Epstein, M.; Mok, K.Y.; Stebbings, E.; Grigoriadou, S.; Wood, N.W.; Hambleton, S.; Burns, S.O.; Thrasher, A.J.; et al. A robust model for read count data in exome sequencing experiments and implications for copy number variant calling. Bioinformatics 2012, 28, 2747–2754. [Google Scholar] [CrossRef] [Green Version]
  19. Lee, S.T.; Han, J. Missed Heterozygous Deletion in Study of Next-Generation Sequencing for Molecular Diagnosis in Patients With Infantile Nystagmus Syndrome. JAMA Ophthalmol. 2019, 137, 1465–1466. [Google Scholar] [CrossRef] [Green Version]
  20. Li, S.; Huang, L.; Xiao, X.; Jia, X.; Guo, X.; Zhang, Q. Identification of CNGA3 mutations in 46 families: Common cause of achromatopsia and cone-rod dystrophies in Chinese patients. JAMA Ophthalmol. 2014, 132, 1076–1083. [Google Scholar] [CrossRef] [Green Version]
  21. Wissinger, B.; Gamer, D.; Jägle, H.; Giorda, R.; Marx, T.; Mayer, S.; Tippmann, S.; Broghammer, M.; Jurklies, B.; Rosenberg, T.; et al. CNGA3 Mutations in Hereditary Cone Photoreceptor Disorders. Am. J. Hum. Genet. 2001, 69, 722–737. [Google Scholar] [CrossRef] [Green Version]
  22. Rim, J.H.; Lee, S.T.; Gee, H.Y.; Lee, B.J.; Choi, J.R.; Park, H.W.; Han, S.H.; Han, J. Accuracy of Next-Generation Sequencing for Molecular Diagnosis in Patients With Infantile Nystagmus Syndrome. JAMA Ophthalmol. 2017, 135, 1376–1385. [Google Scholar] [CrossRef] [PubMed]
  23. Johnson, S.; Michaelides, M.; Aligianis, I.A.; Ainsworth, J.R.; Mollon, J.D.; Maher, E.R.; Moore, A.T.; Hunt, D.M. Achromatopsia caused by novel mutations in both CNGA3 and CNGB3. J. Med. Genet. 2004, 41, e20. [Google Scholar] [CrossRef] [PubMed] [Green Version]
  24. Kim, M.S.; Joo, K.; Seong, M.W.; Kim, M.J.; Park, K.H.; Park, S.S.; Woo, S.J. Genetic Mutation Profiles in Korean Patients with Inherited Retinal Diseases. J. Korean Med. Sci. 2019, 34, e161. [Google Scholar] [CrossRef]
  25. Kohl, S.; Marx, T.; Giddings, I.; Jägle, H.; Jacobson, S.G.; Apfelstedt-Sylla, E.; Zrenner, E.; Sharpe, L.T.; Wissinger, B. Total colourblindness is caused by mutations in the gene encoding the α-subunit of the cone photoreceptor cGMP-gated cation channel. Nat. Genet. 1998, 19, 257–259. [Google Scholar] [CrossRef]
  26. Ahuja, Y.; Kohl, S.; Traboulsi, E. CNGA3 mutations in two United Arab Emirates families with chromatopsia. Mol. Vis. 2008, 10, 1293–1297. [Google Scholar]
  27. Mayer, A.K.; Van Cauwenbergh, C.; Rother, C.; Baumann, B.; Reuter, P.; De Baere, E.; Wissinger, B.; Kohl, S.; Group, A.S. CNGB3 mutation spectrum including copy number variations in 552 achromatopsia patients. Hum. Mutat. 2017, 38, 1579–1591. [Google Scholar] [CrossRef]
  28. Huang, L.; Xiao, X.; Li, S.; Jia, X.; Wang, P.; Sun, W.; Xu, Y.; Xin, W.; Guo, X.; Zhang, Q. Molecular genetics of cone-rod dystrophy in Chinese patients: New data from 61 probands and mutation overview of 163 probands. Exp. Eye Res. 2016, 146, 252–258. [Google Scholar] [CrossRef] [PubMed]
  29. National Center for Biotechnology Information. ClinVar; [VCV000970700.5]. Available online: https://www.ncbi.nlm.nih.gov/clinvar/variation/VCV000970700.5 (accessed on 27 January 2023).
  30. Thiadens, A.A.; den Hollander, A.I.; Roosing, S.; Nabuurs, S.B.; Zekveld-Vroon, R.C.; Collin, R.W.; De Baere, E.; Koenekoop, R.K.; van Schooneveld, M.J.; Strom, T.M.; et al. Homozygosity mapping reveals PDE6C mutations in patients with early-onset cone photoreceptor disorders. Am. J. Hum. Genet. 2009, 85, 240–247. [Google Scholar] [CrossRef] [PubMed] [Green Version]
  31. Abouelhoda, M.; Sobahy, T.; El-Kalioby, M.; Patel, N.; Shamseldin, H.; Monies, D.; Al-Tassan, N.; Ramzan, K.; Imtiaz, F.; Shaheen, R.; et al. Clinical genomics can facilitate countrywide estimation of autosomal recessive disease burden. Genet. Med. 2016, 18, 1244–1249. [Google Scholar] [CrossRef] [Green Version]
  32. National Center for Biotechnology Information. ClinVar. [VCV001213877.1]. Available online: https://www.ncbi.nlm.nih.gov/clinvar/variation/VCV001213877.1 (accessed on 27 January 2023).
  33. National Center for Biotechnology Information. ClinVar. [VCV001017583.2]. Available online: https://www.ncbi.nlm.nih.gov/clinvar/variation/VCV001017583.2 (accessed on 27 January 2023).
  34. Hanany, M.; Rivolta, C.; Sharon, D. Worldwide carrier frequency and genetic prevalence of autosomal recessive inherited retinal diseases. Proc. Natl. Acad. Sci. USA 2020, 117, 2710–2716. [Google Scholar] [CrossRef]
  35. Thiadens, A.A.; Slingerland, N.W.; Roosing, S.; van Schooneveld, M.J.; van Lith-Verhoeven, J.J.; van Moll-Ramirez, N.; van den Born, L.I.; Hoyng, C.B.; Cremers, F.P.; Klaver, C.C. Genetic etiology and clinical consequences of complete and incomplete achromatopsia. Ophthalmology 2009, 116, 1984–1989 e1981. [Google Scholar] [CrossRef]
  36. Hirji, N.; Aboshiha, J.; Georgiou, M.; Bainbridge, J.; Michaelides, M. Achromatopsia: Clinical features, molecular genetics, animal models and therapeutic options. Ophthalmic Genet. 2018, 39, 149–157. [Google Scholar] [CrossRef] [PubMed]
Figure 1. Changes in the best corrected visual acuity (BCVA) and central retinal thickness (CRT) in the patients with achromatopsia. The color of each mark denoted the follow-up duration between the baseline and the final visit when the BCVA or CRT was measured. (A). No significant changes in the BCVA were observed in either of the eyes. (B). A significant change in the mean CRT was observed in the left eyes, while it was not observed in the right eyes.
Genes 14 00519 g001
Figure 2. Representative images of multimodal ophthalmic imaging of patients showing various degrees of photoreceptor loss. Fundus photography and optical coherence tomography (OCT) were conducted. In the OCT, the degrees of photoreceptor loss varied into four categories; (A) continuous photoreceptor inner segment ellipsoid (ISe), (B) disruption of the ISe, (C) presence of hyporeflective zone, and (D) atrophy of the outer retina and retinal pigment epithelium.
Genes 14 00519 g002
Figure 3. A representative result of the electroretinogram (ERG) obtained from patient #1. While almost no photopic responses were observed, scotopic responses were normal.
Genes 14 00519 g003
Table 1. Clinical features and patient demographics.
IDSexAge (Years)Follow-Up Duration
(Years)
Visual Acuity at Baseline (LogMAR)Visual Acuity at Last Visit (LogMAR)GenotypeOCT Grade at Last ExaminationsFoveal Hypoplasia on OCTERG Rod ResponsesERG Cone ResponsesColor Vision Test
#1M0.614.41.3/1.01.0/1.0CNGA31NoNormalNMColor blindness
#2F1.26.21.4/1.40.82/1.0CNGA31YesNot conductedNot conductedNot conducted
#3M1.510.60.7/0.820.7/0.7CNGA32NoPresentNMColor blindness
#4M3.413.80.52/0.520.82/1.0CNGA32YesDecreasedNMNot conducted
#5M2.56.20.7/1.01.0/1.0CNGA31NoPresentNMColor blindness
#6M84.41.3/1.31.1/1.3CNGA31YesPresentNMNot conducted
#7M12.400.7/0.70.7/0.7CNGA31NoNot conductedNot conductedNot conducted
#8F30.710.82/0.820.82/0.82CNGA32NoNot conductedNot conductedColor blindness
#9F0.514.91.3/1.31.4/1.4CNGB33YesPresentNMNot conducted
#10F2.60.51.22/1.01.22/1.0CNGB3Not conductedNot conductedPresentNMNot conducted
#11M38.21.80.82/1.00.82/1.0CNGB33YesDecreasedNMNot conducted
#12M0.68.51.0/1.00.82/0.82PDE6C2YesPresentNMColor blindness
#13M0.6251.0/1.01.0/1.0PDE6C4NoDecreasedNMNot conducted
#14M4.33.31.0/1.31.1/1.0PDE6C2NoNormalNMColor blindness
#15F12.30.40.82/0.820.82/0.82PDE6C2NoPresentNMNot conducted
#16F1314.21.3/1.31.0/1.0PDE6C4NoDecreasedNMColor blindness
#17F11.314.71.0/0.821.0/1.0PDE6C3NoPresentNMNot conducted
#18M16.220.82/0.820.82/0.82PDE6C3NoPresentNMColor blindness
#19M47.20Not conductedNot conductedPDE6C4NoNot conductedNot conductedNot conducted
#20M9.72.41.52/1.521.4/1.4GNAT21NoPresentNMColor blindness
#21F11.9101.0/1.01.0/0.82GNAT21NoPresentNMN/A
OCT grade: 1, continuous inner segment ellipsoid (ISe); 2, ISe disruption; 3, hyporeflective zone in the ellipsoid zone; 4, outer retinal atrophy. Rod and cone responses in the ERG were assessed based on the data in Table 2. Abbreviations: LogMAR, logarithm of the minimum angle of resolution; OCT, optical coherence tomography; ERG, electroretinogram; NM, not measurable.
Table 2. Electroretinogram data.
No.DA 0.01
b-Wave Amplitude
LA 3.0LA 30 Hz
a-Wave Amplitudeb-Wave AmplitudeN1-P1 Amplitude
RELERELERELERELE
#12151967.547.930.4853.24NMNM
#33836.5NMNMNMNMNMNM
#440.869.4NMNMNMNMNMNM
#546.664.5NMNMNMNMNMNM
#63740.6Not conductedNot conductedNot conductedNot conductedNMNM
#933.328.8NMNMNMNMNMNM
#1041.38.3NMNMNMNMNMNM
#1144.962.7NMNMNMNMNMNM
#1244.031.1NMNMNMNMNMNM
#1367.193.57.03.0NMNMNMNM
#14NMNMNMNMNMNMNMNM
#1519.419.5NMNMNMNMNMNM
#1685.177.9NMNMNMNM3.641.62
#17183.9181.7NMNMNMNMNMNM
#1834.835.2NMNMNMNMNMNM
#207.931.1NMNMNMNMNMNM
#21176.3134.8NMNMNMNMNMNM
Abbreviations: DA, dark-adapted; LA, light-adapted; RE, right eye; LE, left eye; NM, not measurable.
Table 3. Genetic profiles.
No.GeneNucleotide VariationProtein VariationZygosityCADD PHRED Score (GRCh37-v1.6)Allele Frequency (%) in gnomADPathogenicity (ACMG Classification and Its Criteria)Previously Reported
#1CNGA3c.2T>A
c.1001C>T
p.(Met1?)
p.(Ser334Phe)
heterozygous22.8
26
P (PVS1, PM2, PP3)
LP
Novel
[20]
#2CNGA3c.829C>T
c.1001C>T
p.(Arg277Cys)
p.(Ser334Phe)
Compound heterozygous31
26
25/251350P
LP
[21]
[20]
#3CNGA3c.553C>G
c.1190G>T
p.(Leu185Val)
p.(Gly397Val)
Compound heterozygous20.5
25.7
LP
LP
[22]
[23]
#4CNGA3c.553C>G
c.848G>A
p.(Leu185Val)
p.(Arg283Gln)
Heterozygous20.5
28.8
1/251394
16/251352
LP
P
[22]
[21]
#5CNGA3c.1262del
c.1642G>A
p.(Lys421Serfs*44)
p.(Gly548Arg)
Compound heterozygous32
28.1
6/251292P
P
[24]
[25]
#6CNGA3c.553C>T
c.847C>T
p.(Leu185Val)
p.(Arg283Trp)
Heterozygous20.5
26.5
1/251394
25/251318
LP
LP
[22]
[26]
#7CNGA3c.829C>Tp.(Arg277Cys)Homozygous3124/251350P[21]
#8CNGA3c.158_161dup
c.1190G>T
p.(Arg55Aspfs*6)
p.(Gly397Val)
Heterozygous24
25.7
LP (PVS1, PM2)
LP
Novel
[22,23]
#9CNGB3c.1928+2T>C Homozygous33 P[24]
#10CNGB3c.1258_1277del
c.1579-2A>G
p.(Ile420Phefs*35)Compound heterozygous33
33
1/249908P (PVS1, PP1)
P
Novel
[27]
#11CNGB3c.1579-2A>G
Exon 16 deletion
Heterozygous331/249908P
LP (PVS1, PM2)
[27]
Novel
#12PDE6Cc.1771G>A
c.2269C>T
p.(Glu591Lys)
p.(Gln757*)
Compound heterozygous28.1
50
LP
LP (PVS1, PM2)
[28]
Novel
#13PDE6Cc.1646T>C
c.1766A>G
p.(Met549Thr)
p.(Asp589Gly)
Compound heterozygous22.5
24.6
2/251386LP
US
[8]
[29]
#14PDE6Cc.85C>T
c.712C>T
p.(Arg29Trp)
p.(Arg238*)
Heterozygous24.1
36
6/277228
2/246146
P
P
[30]
[31]
#15PDE6Cc.480G>T
Exon 1 deletion
p.(Lys160Asn)Compound heterozygous331/245444P
P (PVS1, PM2, PP3)
[32]
Novel
#16PDE6Cc.85C>T
c.1771G>A
p.(Arg29Trp)
p.(Glu591Lys)
Compound heterozygous24.1
28.1
6/282886
2/251120
P
LP
[30]
[28]
#17PDE6Cc.1643G>T
c.2507delG
p.(Trp548Leu)
p.(Gly836Glufs*21)
Heterozygous31
26.1
2/251354LP (PVS1, PP1)
P (PS3, PM1, PM2, PM3, PP3)
Novel
Novel
#18PDE6Cc.85C>T
c.827G>A
p.(Arg29Trp)
p.(Arg276Gln)
Compound heterozygous24.1
26.7
6/282886
5/282768
P
LP
[30]
[33]
#19PDE6Cc.1540T>A
c.1785G>A
p.(Phe514Ile)
p.(Met595Ile)
Heterozygous21.3
27.8
US (PM1, PM2, PM3)
US (PM2, PM3, PP3)
Novel
Novel
#20GNAT2c.481C>Tp.(Arg161*)Homozygous365/282860P[22]
#21GNAT2c.730_743del
c.481C>T
p.(His244Serfs*7)
p.(Arg161*)
Heterozygous34
36
5/152144LP (PVS1, PM2)
P
Novel
[22]
Abbreviations: P, pathogenic; LP, likely-pathogenic; US, Uncertain significance; ACMG, American College of Medical Genetics and Genomics.
Table 4. Comparison of patients with achromatopsia who were grouped by the causative genes with variants.
CharacteristicsCNGA3CNGB3PDE6CGNAT2p-Value
(PDE6C vs. CNGA3)
n, (%)8 (38.1)3 (14.3)8 (38.1)2 (9.5)N/A
Age7.6 ± 10.2 (0.6–30.7)13.8 ± 21.2 (0.5–38.2)13.2 ± 15.0 (0.6–47.2)10.8 ± 1.6 (9.7–11.9)0.430 a
BCVA (LogMAR)
Right0.93 ± 0.35 (0.52–1.40)1.12 ± 0.26 (0.82–1.30)1.00 ± 0.16 (0.82–1.30)1.26 ± 0.37 (1.00–1.52)0.443 a
Left0.95 ± 0.29 (0.52–1.40)1.10 ± 0.17 (1.00–1.30)1.01 ± 0.21 (0.82–1.30)1.26 ± 0.37 (1.00–1.52)0.676 a
Fundus 0.535 b
Normal6352
RPE change1000
Retina/RPE atrophy0020
ERG
Rod responseNormal/subnormal
Cone responseAbsent
Foveal hypoplasia 0.386 b
Yes3210
No5062
OCT grade (worse eye) 0.011 (1 vs. 2,3,4) b
15002
23030
30230
40020
a Mann–Whitney U test, b Boschloo’s exact test. Abbreviations: LogMAR, logarithm of the minimum angle of resolution; RPE, retinal pigment epithelium; ERG, electroretinogram; OCT, optical coherence tomography.
Table 5. Profiles of patients with achromatopsia worldwide.
NationNumber of Patients, nMutated Genes, (%)RemarksReference
CNGA3CNGB3PDE6CGNAT2
Korea1938.114.338.19.5Longitudinal analysisThis study
China11981.55.910.10.8Identification of variants in ATF6 (1.7%)[7]
Netherland634.887N/A0High proportion of CNGB3:p.T383IfsX13 (80%)[35]
UK/US404537.52.510Long term follow-up[1]
Italia1838.927.85.616.7High proportion of homozygotes (61.9%)[4]
Disclaimer/Publisher’s Note: The statements, opinions and data contained in all publications are solely those of the individual author(s) and contributor(s) and not of MDPI and/or the editor(s). MDPI and/or the editor(s) disclaim responsibility for any injury to people or property resulting from any ideas, methods, instructions or products referred to in the content.

