
Structural and Functional Classification of G-Quadruplex Families within the Human Genome

Abstract
:1. Introduction
1.1. Roles of G-quadruplexes
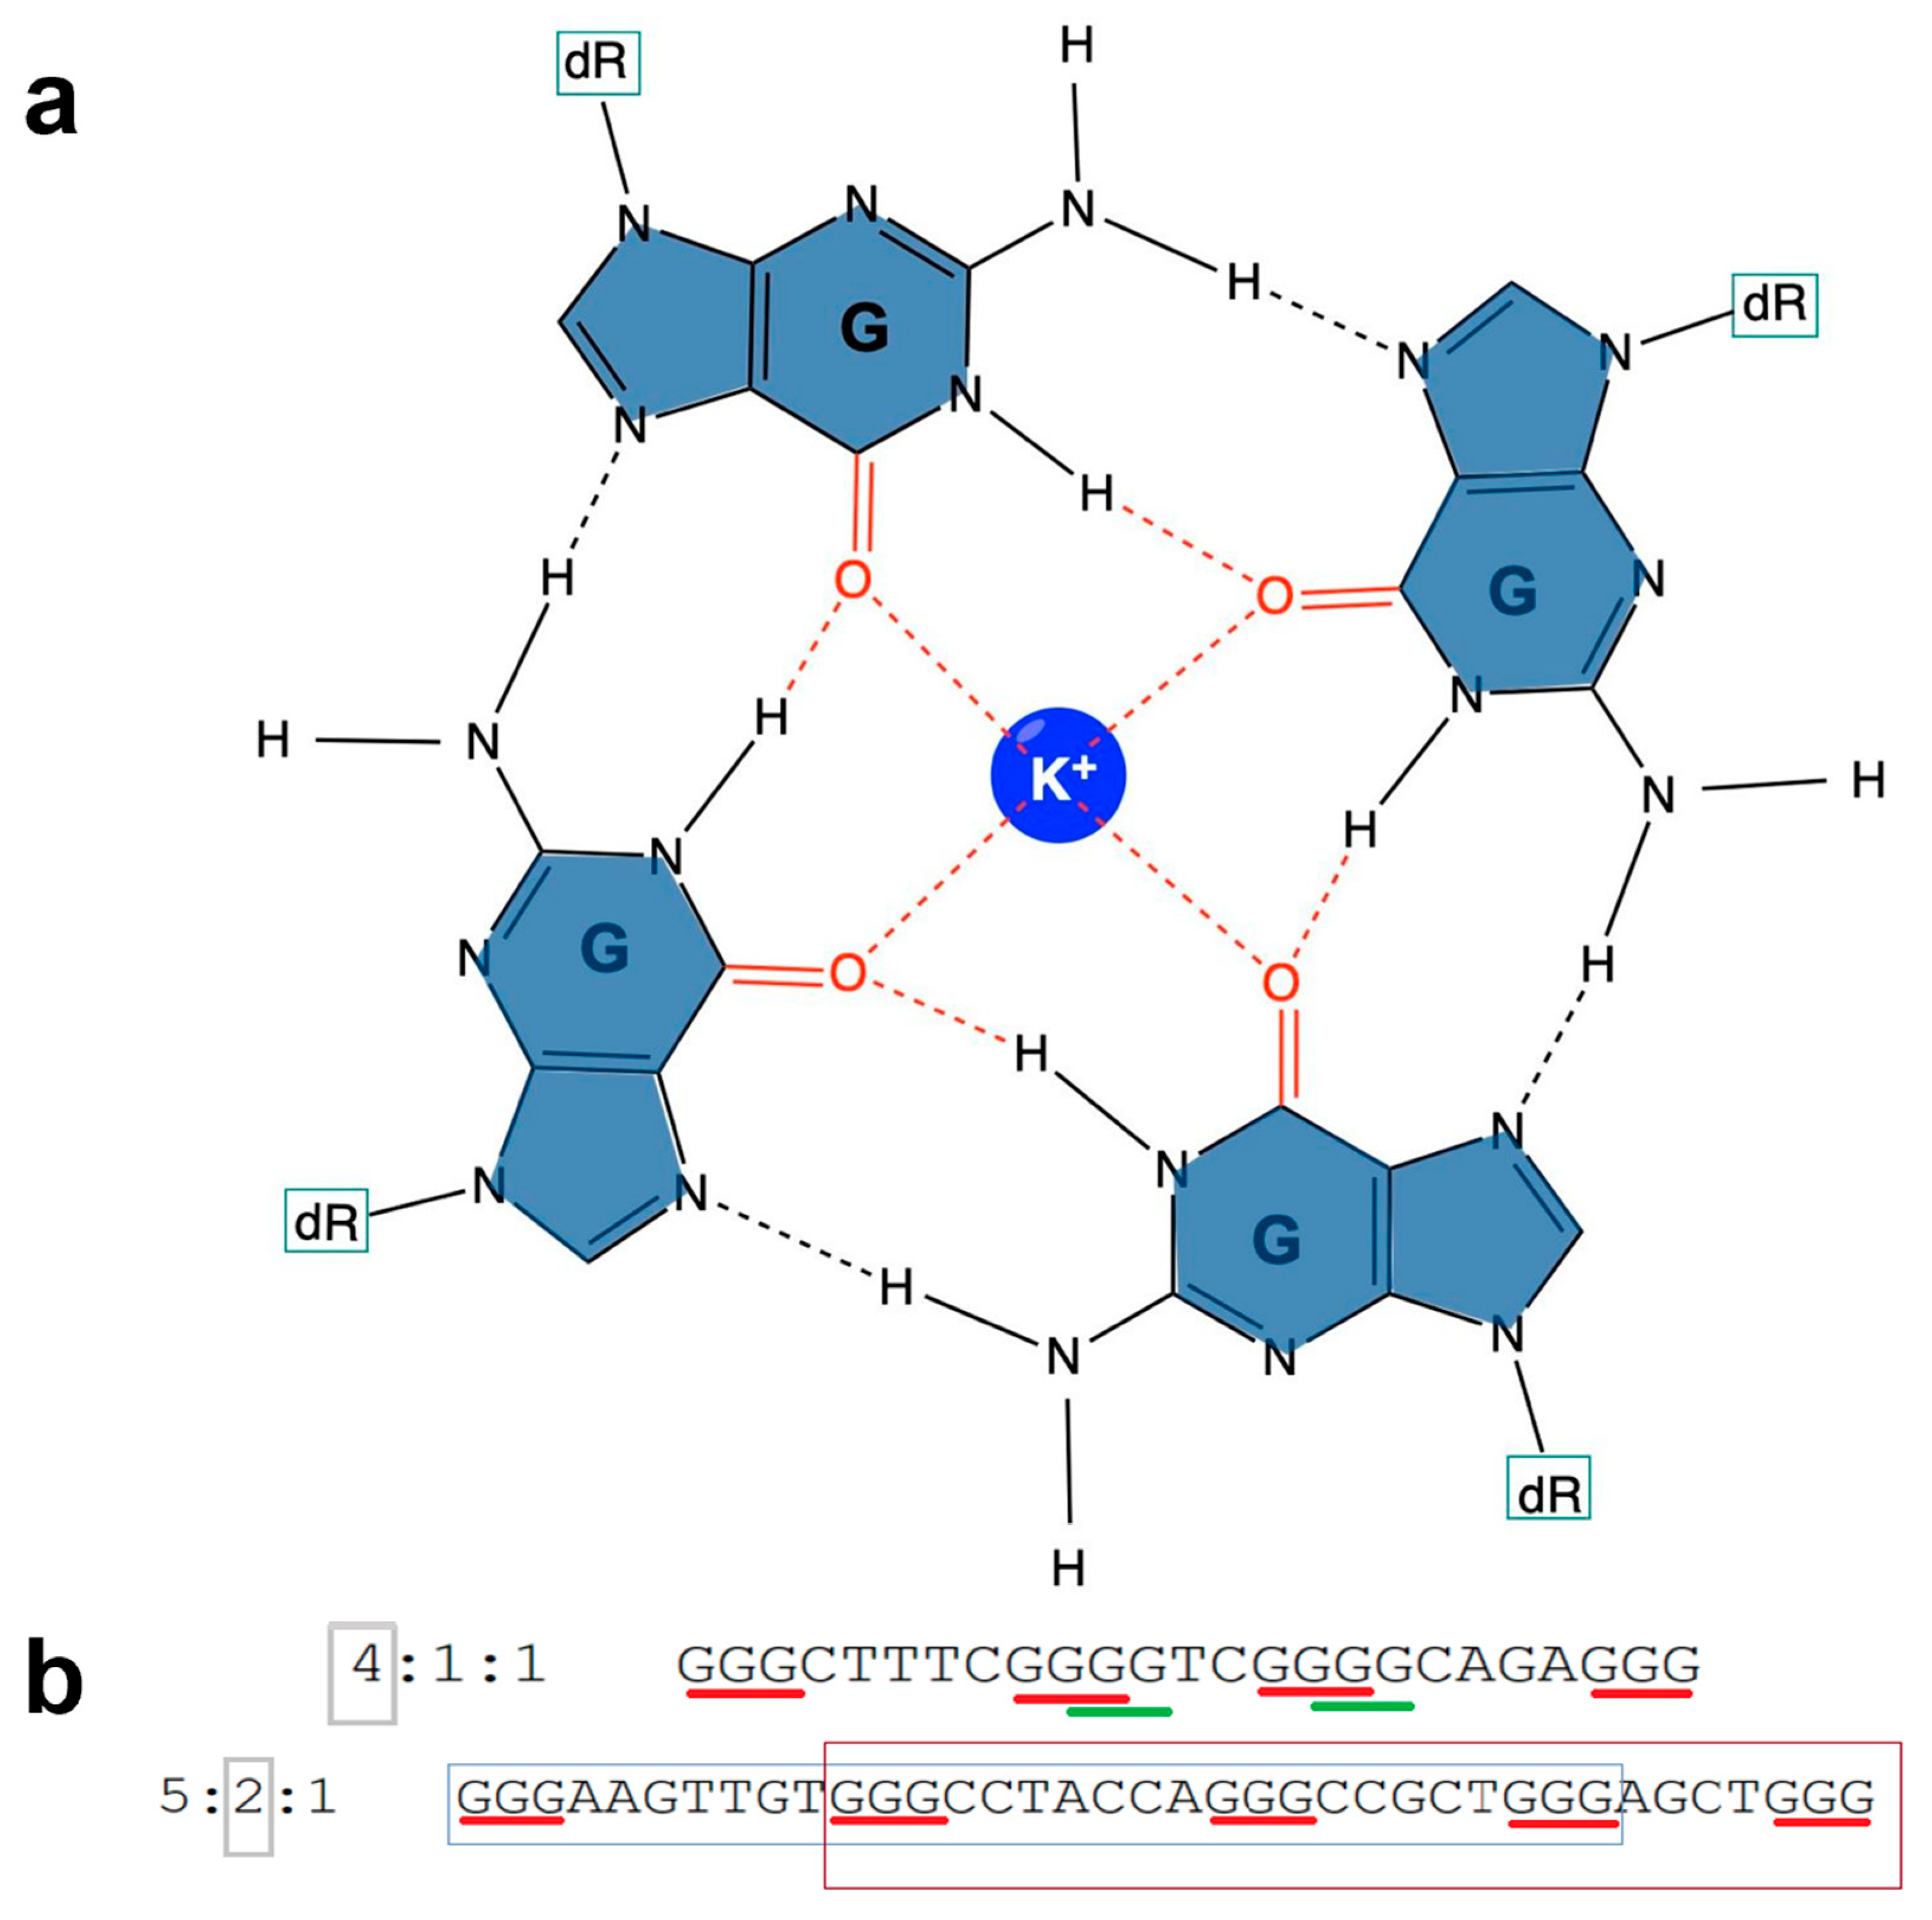
1.2. Characteristics of G4s
1.3. G4 Families
1.4. Detection of G4 Families
2. Materials and Methods
Dataset Preparation
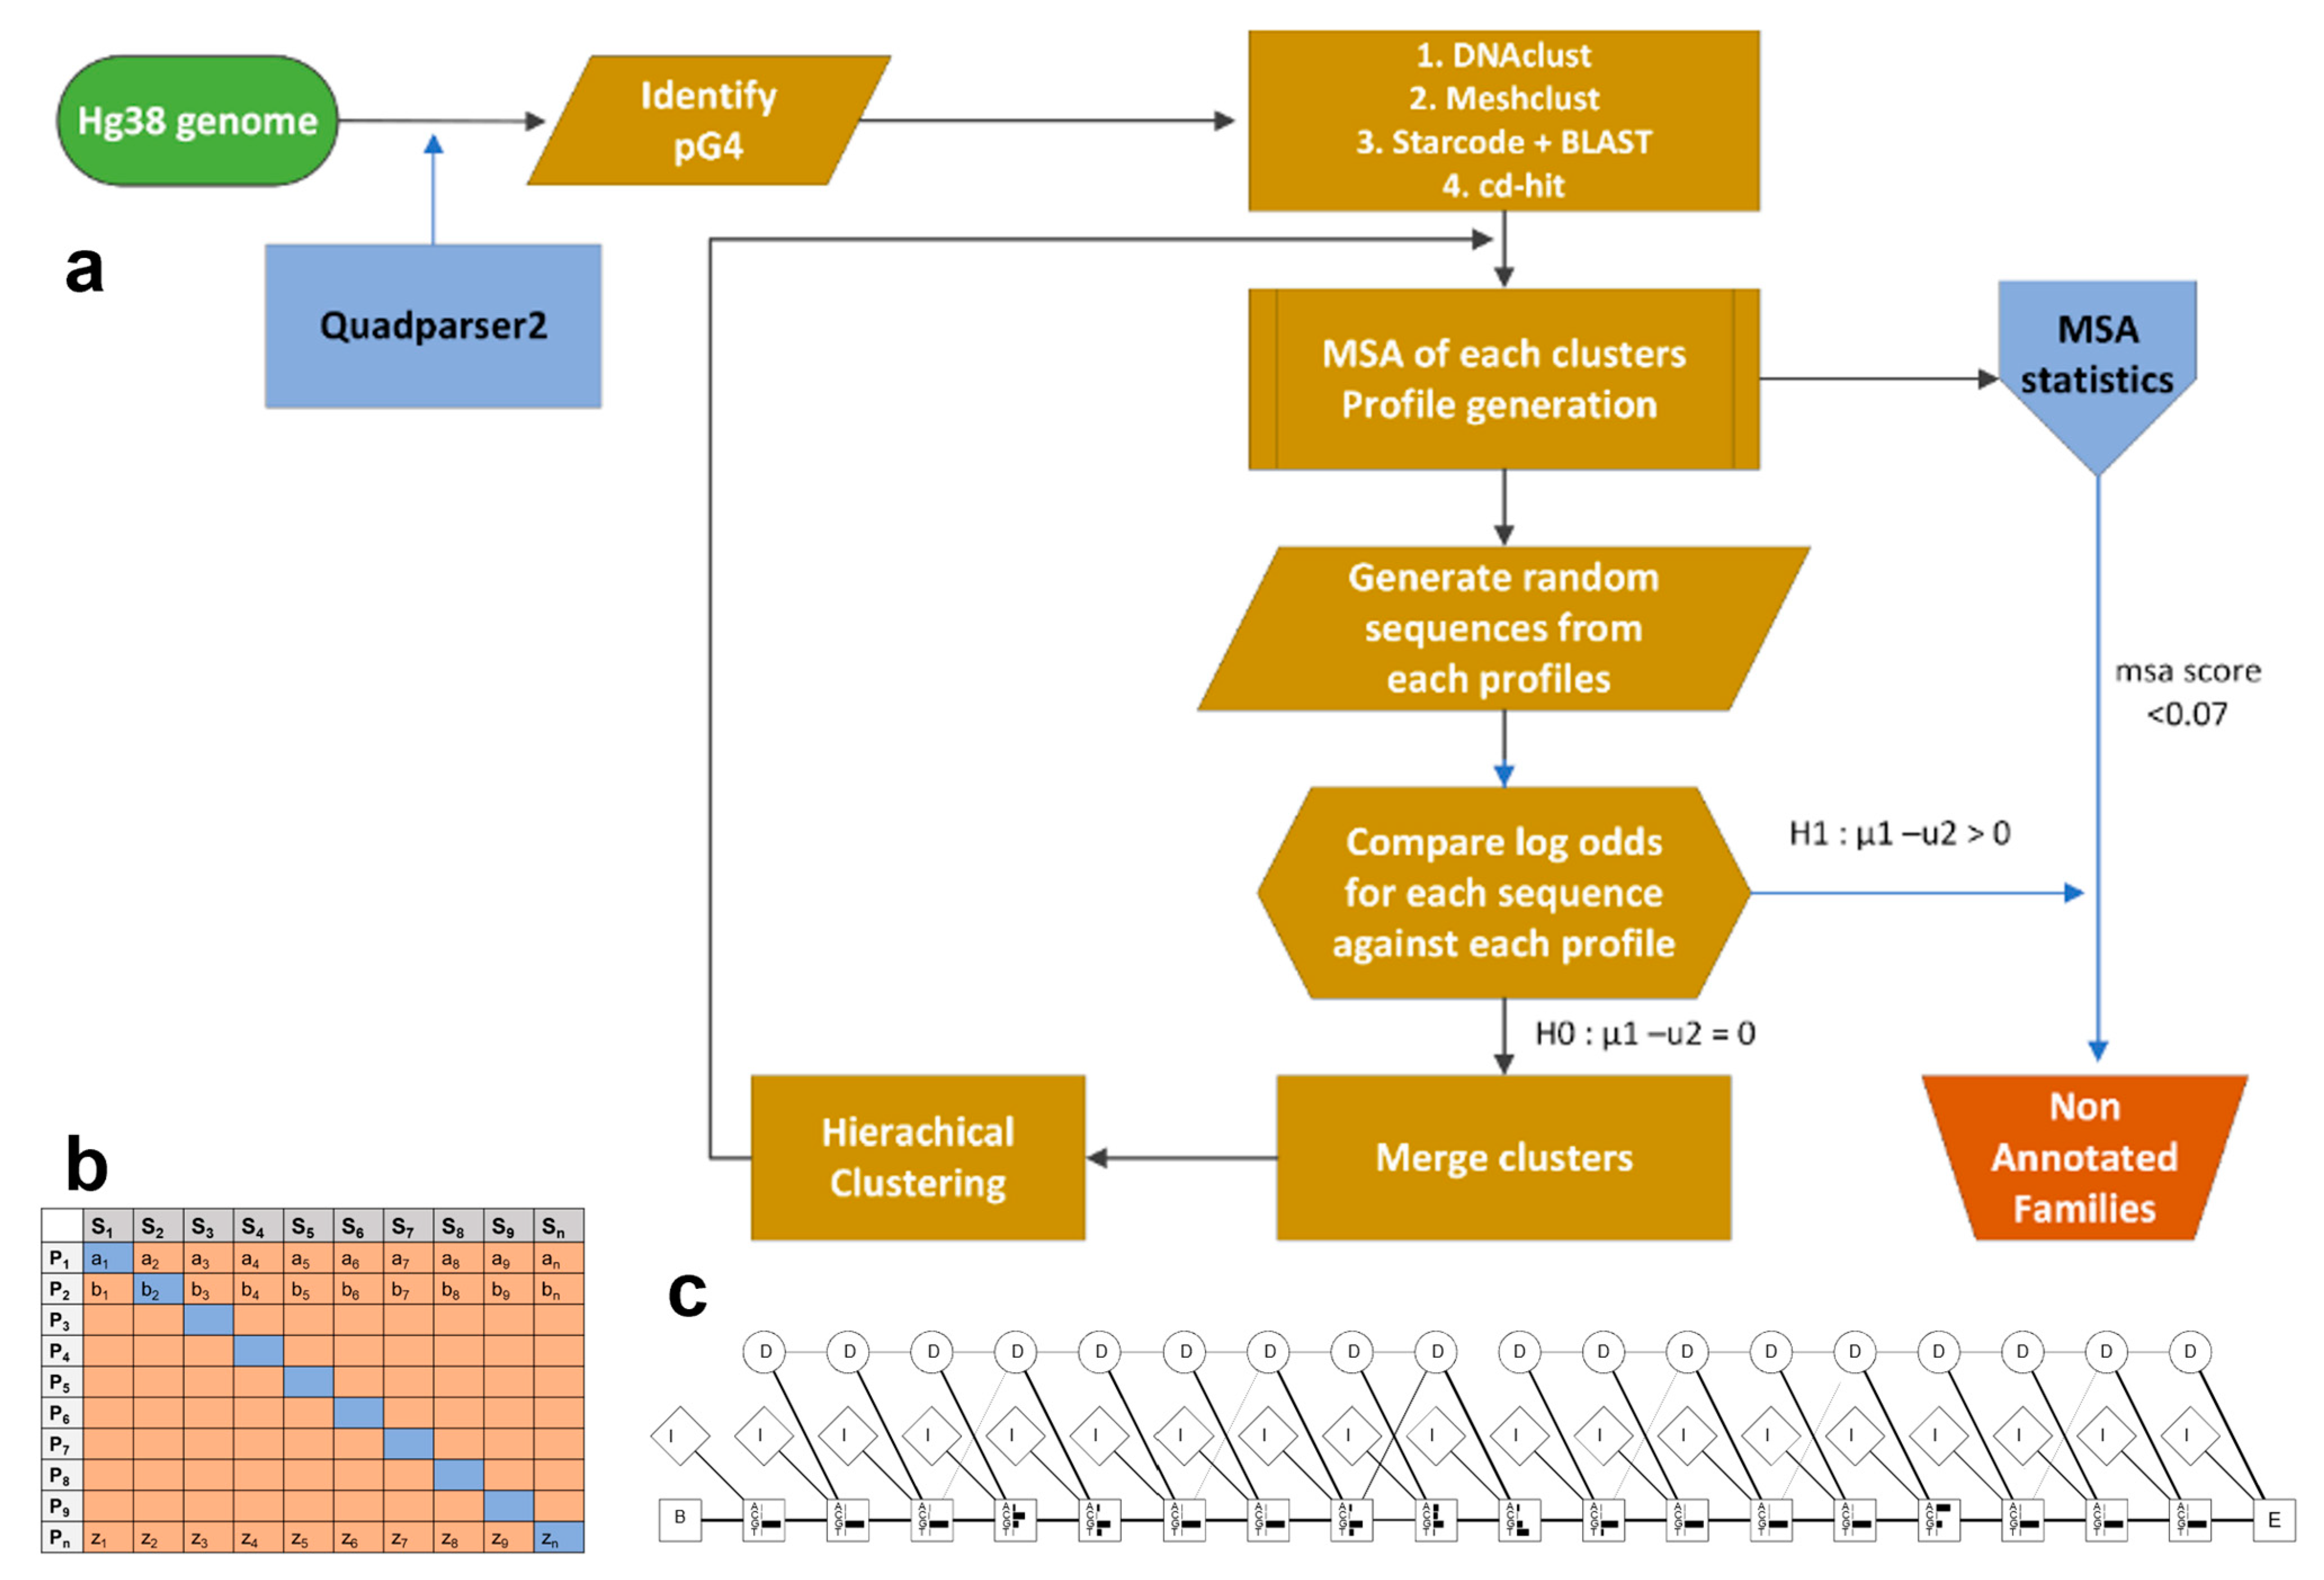
- CD-hit, MeShClust, DNAclust, and a combination of Starcode and BLAST with hierarchical clustering are utilized for the initial clustering of G-quadruplex sequences.
- Steps (3)–(7) are repeated separately for each clustering method.
- A multiple sequence alignment (MSA) of each cluster of sequences is carried out in R using the DECIPHER package [66]. The StaggerAlignment and AdjustAlignment functions are used to separate regions of alignment and gaps are shifted to improve the alignment.
- Clusters with fewer than four sequences are filtered out. An MSA score for each cluster is calculated as the average number of gaps in each column of an alignment divided by the length using MStatX [67].
- Each alignment is trained as a model profile HMM using HMMER 3.0 [68] and the aphid package [69] in R version 3.4.1 independently. The transition and emission probability matrices are estimated based on the plan7 PHMM model based on Durbin [60]. An example of a profile HMM stating match, insert and delete state is shown in Figure 2b. There are seven outgoing transitions based on the match, insert and delete states, i.e., In → In, Mn → In, Mn → Mn+1, Mn → Dn+1; Dn → Mn+1, Dn → Dn+1; In → Mn+1 where n represents each position of the alignment (except the final position). The observed counts of emissions and state transitions are converted into probabilities.
- The sequences in each cluster are used as input for all the profiles and the log odds scores are generated using the forward algorithm.
- A pairwise Wilcoxon rank sum test is carried out to compare each profile using the log odds between the profile HMM through which the sequences were generated and all other profiles (Figure 2c). If a profile is diverse (p-value < 0.05) against all compared profiles, has a probability of 0.99 for the tested sequences, and has a gap score less than a threshold of 0.10, the profile is saved as a family. For the sequences that are non-significant (p-value > 0.05) the sequences are input to the MSA and are merged and/or clustered using agglomerative clustering. Alignments with a gap score of 0.6 after merging are filtered. The process is iterated for a maximum of 100 times.
- The group of sequences obtained from all the methods is combined and checked for redundancy using a modification of step (7) utilizing a threshold score of log odds 5, Akaike weight of 0.7 and MSA gap score threshold of 0.07 for identifying the final families, which are added manually, checked, and filtered.
- The alignment and profile HMM are manually verified, resulting in 95 clusters referred to as families. Experimentally validated G-quadruplexes were obtained from processed peaks mapped to hg19 from GEO, accession GSE63874 [41] using bedtools [70] and quadparser2 after conversion to human genome hg38 coordinates by liftover. The models are used as a trained classifier to identify additional sequences. G4 sequences from experimental G4 seq were tested against the cluster HMMs. The likelihood that a query sequence fits the model of an individual family is calculated using the forward algorithm [71], and the normalized Akaike weights [72,73] are calculated. The maximum Akaike weight of the query given to a particular model is selected as the nearest family to the query sequence. The families are manually verified and the variability of sequences in the families is further analyzed based on the annotation of the G4, thermodynamic scores (folding energy), G4Hunter scores, and literature. The steps below highlight the method for the combination of Starcode and BLAST with hierarchical clustering.
- Levenshtein distance is used to identify the nearest group of sequences which are then filtered based on the length of the sequence and the number of G tetrads. Starcode [64] utilizes a modified Needleman-Wunsch dynamic programming approach known as the poucet algorithm for determining the initial and nearest groups of sequences. Sequences below a fixed Levenshtein score are used to identify the groups, and each group is filtered by the length of the sequence and loop sequence content. Using specific Levenshtein distance as a constraint through this algorithm, one or two nucleotide mismatches can be identified in short DNA sequences.
- The remaining sequences from step (1) that are not in any group are passed through BLAST for pairwise all vs. all BLAST. −log(E value) is used as the similarity metric.
- Hierarchical clustering is applied by comparing the agglomerative, Ward, complete, and divisive methods of clustering. The number of clusters is calculated based on the sum of the within-cluster inertia. The optimal number of clusters is the maximum difference from two successive clusters between the groups, i.e., max (Im/Im+1). The mode of the number of clusters was selected as the optimal cluster.
- Pairwise alignment of sequences of individual clusters obtained from steps (a) and (c) is carried out using the pairwise alignment function in the Biostrings [74] package. Hierarchical clustering of the sequences is performed based on the pairwise distance. The Consensus of Silhouette [75], Frey index, Macclain Index, Cindex, and Dunn index were used for identifying the optimal number of clusters. The metrics are calculated using the NbClust package [76] in R.
3. Results
3.1. G-quadruplex Families
3.2. Categorical Enrichment of Select Families
3.3. Thermodynamic Properties of Select Families
3.4. Classification of Experimentally Validated G4 Sequences
3.5. G4 Repeat and Loop Length Characteristics
3.6. G4 in Enhancers
4. Discussion
Supplementary Materials
Author Contributions
Funding
Institutional Review Board Statement
Informed Consent Statement
Data Availability Statement
Acknowledgments
Conflicts of Interest
References
- Lim, K.W.; Amrane, S.; Bouaziz, S.; Xu, W.; Mu, Y.; Patel, D.J.; Luu, K.N.; Phan, A.T. Structure of the human telomere in K+ solution: A stable basket-type G-quadruplex with only two G-tetrad layers. J. Am. Chem. Soc. 2009, 131, 4301–4309. [Google Scholar] [CrossRef] [Green Version]
- Lago, S.; Nadai, M.; Cernilogar, F.M.; Kazerani, M.; Domíniguez Moreno, H.; Schotta, G.; Richter, S.N. Promoter G-quadruplexes and transcription factors cooperate to shape the cell type-specific transcriptome. Nat. Commun. 2021, 12, 3885. [Google Scholar] [CrossRef]
- Hänsel-Hertsch, R.; Simeone, A.; Shea, A.; Hui, W.W.; Zyner, K.G.; Marsico, G.; Rueda, O.M.; Bruna, A.; Martin, A.; Zhang, X. Landscape of G-quadruplex DNA structural regions in breast cancer. Nat. Genet. 2020, 52, 878–883. [Google Scholar] [CrossRef]
- Biffi, G.; Tannahill, D.; Miller, J.; Howat, W.J.; Balasubramanian, S. Elevated levels of G-quadruplex formation in human stomach and liver cancer tissues. PloS ONE 2014, 9, e102711. [Google Scholar] [CrossRef] [PubMed] [Green Version]
- Liu, G.; Du, W.; Xu, H.; Sun, Q.; Tang, D.; Zou, S.; Zhang, Y.; Ma, M.; Zhang, G.; Du, X. RNA G-quadruplex regulates microRNA-26a biogenesis and function. J. Hepatol. 2020, 73, 371–382. [Google Scholar] [CrossRef] [PubMed]
- Wang, E.; Thombre, R.; Shah, Y.; Latanich, R.; Wang, J. G-Quadruplexes as pathogenic drivers in neurodegenerative disorders. Nucleic Acids Res. 2021, 49, 4816–4830. [Google Scholar] [CrossRef]
- Biffi, G.; Tannahill, D.; McCafferty, J.; Balasubramanian, S. Quantitative visualization of DNA G-quadruplex structures in human cells. Nat. Chem. 2013, 5, 182–186. [Google Scholar] [CrossRef]
- Fernando, H.; Sewitz, S.; Darot, J.; Tavare, S.; Huppert, J.L.; Balasubramanian, S. Genome-wide analysis of a G-quadruplex-specific single-chain antibody that regulates gene expression. Nucleic Acids Res. 2009, 37, 6716–6722. [Google Scholar] [CrossRef] [PubMed] [Green Version]
- Kouzine, F.; Wojtowicz, D.; Yamane, A.; Casellas, R.; Przytycka, T.M.; Levens, D.L. In vivo chemical probing for G-quadruplex formation. In G-Quadruplex Nucleic Acids; Springer: Berlin/Heidelberg, Germany, 2019; pp. 369–382. [Google Scholar]
- Ruttkay-Nedecky, B.; Kudr, J.; Nejdl, L.; Maskova, D.; Kizek, R.; Adam, V. G-quadruplexes as sensing probes. Molecules 2013, 18, 14760–14779. [Google Scholar] [CrossRef]
- Todd, A.K.; Neidle, S. The relationship of potential G-quadruplex sequences in cis-upstream regions of the human genome to SP1-binding elements. Nucleic Acids Res. 2008, 36, 2700–2704. [Google Scholar] [CrossRef] [Green Version]
- Chariker, J.H.; Miller, D.M.; Rouchka, E.C. Computational analysis of G-quadruplex forming sequences across chromosomes reveals high density patterns near the terminal ends. PloS ONE 2016, 11, e0165101. [Google Scholar] [CrossRef] [Green Version]
- Hänsel-Hertsch, R.; Beraldi, D.; Lensing, S.V.; Marsico, G.; Zyner, K.; Parry, A.; Di Antonio, M.; Pike, J.; Kimura, H.; Narita, M. G-quadruplex structures mark human regulatory chromatin. Nat. Genet. 2016, 48, 1267–1272. [Google Scholar] [CrossRef] [Green Version]
- Risitano, A.; Fox, K.R. Influence of loop size on the stability of intramolecular DNA quadruplexes. Nucleic Acids Res. 2004, 32, 2598–2606. [Google Scholar] [CrossRef] [Green Version]
- Sattin, G.; Artese, A.; Nadai, M.; Costa, G.; Parrotta, L.; Alcaro, S.; Palumbo, M.; Richter, S.N. Conformation and stability of intramolecular telomeric G-quadruplexes: Sequence effects in the loops. PLoS ONE 2013, 8, e84113. [Google Scholar] [CrossRef] [PubMed] [Green Version]
- Tippana, R.; Xiao, W.; Myong, S. G-quadruplex conformation and dynamics are determined by loop length and sequence. Nucleic Acids Res. 2014, 42, 8106–8114. [Google Scholar] [CrossRef] [PubMed] [Green Version]
- Guédin, A.; De Cian, A.; Gros, J.; Lacroix, L.; Mergny, J.-L. Sequence effects in single-base loops for quadruplexes. Biochimie 2008, 90, 686–696. [Google Scholar] [CrossRef] [PubMed]
- Li, Y.Y.; Dubins, D.N.; Le, D.M.N.T.; Leung, K.; Macgregor, R.B., Jr. The role of loops and cation on the volume of unfolding of G-quadruplexes related to HTel. Biophys. Chem. 2017, 231, 55–63. [Google Scholar] [CrossRef]
- Li, Y.Y.; Macgregor, R.B., Jr. A thermodynamic study of adenine and thymine substitutions in the loops of the oligodeoxyribonucleotide HTel. J. Phys. Chem. B 2016, 120, 8830–8836. [Google Scholar] [CrossRef]
- Piazza, A.; Adrian, M.; Samazan, F.; Heddi, B.; Hamon, F.; Serero, A.; Lopes, J.; Teulade-Fichou, M.P.; Phan, A.T.; Nicolas, A. Short loop length and high thermal stability determine genomic instability induced by G-quadruplex-forming minisatellites. EMBO J. 2015, 34, 1718–1734. [Google Scholar] [CrossRef] [Green Version]
- Rachwal, P.A.; Brown, T.; Fox, K.R. Sequence effects of single base loops in intramolecular quadruplex DNA. FEBS Lett. 2007, 581, 1657–1660. [Google Scholar] [CrossRef] [Green Version]
- Hazel, P.; Huppert, J.; Balasubramanian, S.; Neidle, S. Loop-length-dependent folding of G-quadruplexes. J. Am. Chem. Soc. 2004, 126, 16405–16415. [Google Scholar] [CrossRef] [PubMed]
- Lago, S.; Tosoni, E.; Nadai, M.; Palumbo, M.; Richter, S.N. The cellular protein nucleolin preferentially binds long-looped G-quadruplex nucleic acids. Biochim. Biophys. Acta (BBA)-Gen. Subj. 2017, 1861, 1371–1381. [Google Scholar] [CrossRef] [PubMed]
- Takahama, K.; Sugimoto, C.; Arai, S.; Kurokawa, R.; Oyoshi, T. Loop lengths of G-quadruplex structures affect the G-quadruplex DNA binding selectivity of the RGG motif in Ewing’s sarcoma. Biochemistry 2011, 50, 5369–5378. [Google Scholar] [CrossRef] [PubMed]
- Huppert, J.L.; Balasubramanian, S. Prevalence of quadruplexes in the human genome. Nucleic Acids Res. 2005, 33, 2908–2916. [Google Scholar] [CrossRef] [PubMed] [Green Version]
- Kikin, O.; D'Antonio, L.; Bagga, P.S. QGRS Mapper: A web-based server for predicting G-quadruplexes in nucleotide sequences. Nucleic Acids Res. 2006, 34, W676–W682. [Google Scholar] [CrossRef]
- Bolduc, F.; Garant, J.-M.; Allard, F.; Perreault, J.-P. Irregular G-quadruplexes found in the untranslated regions of human mRNAs influence translation. J. Biol. Chem. 2016, 291, 21751–21760. [Google Scholar] [CrossRef] [Green Version]
- Lim, K.W.; Alberti, P.; Guedin, A.; Lacroix, L.; Riou, J.-F.; Royle, N.J.; Mergny, J.-L.; Phan, A.T.n. Sequence variant (CTAGGG) n in the human telomere favors a G-quadruplex structure containing a G· C· G· C tetrad. Nucleic Acids Res. 2009, 37, 6239–6248. [Google Scholar] [CrossRef]
- Mukundan, V.T.; Phan, A.T. Bulges in G-quadruplexes: Broadening the definition of G-quadruplex-forming sequences. J. Am. Chem. Soc. 2013, 135, 5017–5028. [Google Scholar] [CrossRef]
- Garant, J.-M.; Perreault, J.-P.; Scott, M.S. Motif independent identification of potential RNA G-quadruplexes by G4RNA screener. Bioinformatics 2017, 33, 3532–3537. [Google Scholar] [CrossRef] [Green Version]
- Hon, J.; Martínek, T.; Zendulka, J.; Lexa, M. pqsfinder: An exhaustive and imperfection-tolerant search tool for potential quadruplex-forming sequences in R. Bioinformatics 2017, 33, 3373–3379. [Google Scholar] [CrossRef] [Green Version]
- Doluca, O. G4Catchall: A G-quadruplex prediction approach considering atypical features. J. Theor. Biol. 2019, 463, 92–98. [Google Scholar] [CrossRef]
- Bedrat, A.; Lacroix, L.; Mergny, J.-L. Re-evaluation of G-quadruplex propensity with G4Hunter. Nucleic Acids Res. 2016, 44, 1746–1759. [Google Scholar] [CrossRef]
- Garant, J.-M.; Luce, M.J.; Scott, M.S.; Perreault, J.-P. G4RNA: An RNA G-quadruplex database. Database 2015, 2015, bav059. [Google Scholar] [CrossRef] [Green Version]
- Gruber, A.R.; Lorenz, R.; Bernhart, S.H.; Neuböck, R.; Hofacker, I.L. The vienna RNA websuite. Nucleic Acids Res. 2008, 36, W70–W74. [Google Scholar] [CrossRef] [Green Version]
- Lu, X.-J. DSSR-enabled innovative schematics of 3D nucleic acid structures with PyMOL. Nucleic Acids Res. 2020, 48, e74. [Google Scholar] [CrossRef] [PubMed]
- Zok, T.; Popenda, M.; Szachniuk, M. ElTetrado: A tool for identification and classification of tetrads and quadruplexes. BMC Bioinform. 2020, 21, 40. [Google Scholar] [CrossRef]
- Patro, L.P.P.; Kumar, A.; Kolimi, N.; Rathinavelan, T. 3D-NuS: A web server for automated modeling and visualization of non-canonical 3-dimensional nucleic acid structures. J. Mol. Biol. 2017, 429, 2438–2448. [Google Scholar] [CrossRef]
- Capra, J.A.; Paeschke, K.; Singh, M.; Zakian, V.A. G-quadruplex DNA sequences are evolutionarily conserved and associated with distinct genomic features in Saccharomyces cerevisiae. PLoS Comput. Biol. 2010, 6, e1000861. [Google Scholar] [CrossRef] [PubMed]
- Wu, F.; Niu, K.; Cui, Y.; Li, C.; Lyu, M.; Ren, Y.; Chen, Y.; Deng, H.; Huang, L.; Zheng, S. Genome-wide analysis of DNA G-quadruplex motifs across 37 species provides insights into G4 evolution. Commun. Biol. 2021, 4, 98. [Google Scholar] [CrossRef] [PubMed]
- Chambers, V.S.; Marsico, G.; Boutell, J.M.; Di Antonio, M.; Smith, G.P.; Balasubramanian, S. High-throughput sequencing of DNA G-quadruplex structures in the human genome. Nat. Biotechnol. 2015, 33, 877–881. [Google Scholar] [CrossRef] [PubMed] [Green Version]
- Marsico, G.; Chambers, V.S.; Sahakyan, A.B.; McCauley, P.; Boutell, J.M.; Antonio, M.D.; Balasubramanian, S. Whole genome experimental maps of DNA G-quadruplexes in multiple species. Nucleic Acids Res. 2019, 47, 3862–3874. [Google Scholar] [CrossRef] [PubMed] [Green Version]
- Seviour, T.; Winnerdy, F.R.; Wong, L.L.; Shi, X.; Mugunthan, S.; Foo, Y.H.; Castaing, R.; Adav, S.S.; Subramoni, S.; Kohli, G.S. The biofilm matrix scaffold of Pseudomonas aeruginosa contains G-quadruplex extracellular DNA structures. Npj Biofilms Microbiomes 2021, 7, 27. [Google Scholar] [CrossRef] [PubMed]
- Shao, X.; Zhang, W.; Umar, M.I.; Wong, H.Y.; Seng, Z.; Xie, Y.; Zhang, Y.; Yang, L.; Kwok, C.K.; Deng, X. RNA G-quadruplex structures mediate gene regulation in bacteria. MBio 2020, 11, e02926-19. [Google Scholar] [CrossRef] [Green Version]
- Zheng, K.-W.; Zhang, J.-Y.; He, Y.-D.; Gong, J.-Y.; Wen, C.-J.; Chen, J.-N.; Hao, Y.-H.; Zhao, Y.; Tan, Z. Detection of genomic G-quadruplexes in living cells using a small artificial protein. Nucleic Acids Res. 2020, 48, 11706–11720. [Google Scholar] [CrossRef]
- Völkel, S.; Stielow, B.; Finkernagel, F.; Stiewe, T.; Nist, A.; Suske, G. Zinc finger independent genome-wide binding of Sp2 potentiates recruitment of histone-fold protein Nf-y distinguishing it from Sp1 and Sp3. PLoS Genet. 2015, 11, e1005102. [Google Scholar] [CrossRef]
- Raiber, E.-A.; Kranaster, R.; Lam, E.; Nikan, M.; Balasubramanian, S. A non-canonical DNA structure is a binding motif for the transcription factor SP1 in vitro. Nucleic Acids Res. 2012, 40, 1499–1508. [Google Scholar] [CrossRef] [PubMed] [Green Version]
- Da Ros, S.; Nicoletto, G.; Rigo, R.; Ceschi, S.; Zorzan, E.; Dacasto, M.; Giantin, M.; Sissi, C. G-Quadruplex modulation of SP1 functional binding sites at the KIT proximal promoter. Int. J. Mol. Sci. 2020, 22, 329. [Google Scholar] [CrossRef]
- Rezzoug, F.; Thomas, S.D.; Rouchka, E.C.; Miller, D.M. Discovery of a family of genomic sequences which interact specifically with the c-MYC promoter to regulate c-MYC expression. PloS ONE 2016, 11, e0161588. [Google Scholar] [CrossRef] [PubMed] [Green Version]
- David, A.P.; Margarit, E.; Domizi, P.; Banchio, C.; Armas, P.; Calcaterra, N.B. G-quadruplexes as novel cis-elements controlling transcription during embryonic development. Nucleic Acids Res. 2016, 44, 4163–4173. [Google Scholar] [CrossRef] [Green Version]
- Beaudoin, J.-D.; Perreault, J.-P. 5′-UTR G-quadruplex structures acting as translational repressors. Nucleic Acids Res. 2010, 38, 7022–7036. [Google Scholar] [CrossRef] [Green Version]
- Brooks, T.A.; Hurley, L.H. Targeting MYC expression through G-quadruplexes. Genes Cancer 2010, 1, 641–649. [Google Scholar] [CrossRef]
- Fleming, A.M.; Zhou, J.; Wallace, S.S.; Burrows, C.J. A role for the fifth G-track in G-quadruplex forming oncogene promoter sequences during oxidative stress: Do these “spare tires” have an evolved function? ACS Cent. Sci. 2015, 1, 226–233. [Google Scholar] [CrossRef]
- Cogoi, S.; Xodo, L.E. G-quadruplex formation within the promoter of the KRAS proto-oncogene and its effect on transcription. Nucleic Acids Res. 2006, 34, 2536–2549. [Google Scholar] [CrossRef]
- Agrawal, P.; Lin, C.; Mathad, R.I.; Carver, M.; Yang, D. The major G-quadruplex formed in the human BCL-2 proximal promoter adopts a parallel structure with a 13-nt loop in K+ solution. J. Am. Chem. Soc. 2014, 136, 1750–1753. [Google Scholar] [CrossRef] [PubMed]
- Bates, P.J.; Laber, D.A.; Miller, D.M.; Thomas, S.D.; Trent, J.O. Discovery and development of the G-rich oligonucleotide AS1411 as a novel treatment for cancer. Exp. Mol. Pathol. 2009, 86, 151–164. [Google Scholar] [CrossRef] [Green Version]
- Spiegel, J.; Cuesta, S.M.; Adhikari, S.; Hänsel-Hertsch, R.; Tannahill, D.; Balasubramanian, S. G-quadruplexes are transcription factor binding hubs in human chromatin. Genome Biol. 2021, 22, 117. [Google Scholar] [CrossRef]
- Jana, J.; Vianney, Y.M.; Schröder, N.; Weisz, K. Guiding the folding of G-quadruplexes through loop residue interactions. Nucleic Acids Res. 2022, 50, 7161–7175. [Google Scholar] [CrossRef]
- Marchand, A.; Gabelica, V. Folding and misfolding pathways of G-quadruplex DNA. Nucleic Acids Res. 2016, 50, 10999–11012. [Google Scholar] [CrossRef] [PubMed] [Green Version]
- Durbin, R.; Eddy, S.R.; Krogh, A.; Mitchison, G. Biological Sequence Analysis: Probabilistic Models of Proteins and Nucleic Acids; Cambridge University Press: Cambridge, UK, 1998. [Google Scholar]
- Li, W.; Godzik, A. Cd-hit: A fast program for clustering and comparing large sets of protein or nucleotide sequences. Bioinformatics 2006, 22, 1658–1659. [Google Scholar] [CrossRef] [Green Version]
- James, B.T.; Luczak, B.B.; Girgis, H.Z. MeShClust: An intelligent tool for clustering DNA sequences. Nucleic Acids Res. 2018, 46, e83. [Google Scholar] [CrossRef] [PubMed] [Green Version]
- Ghodsi, M.; Liu, B.; Pop, M. DNACLUST: Accurate and efficient clustering of phylogenetic marker genes. BMC Bioinform. 2011, 12, 271. [Google Scholar] [CrossRef] [Green Version]
- Zorita, E.; Cusco, P.; Filion, G.J. Starcode: Sequence clustering based on all-pairs search. Bioinformatics 2015, 31, 1913–1919. [Google Scholar] [CrossRef] [Green Version]
- Altschul, S.F.; Gish, W.; Miller, W.; Myers, E.W.; Lipman, D.J. Basic local alignment search tool. J. Mol. Biol. 1990, 215, 403–410. [Google Scholar] [CrossRef]
- Wright, E.S. DECIPHER: Harnessing local sequence context to improve protein multiple sequence alignment. BMC Bioinform. 2015, 16, 322. [Google Scholar] [CrossRef] [PubMed] [Green Version]
- Collet, G. Gcollet/MstatX: A Multiple Alignment Analyser. GitHub. Available online: https://github.com/gcollet/MstatX (accessed on 3 March 2023).
- Finn, R.D.; Clements, J.; Eddy, S.R. HMMER web server: Interactive sequence similarity searching. Nucleic Acids Res. 2011, 39, W29–W37. [Google Scholar] [CrossRef] [Green Version]
- Wilkinson, S.P. aphid: An R package for analysis with profile hidden Markov models. Bioinformatics 2019, 35, 3829–3830. [Google Scholar] [CrossRef]
- Quinlan, A.R.; Hall, I.M. BEDTools: A flexible suite of utilities for comparing genomic features. Bioinformatics 2010, 26, 841–842. [Google Scholar] [CrossRef] [Green Version]
- Rabiner, L.R. A tutorial on hidden Markov models and selected applications in speech recognition. Proc. IEEE 1989, 77, 257–286. [Google Scholar] [CrossRef] [Green Version]
- Johnson, J.B.; Omland, K.S. Model selection in ecology and evolution. Trends Ecol. Evol. 2004, 19, 101–108. [Google Scholar] [CrossRef]
- Wagenmakers, E.-J.; Farrell, S. AIC model selection using Akaike weights. Psychon. Bull. Rev. 2004, 11, 192–196. [Google Scholar] [CrossRef]
- Pages, H.; Aboyoun, P.; Gentleman, R.; DebRoy, S.; Pages, M.H.; DataImport, D.; BSgenome, S.; XStringSet-class, R.; MaskedXString-class, R.; XStringSet-io, R. Package ‘Biostrings’. Available online: https://bioconductor.org/packages/release/bioc/html/Biostrings.html (accessed on 3 March 2023).
- Rousseeuw, P.J. Silhouettes: A graphical aid to the interpretation and validation of cluster analysis. J. Comput. Appl. Math. 1987, 20, 53–65. [Google Scholar] [CrossRef] [Green Version]
- Charrad, M.; Ghazzali, N.; Boiteau, V.; Niknafs, A. NbClust: An R package for determining the relevant number of clusters in a data set. J. Stat. Softw. 2014, 61, 1–36. [Google Scholar] [CrossRef] [Green Version]
- Honig, B.; Nicholls, A. Classical electrostatics in biology and chemistry. Science 1995, 268, 1144–1149. [Google Scholar] [CrossRef] [Green Version]
- Rohs, R.; West, S.M.; Sosinsky, A.; Liu, P.; Mann, R.S.; Honig, B. The role of DNA shape in protein–DNA recognition. Nature 2009, 461, 1248–1253. [Google Scholar] [CrossRef] [Green Version]
- El Hassan, M.; Calladine, C. Propeller-twisting of base-pairs and the conformational mobility of dinucleotide steps in DNA. J. Mol. Biol. 1996, 259, 95–103. [Google Scholar] [CrossRef] [PubMed]
- Chiu, T.-P.; Comoglio, F.; Zhou, T.; Yang, L.; Paro, R.; Rohs, R. DNAshapeR: An R/Bioconductor package for DNA shape prediction and feature encoding. Bioinformatics 2016, 32, 1211–1213. [Google Scholar] [CrossRef] [Green Version]
- Fan, H.; Lu, J.; Guo, Y.; Li, D.; Zhang, Z.-M.; Tsai, Y.-H.; Pi, W.-C.; Ahn, J.H.; Gong, W.; Xiang, Y. BAHCC1 binds H3K27me3 via a conserved BAH module to mediate gene silencing and oncogenesis. Nat. Genet. 2020, 52, 1384–1396. [Google Scholar] [CrossRef]
- Guo, Y.; Zhao, S.; Wang, G.G. Polycomb gene silencing mechanisms: PRC2 chromatin targeting, H3K27me3'Readout', and phase separation-based compaction. Trends Genet. 2021, 37, 547–565. [Google Scholar] [CrossRef]
- Banerjee, K.; Wang, M.; Cai, E.; Fujiwara, N.; Baker, H.; Cave, J.W. Regulation of tyrosine hydroxylase transcription by hnRNP K and DNA secondary structure. Nat. Commun. 2014, 5, 5769. [Google Scholar] [CrossRef] [Green Version]
- Farhath, M.M.; Thompson, M.; Ray, S.; Sewell, A.; Balci, H.; Basu, S. G-Quadruplex-enabling sequence within the human tyrosine hydroxylase promoter differentially regulates transcription. Biochemistry 2015, 54, 5533–5545. [Google Scholar] [CrossRef]
- Janssen, B.J.; Robinson, R.A.; Pérez-Brangulí, F.; Bell, C.H.; Mitchell, K.J.; Siebold, C.; Jones, E.Y. Structural basis of semaphorin–plexin signalling. Nature 2010, 467, 1118–1122. [Google Scholar] [CrossRef] [Green Version]
- Takamatsu, H.; Kumanogoh, A. Diverse roles for semaphorin− plexin signaling in the immune system. Trends Immunol. 2012, 33, 127–135. [Google Scholar] [CrossRef] [PubMed]
- Kuryavyi, V.; Cahoon, L.A.; Seifert, H.S.; Patel, D.J. RecA-binding pilE G4 sequence essential for pilin antigenic variation forms monomeric and 5′ end-stacked dimeric parallel G-quadruplexes. Structure 2012, 20, 2090–2102. [Google Scholar] [CrossRef] [Green Version]
- González, V.; Hurley, L.H. The c-MYC NHE III1: Function and regulation. Annu. Rev. Pharmacol. Toxicol. 2010, 50, 111–129. [Google Scholar] [CrossRef]
- Hurley, L.H.; Von Hoff, D.D.; Siddiqui-Jain, A.; Yang, D. Drug targeting of the c-MYC promoter to repress gene expression via a G-quadruplex silencer element. In Seminars in Oncology; WB Saunders: Philadelphia, PA, USA, 2006; pp. 498–512. [Google Scholar]
- Siddiqui-Jain, A.; Grand, C.L.; Bearss, D.J.; Hurley, L.H. Direct evidence for a G-quadruplex in a promoter region and its targeting with a small molecule to repress c-MYC transcription. Proc. Natl. Acad. Sci. USA 2002, 99, 11593–11598. [Google Scholar] [CrossRef] [Green Version]
- Yang, D.; Hurley, L.H. Structure of the biologically relevant G-quadruplex in the c-MYC promoter. Nucl. Nucl. Nucleic Acids 2006, 25, 951–968. [Google Scholar] [CrossRef]
- Zhang, A.Y.; Bugaut, A.; Balasubramanian, S. A sequence-independent analysis of the loop length dependence of intramolecular RNA G-quadruplex stability and topology. Biochemistry 2011, 50, 7251–7258. [Google Scholar] [CrossRef] [Green Version]
- Li, J.; Chu, I.-T.; Yeh, T.-A.; Chen, D.-Y.; Wang, C.-L.; Chang, T.-C. Effects of length and loop composition on structural diversity and similarity of (G3TG3NmG3TG3) G-quadruplexes. Molecules 2020, 25, 1779. [Google Scholar] [CrossRef]
- Postel, E.; Berberich, S.; Flint, S.; Ferrone, C. Human c-myc transcription factor PuF identified as nm23-H2 nucleoside diphosphate kinase, a candidate suppressor of tumor metastasis. Science 1993, 261, 478–480. [Google Scholar] [CrossRef] [PubMed]
- Shan, C.; Lin, J.; Hou, J.-Q.; Liu, H.-Y.; Chen, S.-B.; Chen, A.-C.; Ou, T.-M.; Tan, J.-H.; Li, D.; Gu, L.-Q. Chemical intervention of the NM23-H2 transcriptional programme on c-MYC via a novel small molecule. Nucleic Acids Res. 2015, 43, 6677–6691. [Google Scholar] [CrossRef] [PubMed] [Green Version]
- González, V.; Hurley, L.H. The C-terminus of nucleolin promotes the formation of the c-MYC G-quadruplex and inhibits c-MYC promoter activity. Biochemistry 2010, 49, 9706–9714. [Google Scholar] [CrossRef] [PubMed] [Green Version]
- Bywater, M.J.; Poortinga, G.; Sanij, E.; Hein, N.; Peck, A.; Cullinane, C.; Wall, M.; Cluse, L.; Drygin, D.; Anderes, K. Inhibition of RNA polymerase I as a therapeutic strategy to promote cancer-specific activation of p53. Cancer Cell 2012, 22, 51–65. [Google Scholar] [CrossRef] [Green Version]
- Xu, H.; Di Antonio, M.; McKinney, S.; Mathew, V.; Ho, B.; O’Neil, N.J.; Santos, N.D.; Silvester, J.; Wei, V.; Garcia, J. CX-5461 is a DNA G-quadruplex stabilizer with selective lethality in BRCA1/2 deficient tumours. Nat. Commun. 2017, 8, 14432. [Google Scholar] [CrossRef] [PubMed] [Green Version]
- Leonetti, C.; Scarsella, M.; Riggio, G.; Rizzo, A.; Salvati, E.; D'Incalci, M.; Staszewsky, L.; Frapolli, R.; Stevens, M.F.; Stoppacciaro, A. G-quadruplex ligand RHPS4 potentiates the antitumor activity of camptothecins in preclinical models of solid tumors. Clin. Cancer Res. 2008, 14, 7284–7291. [Google Scholar] [CrossRef] [PubMed] [Green Version]
- Local, A.; Zhang, H.; Benbatoul, K.D.; Folger, P.; Sheng, X.; Tsai, C.-Y.; Howell, S.B.; Rice, W.G. APTO-253 Stabilizes G-quadruplex DNA, Inhibits MYC Expression, and Induces DNA Damage in Acute Myeloid Leukemia CellsAPTO-253 as a MYC Inhibitor and G4 Ligand for AML. Mol. Cancer Ther. 2018, 17, 1177–1186. [Google Scholar] [CrossRef] [PubMed] [Green Version]
- Zidanloo, S.G.; Hosseinzadeh Colagar, A.; Ayatollahi, H.; Raoof, J.-B. Downregulation of the WT1 gene expression via TMPyP4 stabilization of promoter G-quadruplexes in leukemia cells. Tumor Biol. 2016, 37, 9967–9977. [Google Scholar] [CrossRef]
- Tauchi, T.; Shin-Ya, K.; Sashida, G.; Sumi, M.; Nakajima, A.; Shimamoto, T.; Ohyashiki, J.H.; Ohyashiki, K. Activity of a novel G-quadruplex-interactive telomerase inhibitor, telomestatin (SOT-095), against human leukemia cells: Involvement of ATM-dependent DNA damage response pathways. Oncogene 2003, 22, 5338–5347. [Google Scholar] [CrossRef] [Green Version]
- Liu, J.; Deng, R.; Guo, J.; Zhou, J.; Feng, G.; Huang, Z.; Gu, L.; Zeng, Y.; Zhu, X. Inhibition of myc promoter and telomerase activity and induction of delayed apoptosis by SYUIQ-5, a novel G-quadruplex interactive agent in leukemia cells. Leukemia 2007, 21, 1300–1302. [Google Scholar] [CrossRef] [PubMed] [Green Version]


| Method | Number of Sequences | No of Clusters | No. of Sequences in 2 Largest Clusters | HMM Clusters (Sequences) | HMM Families, 1st Iteration (Sequences) | Final Families Selected (Sequences) |
|---|---|---|---|---|---|---|
| Starcode + BLAST with hierarchical clustering | 29,112 | 2717 | 419, 323 | 95 (842) | ||
| DNAclust | 9610 (4664) | 587 | 142, 126 | 31 (1165) | ||
| Cd-hit (kmer 8) | 6335 | 786 | 182, 115 | 30 (389) | ||
| Meshclust | 14,222 | 508 | 1720, 1410 | 72 (1843) | ||
| Total | 220 (3888) | 95 (2145) | ||||
| TRAINING | PREDICTED | ||||||||
|---|---|---|---|---|---|---|---|---|---|
| Family | G4s | Chrs | Distinct Sequences | Associated Genes | Consensus Using Training Sequences | G4s | Chrs | Distinct Sequences | Associated Genes |
| 1 | 15 | 12 | 5 | 14 | GGGGTGGGTGGGGAGGG | 643 | 24 | 118 | 468 |
| 2 | 8 | 5 | 7 | 8 | --GGGARKGGSCTGGGACAGGG | 25 | 13 | 25 | 29 |
| 3 | 10 | 6 | 6 | 7 | GGGAGGGGGCTGCWGGGATGGGGG | 270 | 22 | 257 | 219 |
| 4 | 9 | 7 | 8 | 9 | -GGGCTGGG-GMGGGAAGGAGAGGG | 106 | 22 | 106 | 95 |
| 5 | 8 | 6 | 7 | 7 | GGGKKGGGGWGAATRGGGCAYGGG- | 355 | 23 | 341 | 271 |
| 6 | 8 | 6 | 6 | 7 | -GGGGKCTCAGGGGCTGGGCAGRGGG | 213 | 23 | 200 | 183 |
| 7 | 7 | 7 | 7 | 7 | -GGGC-CCSKGGGCDGSGRGGMRGGG | 636 | 24 | 614 | 564 |
| 8 | 7 | 7 | 7 | 7 | GGG-MCTTGGGGGTKGGGASAA--GGG- | 376 | 23 | 369 | 311 |
| 9 | 10 | 9 | 8 | 10 | -GGGSTGGGGAGGGTGGG | 350 | 23 | 136 | 276 |
| 10 | 20 | 15 | 10 | 20 | GGGGTGGGGGTGGGAGGG | 261 | 23 | 107 | 187 |
| 11 | 15 | 12 | 8 | 15 | GGGRGKKKGGTGGGAGGG | 164 | 23 | 84 | 132 |
| 12 | 17 | 9 | 17 | 17 | GGGGC-CWGGG-TGGGA-AAGGG- | 347 | 24 | 330 | 289 |
| 13 | 64 | 20 | 62 | 62 | ---GG-RWGGGCYKGG-GGGCWGGG | 143 | 22 | 125 | 125 |
| 14 | 52 | 20 | 50 | 51 | -GGGRCGGGGCAGGGG-TG-GGG | 163 | 24 | 153 | 140 |
| 15 | 13 | 9 | 13 | 13 | GGGRRAWRGGGTGGGAGGG | 151 | 22 | 116 | 121 |
| 16 | 8 | 7 | 8 | 8 | GGGGATKDG-GGGAGGGAGGG | 152 | 23 | 134 | 113 |
| 17 | 23 | 11 | 16 | 23 | GGGAAGGG---TCAGGG-CCAGGG | 312 | 22 | 293 | 286 |
| 18 | 14 | 11 | 12 | 14 | GGGTGGGTGGGGKMAGGG | 439 | 23 | 242 | 345 |
| 19 | 8 | 8 | 8 | 8 | GGGCCMMGGGCTGGGGCAGGG | 59 | 19 | 59 | 63 |
| 20 | 8 | 6 | 7 | 8 | GGGWDGGSMRGGGCM--CAAGGG | 421 | 23 | 414 | 343 |
| 21 | 7 | 6 | 7 | 7 | GGGGC-AGGGGCAGGGDGTGAGGGG | 130 | 23 | 120 | 101 |
| 22 | 8 | 6 | 8 | 8 | -GGGCYAGGGT-TGGGWRAGGG | 60 | 22 | 49 | 44 |
| 23 | 163 | 23 | 118 | 122 | --GGGTKG--GKGRWG-GGRTGGGGG | 794 | 24 | 555 | 603 |
| 24 | 35 | 19 | 34 | 35 | GGGGGYRGGGSWGGGGWGGG | 107 | 21 | 91 | 84 |
| 25 | 39 | 18 | 32 | 37 | GGGRR-GGG-RTGGGG--CCKGGGG | 434 | 23 | 418 | 365 |
| 26 | 9 | 7 | 9 | 9 | -GGGGBWGGGGKSAGGGWGGG | 69 | 19 | 67 | 49 |
| 27 | 11 | 9 | 11 | 11 | -GGG-GCTGGGRMCWGGGCWGGG | 113 | 22 | 107 | 98 |
| 28 | 79 | 21 | 79 | 79 | GGGGA-WGGGMARGGGY-RGGG | 87 | 21 | 83 | 67 |
| 29 | 18 | 15 | 17 | 18 | GGGSHWGGGGGGKGGGRGGG | 108 | 21 | 103 | 98 |
| 30 | 12 | 6 | 12 | 12 | GGGGKRKGGGKMWGGGKGGG | 209 | 23 | 180 | 174 |
| 31 | 44 | 18 | 43 | 44 | GGGGMRGGGGKKGGGGTGGG | 107 | 23 | 94 | 88 |
| 32 | 90 | 23 | 85 | 88 | GGGSTGGGGKKGGGGSWGGG | 164 | 22 | 146 | 130 |
| 33 | 111 | 22 | 102 | 108 | GGGCTG-------GGGCKGGG--SCWGGG | 210 | 22 | 184 | 160 |
| 34 | 9 | 6 | 8 | 9 | GGGAATGGGGGGTGGGGG-GGGG | 101 | 22 | 98 | 70 |
| 35 | 25 | 16 | 25 | 25 | -GGGCA---GG-GGAGGGMYAGG-----GG | 179 | 22 | 173 | 148 |
| 36 | 52 | 20 | 46 | 48 | -GG--GCCTKGGGG---WGGGAGGG- | 540 | 23 | 497 | 439 |
| 37 | 7 | 6 | 5 | 7 | -GGGSCAGGGCCAGGGCCAGGG | 137 | 22 | 125 | 124 |
| 38 | 7 | 7 | 7 | 7 | GGGGYGGGGGR-CAGGGCCAGGG | 207 | 23 | 200 | 199 |
| 39 | 12 | 8 | 11 | 12 | GGGGAGRGTGGG-MAGGGTGGG | 145 | 24 | 143 | 111 |
| 40 | 21 | 13 | 16 | 20 | GGGYTGGGRA-TGGGTGGG | 489 | 23 | 289 | 348 |
| 41 | 11 | 8 | 10 | 11 | GGGM-CAGGGYKSSGGSSAGGG | 100 | 22 | 99 | 88 |
| 42 | 17 | 13 | 17 | 17 | GGGA-GGGAGGGRAACYYSRGG- | 534 | 23 | 522 | 415 |
| 43 | 17 | 11 | 17 | 17 | GGGGCCYGGGCCTGGGGAGGG | 68 | 22 | 64 | 73 |
| 44 | 9 | 6 | 9 | 9 | GGGC-YAGA-GGGTGGGYWGGG | 151 | 22 | 141 | 125 |
| 45 | 28 | 12 | 28 | 28 | -GGGSKK-KGGGCAGGGG--CAGGGG- | 207 | 23 | 196 | 151 |
| 46 | 8 | 7 | 8 | 8 | -GG-GKTGGGGGMWGGGRGGRGGG | 83 | 21 | 77 | 61 |
| 47 | 21 | 13 | 17 | 20 | --GGGGTGGGA--GGGATGGYGGGG- | 134 | 21 | 118 | 101 |
| 48 | 21 | 13 | 21 | 21 | -GG-GRTTGGGGGT-GG-GG-RTGGGG | 776 | 24 | 724 | 547 |
| 49 | 29 | 10 | 12 | 12 | -GGGGGCAGGGCYGGG-GCTGGG | 54 | 21 | 44 | 43 |
| 50 | 32 | 19 | 30 | 32 | -GGGAGAGGGT--TKGGKGR--AGGG | 271 | 23 | 252 | 221 |
| 51 | 12 | 7 | 9 | 10 | -GGGGTGGGCAGGGMAGMYTGGG | 141 | 24 | 136 | 118 |
| 52 | 9 | 8 | 9 | 9 | GGGCCCCSGGGGCGGGGCGGG | 265 | 24 | 264 | 309 |
| 53 | 56 | 19 | 54 | 50 | --GGGDGT-G-G-GSGG-AGGGAGGG-- | 155 | 22 | 145 | 127 |
| 54 | 33 | 18 | 31 | 33 | GGG-CTCR-GG-RMAGGG-CTGGG | 214 | 24 | 206 | 196 |
| 55 | 21 | 16 | 21 | 21 | -GGGYR-GGGGTGG-GGGGC---RGGG | 111 | 23 | 110 | 112 |
| 56 | 9 | 7 | 9 | 9 | -GGGGTGGGGTKGGGG-GKRGAGGG | 332 | 24 | 319 | 258 |
| 57 | 14 | 11 | 9 | 14 | GGGSC-GGGGCGGGCGGGG | 314 | 23 | 164 | 328 |
| 58 | 27 | 9 | 15 | 14 | -GGGCTGGGKGRGGGGA-GCAGGG | 155 | 23 | 132 | 110 |
| 59 | 44 | 16 | 44 | 44 | GGG-SAGGGC-KGGGADRGGGG | 265 | 23 | 247 | 226 |
| 60 | 8 | 7 | 8 | 8 | -GGGGGTGGGGG--RRWGGGSAGGG | 124 | 21 | 115 | 98 |
| 61 | 10 | 1 | 9 | 8 | GGGACTYRTGGGCTTTGGGCCAAGGG-- | 106 | 21 | 105 | 106 |
| 62 | 10 | 4 | 8 | 6 | GGGGAGACTGGGGAGGCCGGGGYRGAAGGGG | 73 | 20 | 64 | 45 |
| 63 | 97 | 24 | 1 | 97 | GGGAGGGAGGGAGGG | 313 | 23 | 1 | 204 |
| 64 | 31 | 9 | 16 | 12 | -GGGGTGKG-GGGGGGRMSGGGG | 54 | 17 | 42 | 29 |
| 65 | 16 | 11 | 9 | 15 | GGG-GARTGGGCYGGGATGGG- | 97 | 21 | 86 | 72 |
| 66 | 58 | 21 | 49 | 53 | -GG-----STGGG--CCYTG--GGK-TG--GGG | 268 | 23 | 260 | 236 |
| 67 | 6 | 4 | 6 | 6 | GGGGTGGG-CATGGGAG-GCAGGG- | 214 | 23 | 200 | 171 |
| 68 | 13 | 1 | 12 | 12 | -GGGGAGG-GGGGTGCCCTGGGTTGGG- | 138 | 20 | 118 | 119 |
| 69 | 11 | 7 | 8 | 11 | GGGCAW-GAGGG-A-G-GGKTGGG | 129 | 22 | 119 | 99 |
| 70 | 19 | 11 | 14 | 16 | GGGRGKTGGGTGGGGGTGGG | 202 | 23 | 155 | 161 |
| 71 | 6 | 5 | 5 | 5 | GGGGAAGGGACAGGGGMMRGGG | 162 | 23 | 157 | 157 |
| 72 | 10 | 8 | 8 | 10 | GGGSWG-CAGGG---AGGGCTGGG- | 206 | 22 | 188 | 158 |
| 73 | 12 | 10 | 11 | 12 | GGGTG-GGGTGGGGK-KRGATGGG- | 947 | 23 | 917 | 664 |
| 74 | 12 | 8 | 12 | 11 | GGGTGGGGRCAAGGGTRGGG | 142 | 22 | 129 | 119 |
| 75 | 18 | 10 | 13 | 16 | -GG-GGTGGGA-GGGCMKGGG | 343 | 23 | 180 | 265 |
| 76 | 6 | 4 | 6 | 6 | GGGGTGGGTGGGG-RATGAGGGG | 451 | 24 | 420 | 329 |
| 77 | 19 | 13 | 19 | 19 | -GGRRWGGGGRA--ARGAGGGAGGG | 296 | 23 | 290 | 223 |
| 78 | 10 | 9 | 10 | 10 | GGGGAMT-TGGGGGKGGGG-GGG | 329 | 24 | 321 | 268 |
| 79 | 130 | 22 | 99 | 128 | -GGGMGGGG-CGGGGCG--GGG | 712 | 24 | 400 | 677 |
| 80 | 21 | 12 | 21 | 21 | GGG-GCGGGSC---SSGGGGGMGGG- | 406 | 23 | 389 | 418 |
| 81 | 13 | 10 | 13 | 13 | GGGGRAGGG-T-GGGCTTTGGGG | 347 | 23 | 329 | 270 |
| 82 | 38 | 20 | 13 | 34 | GGGCAGGGCAGGG-CAGGG | 391 | 24 | 211 | 284 |
| 83 | 10 | 5 | 8 | 10 | GGGT-CTGGGT--CTGGGTCWGGG- | 116 | 23 | 111 | 102 |
| 84 | 6 | 4 | 5 | 5 | -GGGGCCGGGGTGGGARGYGGG | 66 | 21 | 64 | 62 |
| 85 | 12 | 8 | 12 | 10 | -GGGKY-AGGGCCAGGGTGGGGG-- | 53 | 21 | 50 | 42 |
| 86 | 8 | 3 | 4 | 5 | GGGAGGGTCCWGGGGYTGGG | 129 | 22 | 116 | 103 |
| 87 | 9 | 6 | 9 | 7 | GGGSBCWGGGWS-AGGGAGGG | 73 | 20 | 69 | 67 |
| 88 | 11 | 7 | 11 | 11 | -GGGRGRCYTGGGTGGGGGGG- | 120 | 22 | 107 | 103 |
| 89 | 11 | 9 | 6 | 11 | -GGGGTGGGGGTGGGGGGG | 43 | 20 | 12 | 40 |
| 90 | 10 | 8 | 3 | 9 | -GGGGTGGGGTGGGGGGG | 112 | 23 | 13 | 81 |
| 91 | 9 | 9 | 9 | 9 | -GG-GGWGGGAGGGAARACKGGG- | 75 | 21 | 70 | 70 |
| 92 | 13 | 7 | 11 | 13 | GGGKT-GGGGAGGGGAWTWRGGG | 451 | 23 | 428 | 367 |
| 93 | 9 | 8 | 7 | 9 | GGGCCTGGGCYTGGGCYDGGG- | 26 | 16 | 25 | 25 |
| 94 | 12 | 10 | 12 | 12 | GGGAMAGGGGGSAGGGGCRGGG | 86 | 20 | 86 | 80 |
| 95 | 8 | 7 | 8 | 8 | ----GGGGACAGGGRCA-GGGVCAGGG | 120 | 21 | 88 | 79 |
| Location | Sequence | Log Odds | Akaike Weight | Strand | Gene ID | Gene Symbol | Family |
|---|---|---|---|---|---|---|---|
| chr15:90204178-90204199 | GGGAGGGCACTAGGGCCCTGGG | 8.987 | 0.617 | + | 10509 | SEMA4B | 17 |
| chr3:126991053-126991092 | GGGCAGGGCAGGCAGGGAAGGG | 10.584 | 0.892 | + | 5361 | PLXNA1 | 17 |
| chr9:89440465-89440503 | GGGTAGGGCTCAGGGGCCAGGG | 14.015 | 0.996 | − | 10507 | SEMA4D | 17 |
| chr1:151141755-151141776 | GGGATGGGGGTTGGGGGGTGGG | 13.6 | 0.828 | − | 10500 | SEMA6C | 48 |
| chr15:47662210-47662233 | GGGGTGGGGGGTGAGGGGATGGGG | 11.857 | 0.994 | + | 80031 | SEMA6D | 48 |
| chr3:129567938-129567973 | GGGTTGGGGTGGGGGGTGGGG | 12.652 | 0.772 | − | 23129 | PLXND1 | 48 |
| chr3:129588350-129588372 | GGGTGTCGGGGGTGGGGGAGGGG | 9.599 | 0.787 | − | 23129 | PLXND1 | 48 |
| chr3:122983446-122983465 | GGGCGGGGACGGGGCGGGG | 12.301 | 0.981 | − | 54437 | SEMA5B | 79 |
| chr3:129606851-129606910 | GGGCGGGGCCGGGGCGGGG | 14.216 | 0.916 | − | 23129 | PLXND1 | 79 |
| chr3:50276050-50276067 | GGGAGGGTCGAGGGCGGG | 6.415 | 0.677 | + | 7869 | SEMA3B | 79 |
| Overall Sequence | Name | Minimum G4 Sequence | Length | Log Odds | Akaike Weight | Family |
|---|---|---|---|---|---|---|
| TGGGGAGGGTGGGGAGGGTGGGGAAGG | Pu27-c-MYC | GGGGAGGGTGGGGAGGG | 17 | 6.99 | 0.89 | 1 |
| GGGTGGGGAGGGTGGGG | 17 | 5.7 | 0.59 | 40 | ||
| GGGGAGGGTGGGGAAGG | 17 | 4.95 | 0.45 | 1 | ||
| TGGGAGGTGGGGAGGAGGGTTGGGAAGG | Pu1--PLEKHG5 | GGGAGGTGGGGAGGAGGGTTGGG | 23 | 7.42 | 0.53 | 48 |
| TGGGAGGTGGGGAGGAGGGTTGGGAAGG | GGGAGGAGGGTTGGGAAGG | 19 | 6.93 | 0.94 | 15 | |
| TGGGGAGGGTGGGGAGGCCGGG | Pu1-2-MYBPHL | GGGGAGGGTGGGGAGG | 16 | 2.41 | 0.53 | 1 |
| TGGGGAGGGTGGGGAGGGTGGG | Pu3--- | GGGGAGGGTGGGGAGGG | 17 | 6.99 | 0.89 | 1 |
| GGGTGGGGAGGGTGGG | 16 | 7.33 | 0.9 | 9 | ||
| TGGGGAGGGTGGGGAGGGCGGGG | Pu3-SOX2 | GGGGAGGGTGGGGAGGG | 17 | 6.99 | 0.89 | 1 |
| GGGAGGGTGGGGAGGG | 16 | 5.62 | 0.74 | 1 | ||
| TGGGGAGGGTGGGGAGGGTGGTGAGGGT GGGGAGGGGGAAGG | Pu5-GRM6 | GGGGAGGGTGGGGAGGG | 17 | 6.99 | 0.89 | 1 |
| GGGAGGGTGGGGAGGG | 16 | 5.62 | 0.74 | 1 | ||
| GGGGAGGGTGGTGAGGGTGGGG | 22 | 7.53 | 0.26 | 76 | ||
| GGGTGGTGAGGGTGGGGAGGGGG | 23 | 7.47 | 0.82 | 73 | ||
| TGGGGAGGGTGGGGAGGGTGGGGAGGG | Pu7-SDK1 | GGGGAGGGTGGGGAGGG | 17 | 6.99 | 0.89 | 1 |
| GGGTGGGGAGGGTGGGG | 17 | 5.7 | 0.59 | 40 | ||
| GGGTGGGGAGGGTGGGGAAG | Pu9--- | GGGTGGGGAGGGTGGGG | 17 | 5.7 | 0.59 | 40 |
| GGGGAGGGTGGGGAGGGGATGGAA | Pu9-2BC022036 | GGGTGGGGAGGGGATGG | 17 | 5.85 | 0.37 | 40 |
| GGGAGGGTGGGGAGGGTGGGGAGGG | Pu10-1-- | GGGAGGGTGGGGAGGG | 16 | 5.62 | 0.74 | 1 |
| GGGTGGGGAGGGTGGGG | 17 | 5.7 | 0.59 | 40 | ||
| GGGGAGGGTGGGGAGGG | 17 | 6.99 | 0.89 | 1 | ||
| GGGTGGGGAGGGTGGGGAAGG | Pu10-2-- | GGGTGGGGAGGGTGGGG | 17 | 5.7 | 0.59 | 40 |
| GGGGAGGGTGGGGAAGG | 17 | 4.95 | 0.45 | 1 | ||
| GGGGAGGAAGGGGAGGGTGGGGAGGG | Pu11NAV2 | GGGGAGGGTGGGGAGGG | 17 | 6.99 | 0.89 | 1 |
| GGGAGGGTGGGGAGGG | 16 | 5.62 | 0.74 | 1 | ||
| GAGGGTGGGGAGGGTGGATGAGGAAGG | Pu14SPTLC2 | GGGTGGGGAGGGTGG | 15 | 3.19 | 0.63 | 9 |
| TGGGGAGGGTGGGGAGGGTGG | Pu16-- | GGGGAGGGTGGGGAGGG | 17 | 6.99 | 0.89 | 1 |
| GGGAGGGTGGGGAGGG | 16 | 5.62 | 0.74 | 1 | ||
| GAGGGTGGGGAGGGTGGGGA | Pu17-- | GGGTGGGGAGGGTGGGG | 17 | 5.7 | 0.59 | 40 |
| GGGGAGGGTGGGGAGGGAGCTGGGGA | Pu20-CDH4 | GGGGAGGGTGGGGAGGG | 17 | 6.99 | 0.89 | 1 |
| GGGTGGGGAGGGAGCTGGGG | 20 | 4.01 | 0.49 | 51 | ||
| TGGGGAGGGTGGGGAGAGGCGGGGTGGGGAGGG | PuX-TM4SF2 | GGGAGGGTGGGGAGAGG | 17 | 3.41 | 0.83 | 18 |
Disclaimer/Publisher’s Note: The statements, opinions and data contained in all publications are solely those of the individual author(s) and contributor(s) and not of MDPI and/or the editor(s). MDPI and/or the editor(s) disclaim responsibility for any injury to people or property resulting from any ideas, methods, instructions or products referred to in the content. |
© 2023 by the authors. Licensee MDPI, Basel, Switzerland. This article is an open access article distributed under the terms and conditions of the Creative Commons Attribution (CC BY) license (https://creativecommons.org/licenses/by/4.0/).
Share and Cite
Neupane, A.; Chariker, J.H.; Rouchka, E.C. Structural and Functional Classification of G-Quadruplex Families within the Human Genome. Genes 2023, 14, 645. https://doi.org/10.3390/genes14030645
Neupane A, Chariker JH, Rouchka EC. Structural and Functional Classification of G-Quadruplex Families within the Human Genome. Genes. 2023; 14(3):645. https://doi.org/10.3390/genes14030645
Chicago/Turabian StyleNeupane, Aryan, Julia H. Chariker, and Eric C. Rouchka. 2023. "Structural and Functional Classification of G-Quadruplex Families within the Human Genome" Genes 14, no. 3: 645. https://doi.org/10.3390/genes14030645