Abstract
Diabetic kidney disease (DKD) represents a major global health problem. Accelerated ageing is a key feature of DKD and, therefore, characteristics of accelerated ageing may provide useful biomarkers or therapeutic targets. Harnessing multi-omics, features affecting telomere biology and any associated methylome dysregulation in DKD were explored. Genotype data for nuclear genome polymorphisms in telomere-related genes were extracted from genome-wide case–control association data (n = 823 DKD/903 controls; n = 247 end-stage kidney disease (ESKD)/1479 controls). Telomere length was established using quantitative polymerase chain reaction. Quantitative methylation values for 1091 CpG sites in telomere-related genes were extracted from epigenome-wide case–control association data (n = 150 DKD/100 controls). Telomere length was significantly shorter in older age groups (p = 7.6 × 10⁻⁶). Telomere length was also significantly reduced (p = 6.6 × 10⁻⁵) in DKD versus control individuals, with significance remaining after covariate adjustment (p = 0.028). DKD and ESKD were nominally associated with telomere-related genetic variation, with Mendelian randomisation highlighting no significant association between genetically predicted telomere length and kidney disease. A total of 496 CpG sites in 212 genes reached epigenome-wide significance (p ≤ 10−8) for DKD association, and 412 CpG sites in 193 genes for ESKD. Functional prediction revealed differentially methylated genes were enriched for Wnt signalling involvement. Harnessing previously published RNA-sequencing datasets, potential targets where epigenetic dysregulation may result in altered gene expression were revealed, useful as potential diagnostic and therapeutic targets for intervention.
Keywords:
biological ageing; diabetic kidney disease; epigenetic; genetic; methylation; SNP; telomere 1. Introduction
The incidence of diabetes is increasing worldwide, with cases expected to rise to 578 million by 2030 [1]. Approximately 30 to 40% of individuals with diabetes go on to develop kidney disease [2]. In 2018, diabetes was the most common primary disease in patients requiring renal replacement therapy (RRT) in the UK and over 40% of incident end-stage kidney disease (ESKD) patients in the USA had diabetes, with significant associated healthcare costs [3,4].
Diabetic kidney disease (DKD) is a complex, multifactorial disease with both inherited predisposition and environmental risk factors [5,6]. Kidney disease is associated with accelerated cellular senescence and ageing [7,8,9,10]. Telomeres are nucleoprotein complexes at the ends of eukaryotic chromosomes that suffer progressive loss of nucleotides as a result of the end replication problem. This is a feature of replicative senescence and is considered a marker of ageing [7,11]. It has been associated with diseases common in older populations, including cardiovascular disease [12,13,14], diabetes [15,16,17,18,19], and chronic kidney disease (CKD) or renal dysfunction [20,21,22,23,24]. Telomere shortening in type 2 diabetes (T2D) has also been related to the presence of more disease complications [25,26,27]. The association of reduced kidney function with advancing age is well established, with studies also correlating with telomere attrition [20,22,28,29,30,31,32,33,34,35,36]. Additionally, epigenetic dysregulation is a hallmark of ageing [37] and associated with reduced renal function and telomere-related genomic instability [9]. Reduced telomerase activity has also been reported in haemodialysis patients [38].
Genome-wide association studies and exome sequencing facilitated the discovery of telomere-related genes [39,40,41,42,43,44,45,46], aiding the identification of associations between telomere length and disease susceptibility [41,46,47,48,49,50,51,52]. Few studies have explored these associations in DKD, highlighting scope to harness additional diabetic populations [16,46,53,54,55,56,57,58,59]. We investigated genomic features affecting telomere biology in patients with T1D and a consistently defined clinical phenotype of DKD in four independent White European populations, evaluating telomere length in the largest population with T1D studied to date (Figure 1).
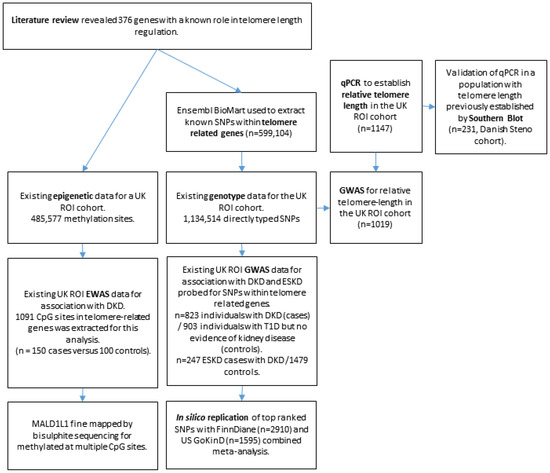
Figure 1.
Flowchart showing experimental design of the project. DKD = diabetic kidney disease. ESKD = end-stage kidney disease.
2. Materials and Method
A flowchart summarising the experimental design is shown in Figure 1.
2.1. Study Populations
All participants provided written informed consent and were recruited from one of four populations defined in Supplementary materials.
2.2. Telomere Length
Telomere length values were determined via monochrome quantitative polymerase chain reaction (qPCR) using relative ratio of telomere repeat copy number to a single copy gene 36B4 [60] in DNA derived from whole blood. Further details are included in Supplementary materials.
2.3. Genome-Wide Association Study (GWAS)
SNPs (N = 599,104) within 376 telomere-related genes (Table S1) were downloaded from the Ensembl genome browser using Ensembl genes 74 database on the Homo sapiens (GRCh37.p13) dataset [61]. GWAS data were obtained from the HumanOmni1-quad (Illumina Inc., California, CA, USA) for the UK-ROI cohort (n = 1830 individuals, 1,134,514 directly typed SNPs; dbGaP Study Accession: phs000389.v1.p1) [62]. In silico replication was conducted for top-ranked SNPs when considering either DKD or ESKD as the phenotype; data were retrieved from the GEnetics of Nephropathy an International Effort (GENIE) meta-analysis (dbGaP Study Accession: phs000389.v1.p1) [62]. Additional details on GWAS are included in Supplementary materials.
2.4. Mendelian Randomisation
Two-sample Mendelian randomisation was performed as described in Supplementary materials, harnessing SNPs utilised by Park et al. [50] and Codd et al. [44].
2.5. Epigenome-Wide Association Study (EWAS)
Existing quantitative (blood-derived) DNA methylation levels were extracted for genes relevant to telomere function from the UK-ROI cohort [63,64]. Briefly, 485,577 methylation sites for 150 DKD cases were compared to 100 controls with T1D and no evidence of kidney disease; data from 1091 CpG sites in 376 telomere-related genes were extracted for this analysis. Venn diagrams were created using the ggVenndiagram package (v. 1.2.0) in R Studio (v. 1.4.1717) [65,66].
2.6. Fine Mapping of Top Methylation Sites
Following bisulphite conversion using the EZ DNA Methylation-Lightning™ (Zymo Research, Freiburg im Breisgau, Germany), fine mapping was performed for 7 of the top-ranked differential methylation sites in MAD1L1. Primer pair sequences and PCR conditions are shown in Table S2. Thermal cycling was performed on the MJ Tetrad PTC-225 thermal cycler with the following conditions: 15 min at 95 °C; 35 cycles of 45 s at 94 °C, 45 s at 55–65 °C (temperature optimized for each primer pair) and 1 min at 72 °C; 10 min at 72 °C. Samples were subjected to exonuclease and phosphatase clean-up and sequencing reaction using BigDye Terminator v3.1 Ready Reaction Cycle Sequencing kit (Applied Biosystems, Massachusetts, MA, USA) before cycle sequencing on the ABI 3730® capillary sequencer. Results were evaluated using Contig Express on Vector NTI version 11.5.1 (Life Technologies, California, CA, USA).
2.7. Gene Ontology Analysis
Gene ontology analysis of biological processes, with subsequent clustering of gene ontology terms, was performed using the ViSEAGO package (v. 1.6.0), in R studio (v. 1.4.1717) [66,67], according to processes described in Supplementary materials.
2.8. PheWAS Analysis
PheWeb analysis was carried out in the UK Biobank TOPMed-imputed cohort via https://pheweb.org/UKB-TOPMed/ (accessed on 25 April 2022) (v. 1.3.15) [68]. The Common Metabolic Disease portal database [69] and the GWAS catalogue [70] were also harnessed, searching within 150 kilobases either side of the SNP co-ordinates.
2.9. Differential Expression Analysis
Gene expression data from previous RNA-sequencing analyses of DKD and control tissues [71,72] were analysed as described in Supplementary materials.
2.10. Statistical Analysis
Plots in Figure 2 were created using R packages ggplot2 (v. 3.3.5) and ggpubr (v 0.4.0) [73,74]. These boxplots display the median, together with the first and third quartiles (hinges), with whiskers extending from the hinges to values at most ±1.5* interquartile range. When comparing relative telomere length (RTL) between groups, Kruskal–Wallis and Wilcoxon rank sum tests were performed (using ggpubr compare_means functions) due to the non-normality of RTL data. Where relevant, p-values for these tests were adjusted using the Bonferroni correction method. Where corrected RTL values are shown, RTL values were corrected for the covariates age, duration of T1D, sex, body mass index (BMI) and glycated haemoglobin (HbA1c) via a series of linear regressions, harnessing residuals as the corrected RTL values.
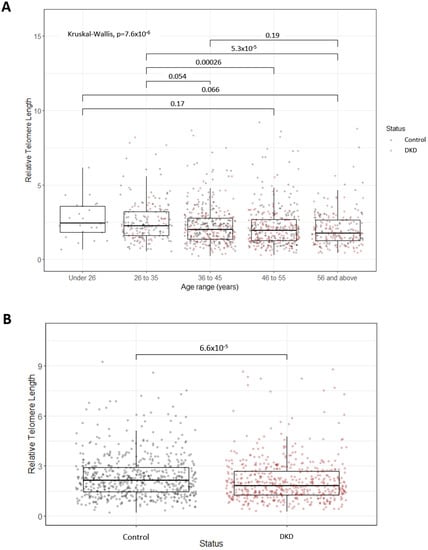
Figure 2.
(A) Boxplots representing decreasing relative telomere length with advancing age. The P-value for the overall Kruskall–Wallis test highlighted significant differences between age groups. Pairwise comparisons using Wilcoxon tests were also carried out, with significant adjusted P-values displayed (Bonferonni correction). Points are coloured based on diabetic kidney disease (DKD) status. The numbers of individuals in each age group are as follows: Under 26, N = 24; 26 to 35, N = 181; 36 to 45, N = 369; 46 to 55, N = 359; 56 and above, N = 214. (B) Boxplots representing the significant difference in relative telomere length between individuals with DKD and control individuals with at least 15 years duration of T1D but no evidence of kidney disease. Significance was determined via a Wilcoxon test.
3. Results
3.1. Telomere Length Associated with Premature Biological Ageing in DKD
Relative telomere length (RTL) decreased with increasing age across five age groups in the UK-ROI cohort (Figure 2A) (n = 1147; under 26 yr: 2.45 ± 1.76 (median ± interquartile range), 26 to 35 yr: 2.25 ± 1.62, 36 to 45 yr: 2.01 ± 1.40, 46 to 55 yr: 1.96 ± 1.41, over 56 yr: 1.75 ± 1.37, p = 7.6 × 10⁻⁶). Individuals with DKD had significantly shorter telomeres compared to control individuals (Figure 2B) (n = 536 cases/611 controls, p = 6.6 × 10⁻⁵). This association was ameliorated when RTL was corrected for age, T1D duration, sex, BMI and HbA1c (p = 0.028). When stratifying by age group, a significant difference in RTL in individuals with DKD, compared to control individuals, was only observed in the 46 to 55 age group (p = 0.0087) (Figure 2A). In the Steno replication cohort, however, no significant difference in telomere length (assessed by qPCR) was observed in DKD compared to controls (n = 78 cases/153 controls, p = 0.3). RTL in 157 cases and 116 controls from this population were previously measured using Southern blot [56]. The correlation between the qPCR and Southern blot (SB) results (r > 0.8) highlighted the consistency of methods used [75,76].
3.2. Genetic Variants Were Nominally Associated with Telomere Length
Existing genome-wide SNP data were used to investigate association with RTL in 1019 individuals from the UK-ROI cohort, adjusting for age (Figure S1). Nominally associated hits (p < 0.005) are shown in Table S3. Of the SNPs within the 376 telomere-related genes (Table S1), no SNP reached significance (p = 10−8); however, 36 SNPs in 22 genes demonstrated nominal association (Table 1 and Table S4). In total, 17 of these SNPs were within genes nominally associated with hypertension, diabetes, renal, glomerulonephritis or nephritis-related phenotypes in the UK Biobank (Table S4). Moreover, searching within 150 kb of these SNP co-ordinates revealed that 25 of these regions (69.4%) were significantly associated with a range of renal or cardiovascular phenotypes in the Common Metabolic Disease portal database (clumped by linkage disequilibrium) [69], which aggregates and analyses human genetic and functional genomic information linked to common metabolic diseases from up to 398 datasets (Table S5). Using these same regions to search the GWAS Catalogue [70], it was shown that the rs852540 SNP region (7:5,383,963–5,733,963) contained the variant rs7808152, previously associated with telomere length (p = 1 × 10⁻⁶, Beta = −0.1602507, CI = 0.096–0.225) in a cohort of 902 European-ancestry individuals (Netherlands) [77]. It was also shown that, within 150 kb of variants rs2209437, rs2025557 and rs1536078 (all with the closest gene SH3GL2), variants associated with DNA methylation (rs7032102, p = 2 × 10⁻⁸) and epigenetic clock age acceleration (GrimAge) (rs1114790, p = 10−8, Beta = −1.0232, CI = 0.67–1.38) were identified in a cohort of up to 954 individuals from the UK [78]. The highest-ranked telomere-related SNP was rs2725385 in the WRN gene (p = 2.09 × 10⁻⁴, OR = 1.28, 95% CI = 1.22–1.45). An additional 5 of the top 36 SNPs were also located in this gene, all within strong linkage disequilibrium (D´ > 0.8).

Table 1.
Genes with multiple SNPs demonstrating nominal association (p < 0.005) with telomere length.
3.3. Genetic Variants within Telomere-Related Genes Were Nominally Associated with DKD and ESKD
Using existing GWAS data, SNPs within the telomere-related genes were investigated for an association with DKD and ESKD in the UK-ROI cohort. In total, 6582 SNPs within telomere-related genes were present within the discovery GWAS. Comparison of 823 individuals with DKD (cases) with 903 individuals with T1D but no evidence of kidney disease (controls), corrected for age, sex, and duration of diabetes, revealed no genome-wide significant SNPs; however, 28 SNPs in 14 genes demonstrated nominal association (Table 2). The highest-ranked SNP was rs2299694 in ADA (p = 9.77 × 10⁻⁵, OR = 1.83, 95% CI = 1.35–2.47). All SNPs reaching nominal association underwent in silico replication via meta-analysis with the FinnDiane (n = 2910) and US GoKinD (n = 1595) datasets. Association was supported for two SNPs (Table 2), the most significant being rs2292681 in RNF10 (p = 2.81 × 10⁻³).
Table 2.
SNPs in telomere-related genes nominally associated with diabetic kidney disease (DKD) in the discovery cohort, with their association with DKD in the replication cohort also shown. Highlighted in green are those genes significantly associated with DKD in the replication cohort. CHR = chromosome, BP = base pair, A1 = allele 1, OR = odds ratio, SE = standard error, L/U95 = lower/upper 95% confidence intervals.
Analysis for the ESKD phenotype in 247 cases and 1479 controls did not reveal significant SNPs; however, 45 SNPs in 17 unique genes were nominally associated. In silico replication supported nine of these SNPs (Table 3), including SNPs within the top-ranked genes, PIPOX (rs7220474, p = 0.047) and DPP3 (rs2279863, p = 0.028 and rs1671063, p = 0.013).
Table 3.
SNPs in telomere-related genes nominally associated with end-stage kidney disease (ESKD) in the discovery cohort, with their association with ESKD in the replication cohort also shown. Highlighted in green are those genes significantly associated with ESKD in the replication cohort. CHR = chromosome, BP = base pair, A1 = allele 1, OR = odds ratio, SE = standard error, L/U95 = lower/upper 95% confidence intervals.
3.4. Exploring Mendelian Randomisation to Inform Associations between Genetic Telomere Length and DKD
Existing meta-analysis of genetic variants associated with kidney disease in T1D was used as the outcome dataset, considering either DKD or ESKD. As instrumental variables (IVs), 130 variants shown by Codd et al. to be significantly associated with leukocyte telomere length were utilised [48]. Separately, 33 variants used by Park et al. to highlight an association between telomere attrition and CKD were harnessed [47,50]. When utilising either set of IVs, no significant association between telomere length and DKD was identified, with no significant pleiotropy present (Table 4 and Table S6). Whilst no significant association was identified between ESKD and telomere length, significant pleiotropy was identified when utilising the Codd et al. IVs (Table 4 and Table S6). The MR-PRESSO method confirmed the presence of pleiotropy (global test p = 0.0193) [79]; however, no outlying variants were identified and the causal effect was not significantly distorted.
Table 4.
Summary-level MR results with the replication meta-analysis data demonstrating the effect of telomere attrition on the risk of diabetic kidney disease (DKD) or end-stage kidney disease (ESKD) in T1D, using the Codd et al. IVs or the Park et al. IVs. The asterisks (*) identify that MR PRESSO reported significant pleiotropy (global test p = 0.0193); however, no variants presented significant horizontal pleiotropic effect in the outlier test and, therefore, the causal effect had no significant distortions. mF = mean F-statistic, unweighted I2, OR = odds ratio, CI = confidence interval.
3.5. Significant Differential Methylation of Telomere-Related Genes in DKD and ESKD
Focusing on epigenetics, 496 methylation sites in 212 genes reached epigenome-wide significance (p ≤ 10−8) for DKD (Table S7). cg00445824 in ISYNA1 was the most significantly associated site (p = 9.1 × 10⁻²⁴), with this site also significant and in the same direction for ESKD. ESKD was associated with 412 methylation sites in 193 unique genes at epigenome-wide significance (Table S8). The most significant was cg19898668 in REM2 (p = 2.2 × 10⁻²¹), with this site also significant in the same direction for DKD. Four genes (MAD1L1, TBCD, BANP and PFKB) contained significant differential methylation at more than 10 sites for DKD and ESKD (Table 5). ESKD beta value distributions of top-ranked sites in these genes are shown in Figure 3. Venn diagrams comparing the CpG sites (Figure S2A) and associated genes (Figure S2B) show that, whilst 40% of differentially methylated sites overlap between DKD and ESKD, 70% of differentially methylated genes overlap between these phenotypes. Of the top 15 genes presenting differential methylation in both phenotypes (Table 5), MAD1L1, TUBB, HIST1H2AL and TBCA were significantly associated with diabetes-related phenotypes in the UK Biobank (Table 6). MAD1L1 was fine mapped for top-ranking methylation sites (Figure 4).
Table 5.
Top 15 genes presenting the highest number of CpG sites per genes significantly differentially methylated in diabetic kidney disease (DKD) compared to control individuals and the number of sites within these genes significantly associated with end-stage kidney disease (ESKD). Δβ = delta beta.
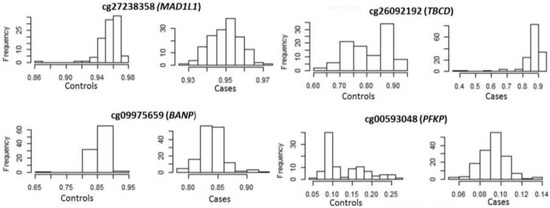
Figure 3.
Distribution of methylation of top-ranked sites in end-stage kidney disease cases and controls.
Table 6.
Genes from Table 5 which present associations with diabetes-related phenotypes, as determined via PheWEB.
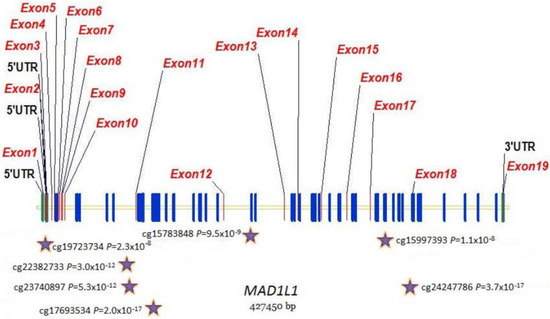
Figure 4.
Distribution of methylation sites across the MAD1L1 gene. Stars show top-ranked sites that were fine mapped.
Gene ontology analysis of the biological processes enriched in the significantly differentially methylated telomere-related genes, compared to the full telomere-related profile, revealed associations with telomere and chromosomal maintenance. Differential methylation within genes with predicted roles in Wnt signalling was also observed for DKD and ESKD (Tables S9 and S10). Morphogenesis, biosynthetic processing and metabolism regulation were additionally highlighted for DKD alone (Table S9).
3.6. Gene Expression Changes in Telomere-Related Genes Reflected Differential Methylation Patterns
To explore the effects of differential methylation during DKD, methylation data were compared with gene expression data from micro-dissected glomerular and tubulointerstitial tissue [71]. The resultant log fold change (logFC) data from a differential expression analysis in DKD, compared to living donor controls, were correlated with mean delta-beta values for the significantly differentially methylated CpG sites within each gene (Figure 5). Some genes displayed a change in methylation consistent with their expression pattern during DKD (with fold change greater than 2 in the increasing or decreasing direction); Figure 6 explores these genes further. Interestingly, a number of genes which presented directional change in transcriptomic data, which was concordant with the differential methylation in DKD or ESKD, were associated with hypertension, diabetes, renal, glomerulonephritis or nephritis-related phenotypes in the UK Biobank (Table 7).
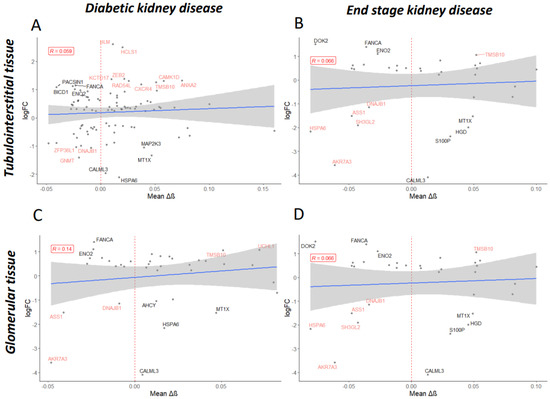
Figure 5.
Mean delta-beta (Δβ) values per gene were determined for the differentially methylated CpG sites significantly associated with diabetic kidney disease (A,C) or end-stage kidney disease (B,D). Mean Δβ values were regressed on log fold change (logFC) values obtained during the differential expression analysis of RNA-sequencing data for tubulointerstitial (A,B) or glomerular (C,D) tissue from patients diagnosed with diabetic nephropathy versus controls (Levin et al.). Only genes shown to be significantly dysregulated (p-adj < 0.05) are displayed. Shown in black are genes of interest where delta-beta methylation values correlate accordingly with expression level changes (for example, increased methylation correlates with decreased expression); shown in red are genes which do not. Labelled are genes with ±1 logFC.
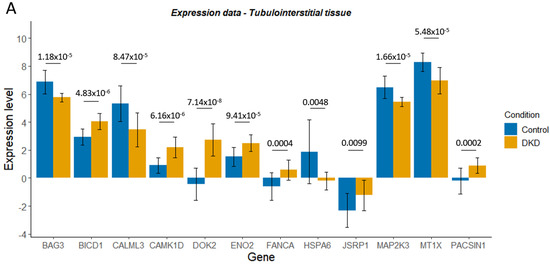
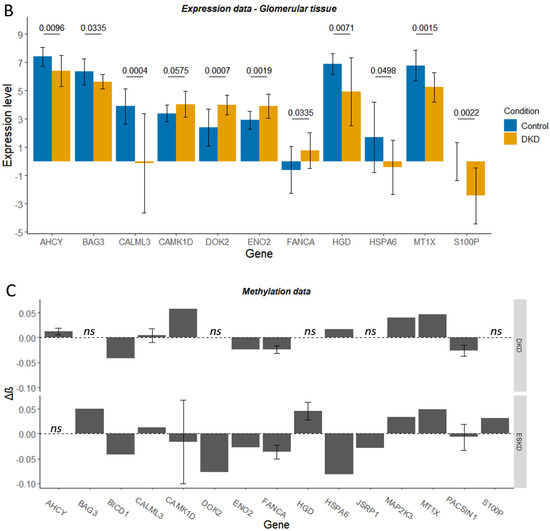
Figure 6.
Expression level (Levin et al., normalised log2 read count) for control and diabetic kidney disease (DKD) tubulointerstitial (A) or glomerular (B) tissue for genes of interest. Delta-beta (Δβ) values for the CpG sites within these genes of interest, whose differential methylation was significantly associated with DKD or end-stage kidney disease (ESKD) (C). ns denotes genes that were not significantly differentially methylated in DKD/ESKD. Mean ± SD is shown. In graphs A and B, p-adjusted values from the differential expression analysis are shown.
Table 7.
Genes which presented directional change in transcriptomic data which were concordant with the differential methylation in diabetic kidney disease (DKD) or end-stage kidney disease (ESKD) were associated with hypertension, diabetes, renal, glomerulonephritis or nephritis-related phenotypes in the UK Biobank.
An additional RNA-sequencing dataset generated from the whole-kidney biopsies of control, early DKD and advanced DKD participants was harnessed [72]. LogFC values for genes of interest in this analysis were generally lower and, therefore, a fold change cut-off of greater than ±1 was utilised (Figure S3). CAMK1D, ENO2, FANCA, MTX1 and DOK2 displayed consistency between datasets (Figures S3 and S4, Figure 5 and Figure 6). For HSPA6, decreased expression occurred during early DKD, mirroring the first dataset; however, this study revealed a subsequent increase in HSPA6 expression during advanced DKD, which may better reflect the decreased methylation associated with ESKD.
When assessing the expression level of telomere-related genes with the highest number of statistically significant methylation sites (Table 5) or those genes with predicted association with Wnt signalling, all genes except WIPI2 showed a significant differential expression in at least one comparison (Figure S5, Table S11 and Figure S6, Table S12A). Interestingly, C12orf43, TBL1X and TNKS were significantly associated with diabetes or hypertension-related phenotypes in the UK Biobank (Table S12B).
4. Discussion
In the present study, we explored the association of telomere length with DKD and ESKD in a European T1D population, determining RTL in 1147 participants. Mean RTL was significantly shorter in individuals with DKD, compared to individuals with T1D and no evidence of kidney disease, even after covariate correction. Whilst shorter telomere length has been associated with a significantly increased risk of DKD in diabetes (T1D and T2D combined) [54], mixed associations between telomere length and renal function have been reported. A systematic review by Ameh et al. has investigated associations between telomere length and renal traits in 7,829 individuals from nine studies, two specifically investigating diabetic patients (T1D [53] and T2D [25]) with varying stages of kidney disease [20,25,53]. Telomere attrition was associated with estimated glomerular filtration rate (eGFR) decline and kidney disease progression among people with diabetes [20]. However, longer telomeres were associated with longer kidney disease duration, perhaps influenced by telomere repair in longer surviving CKD patients [20]. Fyhrquist et al. have highlighted that short telomeres were independent predictors of DKD progression in patients with T1D [53]. A recent longitudinal study by Syreeni et al. has revealed that individuals with T1D with the shortest telomeres had lower eGFR, increased albuminuria and more stage 3 CKD [59]. Januszewski et al., however, determined that, whilst telomeres were shorter in patients with T1D versus a control group, RTL did not correlate significantly with renal function [58]. A recent review from our group highlights the recent literature connecting telomere length and DKD [80].
Telomere length does not correlate well with all aspects of renal function, especially after age adjustment [21,22,49,55,81,82]. Sun et al. determined that SNPs in telomere-related genes, rather than telomere length, contributed to primary glomerulonephritis/ESKD susceptibility [49]. Other studies determined that genetic telomere length was not significantly associated with CKD or diabetes, perhaps due to residual biases or limited power [44,47]. These data reflect that telomere length is a weak marker of ageing, displaying substantial inter-individual variation, reflecting differing exposomes [83]. For example, variation in ageing linked to renal function is also strongly influenced by diet and the microbiome, which may confound primary analyses [84]. This highlights the need for multi-omic studies to assess additional factors, such as epigenetics, which can be altered during the life course [5,64,85]. We therefore conducted, to our knowledge, the first investigation of leukocyte telomere length, together with both genetic and epigenetic status of nuclear telomere-related genes, for association with DKD in T1D. We used cost-effective methods to determine telomere length and high-density microarrays for efficient and high-throughput examination of telomere-related gene data extracted from ~1 million SNPs and ~480,000 methylation sites at single-base resolution.
Using existing genotype data [62], SNPs were investigated for an association with qPCR-established telomere length, DKD and ESKD. A total of 17% of the top 36 SNPs associated with telomere length were present in WRN. Variants in this gene are the primary cause of Werner syndrome, a disorder of accelerated ageing, with WRN knockout cell lines presenting with accelerated telomere attrition [86,87,88]. In vitro studies have demonstrated that the WRN helicase interacts with TERF2, a member of the shelterin complex essential for telomere maintenance [87,89]. TERF1 is an additional protein implicated in WRN function, with a variant near TERF1-interacting nuclear factor 2 (TINF2) associated with telomere length and T2D, and is shown to drive the association between telomere length and CKD in T2D [51,52,90]. Together, these studies highlight the potential for WRN functioning and TERF1- or TERF2-interacting proteins to influence the risk of DKD. It is important to note, however, that no SNP reached genome-wide significance when assessing RTL, and genes such as LMNA, implicated in telomere stability and CKD [91,92], were not identified, highlighting the need for even larger genetic datasets of this type to increase the power and uncover novel gene–function interactions.
The nominal association with DKD was supported during replication analysis for two SNPs, the most significant being rs2292681 in RNF10. Liu et al. recently showed via a multi-ancestry meta-analysis of 1.5 million individuals that rs3817301 in RNF10 was significantly associated with eGFR [93]. For ESKD, variants within seven genes were supported during replication analysis, with variants within SYK and PIPOX previously associated with T2D or HbA1c [94,95]. PIPOX expression was shown to significantly decrease during DKD [96], encoding a protein involved in maintaining oxidative stress balance [96], a process disrupted during DKD [97] and a key factor in modulating telomere shortening [98].
Utilising Mendelian randomisation, we assessed the causal association between genetically determined telomere shortening and DKD or ESKD, harnessing two sets of IVs previously used to explore kidney disease in European populations [47,48,50]. Park et al. determined that telomere shortening was significantly associated with a higher CKD risk (OR 1.20, p < 0.001), with successful replication in the UK Biobank [47,50]. Li et al. utilised the same genetic instrument in a UK Biobank cohort to reveal that genetically-determined telomere attrition did not affect the risk of diseases such as diabetes or CKD [47]; however, Park et al. highlighted that this null result may be due to the low number of self-reported or ICD-confirmed diagnosis for CKD and instead opted for serum cystatin C and creatinine level classification [50]. Codd et al. identified IVs of leukocyte telomere length in a UK Biobank cohort and, whilst these authors determined that direct measurements of telomere length were significantly associated with CKD within the UK Biobank (Hazard ratio = 0.889, p value = 9.45 × 10⁻¹⁷), genetically determined telomere length was not (OR = 1.02, p = 0.71), with CKD classified based on self-reported, ICD and procedure codes [48]. Harnessing these genetic instruments for analysis within our cohort revealed no significant associations between telomere shortening and DKD or ESKD. Additional studies have explored the effect of genetically determined telomere length and kidney disease. Gurung et al. demonstrated that genetically determined telomere attrition was associated with increased DKD in East Asian T2D patients [52]. Taub et al. highlighted that rs1008438 in HSPA1A gene was significantly associated with DKD risk in T1D [46]. These results highlight the complexity of the association between telomere length and kidney disease, with results in both genetic-based and observational studies dependent on the measure of kidney function used [22]. It is important, therefore, to take a wider approach, assessing both the observational and genomic nature of telomere length to gain a fuller understanding of kidney disease pathogenesis.
Via a multi-omics approach, we broadened our study of telomere-related genes in DKD. Multiple statistically significant methylation sites were identified in MAD1L1, encoding a protein involved in the mitotic spindle assembly, chromosome alignment, cell cycle control and tumour suppression. MAD1L1 inhibits TERT transcription via epigenetic modification of histones [99]. TERT encodes the catalytic subunit of telomerase and plays a crucial role in telomere maintenance and senescence [100]. Methylation of TERT and MAD1L1 in DKD may alter telomerase activity, potentially reducing the regenerative ability of renal cells [101,102]. Via TERT, telomerase can also modulate Wnt/β-catenin signalling [103]. This pathway is important for podocyte proliferation, the epithelial cells involved in maintaining normal kidney filtration (Figure 7). Interestingly, gene ontology analysis revealed that Wnt signalling was an enriched biological process within the telomere-related genes which were significantly differentially methylated in DKD or ESKD. Altering DNA methylation, even via dietary interventions [84,104], may prove a novel therapeutic opportunity for DKD [105], with this analysis identifying targets for future study (TERT, VAX2, C12orf43, TBL1X, TNKS, BCL7B, ZEB2 and AKT1).
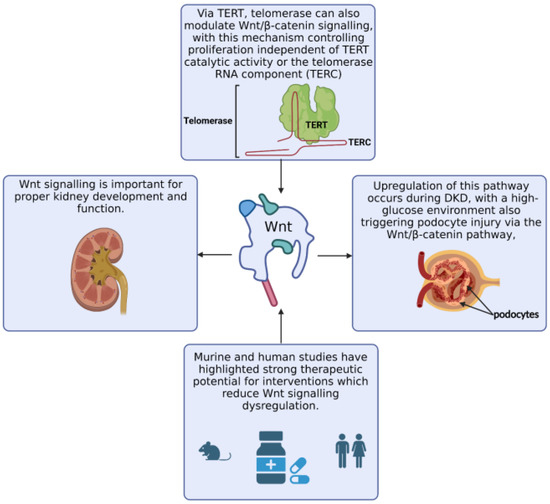
Figure 7.
Via TERT, telomerase can also modulate Wnt/β-catenin signalling, with this mechanism controlling proliferation independent of TERT catalytic activity or the telomerase RNA component (TERC) [103,106,107]. Wnt signalling influences on kidney development and functioning, with potential for this pathway to be targeted for therapeutic interventions for DKD [108,109,110,111,112,113,114,115,116,117].
A limitation of this study was the analysis of telomere length and epigenetics at a single time point. A longitudinal study, as carried out by Syreeni et al. in a smaller T1D cohort [59], would provide insights into disease progression and (epi)genomic changes over time. In addition, incorporating assessment of individual exposome factors, such as lifestyle, diet, environment and socioeconomic position, as well transgenerational exposome stressors, may also be of merit, due to their impact on accelerated ageing, kidney disease and the epigenome [83].
Employing previously published RNA-sequencing datasets generated using human kidney tissue biopsies [71,72], differential methylation of telomere-related genes during DKD and ESKD was correlated with altered gene expression. Differentially methylated genes with predicted roles in Wnt signalling were significantly differentially expressed during DKD; however, the extent of this differential expression was limited. Differentially methylated genes showing a concordant change in gene expression during DKD were identified. Genetic variants within BICD1 were nominally associated with DKD and ESKD in the discovery and replication GWAS, with rs7900065 within BAG3 nominally associated with ESKD in both datasets. A BICD1 genetic variant was previously associated with longitudinal DNA methylation changes in an older population [78]. The present study also highlighted a telomere-related gene (SH3GL2), which contained genetic variants nominally associated telomere length and genetic variants within 150 kilobases previously associated with DNA methylation or accelerated epigenetic ageing. Interestingly, SH3GL2 was significantly differentially methylated in ESKD in this study and significantly dysregulated in both the Fan et al. and Levin et al. RNA-sequencing datasets, with decreased expression observed alongside (on average) decreased methylation. These results highlight the potential interaction between genetic variation in telomere-related genes, methylation changes and gene expression, which may impact kidney health during T1D, identifying potential diagnostic and therapeutic targets.
Whilst a number of genes with a high number of differentially methylated sites, such as MAD1L1, presented significant differential expression, the extent of this differential expression was limited. Therefore, specifically methylated sites, rather than an accumulation of differentially methylated sites, may influence gene expression during DKD. Future work is needed to explore the effects of differential methylation in DKD and ESKD, especially for genes where extensive transcriptional change was not observed or where gene expression patterns were not concordant with methylation changes.
5. Conclusions
In summary, taking a multi-omic approach, telomere-related genes nominally associated with telomere length, DKD, or ESKD were identified, with epigenetic analysis revealing approximately 230 genes differentially methylated in DKD and/or ESKD. These differentially methylated genes were enriched for Wnt signalling functions. Harnessing previously published transcriptomic datasets, differential methylation was correlated with gene expression in DKD, highlighting potential targets where epigenetic dysregulation may result in altered gene expression and influence disease. This study identified potential targets where epigenetic regulation of telomere function may have functional consequence on DKD, useful as potential diagnostic and therapeutic targets for intervention.
Supplementary Materials
The following supporting information can be downloaded at: https://www.mdpi.com/article/10.3390/genes14051029/s1: Supplementary Methods [118,119,120,121,122,123,124,125,126,127,128,129,130,131,132,133,134,135,136,137,138]. Figure S1. UK ROI GWAS to determine statistically significant genetic associations for relative telomere length. (A) QQ plot highlighted limited deviation of the observed p values from the null hypothesis. (B) Manhattan plot with those SNPs reaching the −log10(p) > 5 cut-off annotated. (C) Zoomed Manhattan plot displaying those SNPs reaching the p < 0.005 cut-off. Shown in red are SNPs within the 376 telomere-related genes. The leading SNP within each telomere-related gene is annotated. Figure S2. Venn diagrams to highlight the number of differentially methylated CpG sites overlapping between diabetic kidney disease (DKD) and end-stage kidney disease (ESKD) (A) or the overlapping genes associated with these differentially methylated CpG sites (B). Figure S3. Mean delta-beta (Δβ) values per gene were determined for the differentially methylated CpG sites significantly associated with diabetic kidney disease (DKD) (A,C,E) or end-stage kidney disease (ESKD) (B,D,F). Mean Δβ values were regressed on log fold change (logFC) values obtained during the differential expression analysis of early DKD versus control (A,B), advanced DKD versus control (C,D) or advanced DKD versus early DKD (E,F) RNA-sequencing data [72]. Only genes shown to be significantly dysregulated (p-adj < 0.05) are displayed. Shown in black are genes of interest where Δβ values correlate accordingly with expression level changes (for example, increased methylation correlates with decreased expression); shown in red are genes which do not. Labelled are genes with ±0.1 logFC. Figure S4. Expression level (normalised log2 read count) for control, early diabetic kidney disease (DKD) or advanced DKD (Fan et al.) [72] for genes of interest (A). P-adjusted values from the differential expression analysis are shown in star format: * p < 0.05, ** p < 0.01, *** p < 0.001 (nonsignificant differences are not displayed). Below are the delta-beta (Δβ) values for the same genes which were significantly differentially methylated in DKD or end-stage kidney disease (ESKD) phenotypes (B). Note that, for ARK1B10 and DOK2, delta-beta values are not shown for the DKD phenotype as changes in methylation within these genes was not significantly associated with DKD. For AHCY, ARRK1 and TWF2, delta-beta values are not shown for the ESKD phenotype are not shown as changes in methylation within these genes were not significantly associated with ESKD. ns denotes genes that were not significantly differentially methylated in DKD/ESKD. Mean ± SD is shown. Figure S5. Expression level (normalised log2 read count) for control and diabetic kidney disease (DKD) tubulointerstitial (A) or glomerular (B) tissue (Levin et al.) [71], for genes with the highest number of significantly differentially methylated sites in DKD or end-stage kidney disease (ESKD) phenotypes. Also shown are expression levels (normalised log2 read count) for control, early DKD or advanced DKD in an alternative dataset (Fan et al.) [72] (C). p-adjusted values from the differential expression analysis are shown. Delta-beta (Δβ) values for the same genes which were significantly differentially methylated in DKD or ESKD phenotypes (D). Mean ± SD is shown. Figure S6. Expression level (normalised log2 read count) for control and diabetic kidney disease (DKD) tubulointerstitial (A) or glomerular (B) tissue (Levin et al.) for genes having a predicted association with Wnt signalling via gene ontology analysis. Also shown are expression levels (normalised log2 read count) for control, early DKD or advanced DKD in an alternative dataset (Fan et al.). (C) p-adjusted values from the differential expression analysis are shown. Delta-beta values for the same genes which were significantly differentially methylated in DKD or end-stage kidney disease (ESKD) phenotypes (D). Mean ± SD is shown. Note that, for TERT and VAX2, expression values were not determined in either of the RNA-sequencing datasets analysed. Table S1. Genes with a known role in telomere function. SNPs for these relevant genes were downloaded from the Ensembl genome browser using Ensembl genes 74 database on the Homo sapiens dataset. Shown here are the gene start and end positions (base pairs (bp)) in the GRCh37.p13 assembly. Table S2. Primer sequences for fine mapping of selected top-ranked CpG. Table S3. Genetic variants in the UK-ROI population nominally associated with telomere length. NA = no gene assigned, CHR = chromosome, BP = base pair, A1 = allele 1, OD = odds ratio, SE = standard error, L95 = beta lower 95% confidence limit, U95 = beta upper 95% confidence limit, STAT = test statistic, p = p-value. Table S4. SNPs in telomere-related genes (Table S1) demonstrating nominal association (p < 0.005) with telomere length. Also shown are the number (or percentage) of the top 20 phenotypes for each variant, identified via PheWEB, associated with hypertension, diabetes, renal, glomerulonephritis or nephritis-related phenotypes. CHR = chromosome, BP = base pair, A1 = allele 1, SE = standard error, L95 = lower 95% confidence limit, U95 = upper 95% confidence limit, STAT = test statistic, p = p-value. Table S5. SNPs in telomere-related genes (Table S1) demonstrating nominal association (p < 0.005) with telomere length (Table S4) and the SNP regions and hits for renal, diabetes and cardiovascular phenotypes on the Common Metabolic Disease (CMD) Portal. Also shown are hits within these regions in the GWAS Catalogue for telomere biology, longevity or methylation phenotypes. NA = not applicable, CHR = chromosome, BP = base pair. Table S6. Heterogeneity statistics for MR analysis with the replication meta-analysis data demonstrating the effect of telomere attrition on the risk of diabetic kidney disease or end-stage kidney disease in T1D, using the Codd et al. instrumental variables (IVs) or the Park et al. IVs [47,48,50]. IVW = inverse variance weighted. DKD = diabetic kidney disease. ESKD = end-stage kidney disease. Table S7. The 496 CpG sites in 212 unique genes with a known role in telomere function demonstrating genome-wide significance with diabetic kidney disease in the UK-ROI population. Arranged in order of significance. Table S8. The 412 CpG sites in 193 unique genes with a known role in telomere function demonstrating genome-wide significance with end-stage kidney disease in the UK-ROI population. Arranged in order of significance. Table S9. Clustered significantly enriched biological process gene ontology terms for the significantly differentially methylated telomere-related genes associated with diabetic kidney disease. Gene frequency is shown as a percentage and fraction (number of significant genes/number of annotated genes). Table S10. Clustered significantly enriched biological process gene ontology terms for the significantly differentially methylated telomere-related genes associated with end-stage kidney disease. Gene frequency is shown as a percentage and fraction (number of significant genes/number of annotated genes). Table S11. Differential expression results for the genes presenting the highest number of differentially methylated CpG sites associated with diabetic kidney disease (DKD) or end-stage kidney disease. Log fold change (logFC) and adjusted p-values (adj p-value) are shown. Significant differential expression is highlighted using an asterisk (*). Table S12. (A) Differential expression results for the genes containing differentially methylated CpG sites associated with diabetic kidney disease (DKD) or end-stage kidney disease which are predicted to associate with Wnt signalling. Log fold change (logFC) and adjusted p-values (adj p-value) are shown. Significant differential expression is highlighted using an asterisk (*). (B) Genes from Table S12(A) which present associations with hypertension, diabetes, renal, glomerulonephritis or nephritis-related phenotypes, as determined via PheWEB. Shown is the top p-value per association per gene.
Author Contributions
Conceptualisation, A.J.M. and A.P.M.; methodology, C.H., S.D., A.J.M. and A.P.M.; validation, C.H., S.D., A.J.M. and A.P.M.; replication analyses, N.S., R.M.S., P.R. and P.-H.G.; formal analysis, C.H., S.D., L.M.K., L.M., A.T. and P.G.S.; investigation, C.H., S.D., A.J.M., J.K. and E.J.S.; resources, A.J.M., A.P.M., GENIE Consortium, L.M.K., L.M., A.T. and P.G.S.; data curation, C.H. and S.D.; writing—original draft preparation, C.H. and S.D.; writing—review and editing, all authors; visualisation, C.H. and S.D.; supervision, A.J.M. and A.P.M.; project administration, A.J.M. and A.P.M.; funding acquisition, A.J.M. and A.P.M. All authors have read and agreed to the published version of the manuscript.
Funding
S.D. was supported by a QUB International PhD fellowship. This work was supported by the Northern Ireland Health and Social Care Research and Development Office (STL/5569/19), and the Medical Research Council (MC_PC_20026). C.H. is supported by a Science Foundation Ireland and the Department for the Economy Northern Ireland partnership award 15/IA/3152. FinnDiane was funded by the Folkhälsan Research Foundation, the Wilhelm and Else Stockmann Foundation, the Academy of Finland (316664), the Novo Nordisk Foundation (NNF OC0013659), the Sigrid Juselius Foundation, the “Liv och Hälsa” Society, EVO governmental grants (TYH2020305), and the Finnish Diabetes Research Foundation. A.T. and L.M.K. were supported by Blood Cancer UK (formerly Bloodwise).
Institutional Review Board Statement
Ethical review was obtained from district ethics committees for individual studies, as described previously for these individual cohorts [62,119,121,122].
Informed Consent Statement
Informed consent was obtained from all individuals involved in the study.
Data Availability Statement
The GENIE cohort share genome-wide meta-analysis summary statistics (dbGaP Study Accession: phs000389.v1.p1). Additional data access requests can be made via https://www.ncbi.nlm.nih.gov/projects/gap/cgi-bin/study.cgi?study_id=phs000389.v1.p1 (accessed on 22 April 2023).
Acknowledgments
Figure 7 and the graphical abstract were created using Biorender.com (accessed on 22 April 2023).
Conflicts of Interest
P.-H.G. reports receiving lecture honorariums from Astellas, AstraZeneca, Bayer, Boehringer Ingelheim, Eli Lilly, Elo Water, Medscape, MSD, Mundipharma, Novo Nordisk, PeerVoice, Sanofi, Sciarc, and being an advisory board member of AbbVie, Astellas, AstraZeneca, Bayer, Boehringer Ingelheim, Eli Lilly, Medscape, MSD, Mundipharma, Nestlè, Novo Nordisk, and Sanofi. The funders had no role in the design of the study; in the collection, analyses, or interpretation of data; in the writing of the manuscript; or in the decision to publish the results.
References
- International Diabetes Federation. IDF Diabetes Atlas, 10th ed.; The International Diabetes Federation (IDF): Brussels, Belgium, 2021; ISBN 9782930229874. [Google Scholar]
- Hill, C.J.; Cardwell, C.R.; Patterson, C.C.; Maxwell, A.P.; Magee, G.M.; Young, R.J.; Matthews, B.; O’Donoghue, D.J.; Fogarty, D.G. Chronic Kidney Disease and Diabetes in the National Health Service: A Cross-Sectional Survey of the UK National Diabetes Audit. Diabet. Med. 2014, 31, 448–454. [Google Scholar] [CrossRef] [PubMed]
- The UK Renal Registry. UK Renal Registry 22nd Annual Report—Data to 31/12/2018; The UK Renal Registry: Bristol, UK, 2020. [Google Scholar]
- United States Renal Data System. In USRDS Annual Data Report: Epidemiology of Kidney Disease in the United States; National Institutes of Health, National Institute of Diabetes and Digestive and Kidney Diseases: Bethesda, MD, USA, 2020.
- Smyth, L.J.; Duffy, S.; Maxwell, A.P.; McKnight, A.J. Genetic and Epigenetic Factors Influencing Chronic Kidney Disease. Am. J. Physiol.—Ren. Physiol. 2014, 307, F757–F776. [Google Scholar] [CrossRef] [PubMed]
- McKnight, A.J.; Duffy, S.; Maxwell, A.P. Genetics of Diabetic Nephropathy: A Long Road of Discovery. Curr. Diab. Rep. 2015, 15, 41. [Google Scholar] [CrossRef] [PubMed]
- Verzola, D.; Gandolfo, M.T.; Gaetani, G.; Ferraris, A.; Mangerini, R.; Ferrario, F.; Villaggio, B.; Gianiorio, F.; Tosetti, F.; Weiss, U.; et al. Accelerated Senescence in the Kidneys of Patients with Type 2 Diabetic Nephropathy. Am. J. Physiol.—Ren. Physiol. 2008, 295, F1563–F1573. [Google Scholar] [CrossRef]
- Kooman, J.P.; Dekker, M.J.; Usvyat, L.A.; Kotanko, P.; van der Sande, F.M.; Schalkwijk, C.G.; Shiels, P.G.; Stenvinkel, P. Inflammation and Premature Aging in Advanced Chronic Kidney Disease. Am. J. Physiol.—Ren. Physiol. 2017, 313, F938–F950. [Google Scholar] [CrossRef]
- Shiels, P.G.; McGuinness, D.; Eriksson, M.; Kooman, J.P.; Stenvinkel, P. The Role of Epigenetics in Renal Ageing. Nat. Rev. Nephrol. 2017, 13, 471–482. [Google Scholar] [CrossRef]
- Kooman, J.P.; Kotanko, P.; Schols, A.M.W.J.; Shiels, P.G.; Stenvinkel, P. Chronic Kidney Disease and Premature Ageing. Nat. Rev. Nephrol. 2014, 10, 732–742. [Google Scholar] [CrossRef]
- Mir, S.M.; Tehrani, S.S.; Goodarzi, G.; Jamalpoor, Z.; Asadi, J.; Khelghati, N.; Qujeq, D.; Maniati, M. Telomeres and Telomerase in Cardiovascular Diseases. Clin. Interv. Aging 2020, 15, 827–839. [Google Scholar] [CrossRef]
- Haycock, P.C.; Heydon, E.E.; Kaptoge, S.; Butterworth, A.S.; Thompson, A.; Willeit, P. Leucocyte Telomere Length and Risk of Cardiovascular Disease: Systematic Review and Meta-Analysis. BMJ 2014, 349, g4277. [Google Scholar] [CrossRef]
- Yeh, J.K.; Wang, C.Y. Telomeres and Telomerase in Cardiovascular Diseases. Genes 2016, 7, 58. [Google Scholar] [CrossRef]
- Spyridopoulos, I.; Von Zglinicki, T. Telomere Length Predicts Cardiovascular Disease: Measurement in Humans Is Unlikely to Be Useful until We Find out How and Why. BMJ 2014, 349, g4373. [Google Scholar] [CrossRef]
- Kirchner, H.; Shaheen, F.; Kalscheuer, H.; Schmid, S.M.; Oster, H.; Lehnert, H. The Telomeric Complex and Metabolic Disease. Genes 2017, 8, 176. [Google Scholar] [CrossRef]
- Gurung, R.L.; M, Y.; Liu, S.; Liu, J.J.; Lim, S.C. Short Leukocyte Telomere Length Predicts Albuminuria Progression in Individuals with Type 2 Diabetes. Kidney Int. Rep. 2018, 3, 592–601. [Google Scholar] [CrossRef]
- Zhao, J.; Miao, K.; Wang, H.; Ding, H.; Wang, D.W. Association between Telomere Length and Type 2 Diabetes Mellitus: A Meta-Analysis. PLoS ONE 2013, 8, e79993. [Google Scholar] [CrossRef]
- Adaikalakoteswari, A.; Balasubramanyam, M.; Mohan, V. Telomere Shortening Occurs in Asian Indian Type 2 Diabetic Patients. Diabet. Med. 2005, 22, 1151–1156. [Google Scholar] [CrossRef]
- Jeanclos, E.; Krolewski, A.; Skurnick, J.; Kimura, M.; Aviv, H.; Warram, J.H.; Aviv, A. Shortened Telomere Length in White Blood Cells of Patients with IDDM. Diabetes 1998, 47, 482–486. [Google Scholar] [CrossRef]
- Ameh, O.I.; Okpechi, I.G.; Dandara, C.; Kengne, A.P. Association between Telomere Length, Chronic Kidney Disease, and Renal Traits: A Systematic Review. Omics J. Integr. Biol. 2017, 21, 143–155. [Google Scholar] [CrossRef]
- Fazzini, F.; Lamina, C.; Raschenberger, J.; Schultheiss, U.T.; Kotsis, F.; Schönherr, S.; Weissensteiner, H.; Forer, L.; Steinbrenner, I.; Meiselbach, H.; et al. Results from the German Chronic Kidney Disease (GCKD) Study Support Association of Relative Telomere Length with Mortality in a Large Cohort of Patients with Moderate Chronic Kidney Disease. Kidney Int. 2020, 98, 488–497. [Google Scholar] [CrossRef]
- Mazidi, M.; Rezaie, P.; Covic, A.; Malyszko, J.; Rysz, J.; Kengne, A.P.; Banach, M. Telomere Attrition, Kidney Function, and Prevalent Chronic Kidney Disease in the United States. Oncotarget 2017, 8, 80175–80181. [Google Scholar] [CrossRef]
- Carrero, J.J.; Shiels, P.G.; Stenvinkel, P. Telomere Biology Alterations as a Mortality Risk Factor in CKD. Am. J. Kidney Dis. 2008, 51, 1076–1077. [Google Scholar] [CrossRef]
- Carrero, J.J.; Stenvinkel, P.; Fellström, B.; Qureshi, A.R.; Lamb, K.; Heimbürger, O.; Bárány, P.; Radhakrishnan, K.; Lindholm, B.; Soveri, I.; et al. Telomere Attrition Is Associated with Inflammation, Low Fetuin-A Levels and High Mortality in Prevalent Haemodialysis Patients. J. Intern. Med. 2008, 263, 302–312. [Google Scholar] [CrossRef] [PubMed]
- Tentolouris, N.; Nzietchueng, R.; Cattan, V.; Poitevin, G.; Lacolley, P.; Papazafiropoulou, A.; Perrea, D.; Katsilambros, N.; Benetos, A. White Blood Cells Telomere Length Is Shorter in Males with Type 2 Diabetes and Microalbuminuria. Diabetes Care 2007, 30, 2909–2915. [Google Scholar] [CrossRef] [PubMed]
- Testa, R.; Olivieri, F.; Sirolla, C.; Spazzafumo, L.; Rippo, M.R.; Marra, M.; Bonfigli, A.R.; Ceriello, A.; Antonicelli, R.; Franceschi, C.; et al. Leukocyte Telomere Length Is Associated with Complications of Type 2 Diabetes Mellitus. Diabet. Med. 2011, 28, 1388–1394. [Google Scholar] [CrossRef] [PubMed]
- Cheng, F.; Luk, A.O.; Tam, C.H.T.; Fan, B.; Wu, H.; Yang, A.; Lau, E.S.H.; Ng, A.C.W.; Lim, C.K.P.; Lee, H.M.; et al. Shortened Relative Leukocyte Telomere Length Is Associated with Prevalent and Incident Cardiovascular Complications in Type 2 Diabetes: Analysis from the Hong Kong Diabetes Register. Diabetes Care 2020, 43, 2257–2265. [Google Scholar] [CrossRef] [PubMed]
- Denic, A.; Glassock, R.J.; Rule, A.D. Structural and Functional Changes with the Aging Kidney. Adv. Chronic Kidney Dis. 2016, 23, 19–28. [Google Scholar] [CrossRef]
- Eguchi, K.; Honig, L.S.; Lee, J.H.; Hoshide, S.; Kario, K. Short Telomere Length Is Associated with Renal Impairment in Japanese Subjects with Cardiovascular Risk. PLoS ONE 2017, 12, e0176138. [Google Scholar] [CrossRef]
- Ramírez, R.; Carracedo, J.; Soriano, S.; Jiménez, R.; Martín-Malo, A.; Rodríguez, M.; Blasco, M.; Aljama, P. Stress-Induced Premature Senescence in Mononuclear Cells from Patients on Long-Term Hemodialysis. Am. J. Kidney Dis. 2005, 45, 353–359. [Google Scholar] [CrossRef]
- van der Harst, P.; Wong, L.S.M.; de Boer, R.A.; Brouilette, S.W.; van der Steege, G.; Voors, A.A.; Hall, A.S.; Samani, N.J.; Wikstrand, J.; van Gilst, W.H.; et al. Possible Association Between Telomere Length and Renal Dysfunction in Patients with Chronic Heart Failure. Am. J. Cardiol. 2008, 102, 207–210. [Google Scholar] [CrossRef]
- Wong, L.S.M.; Van Der Harst, P.; De Boer, R.A.; Codd, V.; Huzen, J.; Samani, N.J.; Hillege, H.L.; Voors, A.A.; Van Gilst, W.H.; Jaarsma, T.; et al. Renal Dysfunction Is Associated with Shorter Telomere Length in Heart Failure. Clin. Res. Cardiol. 2009, 98, 629–634. [Google Scholar] [CrossRef]
- Zhang, W.G.; Wang, Y.; Hou, K.; Jia, L.P.; Ma, J.; Zhao, D.L.; Zhu, S.Y.; Bai, X.J.; Cai, G.Y.; Wang, Y.P.; et al. A Correlation Study of Telomere Length in Peripheral Blood Leukocytes and Kidney Function with Age. Mol. Med. Rep. 2015, 11, 4359–4364. [Google Scholar] [CrossRef]
- Betjes, M.G.H.; Langerak, A.W.; Van Der Spek, A.; De Wit, E.A.; Litjens, N.H.R. Premature Aging of Circulating T Cells in Patients with End-Stage Renal Disease. Kidney Int. 2011, 80, 208–217. [Google Scholar] [CrossRef]
- Melk, A.; Ramassar, V.; Helms, L.M.H.; Moore, R.; Rayner, D.; Solez, K.; Halloran, P.F. Telomere Shortening in Kidneys with Age. J. Am. Soc. Nephrol. 2000, 11, 444–453. [Google Scholar] [CrossRef]
- Yang, H.; Fogo, A.B. Cell Senescence in the Aging Kidney. J. Am. Soc. Nephrol. 2010, 21, 1436–1439. [Google Scholar] [CrossRef]
- López-Otín, C.; Blasco, M.A.; Partridge, L.; Serrano, M.; Kroemer, G. The Hallmarks of Aging. Cell 2013, 153, 1194. [Google Scholar] [CrossRef]
- Tsirpanlis, G.; Chatzipanagiotou, S.; Boufidou, F.; Kordinas, V.; Alevyzaki, F.; Zoga, M.; Kyritsis, I.; Stamatelou, K.; Triantafyllis, G.; Nicolaou, C. Telomerase Activity Is Decreased in Peripheral Blood Mononuclear Cells of Hemodialysis Patients. Am. J. Nephrol. 2006, 26, 91–96. [Google Scholar] [CrossRef]
- Codd, V.; Mangino, M.; Van Der Harst, P.; Braund, P.S.; Kaiser, M.; Beveridge, A.J.; Rafelt, S.; Moore, J.; Nelson, C.; Soranzo, N.; et al. Common Variants near TERC Are Associated with Mean Telomere Length. Nat. Genet. 2010, 42, 197–199. [Google Scholar] [CrossRef]
- Levy, D.; Neuhausen, S.L.; Hunt, S.C.; Kimura, M.; Hwang, S.J.; Chen, W.; Bis, J.C.; Fitzpatrick, A.L.; Smith, E.; Johnson, A.D.; et al. Genome-Wide Association Identifies OBFC1 as a Locus Involved in Human Leukocyte Telomere Biology. Proc. Natl. Acad. Sci. USA 2010, 107, 9293–9298. [Google Scholar] [CrossRef]
- Codd, V.; Nelson, C.P.; Albrecht, E.; Mangino, M.; Deelen, J.; Buxton, J.L.; Hottenga, J.J.; Fischer, K.; Esko, T.; Surakka, I.; et al. Identification of Seven Loci Affecting Mean Telomere Length and Their Association with Disease. Nat. Genet. 2013, 45, 422–427. [Google Scholar] [CrossRef]
- Do, S.K.; Yoo, S.S.; Choi, Y.Y.; Choi, J.E.; Jeon, H.S.; Lee, W.K.; Lee, S.Y.; Lee, J.; Cha, S.I.; Kim, C.H.; et al. Replication of the Results of Genome-Wide and Candidate Gene Association Studies on Telomere Length in a Korean Population. Korean J. Intern. Med. 2015, 30, 719–726. [Google Scholar] [CrossRef]
- Du, J.; Zhu, X.; Xie, C.; Dai, N.; Gu, Y.; Zhu, M.; Wang, C.; Gao, Y.; Pan, F.; Ren, C.; et al. Telomere Length, Genetic Variants and Gastric Cancer Risk in a Chinese Population. Carcinogenesis 2015, 36, 963–970. [Google Scholar] [CrossRef]
- Codd, V.; Denniff, M.; Swinfield, C.; Warner, S.C.; Papakonstantinou, M.; Sheth, S.; Nanus, D.E.; Budgeon, C.A.; Musicha, C.; Bountziouka, V.; et al. Measurement and Initial Characterization of Leukocyte Telomere Length in 474,074 Participants in UK Biobank. Nat. Aging 2022, 2, 170–179. [Google Scholar] [CrossRef] [PubMed]
- van der Spek, A.; Warner, S.C.; Broer, L.; Nelson, C.P.; Vojinovic, D.; Ahmad, S.; Arp, P.P.; Brouwer, R.W.W.; Denniff, M.; van den Hout, M.C.G.N.; et al. Exome Sequencing Analysis Identifies Rare Variants in ATM and RPL8 That Are Associated with Shorter Telomere Length. Front. Genet. 2020, 11, 337. [Google Scholar] [CrossRef] [PubMed]
- Taub, M.A.; Conomos, M.P.; Keener, R.; Pankratz, N.; Reiner, A.P.; Mathias, R.A. Genetic Determinants of Telomere Length from 109,122 Ancestrally Diverse Whole-Genome Sequences in TOPMed. Cell Genom. 2022, 2, 100084. [Google Scholar] [CrossRef] [PubMed]
- Li, C.; Stoma, S.; Lotta, L.A.; Warner, S.; Albrecht, E.; Allione, A.; Arp, P.P.; Broer, L.; Buxton, J.L.; Da Silva Couto Alves, A.; et al. Genome-Wide Association Analysis in Humans Links Nucleotide Metabolism to Leukocyte Telomere Length. Am. J. Hum. Genet. 2020, 106, 389–404. [Google Scholar] [CrossRef]
- Codd, V.; Wang, Q.; Allara, E.; Musicha, C.; Kaptoge, S.; Stoma, S.; Jiang, T.; Hamby, S.E.; Braund, P.S.; Bountziouka, V.; et al. Polygenic Basis and Biomedical Consequences of Telomere Length Variation. Nat. Genet. 2021, 53, 1425–1433. [Google Scholar] [CrossRef]
- Sun, Q.; Liu, J.; Cheng, G.; Dai, M.; Liu, J.; Qi, Z.; Zhao, J.; Li, W.; Kong, F.; Liu, G.; et al. The Telomerase Gene Polymorphisms, but Not Telomere Length, Increase Susceptibility to Primary Glomerulonephritis/End Stage Renal Diseases in Females. J. Transl. Med. 2020, 18, 184. [Google Scholar] [CrossRef]
- Park, S.; Lee, S.; Kim, Y.; Cho, S.; Kim, K.; Kim, Y.C.; Han, S.S.; Lee, H.; Lee, J.P.; Joo, K.W.; et al. A Mendelian Randomization Study Found Causal Linkage between Telomere Attrition and Chronic Kidney Disease. Kidney Int. 2021, 100, 1063–1070. [Google Scholar] [CrossRef]
- Dorajoo, R.; Chang, X.; Gurung, R.L.; Li, Z.; Wang, L.; Wang, R.; Beckman, K.B.; Adams-Haduch, J.; M, Y.; Liu, S.; et al. Loci for Human Leukocyte Telomere Length in the Singaporean Chinese Population and Trans-Ethnic Genetic Studies. Nat. Commun. 2019, 10, 2491. [Google Scholar] [CrossRef]
- Gurung, R.L.; Dorajoo, R.; M, Y.; Wang, L.; Liu, S.; Liu, J.-J.; Shao, Y.M.; Chen, Y.; Sim, X.; Ang, K.; et al. Association of Leukocyte Telomere Length with Chronic Kidney Disease in East Asians with Type 2 Diabetes: A Mendelian Randomization Study. Clin. Kidney J. 2021, 14, 2371–2376. [Google Scholar] [CrossRef]
- Fyhrquist, F.; Tiitu, A.; Saijonmaa, O.; Forsblom, C.; Groop, P.H. Telomere Length and Progression of Diabetic Nephropathy in Patients with Type 1 Diabetes. J. Intern. Med. 2010, 267, 278–286. [Google Scholar] [CrossRef]
- Raschenberger, J.; Kollerits, B.; Ritchie, J.; Lane, B.; Kalra, P.A.; Ritz, E.; Kronenberg, F. Association of Relative Telomere Length with Progression of Chronic Kidney Disease in Two Cohorts: Effect Modification by Smoking and Diabetes. Sci. Rep. 2015, 5, 11887. [Google Scholar] [CrossRef]
- Bansal, N.; Whooley, M.A.; Regan, M.; McCulloch, C.E.; Ix, J.H.; Epel, E.; Blackburn, E.; Lin, J.; Hsu, C.Y. Association between Kidney Function and Telomere Length: The Heart and Soul Study. Am. J. Nephrol. 2012, 36, 405–411. [Google Scholar] [CrossRef]
- Astrup, A.S.; Tarnow, L.; Jorsal, A.; Lajer, M.; Nzietchueng, R.; Benetos, A.; Rossing, P.; Parving, H.H. Telomere Length Predicts All-Cause Mortality in Patients with Type 1 Diabetes. Diabetologia 2010, 53, 45–48. [Google Scholar] [CrossRef]
- Boxall, M.C.; Goodship, T.H.J.; Brown, A.L.; Ward, M.C.; Von Zglinicki, T. Telomere Shortening and Haemodialysis. Blood Purif. 2006, 24, 185–189. [Google Scholar] [CrossRef]
- Januszewski, A.S.; Sutanto, S.S.; McLennan, S.; O’Neal, D.N.; Keech, A.C.; Twigg, S.M.; Jenkins, A.J. Shorter Telomeres in Adults with Type 1 Diabetes Correlate with Diabetes Duration, but Only Weakly with Vascular Function and Risk Factors. Diabetes Res. Clin. Pract. 2016, 117, 4–11. [Google Scholar] [CrossRef]
- Syreeni, A.; Carroll, L.M.; Mutter, S.; Januszewski, A.S.; Forsblom, C.; Lehto, M.; Groop, P.H.; Jenkins, A.J. Telomeres Do Not Always Shorten over Time in Individuals with Type 1 Diabetes. Diabetes Res. Clin. Pract. 2022, 188, 109926. [Google Scholar] [CrossRef]
- Cawthon, R.M. Telomere Measurement by Quantitative PCR. Nucleic Acids Res. 2002, 30, e47. [Google Scholar] [CrossRef]
- Flicek, P.; Amode, M.; Barrell, D.; Beal, K.; Billis, K.; Brent, S. Ensembl 2014. Nucleic Acids Res. 2014, 42, D749–D755. [Google Scholar] [CrossRef]
- Sandholm, N.; Salem, R.M.; McKnight, A.J.; Brennan, E.P.; Forsblom, C.; Isakova, T.; McKay, G.J.; Williams, W.W.; Sadlier, D.M.; Mäkinen, V.P.; et al. New Susceptibility Loci Associated with Kidney Disease in Type 1 Diabetes. PLoS Genet. 2012, 8, e1002921. [Google Scholar] [CrossRef]
- Swan, E.J.; Maxwell, A.P.; Mcknight, A.J. Distinct Methylation Patterns in Genes That Affect Mitochondrial Function Are Associated with Kidney Disease in Blood-Derived DNA from Individuals with Type 1 Diabetes. Diabet. Med. 2015, 32, 1110–1115. [Google Scholar] [CrossRef]
- Smyth, L.J.; Patterson, C.C.; Swan, E.J.; Maxwell, A.P.; McKnight, A.J. DNA Methylation Associated with Diabetic Kidney Disease in Blood-Derived DNA. Front. Cell Dev. Biol. 2020, 8, 561907. [Google Scholar] [CrossRef] [PubMed]
- Gao, C.H.; Yu, G.; Cai, P. GgVennDiagram: An Intuitive, Easy-to-Use, and Highly Customizable R Package to Generate Venn Diagram. Front. Genet. 2021, 12, 706907. [Google Scholar] [CrossRef] [PubMed]
- RStudio Team RStudio: Integrated Development Environment for R 2020. Available online: https://posit.co/download/rstudio-desktop/ (accessed on 27 January 2023).
- Brionne, A.; Juanchich, A.; Hennequet-Antier, C. ViSEAGO: A Bioconductor Package for Clustering Biological Functions Using Gene Ontology and Semantic Similarity. BioData Min. 2019, 12, 16. [Google Scholar] [CrossRef] [PubMed]
- Gagliano Taliun, S.A.; VandeHaar, P.; Boughton, A.P.; Welch, R.P.; Taliun, D.; Schmidt, E.M.; Zhou, W.; Nielsen, J.B.; Willer, C.J.; Lee, S.; et al. Exploring and Visualizing Large-Scale Genetic Associations by Using PheWeb. Nat. Genet. 2020, 52, 550–552. [Google Scholar] [CrossRef]
- Cmdkp.org Common Metabolic Diseases Knowledge Portal. Available online: https://hugeamp.org/ (accessed on 1 April 2023).
- Sollis, E.; Mosaku, A.; Abid, A.; Buniello, A.; Cerezo, M.; Gil, L.; Groza, T.; Güneş, O.; Hall, P.; Hayhurst, J.; et al. The NHGRI-EBI GWAS Catalog: Knowledgebase and Deposition Resource. Nucleic Acids Res. 2023, 51, D977–D985. [Google Scholar] [CrossRef]
- Levin, A.; Reznichenko, A.; Witasp, A.; Liu, P.; Greasley, P.J.; Sorrentino, A.; Bruchfeld, A.; Barany, P.; Blondal, T.; Zambrano, S.; et al. Novel Insights into the Disease Transcriptome of Human Diabetic Glomeruli and Tubulointerstitium. Nephrol. Dial. Transplant. 2020, 35, 2059–2072. [Google Scholar] [CrossRef]
- Fan, Y.; Yi, Z.; Agati, V.D.D.; Sun, Z.; Zhong, F.; Zhang, W.; Wen, J.; Zhou, T.; Li, Z.; He, L.; et al. Comparison of Kidney Transcriptomic Profiles of Early and Advanced Diabetic Nephropathy Reveals Potential New Mechanisms for Disease Progression. Diabetes 2019, 68, 2301–2314. [Google Scholar] [CrossRef]
- Kassambara, A. Ggpubr 2020. Available online: https://cran.r-project.org/web/packages/ggpubr/index.html (accessed on 27 January 2023).
- Wickham, H. Ggplot2: Elegant Graphics for Data Analysis; Springer: New York, NY, USA, 2016. [Google Scholar]
- Martin-Ruiz, C.M.; Baird, D.; Roger, L.; Boukamp, P.; Krunic, D.; Cawthon, R.; Dokter, M.M.; Van der Harst, P.; Bekaert, S.; De Meyer, T.; et al. Reproducibility of Telomere Length Assessment: An International Collaborative Study. Int. J. Epidemiol. 2015, 44, 1673–1683. [Google Scholar] [CrossRef]
- Martin-Ruiz, C.M.; Baird, D.; Roger, L.; Boukamp, P.; Krunic, D.; Cawthon, R.; Dokter, M.M.; Van Der Harst, P.; Bekaert, S.; De Meyer, T.; et al. Is Southern Blotting Necessary to Measure Telomere Length Reproducibly? Authors’ Response to: Commentary: The Reliability of Telomere Length Measurements. Int. J. Epidemiol. 2015, 44, 1686–1687. [Google Scholar] [CrossRef]
- Andreu-Sánchez, S.; Aubert, G.; Ripoll-Cladellas, A.; Henkelman, S.; Zhernakova, D.V.; Sinha, T.; Kurilshikov, A.; Cenit, M.C.; Jan Bonder, M.; Franke, L.; et al. Genetic, Parental and Lifestyle Factors Influence Telomere Length. Commun. Biol. 2022, 5, 565. [Google Scholar] [CrossRef]
- Zhang, Q.; Marioni, R.E.; Robinson, M.R.; Higham, J.; Sproul, D.; Wray, N.R.; Deary, I.J.; McRae, A.F.; Visscher, P.M. Genotype Effects Contribute to Variation in Longitudinal Methylome Patterns in Older People. Genome Med. 2018, 10, 75. [Google Scholar] [CrossRef]
- Verbanck, M.; Chen, C.Y.; Neale, B.; Do, R. Detection of Widespread Horizontal Pleiotropy in Causal Relationships Inferred from Mendelian Randomization between Complex Traits and Diseases. Nat. Genet. 2018, 50, 693–698. [Google Scholar] [CrossRef]
- Hill, C.; Duffy, S.; Coulter, T.; Maxwell, A.P. Harnessing Genomic Analysis to Explore the Role of Telomeres in the Pathogenesis and Progression of Diabetic Kidney Disease. Genes 2023, 14, 609. [Google Scholar] [CrossRef]
- Pykhtina, V.S.; Strazhesko, I.D.; Tkacheva, O.N.; Akasheva, D.U.; Dudinskaya, E.N.; Vygodin, V.A.; Plokhova, E.V.; Kruglikova, A.S.; Boitsov, S.A. Association of Renal Function, Telomere Length, and Markers of Chronic Inflammation in Patients without Chronic Kidney and Cardiovascular Diseases. Adv. Gerontol. 2016, 6, 217–223. [Google Scholar] [CrossRef]
- Haycock, P.C. Association Between Telomere Length and Risk of Cancer and Non-Neoplastic Diseases: A Mendelian Randomization Study. JAMA Oncol. 2017, 3, 636–651. [Google Scholar] [CrossRef]
- Shiels, P.G.; Painer, J.; Natterson-Horowitz, B.; Johnson, R.J.; Miranda, J.J.; Stenvinkel, P. Manipulating the Exposome to Enable Better Ageing. Biochem. J. 2021, 478, 2889–2898. [Google Scholar] [CrossRef]
- Mafra, D.; Borges, N.A.; Lindholm, B.; Shiels, P.G.; Evenepoel, P.; Stenvinkel, P. Food as Medicine: Targeting the Uraemic Phenotype in Chronic Kidney Disease. Nat. Rev. Nephrol. 2021, 17, 153–171. [Google Scholar] [CrossRef]
- Smyth, L.J.; Kilner, J.; Nair, V.; Liu, H.; Brennan, E.; Kerr, K.; Sandholm, N.; Cole, J.; Dahlström, E.; Syreeni, A.; et al. Assessment of Differentially Methylated Loci in Individuals with End-Stage Kidney Disease Attributed to Diabetic Kidney Disease: An Exploratory Study. Clin. Epigenetics 2021, 13, 99. [Google Scholar] [CrossRef]
- Crabbe, L.; Verdun, R.E.; Haggblom, C.I.; Karlseder, J. Defective Telomere Lagging Strand Synthesis in Cells Lacking WRN Helicase Activity. Science 2004, 306, 1951–1953. [Google Scholar] [CrossRef]
- Gocha, A.R.S.; Acharya, S.; Groden, J. WRN Loss Induces Switching of Telomerase-Independent Mechanisms of Telomere Elongation. PLoS ONE 2014, 9, e93991. [Google Scholar] [CrossRef]
- Multani, A.S.; Chang, S. WRN at Telomeres: Implications for Aging and Cancer. J. Cell Sci. 2007, 120, 713–721. [Google Scholar] [CrossRef] [PubMed]
- Machwe, A.; Xiao, L.; Orren, D.K. TRF2 Recruits the Werner Syndrome (WRN) Exonuclease for Processing of Telomeric DNA. Oncogene 2004, 23, 149–156. [Google Scholar] [CrossRef] [PubMed]
- Opresko, P.L.; Otterlei, M.; Graakjær, J.; Bruheim, P.; Dawut, L.; Kølvraa, S.; May, A.; Seidman, M.M.; Bohr, V.A. The Werner Syndrome Helicase and Exonuclease Cooperate to Resolve Telomeric D Loops in a Manner Regulated by TRF1 and TRF2. Mol. Cell 2004, 14, 763–774. [Google Scholar] [CrossRef] [PubMed]
- Das, A.; Grotsky, D.A.; Neumann, M.A.; Kreienkamp, R.; Gonzalez-suarez, I.; Redwood, A.B.; Kennedy, B.K.; Stewart, C.L.; Gonzalo, S. Lamin A Δ Exon9 Mutation Leads to Telomere and Chromatin Defects but Not Genomic Instability. Nucleus 2013, 4, 410–419. [Google Scholar] [CrossRef] [PubMed]
- Quirós-González, I.; Román-García, P.; Alonso-Montes, C.; Barrio-Vázquez, S.; Carrillo-López, N.; Naves-Díaz, M.; Mora, M.I.; Corrales, F.J.; López-Hernández, F.J.; Ruiz-Torres, M.P.; et al. Lamin A Is Involved in the Development of Vascular Calcification Induced by Chronic Kidney Failure and Phosphorus Load. Bone 2016, 84, 160–168. [Google Scholar] [CrossRef]
- Liu, H.; Doke, T.; Guo, D.; Sheng, X.; Ma, Z.; Park, J.; Vy, H.M.T.; Nadkarni, G.N.; Abedini, A.; Miao, Z.; et al. Epigenomic and Transcriptomic Analyses Define Core Cell Types, Genes and Targetable Mechanisms for Kidney Disease. Nat. Genet. 2022, 54, 950–962. [Google Scholar] [CrossRef]
- Imamura, M.; Maeda, S.; Yamauchi, T.; Hara, K.; Yasuda, K.; Morizono, T.; Takahashi, A.; Horikoshi, M.; Nakamura, M.; Fujita, H.; et al. A Single-Nucleotide Polymorphism in ANK1 Is Associated with Susceptibility to Type 2 Diabetes in Japanese Populations. Hum. Mol. Genet. 2012, 21, 3042–3049. [Google Scholar] [CrossRef]
- Sinnott-Armstrong, N.; Tanigawa, Y.; Amar, D.; Mars, N.; Benner, C.; Aguirre, M.; Venkataraman, G.R.; Wainberg, M.; Ollila, H.M.; Kiiskinen, T.; et al. Genetics of 35 Blood and Urine Biomarkers in the UK Biobank. Nat. Genet. 2021, 53, 185–194. [Google Scholar] [CrossRef]
- Gholaminejad, A.; Fathalipour, M.; Roointan, A. Comprehensive Analysis of Diabetic Nephropathy Expression Profile Based on Weighted Gene Co-Expression Network Analysis Algorithm. BMC Nephrol. 2021, 22, 245. [Google Scholar] [CrossRef]
- Miranda-Díaz, A.G.; Pazarín-Villaseñor, L.; Yanowsky-Escatell, F.G.; Andrade-Sierra, J. Oxidative Stress in Diabetic Nephropathy with Early Chronic Kidney Disease. J. Diabetes Res. 2016, 2016, 7047238. [Google Scholar] [CrossRef]
- Barnes, R.P.; Fouquerel, E.; Opresko, P.L. The Impact of Oxidative DNA Damage and Stress on Telomere Homeostasis. Mech. Ageing Dev. 2019, 177, 37–45. [Google Scholar] [CrossRef]
- Ge, Z.; Li, W.; Wang, N.; Liu, C.; Zhu, Q.; Björkholm, M.; Gruber, A.; Xu, D. Chromatin Remodeling: Recruitment of Histone Demethylase RBP2 by Madl for Transcriptional Repression of a Myc Target Gene, Telomerase Reverse Transcriptase. FASEB J. 2010, 24, 579–586. [Google Scholar] [CrossRef]
- Cohen, S.B.; Graham, M.E.; Lovrecz, G.O.; Bache, N.; Robinson, P.J.; Reddel, R.R. Protein Composition of Catalytically Active Human Telomerase from Immortal Cells. Science 2007, 315, 1850–1853. [Google Scholar] [CrossRef]
- Cheng, H.; Fan, X.; Lawson, W.E.; Paueksakon, P.; Harris, R.C. Telomerase Deficiency Delays Renal Recovery in Mice after Ischemia-Reperfusion Injury by Impairing Autophagy. Kidney Int. 2015, 88, 85–94. [Google Scholar] [CrossRef]
- Westhoff, J.H.; Schildhorn, C.; Jacobi, C.; Hömme, M.; Hartner, A.; Braun, H.; Kryzer, C.; Wang, C.; von Zglinicki, T.; Kränzlin, B.; et al. Telomere Shortening Reduces Regenerative Capacity after Acute Kidney Injury. J. Am. Soc. Nephrol. 2010, 21, 327–336. [Google Scholar] [CrossRef]
- Choi, J.; Southworth, L.K.; Sarin, K.Y.; Venteicher, A.S.; Ma, W.; Chang, W.; Cheung, P.; Jun, S.; Artandi, M.K.; Shah, N.; et al. TERT Promotes Epithelial Proliferation through Transcriptional Control of a Myc- and Wnt-Related Developmental Program. PLoS Genet. 2008, 4, e10. [Google Scholar] [CrossRef]
- Mafra, D.; Esgalhado, M.; Borges, N.A.; Cardozo, L.F.M.F.; Stockler-Pinto, M.B.; Craven, H.; Buchanan, S.J.; Lindholm, B.; Stenvinkel, P.; Shiels, P.G. Methyl Donor Nutrients in Chronic Kidney Disease: Impact on the Epigenetic Landscape. J. Nutr. 2019, 149, 372–380. [Google Scholar] [CrossRef]
- Zhang, L.; Zhang, Q.; Liu, S.; Chen, Y.; Li, R.; Lin, T.; Yu, C.; Zhang, H.; Huang, Z.; Zhao, X.; et al. DNA Methyltransferase 1 May Be a Therapy Target for Attenuating Diabetic Nephropathy and Podocyte Injury. Kidney Int. 2017, 92, 140–153. [Google Scholar] [CrossRef]
- Park, J.-I.; Venteicher, A.S.; Hong, J.Y.; Choi, J.; Jun, S.; Shkreli, M.; Chang, W.; Meng, Z.; Cheung, P.; Ji, H.; et al. Telomerase Modulates Wnt Signalling by Association with Target Gene Chromatin. Nature 2009, 460, 66–72. [Google Scholar] [CrossRef]
- Sarin, K.Y.; Cheung, P.; Gilison, D.; Lee, E.; Tennen, R.I.; Artandi, M.K.; Oro, A.E.; Artandi, S.E. Conditional Telomerase Induction Causes Proliferation of Hair Follicle Stem Cells. Nature 2005, 436, 1048–1052. [Google Scholar] [CrossRef]
- Shkreli, M.; Sarin, K.Y.; Pech, M.F.; Papeta, N.; Chang, W.; Kuo, C.J.; Gharavi, A.G.; Agati, V.D.D.; Artandi, S.E. Reversible Cell Cycle Entry in Adult Kidney Podocytes through Regulated Control of Telomerase and Wnt Signaling. Nat. Methods 2012, 18, 111–119. [Google Scholar] [CrossRef] [PubMed]
- Wang, Y.; Zhou, C.J.; Liu, Y. Wnt Signaling in Kidney Development and Disease. Prog. Mol. Biol. Transl. Sci. 2018, 153, 181–207. [Google Scholar] [CrossRef] [PubMed]
- Zhou, L.; Liu, Y. Wnt/β-Catenin Signalling and Podocyte Dysfunction in Proteinuric Kidney Disease. Nat. Rev. Nephrol. 2015, 11, 535–545. [Google Scholar] [CrossRef] [PubMed]
- Dai, C.; Stolz, D.B.; Kiss, L.P.; Monga, S.P.; Holzman, L.B.; Liu, Y. Wnt/β-Catenin Signaling Promotes Podocyte Dysfunction and Albuminuria. J. Am. Soc. Nephrol. 2009, 20, 1997–2008. [Google Scholar] [CrossRef] [PubMed]
- Kato, H.; Gruenwald, A.; Suh, J.H.; Miner, J.H.; Barisoni-Thomas, L.; Taketo, M.M.; Faul, C.; Millar, S.E.; Holzman, L.B.; Susztak, K. Wnt/β-Catenin Pathway in Podocytes Integrates Cell Adhesion, Differentiation, and Survival. J. Biol. Chem. 2011, 286, 26003–26015. [Google Scholar] [CrossRef]
- Li, C.; Siragy, H.M. High Glucose Induces Podocyte Injury via Enhanced (Pro)Renin Receptor-Wnt-β-Catenin-Snail Signaling Pathway. PLoS ONE 2014, 9, e89233. [Google Scholar] [CrossRef]
- Muñoz-Castañeda, J.R.; Rodelo-Haad, C.; Pendon-Ruiz de Mier, M.V.; Martin-Malo, A.; Santamaria, R.; Rodriguez, M. Klotho/FGF23 and Wnt Signaling as Important Players in the Comorbidities Associated with Chronic Kidney Disease. Toxins 2020, 12, 185. [Google Scholar] [CrossRef]
- Navarro-González, J.F.; Sanchez-Nino, M.D.; Donate-Correa, J.; Martín-Núnez, E.; Ferri, C.; Pérez-Delgado, N.; Górriz, J.L.; Martínez-Castelao, A.; Ortiz, A.; Mora-Fernandez, C. Effects of Pentoxifylline on Soluble Klotho Concentrations and Renal Tubular Cell Expression in Diabetic Kidney Disease. Diabetes Care 2018, 41, 1817–1820. [Google Scholar] [CrossRef]
- Hu, M.C.; Kuro-O, M.; Moe, O.W. Klotho and Chronic Kidney Disease. Contrib. Nephrol. 2013, 180, 47–63. [Google Scholar] [CrossRef]
- Jiang, L.; Xu, L.; Song, Y.; Li, J.; Mao, J.; Zhao, A.Z.; He, W.; Yang, J.; Dai, C. Calmodulin-Dependent Protein Kinase II/CAMP Response Element-Binding Protein/Wnt/β-Catenin Signaling Cascade Regulates Angiotensin II-Induced Podocyte Injury and Albuminuria. J. Biol. Chem. 2013, 288, 23368–23379. [Google Scholar] [CrossRef]
- McKnight, A.J.; Patterson, C.C.; Pettigrew, K.A.; Savage, D.A.; Kilner, J.; Murphy, M.; Sadlier, D.; Maxwell, A.P. A GREM1 Gene Variant Associates with Diabetic Nephropathy. J. Am. Soc. Nephrol. 2010, 21, 773–781. [Google Scholar] [CrossRef]
- Tarnow, L.; Groop, P.H.; Hadjadj, S.; Kazeem, G.; Cambien, F.; Marre, M.; Forsblom, C.; Parving, H.H.; Trégouët, D.; Thévard, A.; et al. European Rational Approach for the Genetics of Diabetic Complications - EURAGEDIC: Patient Populations and Strategy. Nephrol. Dial. Transplant. 2008, 23, 161–168. [Google Scholar] [CrossRef]
- Lajer, M.; Tarnow, L.; Fleckner, J.; Hansen, B.V.; Edwards, D.G.; Parving, H.H.; Boel, E. Association of Aldose Reductase Gene Z+2 Polymorphism with Reduced Susceptibility to Diabetic Nephropathy in Caucasian Type 1 Diabetic Patients. Diabet. Med. 2004, 21, 867–873. [Google Scholar] [CrossRef]
- Syreeni, A.; El-Osta, A.; Forsblom, C.; Sandholm, N.; Parkkonen, M.; Tarnow, L.; Parving, H.H.; McKnight, A.J.; Maxwell, A.P.; Cooper, M.E.; et al. Genetic Examination of SETD7 and SUV39H1/H2 Methyltransferases and the Risk of Diabetes Complications in Patients with Type 1 Diabetes. Diabetes 2011, 60, 3073–3080. [Google Scholar] [CrossRef]
- Williams, W.W.; Salem, R.M.; McKnight, A.J.; Sandholm, N.; Forsblom, C.; Taylor, A.; Guiducci, C.; McAteer, J.B.; McKay, G.J.; Isakova, T.; et al. Association Testing of Previously Reported Variants in a Large Case-Control Meta-Analysis of Diabetic Nephropathy. Diabetes 2012, 61, 2187–2194. [Google Scholar] [CrossRef]
- Gray, K.; Daugherty, L.; Gordon, S.; Seal, R.; Wright, M.; Bruford, E. Genenames.Org: The HGNC Resources in 2013. Nucleic Acids Res. 2012, 41, D545–D552. [Google Scholar] [CrossRef]
- Purcell, S.; Neale, B.; Todd-Brown, K.; Thomas, L.; Ferreira, M.A.R.; Bender, D.; Maller, J.; Sklar, P.; De Bakker, P.I.W.; Daly, M.J.; et al. PLINK: A Tool Set for Whole-Genome Association and Population-Based Linkage Analyses. Am. J. Hum. Genet. 2007, 81, 559–575. [Google Scholar] [CrossRef]
- McLaren, W.; Gil, L.; Hunt, S.E.; Riat, H.S.; Ritchie, G.R.S.; Thormann, A.; Flicek, P.; Cunningham, F. The Ensembl Variant Effect Predictor. Genome Biol. 2016, 17, 122. [Google Scholar] [CrossRef]
- Turner, S. Qqman: An R Package for Visualizing GWAS Results Using Q-Q and Manhattan Plots. J. Open Source Softw. 2018. [Google Scholar] [CrossRef]
- Rayner, W. Genotyping Chips Strand and Build Files. Available online: https://www.well.ox.ac.uk/~wrayner/strand/ (accessed on 1 April 2023).
- Hemani, G.; Zheng, J.; Elsworth, B.; Wade, K.H.; Haberland, V.; Baird, D.; Laurin, C.; Burgess, S.; Bowden, J.; Langdon, R.; et al. The MR-Base Platform Supports Systematic Causal Inference across the Human Phenome. Elife 2018, 7, e34408. [Google Scholar] [CrossRef]
- Hemani, G.; Tilling, K.; Smith, G.D. Orienting the Causal Relationship between Imprecisely Measured Traits Using Genetic Instruments. PLoS Comput. Biol. 2017, 13, e1007081. [Google Scholar] [CrossRef]
- Zhao, Q.; Wang, J.; Hemani, G.; Bowden, J.; Small, D.S. Statistical Inference in Two-Sample Summary-Data Mendelian Randomization Using Robust Adjusted Profile Score. Ann. Stat. 2020, 48, 1742–1769. [Google Scholar]
- Huang, D.W.; Sherman, B.T.; Stephens, R.; Baseler, M.W.; Lane, H.C.; Lempicki, R.A. DAVID Gene ID Conversion Tool. Bioinformatician.Net 2008, 2, 428–430. [Google Scholar] [CrossRef] [PubMed]
- Huang, D.W.; Sherman, B.T.; Lempicki, R.A. Systematic and Integrative Analysis of Large Gene Lists Using DAVID Bioinformatics Resources. Nat. Protoc. 2009, 4, 44–57. [Google Scholar] [CrossRef]
- Huang, D.W.; Sherman, B.T.; Lempicki, R.A. Bioinformatics Enrichment Tools: Paths toward the Comprehensive Functional Analysis of Large Gene Lists. Nucleic Acids Res. 2009, 37, 1–13. [Google Scholar] [CrossRef]
- Brionne, A.; Juanchich, A.; Christelle, H.-A. An Overview of ViSEAGO: Visualisation, Semantic Similarity, Enrichment Analysis of Gene Ontology. Available online: http://bioconductor.org/packages/devel/bioc/vignettes/ViSEAGO/inst/doc/ViSEAGO.html (accessed on 1 April 2023).
- Law, C.W.; Chen, Y.; Shi, W.; Smyth, G.K. Voom: Precision Weights Unlock Linear Model Analysis Tools for RNA-Seq Read Counts. Genome Biol. 2014, 15, R29. [Google Scholar] [CrossRef]
- Liu, R.; Holik, A.Z.; Su, S.; Jansz, N.; Chen, K.; Leong, H.S.; Blewitt, M.E.; Asselin-Labat, M.L.; Smyth, G.K.; Ritchie, M.E. Why Weight? Modelling Sample and Observational Level Variability Improves Power in RNA-Seq Analyses. Nucleic Acids Res. 2015, 43, e97. [Google Scholar] [CrossRef]
- Afgan, E.; Baker, D.; Batut, B.; Van Den Beek, M.; Bouvier, D.; Ech, M.; Chilton, J.; Clements, D.; Coraor, N.; Grüning, B.A.; et al. The Galaxy Platform for Accessible, Reproducible and Collaborative Biomedical Analyses: 2018 Update. Nucleic Acids Res. 2018, 46, W537–W544. [Google Scholar] [CrossRef]
- Benjamini, Y.; Hochberg, Y. Controlling the False Discovery Rate: A Practical and Powerful Approach to Multiple Testing. J. R. Stat. Soc. 1995, 57, 289–300. [Google Scholar] [CrossRef]
Disclaimer/Publisher’s Note: The statements, opinions and data contained in all publications are solely those of the individual author(s) and contributor(s) and not of MDPI and/or the editor(s). MDPI and/or the editor(s) disclaim responsibility for any injury to people or property resulting from any ideas, methods, instructions or products referred to in the content. |
© 2023 by the authors. Licensee MDPI, Basel, Switzerland. This article is an open access article distributed under the terms and conditions of the Creative Commons Attribution (CC BY) license (https://creativecommons.org/licenses/by/4.0/).