Article

Characterization and Phylogenetic Analysis of the Complete Mitochondrial Genome of Aythya marila

College of Life Science, Qufu Normal University, Qufu 273165, China
*
Author to whom correspondence should be addressed.
These authors contributed equally to this work.
Genes 2023, 14(6), 1205; https://doi.org/10.3390/genes14061205
Submission received: 14 March 2023 / Revised: 25 May 2023 / Accepted: 29 May 2023 / Published: 31 May 2023
(This article belongs to the Section Animal Genetics and Genomics)

Abstract

:
Aythya marila is a large diving duck belonging to the family Anatidae. However, the phylogenetic relationship among these Aythya species remains unclear due to the presence of extensive interspecific hybridization events within the Aythya genus. Here, we sequenced and annotated the complete mitochondrial genome of A. marila, which contained 22 tRNAs, 13 protein-coding genes (PCGs), 2 ribosomal RNAs, and 1 D-loop, with a length of 16,617 bp. The sizes of the PCGs ranged from 297 to 1824 bp and were all, except for ND6, located on the heavy chain (H). ATG and TAA were the most common start and termination codons of the 13 PCGs, respectively. The fastest- and slowest-evolving genes were ATP8 and COI, respectively. Codon usage analysis indicated that CUA, AUC, GCC, UUC, CUC, and ACC were the six most frequent codons. The nucleotide diversity values indicated a high level of genetic diversity in A. marila. FST analysis suggested a widespread gene exchange between A. baeri and A. nyroca. Moreover, phylogenetic reconstructions using the mitochondrial genomes of all available Anatidae species showed that, in addition to A. marila, four major clades among the Anatidae (Dendrocygninae, Oxyurinae, Anserinae, and Anatinae) were closely related to A. fuligula. Overall, this study provides valuable information on the evolution of A. marila and new insights into the phylogeny of Anatidae.

1. Introduction

The greater scaup (Aythya marila) is a relatively large diving duck belonging to the order Anseriformes, subfamily Anatinae, and family Anatidae. This species is mainly distributed throughout North Eurasia from Iceland eastward to the Lena River in Siberia, and winters mainly in Northwest Europe and around the Adriatic, Black, and Caspian Seas. In summer, the greater scaup primarily feeds on insects, crustaceans, and mollusks, in particular small bivalves, snails, and amphipods. The greater scaup is the only circumpolar Aythya and one of the few circumpolar duck species. It is also the only species in the genus Aythya that has subspecies: A. marila marila and A. marila nearctica [1]. However, to date, little is known about its biology compared to other Aythya species, partly due to its relatively isolated breeding grounds and the difficulty in distinguishing it from its close relative, the lesser scaup (A. affinis) [2,3].
Aythya originated in the Miocene, and there are 12 extant species worldwide [4]. Of these, five species (A. ferina, A. nyroca, A. baeri, A. fuligula, and A. marila) are widely distributed across China. However, due to the late differentiation between Aythya species and serious interspecific hybridization [5,6,7], the phylogenetic relationship among these five Aythya species remains unclear. Recent research has shown that there is a substantial spatial overlap in the distribution ranges of A. nyroca and A. baeri. This overlap may have a detrimental effect on the conservation status of A. baeri, which has a relatively small population. As such, it is crucial to assess the potential risk of hybridization between these two species.
Mitochondria are important functional organelles that provide energy for various cellular biological functions [8]. The animal mitochondrial genome is a circular, closed, double-stranded molecule, usually ranging from 15 to 21 kb in size, with 37 genes, including 13 protein-coding genes (PCGs: ND1, ND2, ND3, ND4, ND4L, ND5, ND6, COI, COII, COIII, ATP6, ATP8, and Cytb), 2 ribosomal RNAs (12S rRNA and 16S rRNA), 22 transfer RNAs (tRNA), and an A + T-rich noncoding control region [9,10,11]. The mitochondrial genome is a highly conserved molecule characterized by its rapid evolutionary rate, maternal inheritance, haploid nature, and limited recombination in comparison to nuclear genes [12,13,14]. Owing to these attributes, mitochondrial genomes have become increasingly utilized in phylogenetic analyses, population genetic diversity studies, and evolutionary research [15,16,17]. In particular, complete mitochondrial genomes offer substantially more information for phylogenetic analysis than a single mitochondrial gene. However, it is important to note that the mitochondrial genome may not accurately depict the population structure of species due to factors such as gender bias, dispersal behavior, and frequent hybridization events.
In this study, we assembled and annotated the first complete sequence of the mitochondrial genome of the greater scaup and assembled twenty-eight complete mitochondrial genomes of five species: six A. ferina, four A. nyroca, six A. baeri, six A. fuligula, and six A. marila. We analyzed the gene content, codon usage bias, repeat sequences, and synonymous and nonsynonymous substitution rates of the greater scaup. Additionally, we revealed the phylogenetic relationships among Anatidae species and the population genetic diversity of A. ferina, A. nyroca, A. baeri, A. fuligula, and A. marila based on a combined set of mitochondrial genes.

2. Materials and Methods

2.1. Ethics

All experimental protocols were approved by the Qufu Normal University Biomedical Ethics Committee, and all experiments followed the recommendations in the ARRIVE guidelines (Ethical proof 2021097). All animal experiments were performed in accordance with relevant guidelines and regulations.

2.2. Specimen Collection, Genome Sequencing, and Assembly

The tissue samples of A. marila used in this study originated from the Wildlife Inspection Center of the Northeast Forestry University; no living animal was involved in this study. Samples were stored at −80 °C ultralow-temperature freezer. Total genomic DNA was extracted from the tissue using the DNeasy Blood & Tissue Kit (QIAGEN, Beverly, MA, USA). The whole genome of A. marila was sequenced by Sangon Biotech Co., Ltd. (Shanghai, China) using an Illumina NovaSeq 6000 platform (Illumina, San Diego, CA, USA). Approximately 4.7 Gb of raw data from 150 bp paired-end reads were generated. Raw data were processed using Fastp v0.36 [18] and assembled using SPAdes v3.15 [19]. GapFillerr v1.11 [20] was used to fill the gaps, whereas PrInSeS-G was used for sequence correction. In addition, we sequenced 28 samples from 5 species of Aythya using an Illumina NovaSeq 6000 platform and obtained high-quality raw genome sequencing data (Table 1). We then used the NOVOPlasty software (V 4.1) to assemble 28 complete mitochondrial genomes of the 5 species: A. ferina, A. nyroca, A. baeri, A. fuligula, and A. marila.

2.3. Annotation and Sequence Analysis

Gene annotation was conducted using the web-based service MITOS (http://mitos.bioinf.uni-leipzig.de/help.py, accessed on 15 August 2022) [21]. The online tRNAscan-SE search server (http://lowelab.ucsc.edu/tRNAscan-SE, accessed on 17 October 2022) [22] was used to annotate the tRNA gene and determine its position and secondary structures were inferred. The mitochondrial genome map of A. marila was drawn using the online tool CGView Server (http://cgview.ca/, accessed on 20 October 2022) [23].
The relative synonymous codon usage (RSCU) was calculated using EMBOSS v6.6.0.0 [24], and the base composition was estimated using the BioEdit program (v7.0.9.0) (http://www.mbio.ncsu.edu/BioEdit/bioedit.html, accessed on 21 October 2022) [25]. The Ka/Ks ratios were calculated individually for each protein-coding gene of A. marila using DnaSP v65 [26]. GC-skews and AT-skews were used to estimate bias in nucleotide composition across the sequence [27]. The bias of nucleotide composition was calculated using the following formulas [28]:
AT-skew = (A − T)/(A + T) and GC-skew = (G − C)/(G + C)

2.4. Phylogenetic Analysis

In this study, we generated two distinct phylogenetic trees to elucidate the evolutionary relationships within the Anatidae family. Initially, to determine the taxonomic position of A. marila, we retrieved 51 Anatidae mitochondrial genomes from GenBank and included Buteo hemilasius and Gallus gallus as outgroup taxa. We constructed Bayesian inference (BI) and maximum likelihood (ML) phylogenetic trees of the 54 mitogenomic sequences based on 13 mtDNA PCGs (ND1, ND2, ND3, ND4, ND4L, ND5, ND6, COI, COII, COIII, ATP6, ATP8, and Cytb). MAFFT v. 7.475 [29] was used for the alignment of the nucleotide sequences of the 13 PCGs, and ambiguously aligned regions were identified and removed by Gblocks [30]. The alignments of individual genes were then concatenated using PhyloSuite [31]. According to the Bayesian information criterion (BIC), ModelFinder2.2.1 [32] was used to determine the best partitioning scheme and substitution model, and the GTR + F + I + G4 model was chosen as the best fit for the ML method. ML analysis was performed using IQ-TREE [33] and conducted with 5000 ultrafast bootstrap replicates. The BI method was performed using MrBayes [34] with 4 simultaneous Markov chain Monte Carlo (MCMC) chains running for 2,000,000 generations and sampling every 1000 generations with a burn-in of 25%. Subsequently, to further investigate the population structure among 5 Aythya species, we aligned 28 complete mitochondrial genomes using MEGA and constructed a phylogenetic tree, selecting Anas platyrhynchos as the outgroup. Lastly, the resulting phylogenetic trees were annotated and visualized using the Interactive Tree of Life (iTOL) online service [35] (https://itol.embl.de/, accessed on 4 October 2022).

3. Results and Discussion

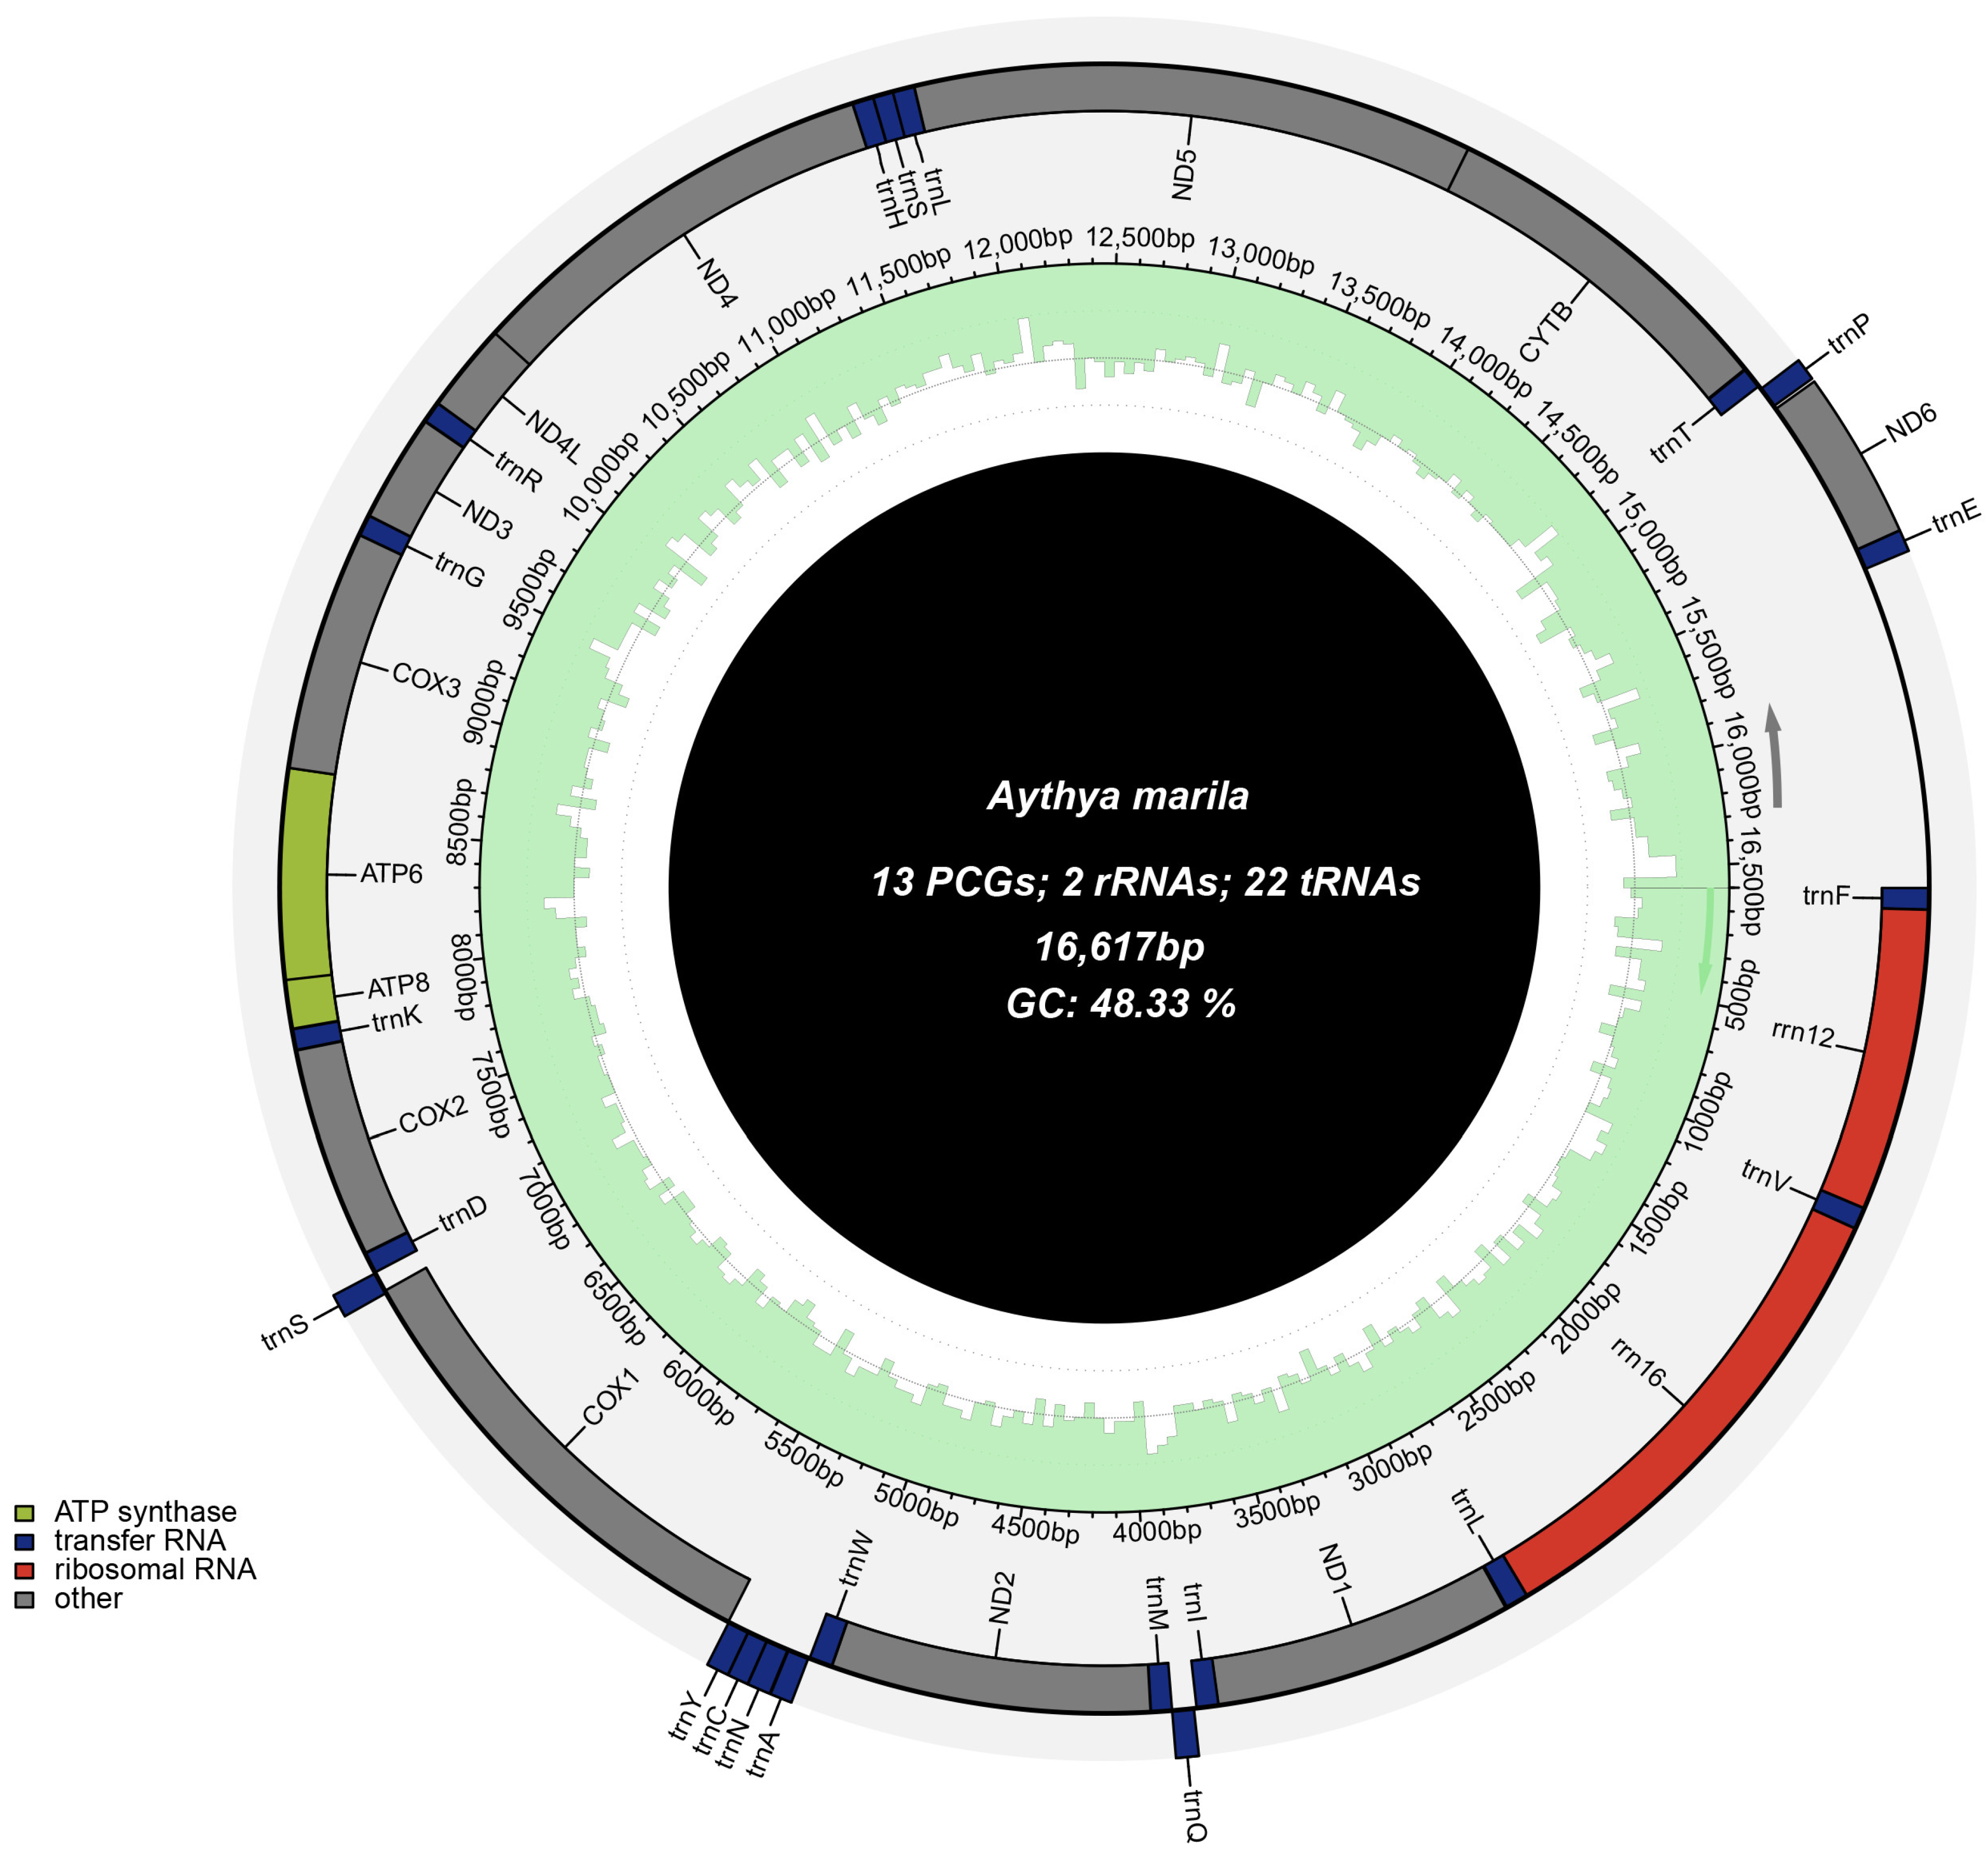
3.1. Genome Structure and Composition

The complete mitochondrial genome sequence of A. marila is a typical closed-circular molecule with a size of 16,617 bp and has been deposited in GenBank under the accession number OP326610. The mitochondrial genome contents of A. marila are similar to those of most other published Aythya, which includes 37 genes [36], 13 PCGs, 22 tRNAs, 2 rRNAs (rrnL and rrnS), and a control region (D-loop) (Figure 1). Among the 37 fragment genes, a PCG (ND6) and 8 tRNA genes (tRNA-Ala, tRNA-Cys, tRNA-Glu, tRNA-Gln, tRNA-Asn, tRNA-Pro, tRNA-Ser2, and tRNA-Tyr) were located on the light strand (L-strand), whereas the CR and the remaining 28 genes were located on the heavy strand (H-strand). The gene order was the same as that in most bird mitochondrial genomes [37,38] (Table 2). The total length of protein-coding, tRNA, and rRNA genes comprised 68.65%, 9.29%, and 15.57% of the entire mitochondrial genome, respectively. The base composition of the A. marila genome was 29.42% A, 22.25% T, 15.49% G, and 32.84% C, and the A + T content (51.67%) was higher than the G + C content (48.33%), suggesting a strong A + T bias. A relatively high AT content has also been reported in other Aythya species [36]. In addition, AT-skews and GC-skews are often used to assess nucleotide-compositional differences in mitochondrial genomes [39]. We found that the A. marila mitochondrial genome AT-skew (0.139) was positive, whereas the GC-skew (−0.359) was negative, indicating higher A and C abundances than T and G abundances, respectively (Table 3).

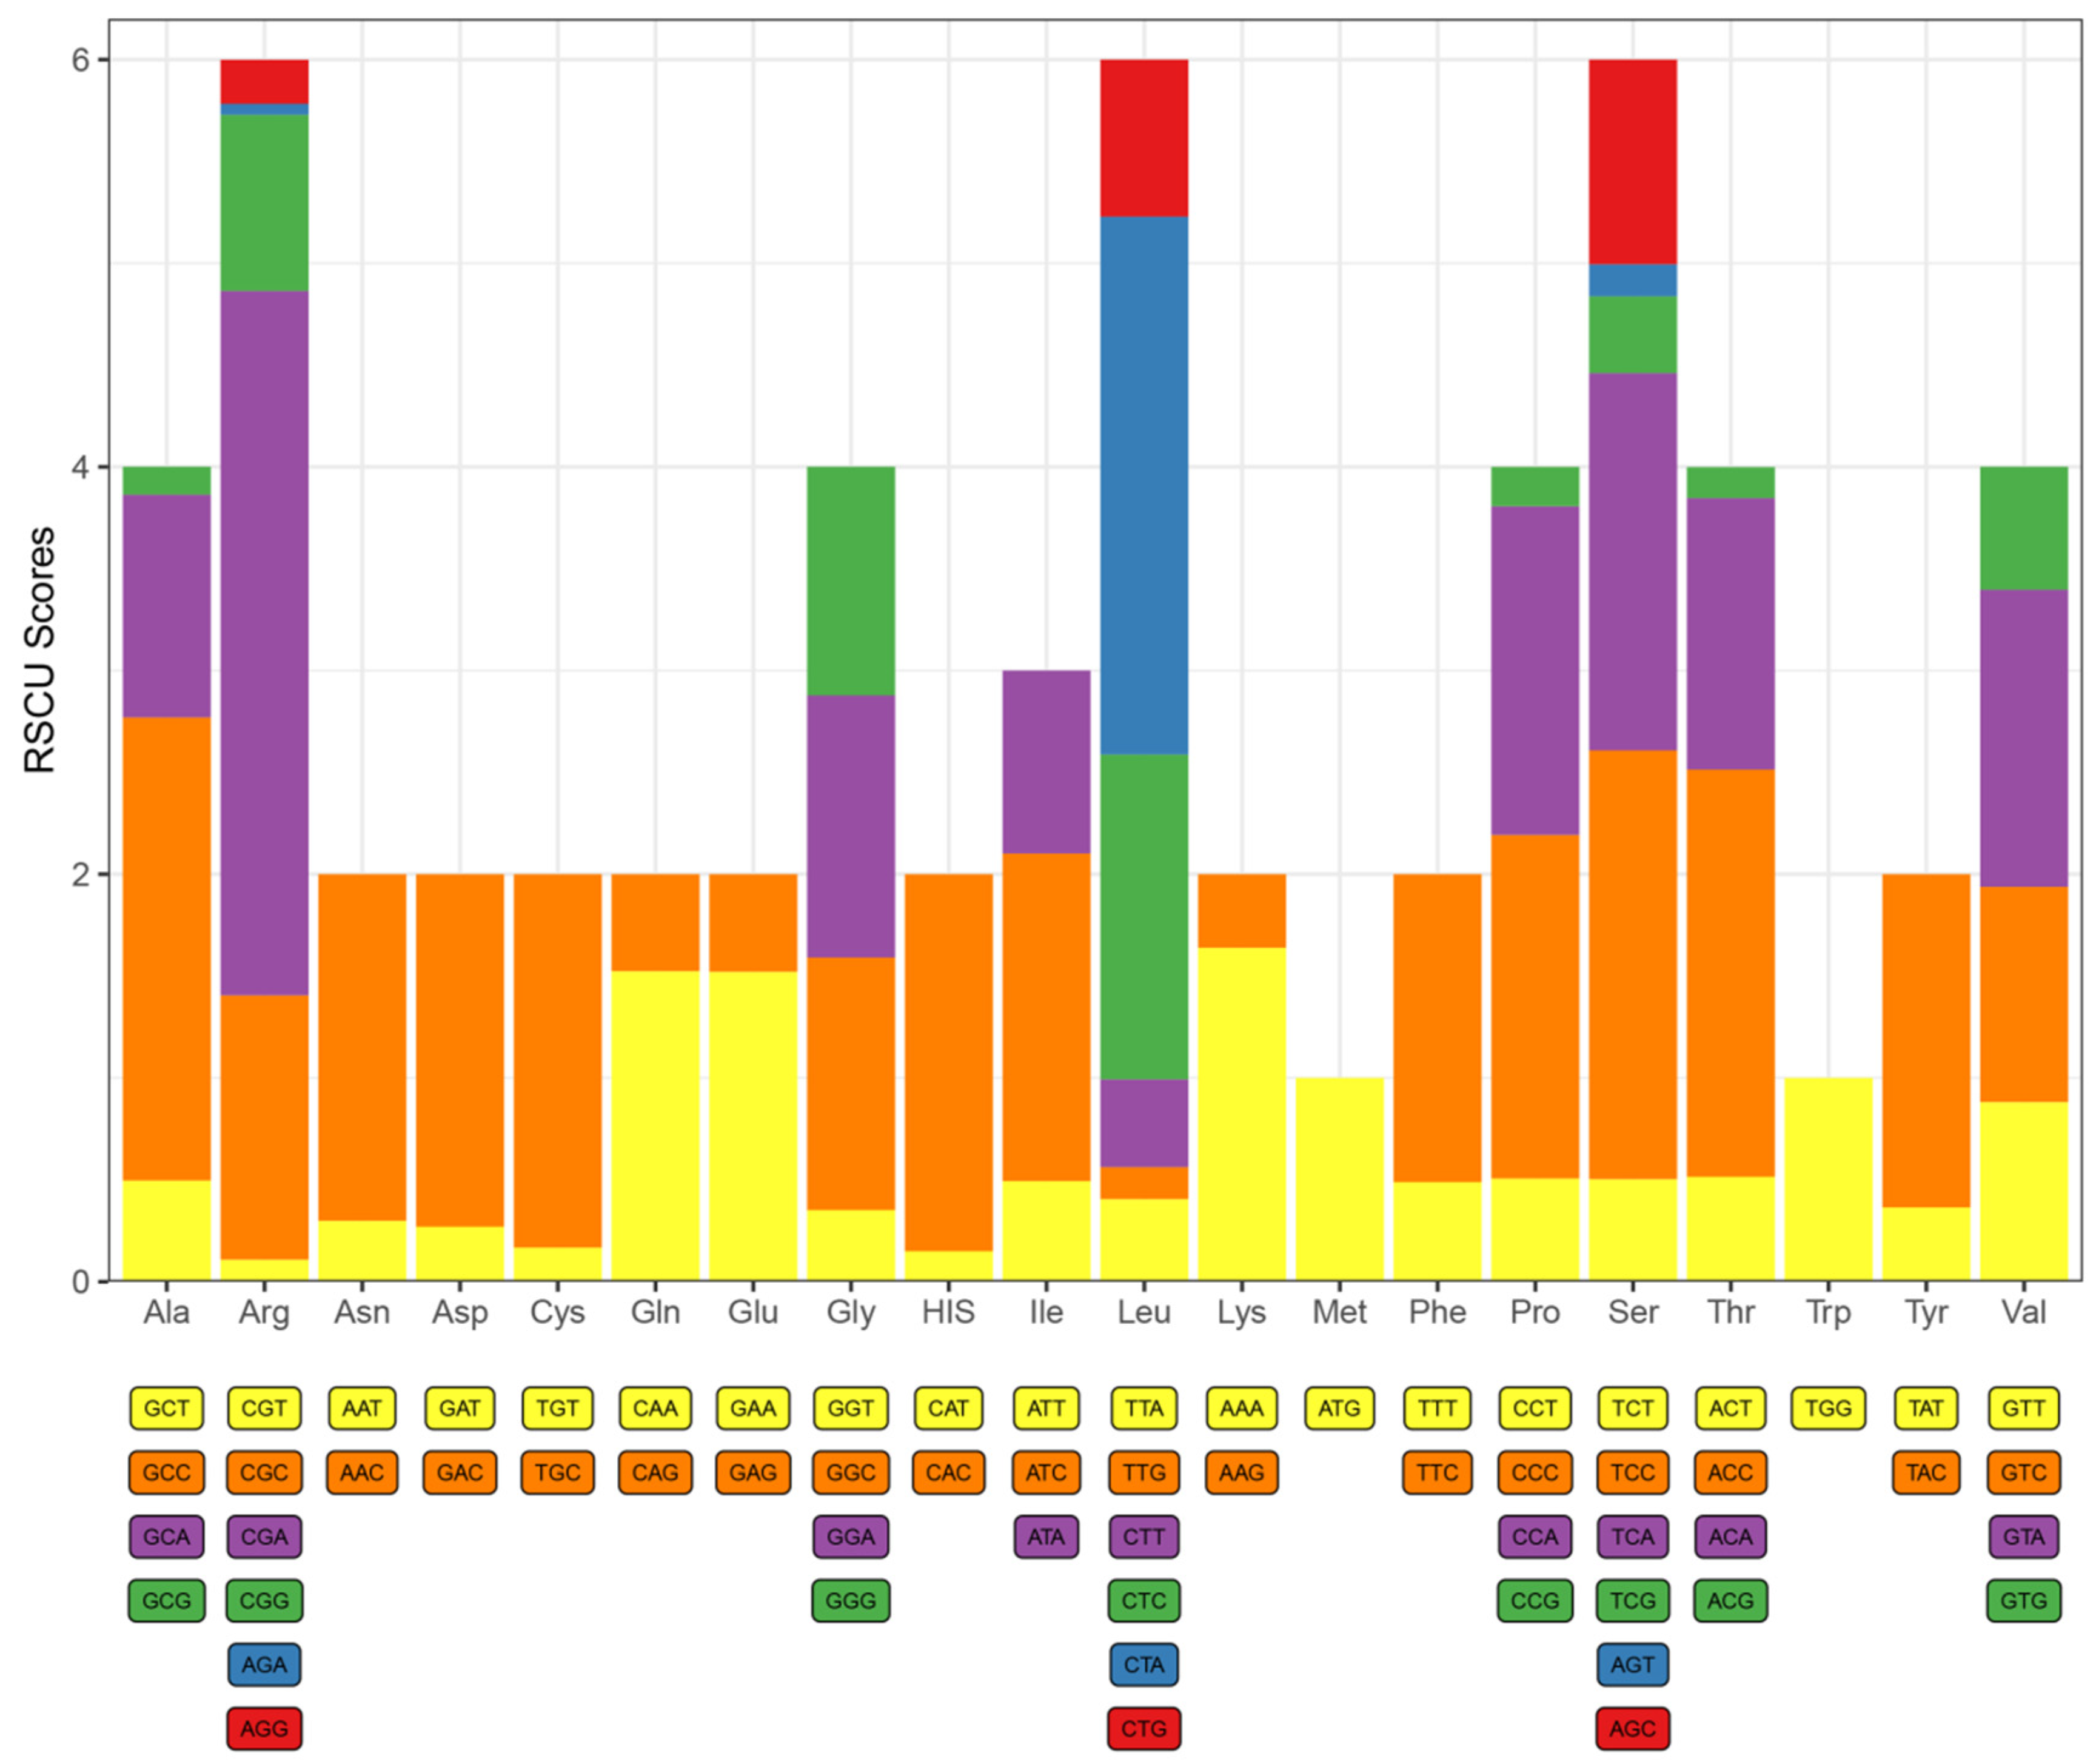
3.2. Protein-Coding Genes and Codon Usage

The mitochondrial genome of A. marila has 13 coding genes with a total length of 11,407 bp and encodes cytochrome b, 2 ATPases, 3 cytochrome c oxidase subunits, and 6 NADH dehydrogenase subunits. The lengths of the 13 PCGs range from 168 to 1824 bp; among these, 10 were initiated by the start codon ATG, whereas 3 (COX I, COX II, and ND5) were initiated by the start codon GTG. Seven protein genes (ATP6, ATP8, COII, ND3, ND4L, ND5, and Cytb) used TAA as the stop codon. For COI and ND1, the stop codon was AGG, whereas that for ND6 was TAG. ND2, ND4, and COIII ended with the incomplete stop codon T (Table 2).
The average A + T content of PCGs in the mitochondrial genome of A. marila was 50.58%, ranging from 49.34% (Cytb) to 52.03% (ND4). Except for ND6, the base compositions and skewness of the remaining 12 PCGs were relatively similar. Only the percentages of ND6 T and G were considerably higher than those of the other genes, with a positive GC-skew (Table 3). The usage of amino acids and RSCU values in the PCGs of A. marila are summarized in Figure 2 and Table 4. The most frequently used codons (amino acids) were CUA (317), AUC (208), GCC (173), UUC (167), CUC (166), and ACC (156). Except for Trp and Met, all amino acids have their preferred codons, which is a unique feature of A. marila compared to other Aythya species identified to date [36].

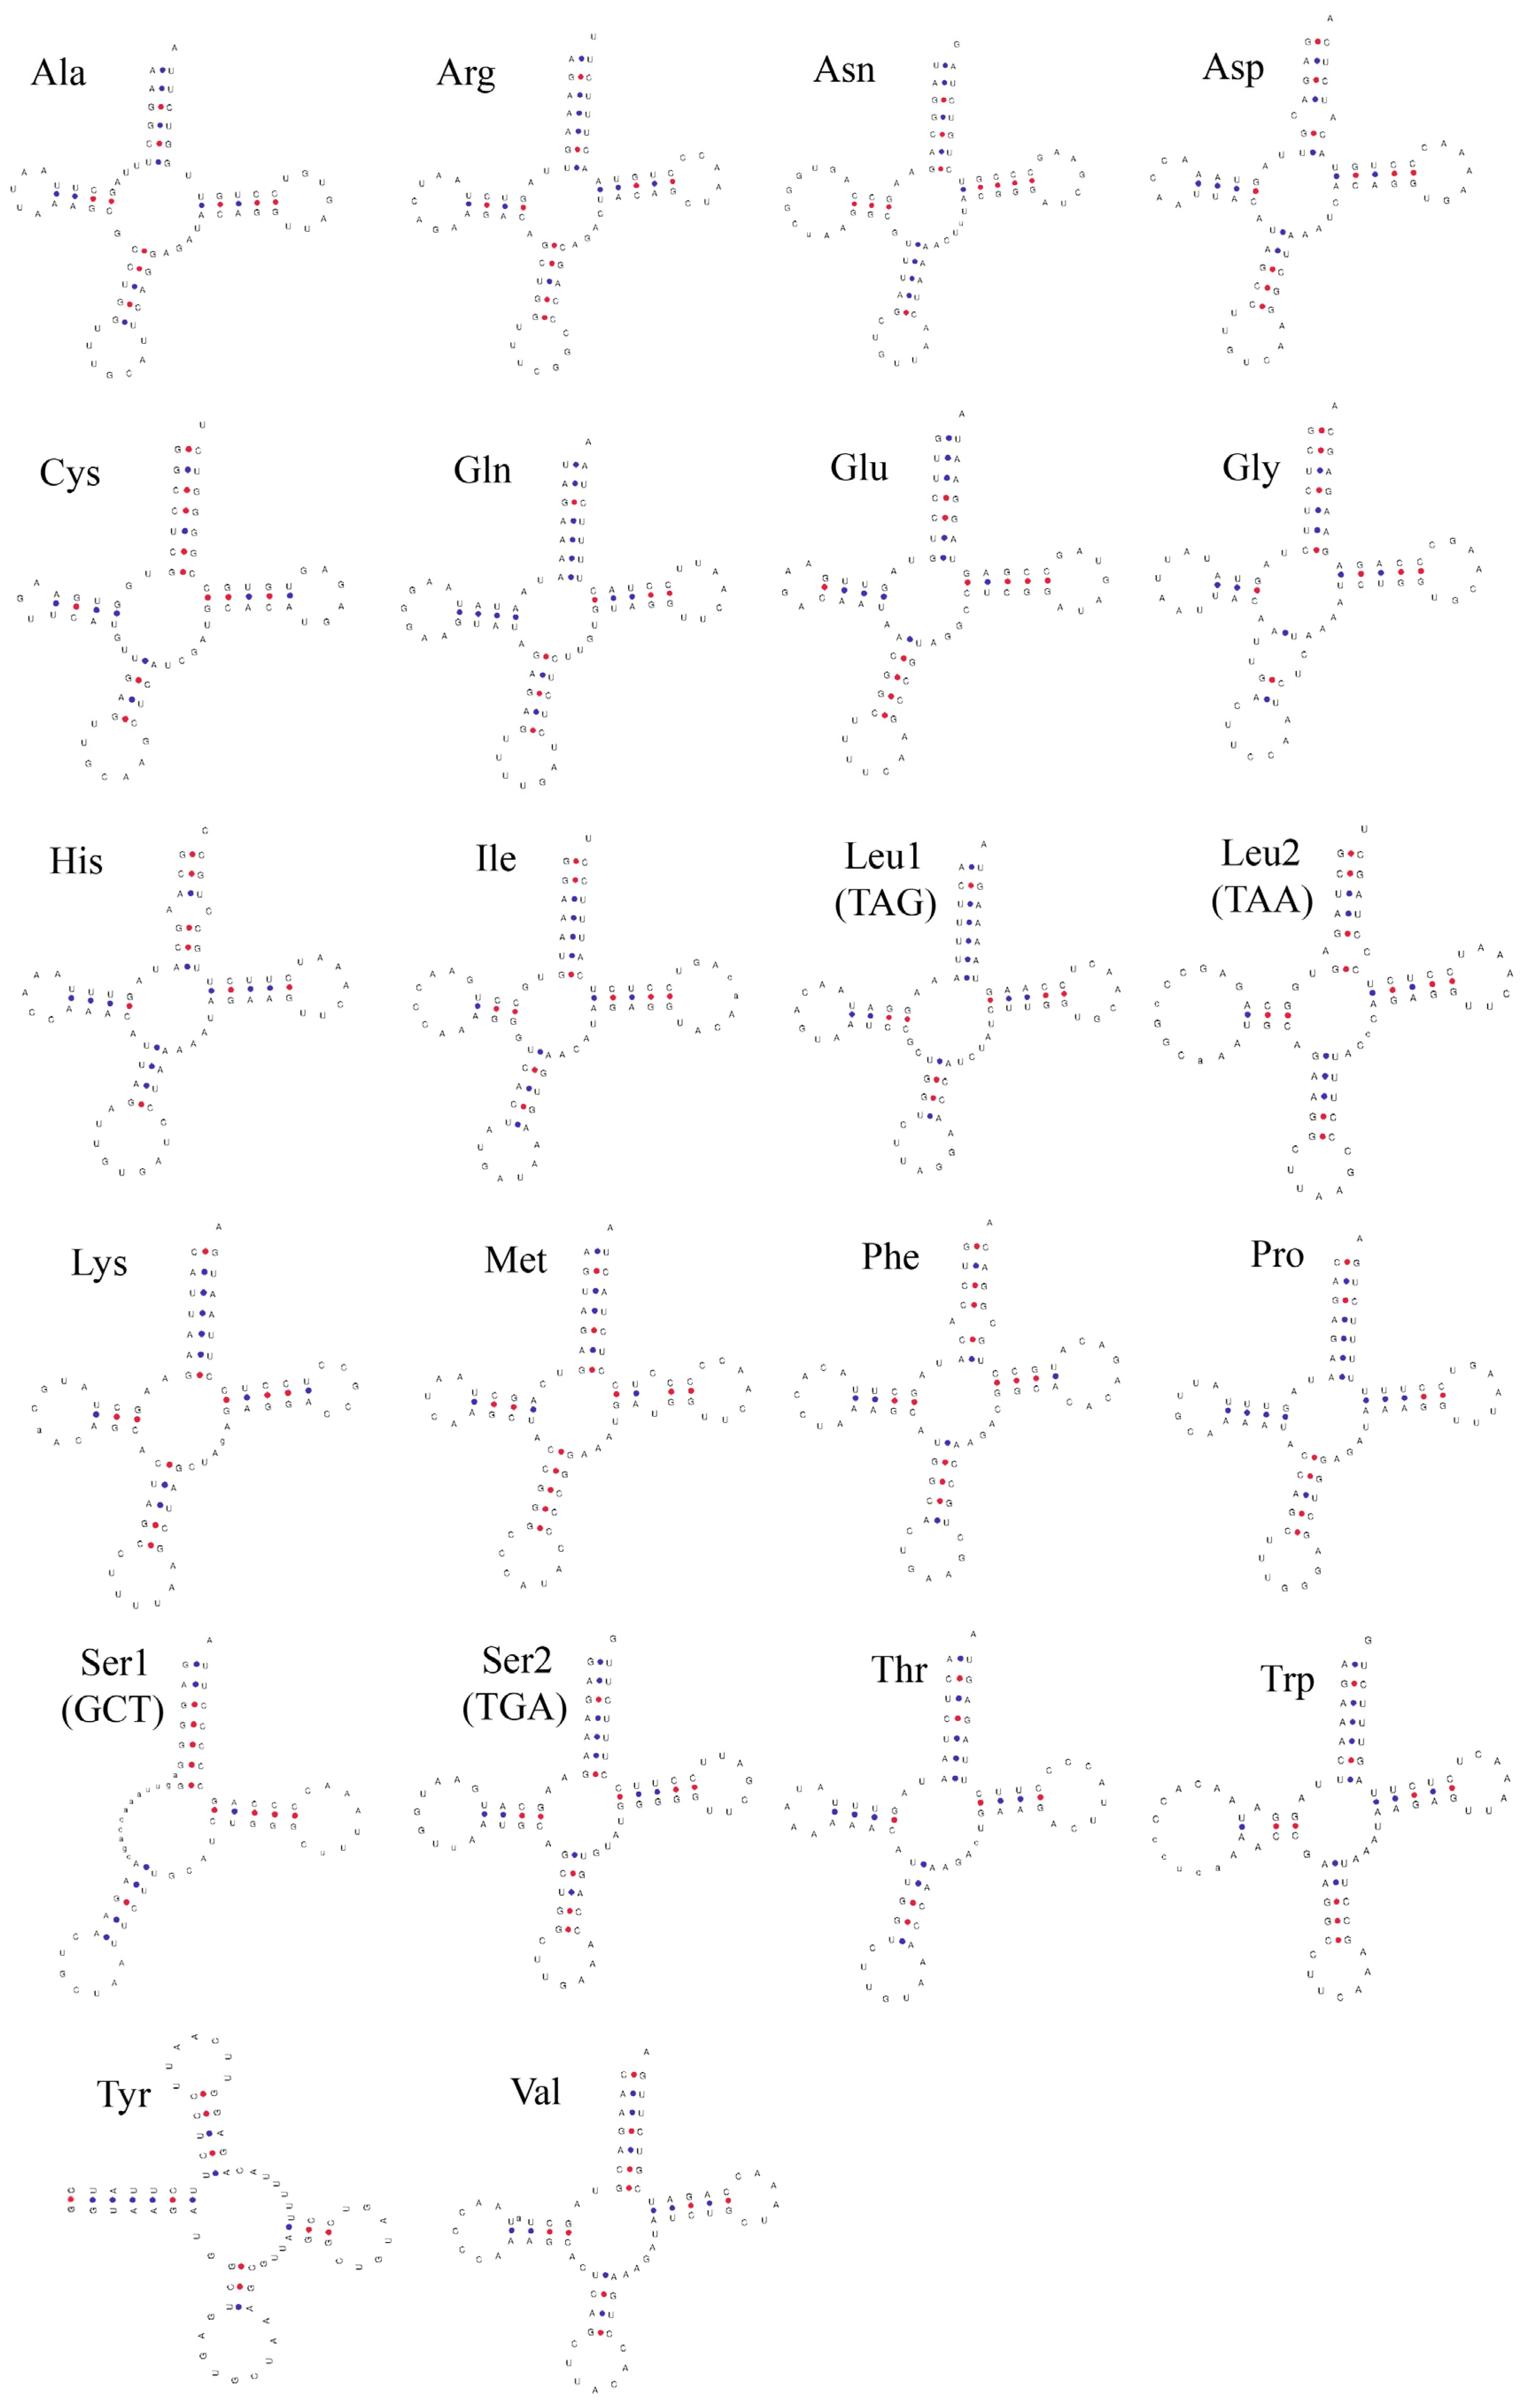
3.3. Ribosomal and Transfer RNA Genes

Similar to other Aythya species, the A. marila mitochondrial genome contained two rRNAs with a total length of 2587 bp, located on the H-strand. The 12S rRNA gene and 16S rRNA are located between tRNA-Phe and tRNA-Leu, which are typically separated by tRNA-Val. The base composition of the 12S rRNA gene was A = 32.62%, T = 19.21%, C = 28.2%, and G = 20.02%, whereas that of the 16S rRNA gene was A = 34.56%, T = 19.90%, C = 25.76%, and G = 19.78%; both rRNAs had a slight AT bias (Table 3).
The A. marila mitochondrial genome contained 22 tRNAs ranging in size from 66 bp to 76 bp, with an obvious AT bias (56.65%). Of these, 14 were located on the H-strand, and 8 were located on the L-strand (Table 2). The secondary structure of tRNA is shown in Figure 3. In many vertebrate mitochondrial genomes, the tRNA-Ser (GCT) gene has an unusual secondary structure owing to the lack of a dihydrouridine arm. However, some previous studies have shown that this structure does not affect tRNA function [40,41,42,43]; other than tRNA-Ser (GCT), tRNA genes form the classical cloverleaf secondary structure, and the anticodon arms contain a relatively conserved region [40].

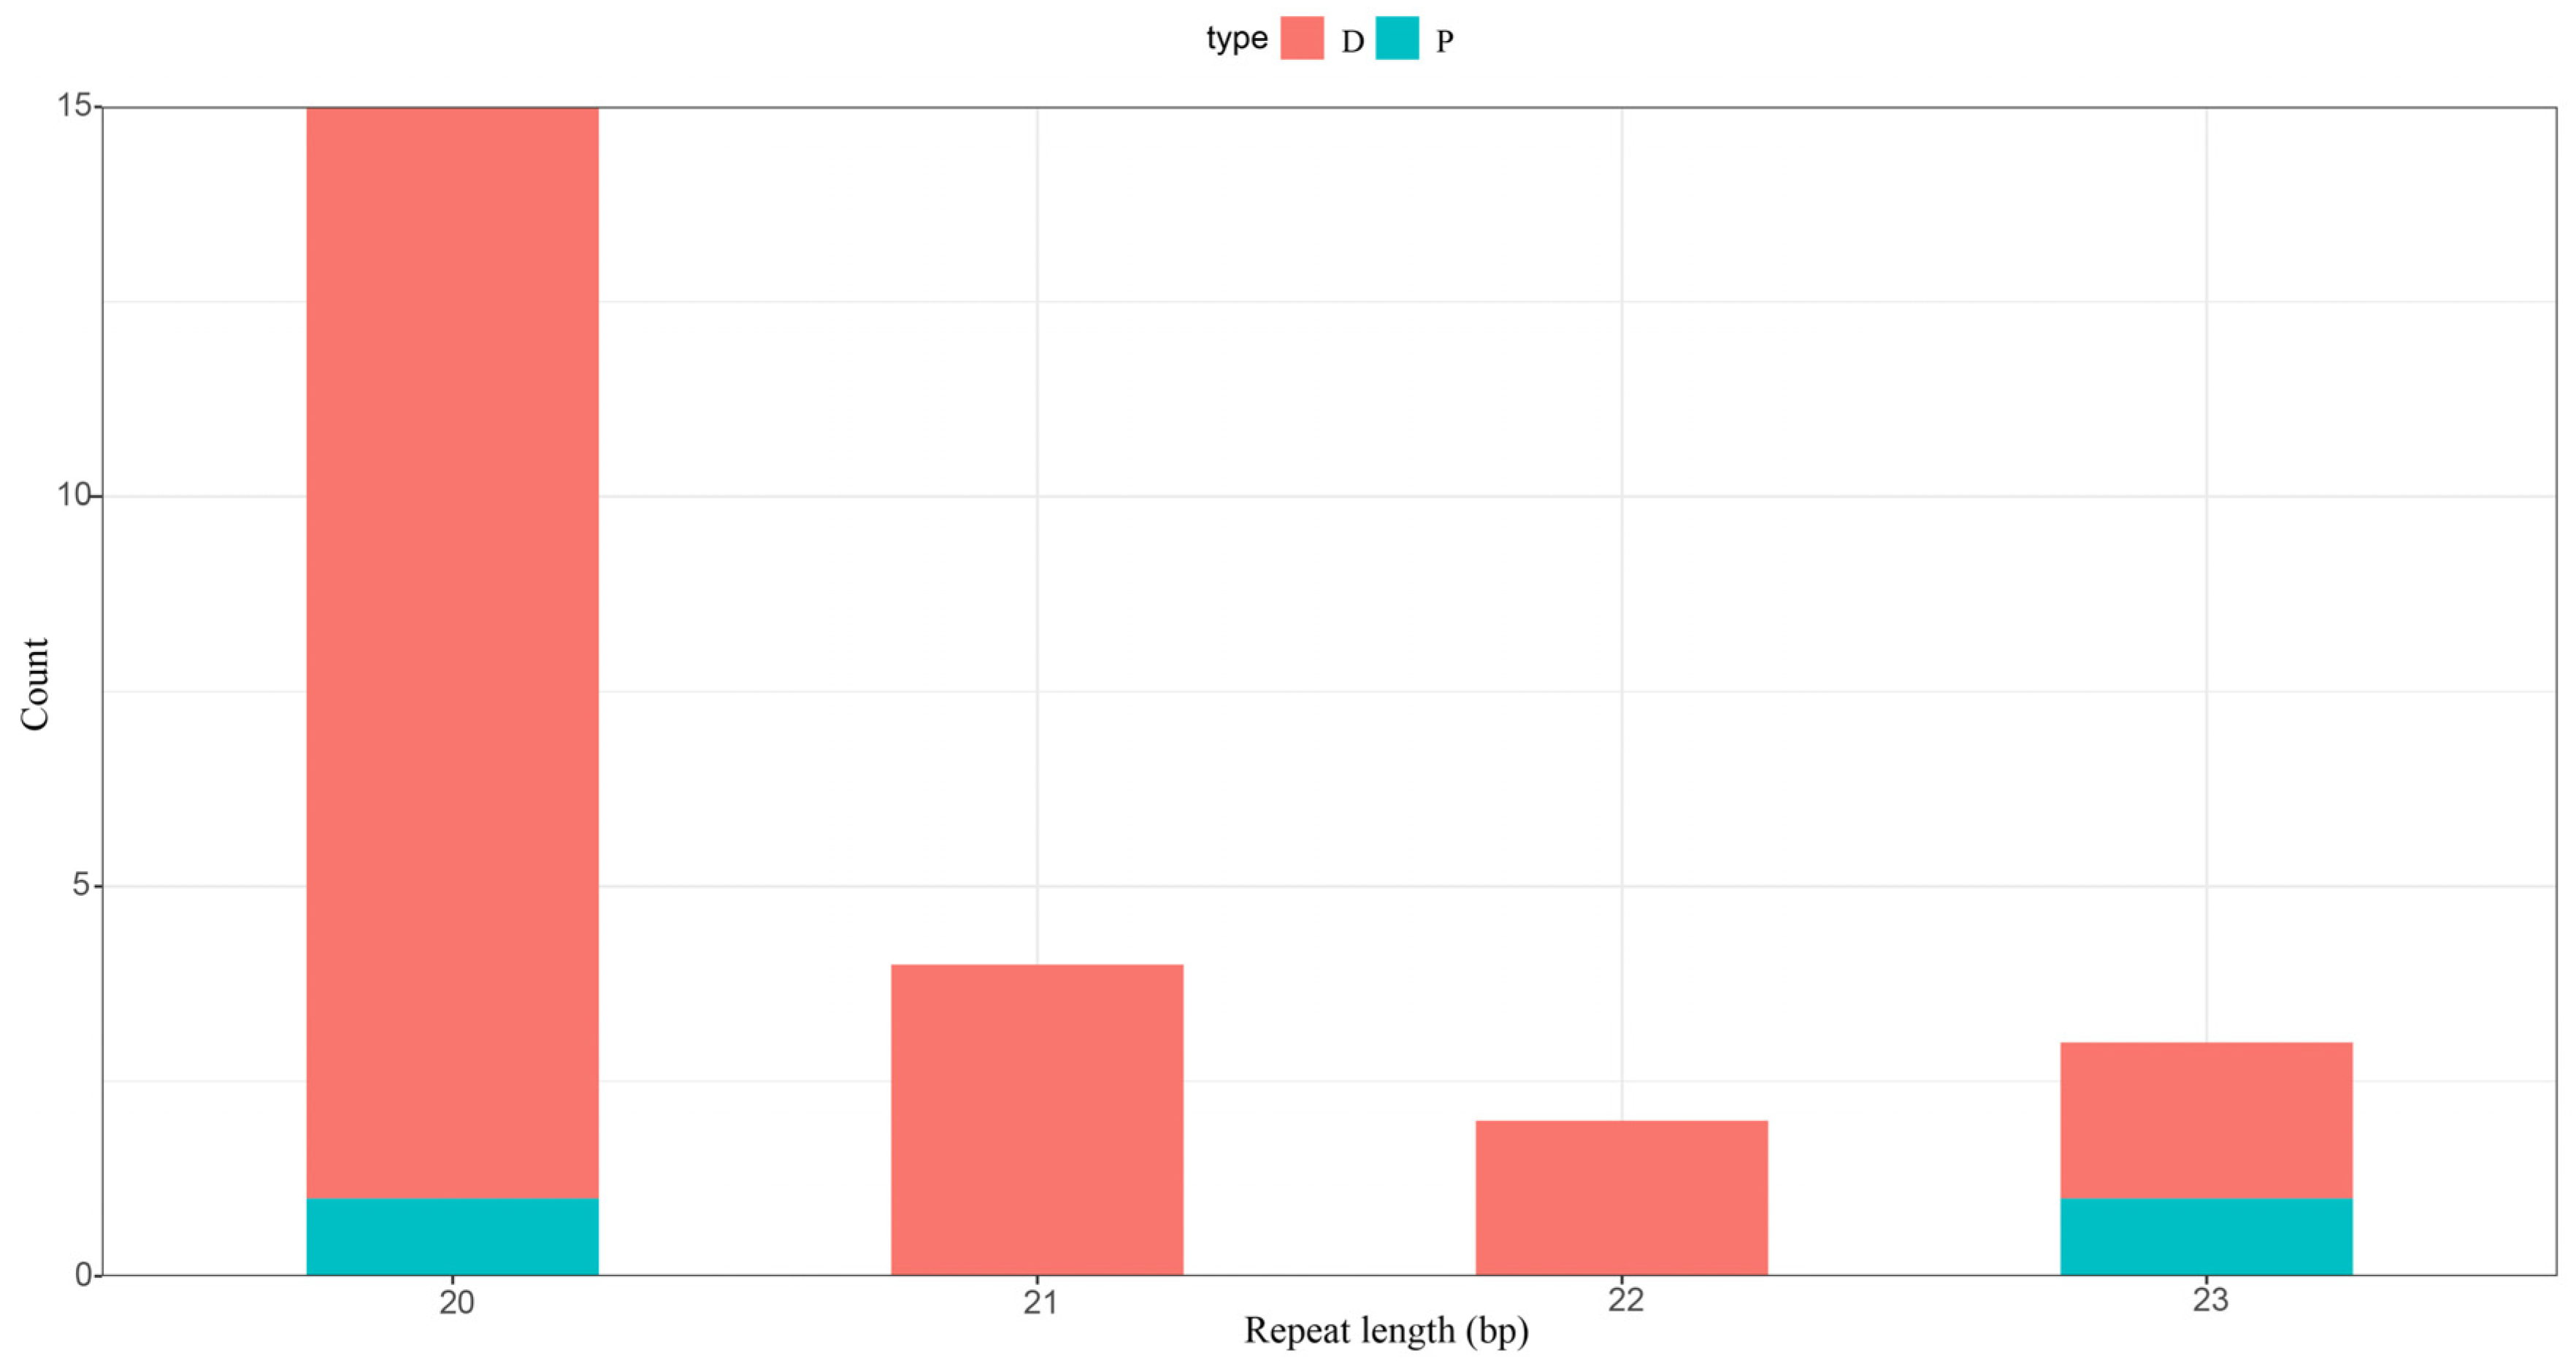
3.4. Control Region and Repetitive Sequences

A control region was identified in the mitochondrial genome of A. marila. This region is located between tRNA-Glu and tRNA-Phe and has a length of 1066 bp. The AT content (51.97%) and GC content (48.03%) of this region were similar to those of the whole mitochondrial genome (Table 3). We also found that the control region AT-skew (0.051) was positive, whereas the GC-skew (−0.340) was negative, which indicated that the A content was higher than the T content and that the G content was lower than the C content. A total of 24 repeat sequences were detected in the A. marila mitochondrial genome, which contained 22 forward repeats and 2 palindromic repeats (Figure 4). The repeat sequences ranged from 20 to 23 bp with a total size of 497 bp, constituting 2.99% of the mitochondrial genome.

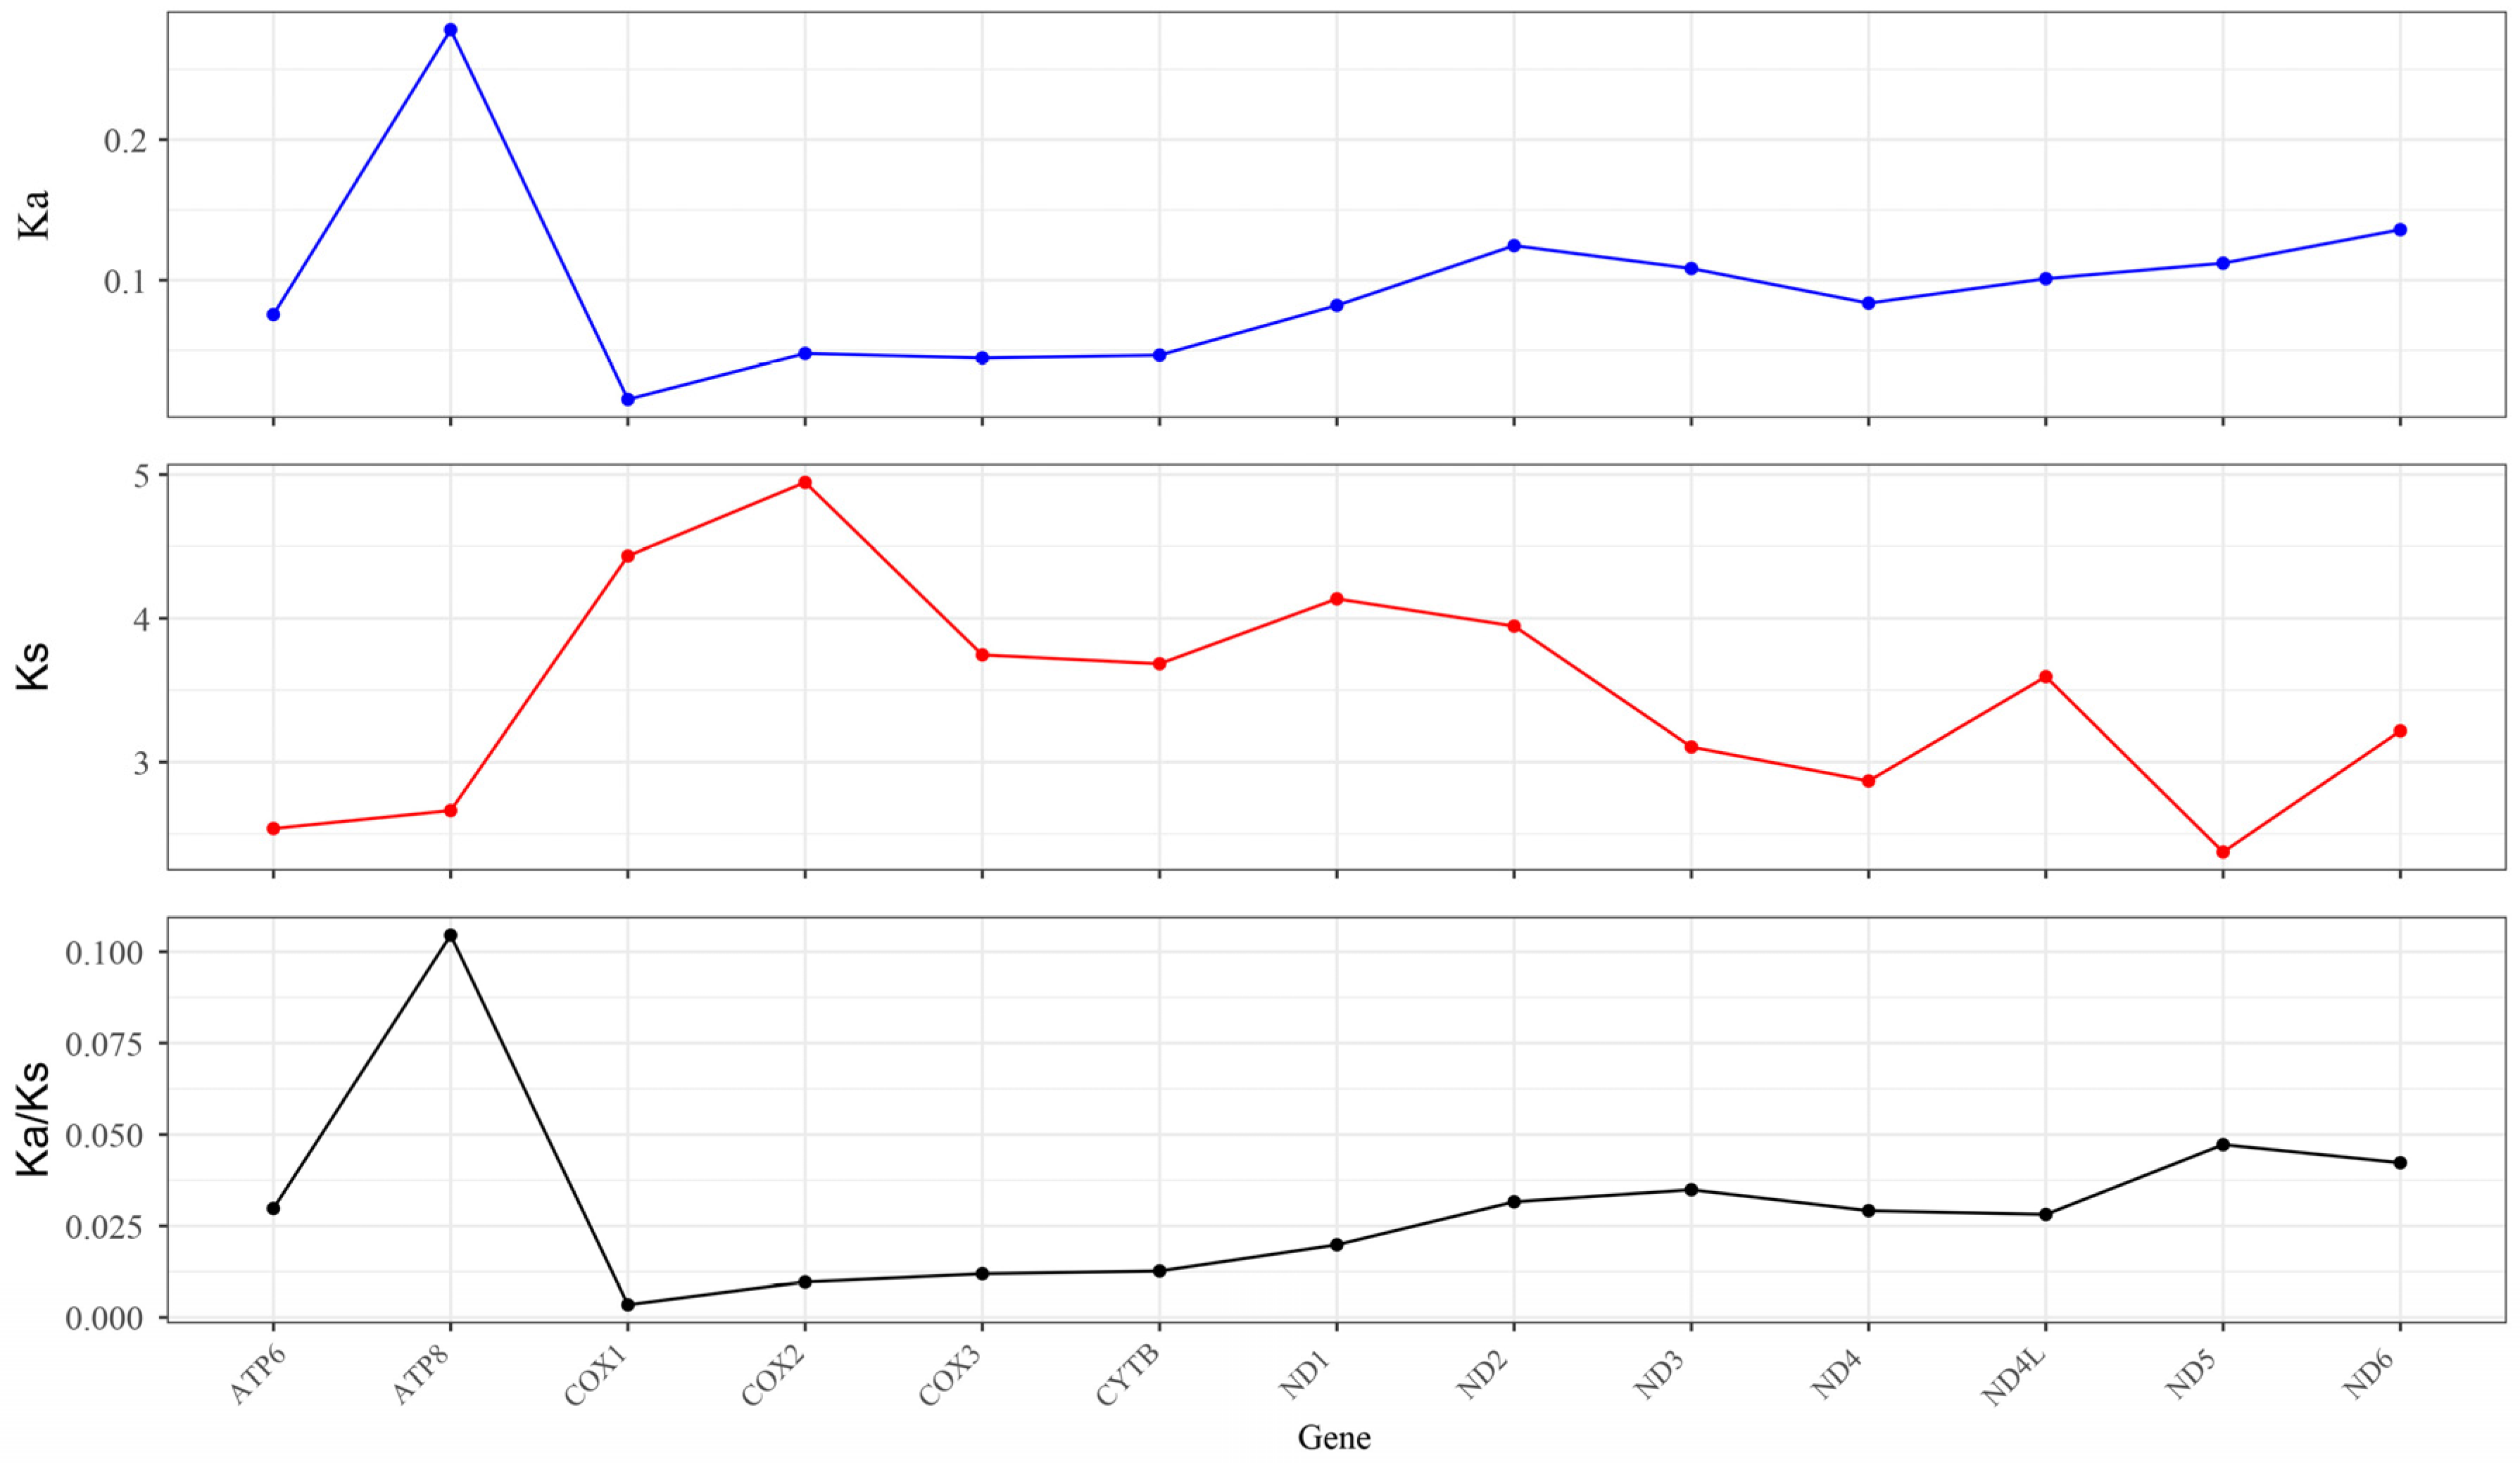
3.5. Synonymous (Ka) and Nonsynonymous (Ks) Substitution Rate

The Ka/Ks ratio can be used to determine whether the PCGs were under selection pressure [44,45]. To detect the pressure on A. marila mitochondrial PCGs, we calculated the Ka/Ks ratio of the 13 PCGs. As shown in Figure 5, the Ka/Ks ratio did not exceed 0.105 for any genes, indicating that these genes underwent intense purification selection. Moreover, the stabilization of the normal function of mitochondria may be due to the important role of these genes in purification selection [46]. ATP8 had the highest Ka/Ks value (Ka/Ks = 0.105), indicating that ATP8 experienced the least selective pressure and evolved the fastest. However, the Ka/Ks value of COI was the lowest (Ka/Ks = 0.003), indicating that COI had the highest selective pressure and had evolved the slowest.

3.6. Population Genetic Diversity and Differentiation

The complete mitochondrial genome sequence was used to estimate the genetic diversity and differentiation of the Aythya population. A total of 28 haplotypes were identified from 28 individuals, of which 4 were from A. nyroca, with the other 4 Aythya species each having 6 haplotypes. The haplotype diversity of the 5 populations was 1, whereas the nucleotide diversity (π) ranged from 0.00080 to 0.01109 per population (Table 5). These results show that our target species had the highest genetic diversity, whereas the critically endangered A. baeri had the lowest genetic diversity. The low genetic diversity of A. baeri is consistent with its population size, suggesting that it may be at risk of extinction. In addition, there was obvious differentiation between the five populations; however, no significant genetic differentiation was found between A. baeri and A. nyroca (FST = −0.09740), suggesting that genetic exchange between the two populations is common (Table 6).

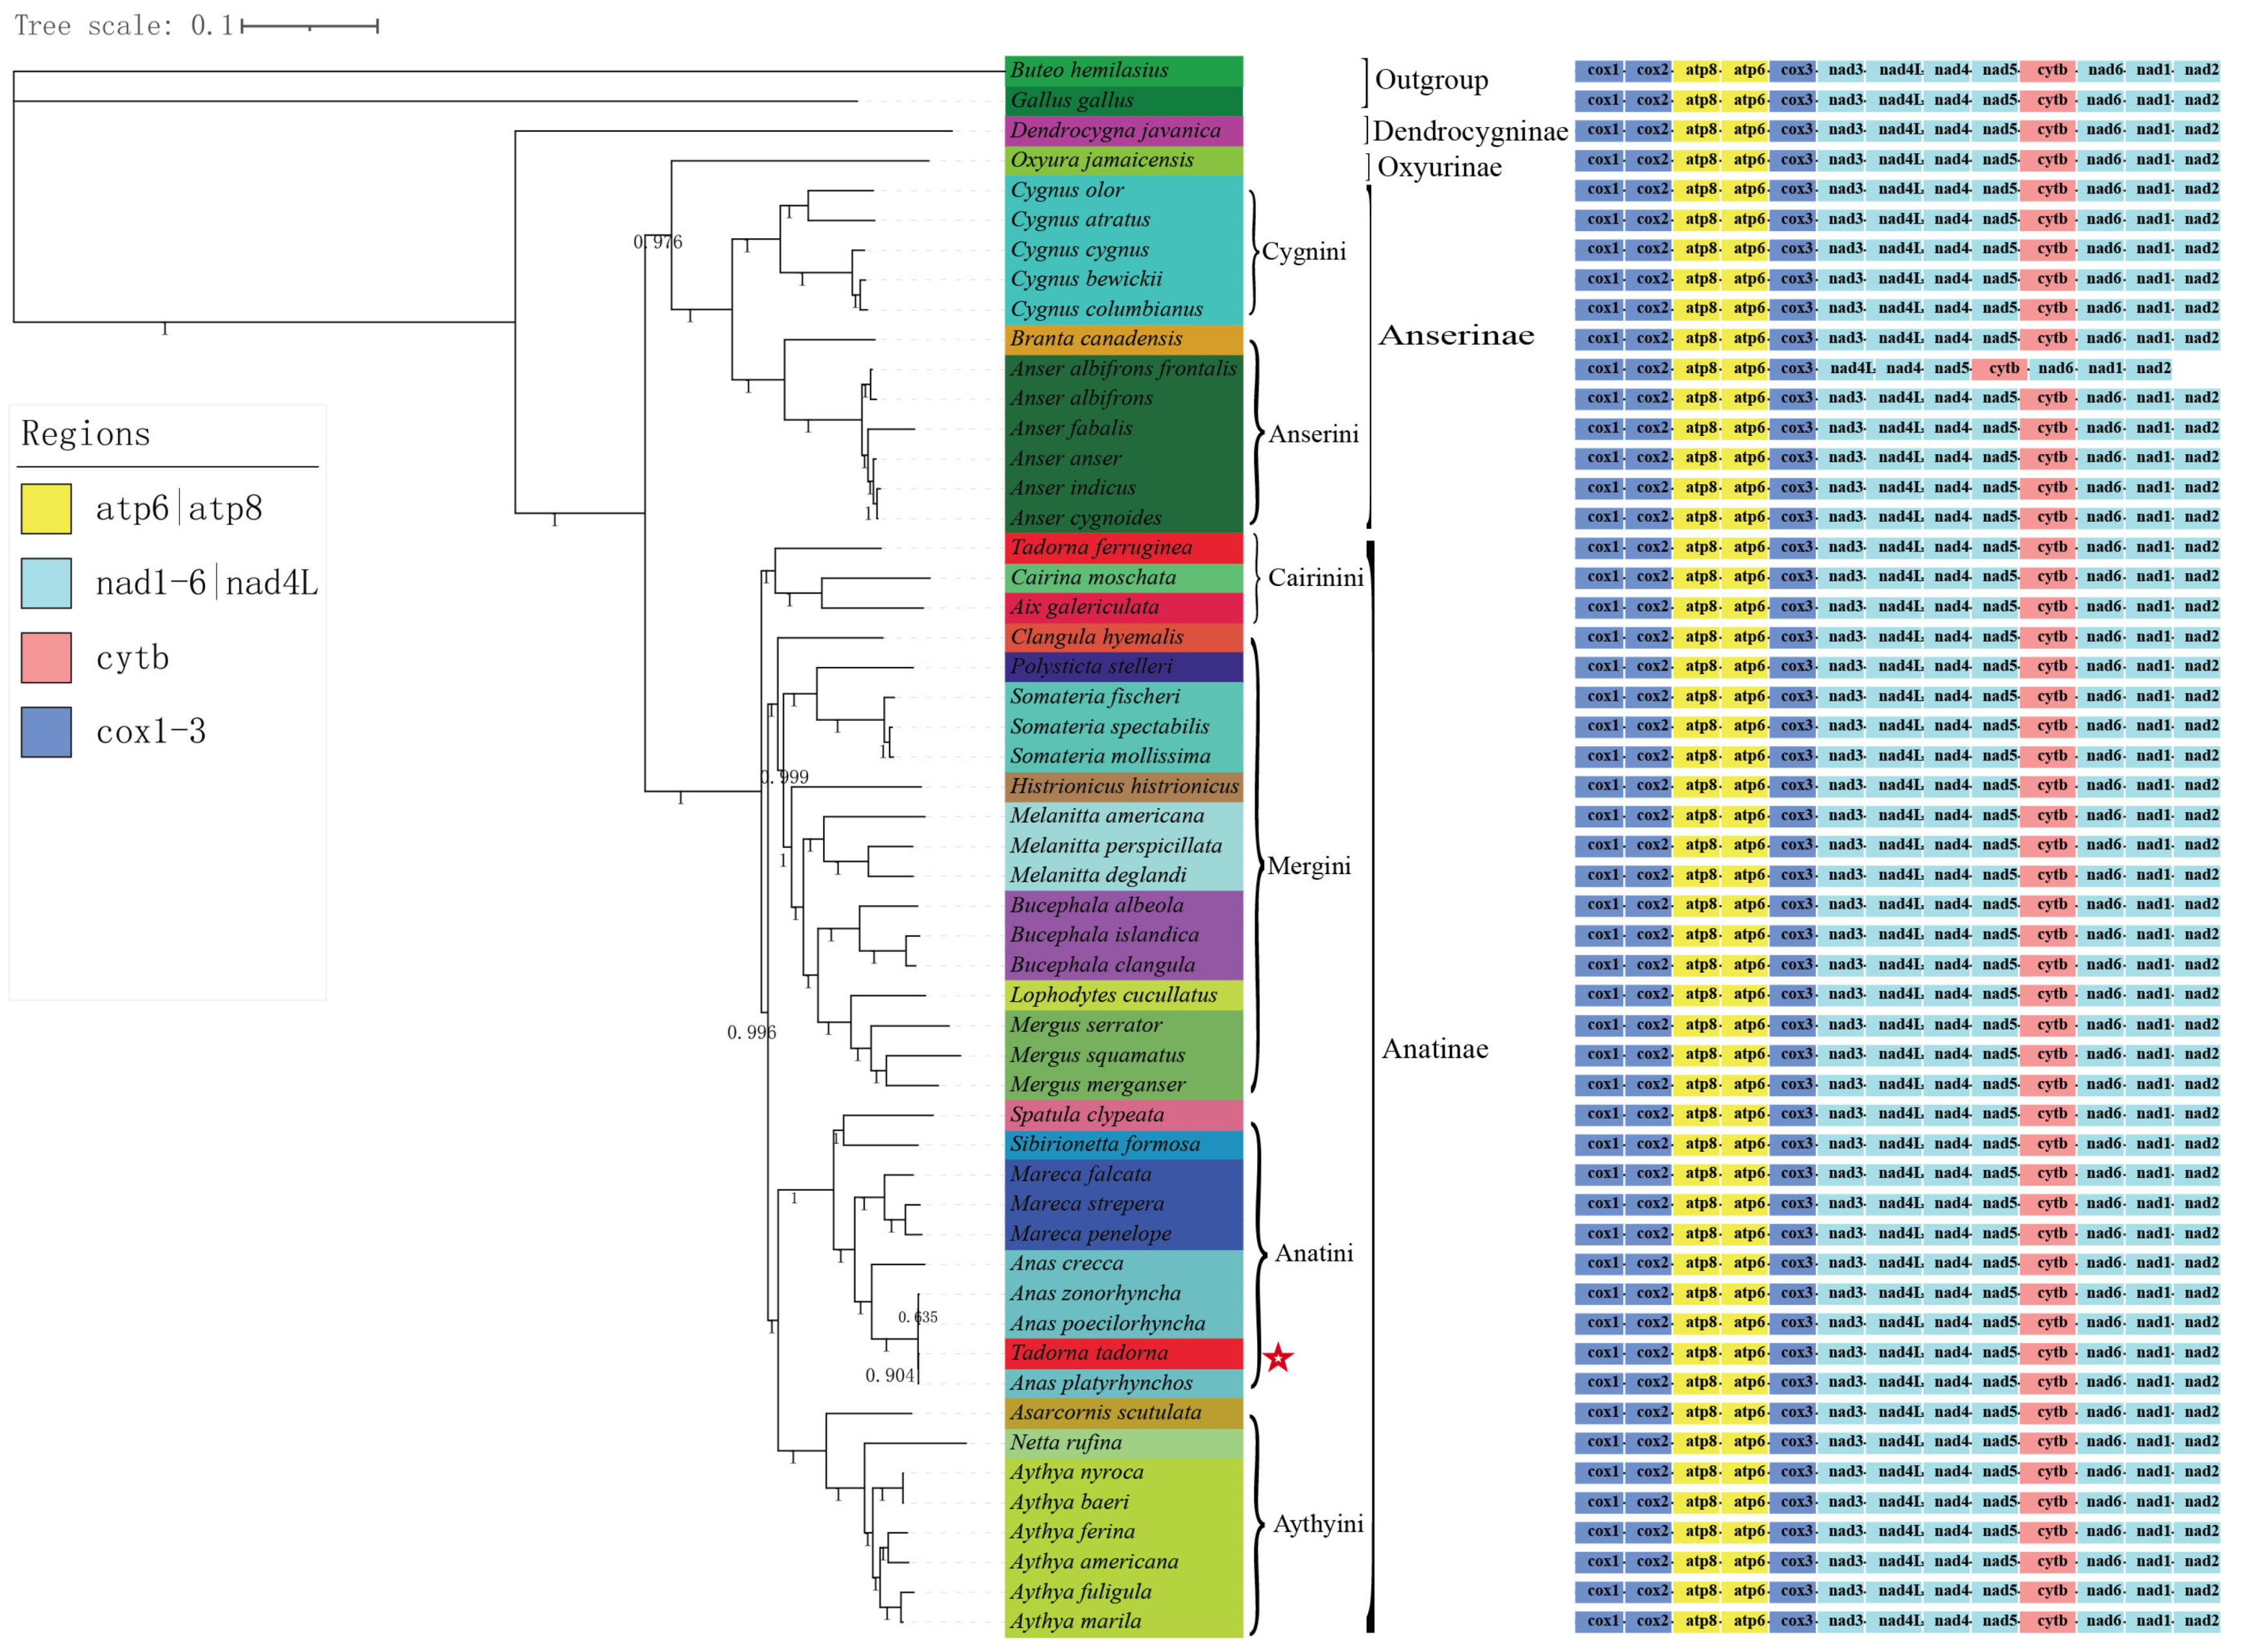
3.7. Phylogenetic Analysis

We performed a comprehensive phylogenetic analysis on the mitochondrial genomes of all Anatidae species available in GenBank, employing both Bayesian inference (BI) and maximum likelihood (ML) methodologies. Both approaches yielded high bootstrap support values and Bayesian posterior probabilities. Our findings revealed that the BI and ML phylogenetic trees shared identical topologies; however, the tree generated using BI exhibited superior support values. Consequently, we exclusively present the BI tree in this study (Figure 6). In the phylogenetic tree, there were four major clades among the Anatidae: Dendrocygninae, Oxyurinae, Anserinae, and Anatinae. The first branch, Dendrocygninae, contained only Dendrocygna javanica. D. javanica constitutes an early diverging lineage, representing one of the most distinctive genera within the Anatidae family. Their unique characteristics, such as an erect posture, elongated necks and legs, and tree-perching habits, distinguish them from the majority of other waterfowl species [47,48].
The second is Oxyurinae, which consists of only Oxyura jamaicensis. The phylogenetic relationship of Oxyurinae is also controversial [49]. According to early morphological studies, Oxyurinae shares a common ancestor with geese and swans [49,50], leading us to consider Oxyurinae as the group most closely related to Anserinae whilst not being within Anatinae. In previous studies, Oxyurinae was shown to have diverged earlier than Dendrocygninae in Anatidae [51], and our results also support Oxyurinae as an independent subfamily. The third is Anserinae, which includes Cygnini and Anserini. Anserini contains the genera Anser and Branta, which are closely related species and sisters to the Cygnini assemblage, which is consistent with morphological data [52]. Meigini, Anatini, Aythyini, and Cairinini form the fourth branch of the Anatinae. Within Anatinae, Aythyini is monophyletic, Aythyini and Anatini have the closest phylogenetic relationships, and Aythyini diverged earlier than Anatini based on morphological studies and phylogenetic analysis [49,53]. Within the genera, Aythya, A. marila, and A. fuligula form a branch, whereas A. americana and A. ferina, and A. baeri and A. nyroca were clustered into one branch, with all branches being supported by good statistical values. In general, our findings support those of the previous molecular phylogenetic studies.
In an effort to further elucidate the population structure among the five Aythya species (A. ferina, A. nyroca, A. baeri, A. fuligula, and A. marila), we conducted a comprehensive phylogenetic analysis based on complete mitochondrial genomes (Figure 7). Our findings revealed that the Aythya genus can be classified into three distinct clades: one comprising A. baeri and A. nyroca, which exhibit a relatively close phylogenetic relationship; another encompassing A. marila and A. fuligula, which are also closely related; a third, separate clade consisting solely of A. ferina. In addition, our results demonstrated that A. baeri and A. nyroca display evident mixed clustering patterns, while A. marila and A. fuligula exhibit an interwoven arrangement, suggesting the potential for frequent hybridization events within the Aythya genus. However, it is important to note that the maternal inheritance characteristics of the mitochondrial genome, coupled with the pervasive hybridization behavior observed in the Aythya genus, may introduce inaccuracies when attempting to depict the population structure of these species.

4. Conclusions

In the present study, the complete mitochondrial genome of A. marila was sequenced, annotated, and reported for the first time. The mitochondrial genome sequence of A. marila was 16,617 bp in length and consisted of 13 PCGs, 2 rRNA genes, 22 tRNA genes, and a D-loop. Among the PCGs, ATP8 evolved the fastest, whereas COI evolved the slowest. Phylogenomic analysis based on 13 protein-coding genes among 52 Anatidae species showed that A. marila was closely related to A. fuligula. We also assembled 28 complete mitochondrial genomes of 5 Aythya species and found no significant genetic differentiation between A. baeri and A. nyroca. Moreover, A. baeri had the lowest genetic diversity, which not only complemented the available Aythya species resources but also further supported their taxonomic status. Our results also provide a beneficial reference for the taxonomy, population genetics, and systematic studies of Aythya species.

Author Contributions

Conceptualization, L.Z. and H.Z.; Data curation, G.S.; Methodology, X.Y. and G.L.; Project administration, H.Z.; Resources, X.G.; Software, C.Z.; Supervision, H.Z.; Writing—original draft, L.Z and T.X.; Writing—review and editing, L.Z. and T.X. All authors have read and agreed to the published version of the manuscript.

Funding

This study was supported by the National Natural Science Foundation of China (grant numbers 32200407, 32070405, 32270444, 32200349, and 32000291).

Institutional Review Board Statement

The animal study protocol was approved by the Biomedical Ethics Committee of the Qufu Normal University (2021097; 14 March 2023) and all experiments followed the recommendations in the ARRIVE guidelines.

Informed Consent Statement

Not applicable.

Data Availability Statement

The complete mitochondrial genome sequence of A. marila has been submitted to GenBank with the accession number OP326610. The 28 complete mitochondrial genomes of five species: six A. ferina, four A. nyroca, six A. baeri, six A. fuligula, and six A. marila were deposited in SRA under the following accession numbers: SRR24490231, SRR24488788, SRR24489043, SRR24490229 and SRR24489013.

Conflicts of Interest

The authors declare no conflict of interest.

References

  1. Banks, R.C. Subspecies of the Greater Scaup and their names. Wilson Bull. 1986, 98, 433–444. [Google Scholar]
  2. Conover, H.B. Game birds of the Hooper Bay region, Alaska. Auk 1926, 43, 162–180. [Google Scholar] [CrossRef]
  3. Kessel, B.; Rocque, D.A.; Barclay, J.S. Greater Scaup (Aythya marila), version 1.0. In Birds of the World; Billerman, S.M., Ed.; Cornell Lab of Ornithology: Ithaca, NY, USA, 2020. [Google Scholar]
  4. Patton, J.; Avise, J. Evolutionary genetics of birds IV Rates of protein divergence in waterfowl (Anatidae). Genetica 1986, 68, 129–143. [Google Scholar] [CrossRef]
  5. Sun, Z.; Pan, T.; Hu, C.; Sun, L.; Ding, H.; Wang, H.; Zhang, C.; Jin, H.; Chang, Q.; Kan, X.; et al. Rapid and recent diversification patterns in Anseriformes birds: Inferred from molecular phylogeny and diversification analyses. PLoS ONE 2017, 12, e0184529. [Google Scholar] [CrossRef]
  6. Ottenburghs, J.; van Hooft, P.; van Wieren, S.E.; Ydenberg, R.C.; Prins, H.H. Hybridization in geese: A review. Front. Zool. 2016, 13, 20. [Google Scholar] [CrossRef]
  7. McCarthy, E.M. Handbook of Avian Hybrids of the World; Oxford University Press: New York, NY, USA, 2006. [Google Scholar]
  8. Van der Bliek, A.M.; Sedensky, M.M.; Morgan, P.G. Cell biology of the mitochondrion. Genetics 2017, 207, 843–871. [Google Scholar] [CrossRef]
  9. Ruokonen, M.; Kvist, L. Structure and evolution of the avian mitochondrial control region. Mol. Phylogenet. Evol. 2002, 23, 422–432. [Google Scholar] [CrossRef]
  10. Taanman, J.-W. The mitochondrial genome: Structure, transcription, translation and replication. Biochim. Biophys. Acta (BBA)-Bioenerg. 1999, 1410, 103–123. [Google Scholar] [CrossRef]
  11. Boore, J.L. Animal mitochondrial genomes. Nucleic Acids Res. 1999, 27, 1767–1780. [Google Scholar] [CrossRef]
  12. Gissi, C.; Iannelli, F.; Pesole, G. Evolution of the mitochondrial genome of Metazoa as exemplified by comparison of congeneric species. Heredity 2008, 101, 301–320. [Google Scholar] [CrossRef]
  13. Subramanian, S.; Denver, D.R.; Millar, C.D.; Heupink, T.; Aschrafi, A.; Emslie, S.D.; Baroni, C.; Lambert, D.M. High mitogenomic evolutionary rates and time dependency. Trends Genet. 2009, 25, 482–486. [Google Scholar] [CrossRef]
  14. Sato, M.; Sato, K. Maternal inheritance of mitochondrial DNA by diverse mechanisms to eliminate paternal mitochondrial DNA. Biochim. Biophys. Acta (BBA)-Mol. Cell Res. 2013, 1833, 1979–1984. [Google Scholar] [CrossRef]
  15. Li, Q.; Wei, S.-J.; Tang, P.; Wu, Q.; Shi, M.; Sharkey, M.J.; Chen, X.-X. Multiple lines of evidence from mitochondrial genomes resolve phylogenetic relationships of parasitic wasps in Braconidae. Genome Biol. Evol. 2016, 8, 2651–2662. [Google Scholar] [CrossRef]
  16. Pan, T.; Sun, Z.; Lai, X.; Orozcoterwengel, P.; Yan, P.; Wu, G.; Wang, H.; Zhu, W.; Wu, X.; Zhang, B. Hidden species diversity in Pachyhynobius: A multiple approaches species delimitation with mitogenomes. Mol. Phylogenetics Evol. 2019, 137, 138–145. [Google Scholar] [CrossRef] [PubMed]
  17. Hu, Y.; Thapa, A.; Fan, H.; Ma, T.; Wu, Q.; Ma, S.; Zhang, D.; Wang, B.; Li, M.; Yan, L. Genomic evidence for two phylogenetic species and long-term population bottlenecks in red pandas. Sci. Adv. 2020, 6, eaax5751. [Google Scholar] [CrossRef]
  18. Chen, S.; Zhou, Y.; Chen, Y.; Gu, J. Fastp: An ultra-fast all-in-one FASTQ preprocessor. Bioinformatics 2018, 34, i884–i890. [Google Scholar] [CrossRef] [PubMed]
  19. Bankevich, A.; Nurk, S.; Antipov, D.; Gurevich, A.A.; Dvorkin, M.; Kulikov, A.S.; Lesin, V.M.; Nikolenko, S.I.; Pham, S.; Prjibelski, A.D. SPAdes: A new genome assembly algorithm and its applications to single-cell sequencing. J. Comput. Biol. 2012, 19, 455–477. [Google Scholar] [CrossRef] [PubMed]
  20. Boetzer, M.; Pirovano, W. Toward almost closed genomes with GapFiller. Genome Biol. 2012, 13, R56. [Google Scholar] [CrossRef]
  21. Bernt, M.; Donath, A.; Jühling, F.; Externbrink, F.; Florentz, C.; Fritzsch, G.; Pütz, J.; Middendorf, M.; Stadler, P.F. MITOS: Improved de novo metazoan mitochondrial genome annotation. Mol. Phylogenet. Evol. 2013, 69, 313–319. [Google Scholar] [CrossRef]
  22. Lowe, T.M.; Chan, P.P. tRNAscan-SE On-line: Integrating search and context for analysis of transfer RNA genes. Nucleic Acids Res. 2016, 44, W54–W57. [Google Scholar] [CrossRef] [PubMed]
  23. Grant, J.R.; Stothard, P. The CGView Server: A comparative genomics tool for circular genomes. Nucleic Acids Res. 2008, 36 (Suppl. S2), W181–W184. [Google Scholar] [CrossRef]
  24. Rice, P.; Longden, I.; Bleasby, A. EMBOSS: The European molecular biology open software suite. Trends Genet. 2000, 16, 276–277. [Google Scholar] [CrossRef] [PubMed]
  25. Hall, T.; Biosciences, I.; Carlsbad, C. BioEdit: An important software for molecular biology. GERF Bull. Biosci. 2011, 2, 60–61. [Google Scholar]
  26. Rozas, J.; Ferrer-Mata, A.; Sánchez-DelBarrio, J.C.; Guirao-Rico, S.; Librado, P.; Ramos-Onsins, S.E.; Sánchez-Gracia, A. DnaSP 6: DNA sequence polymorphism analysis of large data sets. Mol. Biol. Evol. 2017, 34, 3299–3302. [Google Scholar] [CrossRef]
  27. Perna, N.T.; Kocher, T.D. Patterns of nucleotide composition at fourfold degenerate sites of animal mitochondrial genomes. J. Mol. Evol. 1995, 41, 353–358. [Google Scholar] [CrossRef]
  28. Lobry, J.R. Asymmetric substitution patterns in the two DNA strands of bacteria. Mol. Biol. Evol. 1996, 13, 660–665. [Google Scholar] [CrossRef] [PubMed]
  29. Katoh, K.; Misawa, K.; Kuma, K.-I.; Miyata, T. MAFFT: A novel method for rapid multiple sequence alignment based on fast Fourier transform. Nucleic Acids Res. 2002, 30, 3059–3066. [Google Scholar] [CrossRef]
  30. Talavera, G.; Castresana, J. Improvement of phylogenies after removing divergent and ambiguously aligned blocks from protein sequence alignments. Syst. Biol. 2007, 56, 564–577. [Google Scholar] [CrossRef]
  31. Zhang, D.; Gao, F.; Jakovlić, I.; Zou, H.; Zhang, J.; Li, W.X.; Wang, G.T. PhyloSuite: An integrated and scalable desktop platform for streamlined molecular sequence data management and evolutionary phylogenetics studies. Mol. Ecol. Resour. 2020, 20, 348–355. [Google Scholar] [CrossRef]
  32. Kalyaanamoorthy, S.; Minh, B.Q.; Wong, T.K.; Von Haeseler, A.; Jermiin, L.S. ModelFinder: Fast model selection for accurate phylogenetic estimates. Nat. Methods 2017, 14, 587–589. [Google Scholar] [CrossRef]
  33. Nguyen, L.-T.; Schmidt, H.A.; Von Haeseler, A.; Minh, B.Q. IQ-TREE: A fast and effective stochastic algorithm for estimating maximum-likelihood phylogenies. Mol. Biol. Evol. 2015, 32, 268–274. [Google Scholar] [CrossRef] [PubMed]
  34. Ronquist, F.; Huelsenbeck, J.P. MrBayes 3: Bayesian phylogenetic inference under mixed models. Bioinformatics 2003, 19, 1572–1574. [Google Scholar] [CrossRef] [PubMed]
  35. Letunic, I.; Bork, P. Interactive Tree of Life (iTOL): An online tool for phylogenetic tree display and annotation. Bioinformatics 2007, 23, 127–128. [Google Scholar] [CrossRef] [PubMed]
  36. Liu, D.; Zhou, Y.; Fei, Y.; Xie, C.; Hou, S. Mitochondrial genome of the critically endangered Baer’s Pochard, Aythya baeri, and its phylogenetic relationship with other Anatidae species. Sci. Rep. 2021, 11, 24302. [Google Scholar] [CrossRef]
  37. Mindell, D.P.; Sorenson, M.D.; Dimcheff, D.E. Multiple independent origins of mitochondrial gene order in birds. Proc. Natl. Acad. Sci. USA 1998, 95, 10693–10697. [Google Scholar] [CrossRef]
  38. Slack, K.E.; Janke, A.; Penny, D.; Arnason, U. Two new avian mitochondrial genomes (penguin and goose) and a summary of bird and reptile mitogenomic features. Gene 2003, 302, 43–52. [Google Scholar] [CrossRef]
  39. Hassanin, A.; Leger, N.; Deutsch, J. Evidence for multiple reversals of asymmetric mutational constraints during the evolution of the mitochondrial genome of Metazoa, and consequences for phylogenetic inferences. Syst. Biol. 2005, 54, 277–298. [Google Scholar] [CrossRef] [PubMed]
  40. Pereira, S.L. Mitochondrial genome organization and vertebrate phylogenetics. Genet. Mol. Biol. 2000, 23, 745–752. [Google Scholar] [CrossRef]
  41. Steinberg, S.; Cedergren, R. Structural compensation in atypical mitochondrial tRNAs. Nat. Struct. Biol. 1994, 1, 507–510. [Google Scholar] [CrossRef] [PubMed]
  42. Fourdrilis, S.; de Frias Martins, A.M.; Backeljau, T. Relation between mitochondrial DNA hyperdiversity, mutation rate and mitochondrial genome evolution in Melarhaphe neritoides (Gastropoda: Littorinidae) and other Caenogastropoda. Sci. Rep. 2018, 8, 17964. [Google Scholar] [CrossRef]
  43. Watanabe, Y.-I.; Suematsu, T.; Ohtsuki, T. Losing the stem-loop structure from metazoan mitochondrial tRNAs and co-evolution of interacting factors. Front. Genet. 2014, 5, 109. [Google Scholar] [CrossRef]
  44. Hurst, L.D. The Ka/Ks ratio: Diagnosing the form of sequence evolution. Trends Genet. TIG 2002, 18, 486. [Google Scholar] [CrossRef] [PubMed]
  45. Yang, Z.; Bielawski, J.P. Statistical methods for detecting molecular adaptation. Trends Ecol. Evol. 2000, 15, 496–503. [Google Scholar] [CrossRef] [PubMed]
  46. Bi, C.; Lu, N.; Xu, Y.; He, C.; Lu, Z. Characterization and analysis of the mitochondrial genome of common bean (Phaseolus vulgaris) by comparative genomic approaches. Int. J. Mol. Sci. 2020, 21, 3778. [Google Scholar] [CrossRef]
  47. Delacour, J. Waterfowl of the World; Country Life Ltd.: London, UK, 1973. [Google Scholar]
  48. Livezey, B. A phylogenetic analysis of the whistling and white-backed ducks (Anatidae, Dendrocygninae) using morphological characters. Ann. Carnegie Mus. 1995, 64, 65–97. [Google Scholar] [CrossRef]
  49. Liu, G.; Zhou, L.; Li, B.; Zhang, L. The complete mitochondrial genome of Aix galericulata and Tadorna ferruginea: Bearings on their phylogenetic position in the Anseriformes. PLoS ONE 2014, 9, e109701. [Google Scholar] [CrossRef]
  50. Watanabe, J.; Matsuoka, H. Flightless diving duck (Aves, Anatidae) from the Pleistocene of Shiriya, northeast Japan. J. Vertebr. Paleontol. 2015, 35, e994745. [Google Scholar] [CrossRef]
  51. Sraml, M.; Christidis, L.; Easteal, S.; Horn, P.; Collet, C. Molecular relationships within Australasian waterfowl (Anseriformes). Aust. J. Zool. 1996, 44, 47–58. [Google Scholar] [CrossRef]
  52. Livezey, B.C. A phylogenetic analysis of geese and swans (Anseriformes: Anserinae), including selected fossil species. Syst. Biol. 1996, 45, 415–450. [Google Scholar] [CrossRef]
  53. Donne-Goussé, C.; Laudet, V.; Hänni, C. A molecular phylogeny of Anseriformes based on mitochondrial DNA analysis. Mol. Phylogenetics Evol. 2002, 23, 339–356. [Google Scholar] [CrossRef]
Figure 1. Graphical map of the complete mitochondrial genome of A. marila. Genes encoded by the heavy strand are shown inside the circle, whereas those encoded by the light strand are shown outside the circle.
Genes 14 01205 g001
Figure 2. RSCU values of protein-coding genes in the mitochondrial genome of A. marila. The x-axis denotes the distinct codon families.
Genes 14 01205 g002
Figure 3. Secondary structures of the tRNA genes in the mitochondrial genome of A. marila. Red dots () specify G-C base pairing, and purple dots () specify G-U or A-U base pairing.
Genes 14 01205 g003
Figure 4. Analyses of repeats in the A. marila mitochondrial genome.
Genes 14 01205 g004
Figure 5. The Ka/Ks ratios of the 13 protein-coding genes of A. marila.
Genes 14 01205 g005
Figure 6. Phylogenetic relationship of Anatidae species based on 13 protein-coding genes. Numbers above branches are posterior probabilities from BI. B. hemilasius and G. gallus served as outgroup species. The red pentagram indicates that Todoma todoma may be a hybrid.
Genes 14 01205 g006
Figure 7. Population structure of Aythya species. A. platyrhynchos function as outgroup species for comparative analysis.
Genes 14 01205 g007
Table 1. Twenty-eight samples information used in the study.
SpeciesNumberSample Collection Site
A. marila6Heilongjiang Province, China
A. ferina6Heilongjiang Province, China
A. nyroca4Heilongjiang Province, China
A. baeri6Heilongjiang Province, China
A. fuligula6Heilongjiang Province, China
Table 2. Organization of the A. marila mitochondrial genome.
GeneStrandLocationSize (bp)Intergenic LengthAnticodonStart CodonStop Codon
tRNA-PheH1–70700GAA--
12S rRNAH71–10549840---
tRNA-ValH1055–1125710TAC--
16S rRNAH1126–272816030---
tRNA-Leu2H2729–2802744TAA--
ND1H2807–3784978−2-ATGAGG
tRNA-IleH3783–3854728GAT--
tRNA-GlnL3863–393371−1TGG--
tRNA-MetH3933–4001690CAT--
ND2H4002–504010390-ATGT--
tRNA-TrpH5041–5116763TCA--
tRNA-AlaL5120–5188692TGC--
tRNA-AsnL5191–5263730GTT--
tRNA-CysL5264–5329660GCA--
tRNA-TyrL5330–5399701GTA--
COIH5401–69511551−9-GTGAGG
tRNA-Ser2L6943–7015732TGA--
tRNA-AspH7018–7086691GTC--
COIIH7088–77746871-GTGTAA
tRNA-LysH7776–7843681TTT--
ATP8H7845–8012168−10-ATGTAA
ATP6H8003–8686684−1-ATGTAA
COIIIH8686–94697840-ATGT--
tRNA-GlyH9470–9538690TCC--
ND3H9539–98903511-ATGTAA
tRNA-ArgH9892–9961700TCG--
ND4LH9962–10,258297−7-ATGTAA
ND4H10,252–11,62913780-ATGT--
tRNA-HisH11,630–11,698690GTG--
tRNA-Ser1H11,699–11,76466−1GCT--
tRNA-Leu1H11,764–11,834710TAG--
ND5H11,835–13,6581824−1-GTGTAA
CytbH13,658–14,80011432-ATGTAA
tRNA-ThrH14,803–14,8716910TGT--
tRNA-ProL14,882–14,9517010TGG--
ND6L14,962–15,4835220-ATGTAG
tRNA-GluL15,484–15,551680TTC--
D-loopH15,552–16,61710660---
Table 3. Nucleotide composition and skewness of A. marila mitochondrial genome.
A. marilaT%C%A%G%(A + T)%AT-SkewGC-SkewLength (bp)
Mitogenome22.2532.8429.4215.4951.670.139−0.35916,617
PCGs23.5633.9827.0215.4450.580.068−0.37511,407
COI24.1132.9525.9816.9650.090.037−0.3201551
COII22.1233.1927.6617.0349.750.111−0.315687
ATP817.8640.4733.937.7451.790.310−0.679168
ATP623.3937.9927.9211.7051.310.088−0.540684
COIII23.0933.6726.9116.3350.000.076−0.347784
ND323.5534.4226.8115.2250.360.065−0.387351
ND521.3235.0929.9913.6051.310.169−0.4411824
ND422.7136.0029.3211.9752.030.127−0.5011378
ND4L24.5833.6725.5916.1650.170.020−0.351297
ND639.4611.8810.1538.5149.61−0.5910.528522
Cytb23.0136.3126.3314.3549.340.067−0.4331143
ND124.3434.6625.3615.6449.700.021−0.378978
ND221.7536.4829.5512.2251.300.152−0.4981039
D-loop24.6732.1827.3015.8551.970.051−0.3401066
tRNAs26.6422.0330.0121.3256.650.059−0.0161543
12S rRNA19.2128.2532.6220.0251.830.259−0.171984
16S rRNA19.9025.7634.5619.7854.460.269−0.1311603
Table 4. The codon number and relative synonymous codon usage in the mitochondrial genome of A. marila.
CodonCountRSCUCodonCountRSCUCodonCountRSCUCodonCountRSCU
UUU(F)520.475UCU(S)230.491UAU(Y)180.340UGU(C)20.148
UUC(F)1671.525UCC(S)1002.135UAC(Y)881.660UGC(C)271.852
UUA(L)410.373UCA(S)871.858UAA(*)7-UGA(*)87-
UUG(L)130.118UCG(S)130.278UAG(*)1-UGG(W)191
CUU(L)460.419CCU(P)250.435CAU(H)120.216CGU(R)10.081
CUC(L)1661.511CCC(P)941.635CAC(H)991.784CGC(R)160.297
CUA(L)3172.887CCA(P)1021.774CAA(Q)671.489CGA(R)453.649
CUG(L)760.692CCG(P)90.156CAG(Q)230.511CGG(R)100.811
AUU(I)650.508ACU(T)310.392AAU(N)160.264AGU(S)70.241
AUC(I)2081.625ACC(T)1561.975AAC(N)1051.736AGC(S)511.759
AUA(I)1110.867ACA(T)1151.456AAA(K)771.730AGA(R)00
AUG(M)581ACG(T)140.177AAG(K)120.270AGG(R)20.162
GUU(V)370.751GCU(A)400.559GAU(D)80.267GGU(G)110.204
GUC(V)611.239GCC(A)1732.420GAC(D)521.733GGC(G)771.426
GUA(V)721.462GCA(A)911.273GAA(E)721.532GGA(G)741.370
GUG(V)270.548GCG(A)120.168GAG(E)220.468GGG(G)541
* represents the termination codon.
Table 5. Genetic diversity of five Aythya species.
SpeciesNHNhπ
A. marila6610.01109
A. ferina6610.00139
A. nyroca4410.00093
A. baeri6610.00080
A. fuligula6610.00087
NH, number of haplotypes; N, number of individuals; h, haplotype diversity; π, nucleotide diversity.
Table 6. Fixation index (FST) of five Aythya species.
SpeciesA. fuligulaA. marilaA. ferinaA. nyroca
A. marila0.55425
A. ferina0.965210.78815
A. nyroca0.974980.822120.96901
A. baeri0.976280.823120.97023−0.09740
Disclaimer/Publisher’s Note: The statements, opinions and data contained in all publications are solely those of the individual author(s) and contributor(s) and not of MDPI and/or the editor(s). MDPI and/or the editor(s) disclaim responsibility for any injury to people or property resulting from any ideas, methods, instructions or products referred to in the content.

