1. Introduction
In various types of human cancers, immunotherapies that target the PD-1/PD-L1 axis have achieved remarkable success [
1]. These immunotherapies involve the use of antibodies to block the interactions between the PD-1/PD-L1 immune checkpoints, which have proven to be highly effective in clinical settings [
2]. Specifically, therapy with PD-L1 antibodies has demonstrated efficacy in blocking membrane PD-L1 and treating certain advanced carcinomas [
3].
Immunotherapy offers significant advantages over other cancer treatments due to its involvement of the immune system [
4]. In addition to being safer than traditional methods such as radiation and chemotherapy, it also establishes a lasting memory similar to antigens, which plays a crucial role in preventing tumor recurrences [
5]. A FDA-approved immunohistochemistry test for PD-L1 expression is a prerequisite for treatment with anti-PD-1/PD-L1 therapy [
6]. However, most tumors do not respond effectively to single-agent PD-1 antibodies, with only classic Hodgkin’s lymphoma showing effectiveness with PD-1 inhibitors alone [
7]. Furthermore, approximately 5–10% of patients develop severe immune-related inflammatory reactions, and 15–35% of patients experience disease recurrence after a period of PD-1/PD-L1 monoclonal antibody use [
7].
To address these questions, further understanding of the regulatory mechanism of PD-L1 expression is needed. The PD-L1 gene is constitutively expressed by a wide range of hematopoietic cells, such as macrophages, DCs, T cells, B cells, mast cells, and certain non-hematopoietic cells [
8]. Additionally, PD-L1 can be upregulated in various cell types in response to inflammatory cytokines and other stimuli, and it is often overexpressed in cancer cells [
9]. The regulation of PD-L1 expression involves exosome transport, post-transcriptional and post-translational modifications, and gene transcription [
10,
11]. Expanding our understanding of PD-L1 expression regulation is crucial for improving the efficacy of the current immune checkpoint blockade (ICB) and advancing cancer immunotherapy.
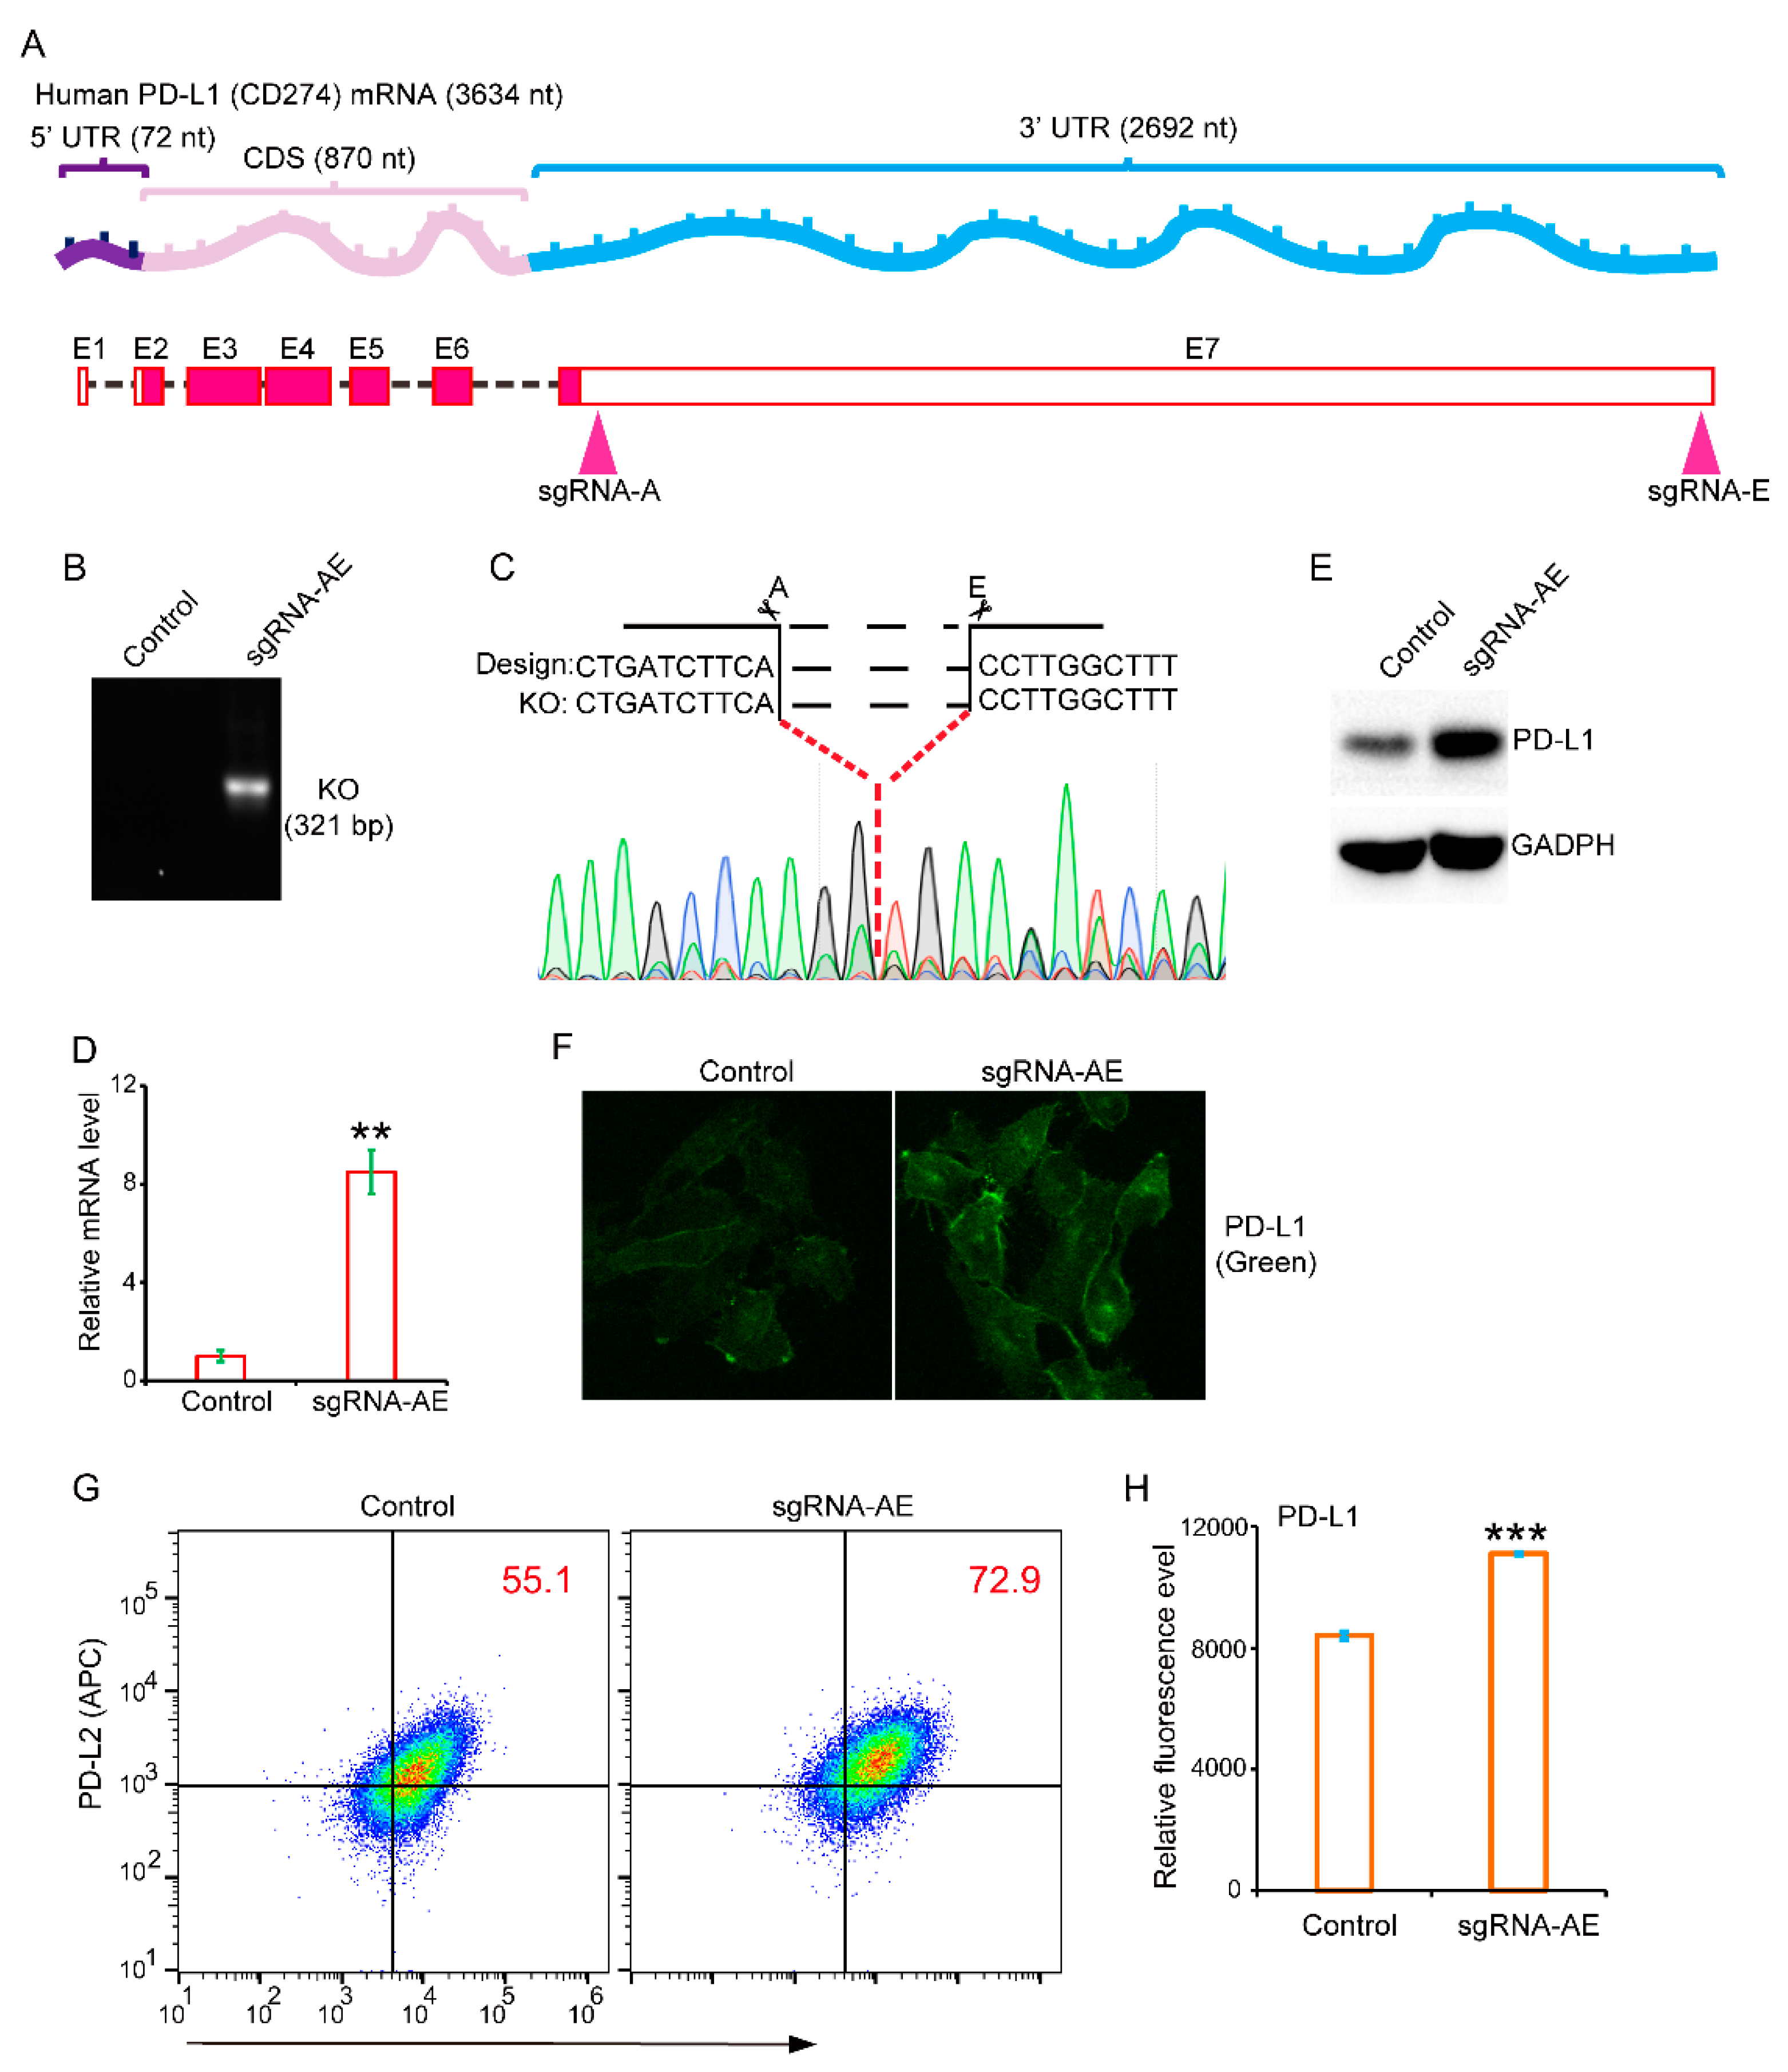
In our previous study, we discovered a fascinating phenomenon: the presence of a 2692 nt-long 3′-UTR region in a full-length 3634 nt PD-L1 mRNA molecule. In this study, we aimed to investigate the regulatory role of this lengthy 3′ non-coding region in PD-L1 expression and understand the underlying mechanism through bioinformatics research methods. Additionally, we explored the potential clinical implications of our findings.
2. Material and Method
2.1. Cell Culture and Treatment
Human breast cancer cells (SUM-159 (RRID: CVCL_5423)) were purchased from Cobioer; Nanjing Kebai Biotechnology Co., Ltd., Nanjing, China. The cells were cultured in DMEM supplemented with 10% FBS, 100 U/mL penicillin, and 100 mg/mL streptomycin. They were cultured in a humidified atmosphere of 5% CO2 at 37 °C. All cells went through mycoplasma detection and were free of mycoplasma. The cells were inoculated in six-well plates, and the cells were seeded at the same density and allowed to adhere for 24 h before treatment. All human cell lines have been authenticated using STR profiling within the last 3 years, and all experiments were performed with mycoplasma-free cells.
2.2. Plasmids
We constructed sgPD-L1-A1 (5′-GGAACTTCTGATCTTCAAGC-3′), sgPD-L1-A2 (5′-AAGATCAGAAGTTCCAATGC-3′), sgPD-L1-E1(5′-GTCAATGACAAGGAGTACCT-3′), and sgPD-L1-E2 (5′-GATAACACAAGGAGCTCTGT-3′) by ligation and digestion. The targeting oligonucleotides were cloned into the epiCRISPR vector. The vector plasmids were treated with BSPQI enzyme (New England Biolads, Ipswich, MA, USA) at 50 °C for 4 h. The upstream and downstream primers were annealed at 94 °C for 20 min then cooled at room temperature for one hour. The ligation was performed by using T4 DNA ligase (New England Biolads) at 16 °C overnight. The plasmids as mentioned above were validated by DNA sequencing.
2.3. Establishment of Stable Cell Lines
To construct a stable PD-L1-3′-UTR knockout cell line, SUM-159 cells were co-transfected with a combination of designed sgRNAs and transfected by the epiCRISPR vector plasmid as the control using Lipo2000 (Invitrogen, Waltham, MA, USA). After 48 h of transfection, the medium was replaced by complete medium containing 2 μg/mL puromycin (InvivoGen, San Diego, CA, USA) for 7 days to select stable cell lines. The stable cell line was confirmed by genotyping. The cells were lysed by 50 μL 1x mouse tissue lysis buffer (Vazyme) with 1 μL protease K (Vazyme) at 55 °C for 30 min. Then, the genomic PCR was performed with2xTaq Plus Master Mix (Dye Plus) (Vazyme) under the manufacturer’s instructions. The PCR products were analyzed with agarose gel electrophoresis. The DNA was purified for DNA sequencing, and the DNA sequencing was performed by Suzhou Anshengda Company, Suzhou, China.
2.4. RNA Isolation and Quantitative Real-Time PCR
Total RNA was extracted from the cells by using TRIzol RNA isolation reagents (Invitrogen). The purity and concentration of total RNA were evaluated using a Nanodrop 1000 spectrophotometer. Isolated RNA was then reverse-transcribed to cDNA according to the instructions of the HiScript® II QRT SuperMix for qPCR (+gDNA wiper) kit. The expression of the targeted gene was detected by the AceQ® qPCR SYBR Green Master Mix kit (Vazyme, Nanjing, China) according to the confirmed instructions using the CFX96 real-time PCR system (Bio Rad, Hercules, CA, USA). Fold changes in gene expression were calculated using the 2−△△t method and normalized to the expression of GAPDH.
2.5. Western Blot Analysis
Cells were collected and lysed by RIPA buffer (Solarbio, Beijing, China) containing 1% PMSF (Solarbio). SDS-PAGE was performed according to the manufacturer’s instructions. PVDF membranes (Millipore, Burlington, MA, USA) were used to transfer the proteins from the gels. Then, these were blocked in 5% non-fat milk in TBST for 2 h at room temperature. After blocking, the membranes were incubated with the following primary antibodies including anti-PD-L1 (Abcam, Cambridge, UK, 1:1000) and anti-GAPDH (Santa Cruz Biotechnology, Dallas, TX, USA, 1:2000) overnight at 4 °C. After incubation with horseradish peroxidase-conjugated secondary antibodies for 2 h at room temperature, the blots were visualized using an ECL kit (BL520B; Biosharp, Sakai, Japan). Finally, the images were analyzed using the ImageJ software.
2.6. Cellular Immunofluorescence
In advance, the cells were plated and allowed to climb on round glass slides in 24-well plate at the same density. After 24 h, the slides of the cells were fixed with 4% paraformaldehyde (PFA) for 20 min at room temperature, and then, the cells were washed with PBS (3 times for 5 min each), then blocked with 1% BSA for 2 h at room temperature. Then, the primary antibody including anti-PD-L1 (Abcam, 1:200) was incubated with the samples at 4 °C overnight. After washing 3 times for 5 min each, the secondary antibody, was Alexa-Fluor-488-conjugated anti-rabbit (Beyotime, Shanghai, China, 1:500), was added and incubated overnight. Care was taken to avoid light after adding the secondary antibody. After PBS washing (3 times for 5 min each), Hoechst (Beyotime, 1:500) was used for nuclear staining. The confocal microscope (Leica, Wetzlar, Germany) was applied to examine the fluorescence of stained cells.
2.7. Flow Cytometry
Cells were seeded into 6-well plates at the same density. The next day, the cells were collected and washed with PBS 3 times and stained with antibodies including anti-PD-L1 (PE-conjugated) (Elabscience, Houston, TX, USA, E-AB-F1133D) and anti-PD-L2 (APC-conjugated) (Elabscience, Houston, TX, USA, E-AB-F1175E) in staining buffer for 40 min on ice. During this step, light was avoided. After that, the samples were centrifuged for 3 min and washed 3 times, then suspended with PBS. The signals were captured by a BD Calibur (BD Biosciences, San Jose, CA, USA) flow cytometer and analyzed by the FlowJo software.
2.8. Data Acquisition
Gene expression TPM values of the protein-coding genes of 1406 Cancer Cell Lines were downloaded from the Broad Institute Cancer Cell Line Encyclopedia (CCLE) database (
https://sites.broadinstitute.org/ccle/, accessed on 5 December 2022). Transcriptome RNA-seq, miRNA-seq of 1,0327 patients with the 33 most-common cancers (adrenocortical carcinoma (ACC), bladder carcinoma (BLCA), breast invasive carcinoma (BRCA), cervical squamous cell carcinoma and endocervical adenocarcinoma (CESC), cholangiocarcinoma (CHOL), colon adenocarcinoma (COAD), lymphoid neoplasm diffuse large B cell lymphoma (DLBC), esophageal carcinoma (ESCA), glioblastoma multiforme (GBM), head and neck squamous cell carcinoma (HNSC), kidney chromophobe (KICH), kidney renal clear cell carcinoma (KIRC), kidney renal papillary cell carcinoma (KIRP), acute myeloid leukemia (LAML), brain lower-grade glioma (LGG), liver hepatocellular carcinoma (LIHC), lung adenocarcinoma (LUAD), lung squamous cell carcinoma (LUSC), mesothelioma (MESO), ovarian serous cystadenocarcinoma (OV), pancreatic adenocarcinoma (PAAD), pheochromocytoma and paraganglioma (PCPG), prostate adenocarcinoma (PRAD), rectum adenocarcinoma (READ), sarcoma (SARC), skin cutaneous melanoma (SKCM), stomach adenocarcinoma (STAD), testicular germ cell tumors (TGCT), thyroid carcinoma (THCA), thymoma (THYM), uterine corpus endometrial carcinoma (UCEC), uterine carcinosarcoma (UCS), and uveal melanoma (UVM)) were downloaded from The UCSC Xena database (
https://xenabrowser.net/, accessed on 12 April 2022). The corresponding clinicopathological information of 1,0327 patients were downloaded from The Cancer Genome Atlas (TCGA) database (
https://portal.gdc.cancer.gov/, accessed on 18 April 2022) IMvigor210 is a multicenter, single-arm, phase II trial to assess the safety and efficacy of atezolizumab (a PD-L1 inhibitor) in patients with locally advanced and metastatic urothelial carcinoma. After procuring the Creative Commons 3.0 License, we obtained the transcriptome RNA sequencing (RNA-seq) and detailed clinical annotations from IMvigor210 Core Biologies (
http://research-pub.gene.com/IMvigor210CoreBiologies/, accessed on 10 October 2022).
2.10. Immune Microenvironment and Immune Cell Infiltration Analysis
The data to evaluate the correlation between gene expression and the content of immune and stromal cells in tumor tissues were obtained from Sanger box web (
http://sangerbox.com/, accessed on 30 October 2022) through the Timer and Xcell packages.
2.11. Immunotherapy Response Prediction
Tumor immune dysfunction and exclusion (TIDE) (
http://tide.dfci.harvard.edu/, accessed on 10 January 2023) is a computational framework developed to evaluate the potential of tumor immune escape from the gene expression profiles of cancer samples. The TIDE score computed for each tumor sample can serve as a surrogate biomarker to predict the response to immune checkpoint blockade for multiple types of cancers.
2.12. Statistical Analysis
Statistical analyses were conducted using the R software (Version 4.2.1). Continuous variables are presented as the standard error of the mean and were compared using Student’s
t-test or the Wilcoxon rank sum test. Figure panels were pieced together by Adobe Illustrator (CC 2018). Some figures were drawn using the R software (Version 4.2.1), Tbtools (Version 1.06), and Figdraw (
https://www.figdraw.com/static/index.html/, accessed on 27 December 2022). Univariate and multivariate Cox proportional hazards regression analysis was performed using the “survival” package. A least absolute shrinkage and selection operator (LASSO) regression model was performed with the “glmnet” and “survival” packages. Kaplan–Meier survival analysis with the log-rank test was performed with the R package “survminer”. Statistical significance was set at
p < 0.05 and is shown as *
p < 0.05, **
p < 0.01, and ***
p < 0.001.
2.13. MicroRNA Network Analysis
MicroRNA network analysis was conducted using the Cytoscape software (Cytoscape, 3.9.1).
4. Discussion
It is notable that PD-L1 has an unusually long 3′-UTR. In leukemia and lymphoma, some cancer cells delete the 3′-UTR to increase the expression of PD-L1 and evade immune surveillance [
12]. However, genetic abnormalities in the PD-L1-3′-UTR are rarely observed in solid cancers. The overall impact of the 3′-UTR on PD-L1 expression in solid cancers has not been extensively studied. Here, we genetically deleted the entire 3′-UTR in cells with high PD-L1 expression. Surprisingly, even in a background of high PD-L1 expression, the disruption of the 3′-UTR still led to a significant and substantial increase in PD-L1 expression. These results suggest an extraordinary impact of the 3′-UTR on the expression of PD-L1. Because the genetic abnormalities of the 3′-UTR in solid tumor are very rare, it is likely that dysregulation of regulators in this region is a major pathway for increasing PD-L1 expression. This inference was partially supported by the fact that many PD-L1-RBPs, -miRNAs, and -m6A modifiers are dysregulated in cancer. Furthermore, these dysregulated regulators are known to be associated with prognosis and tumor immunity. In summary, this study provided evidence to support the notion that the 3′-UTR region plays a profound and negative role in regulating PD-L1 expression.
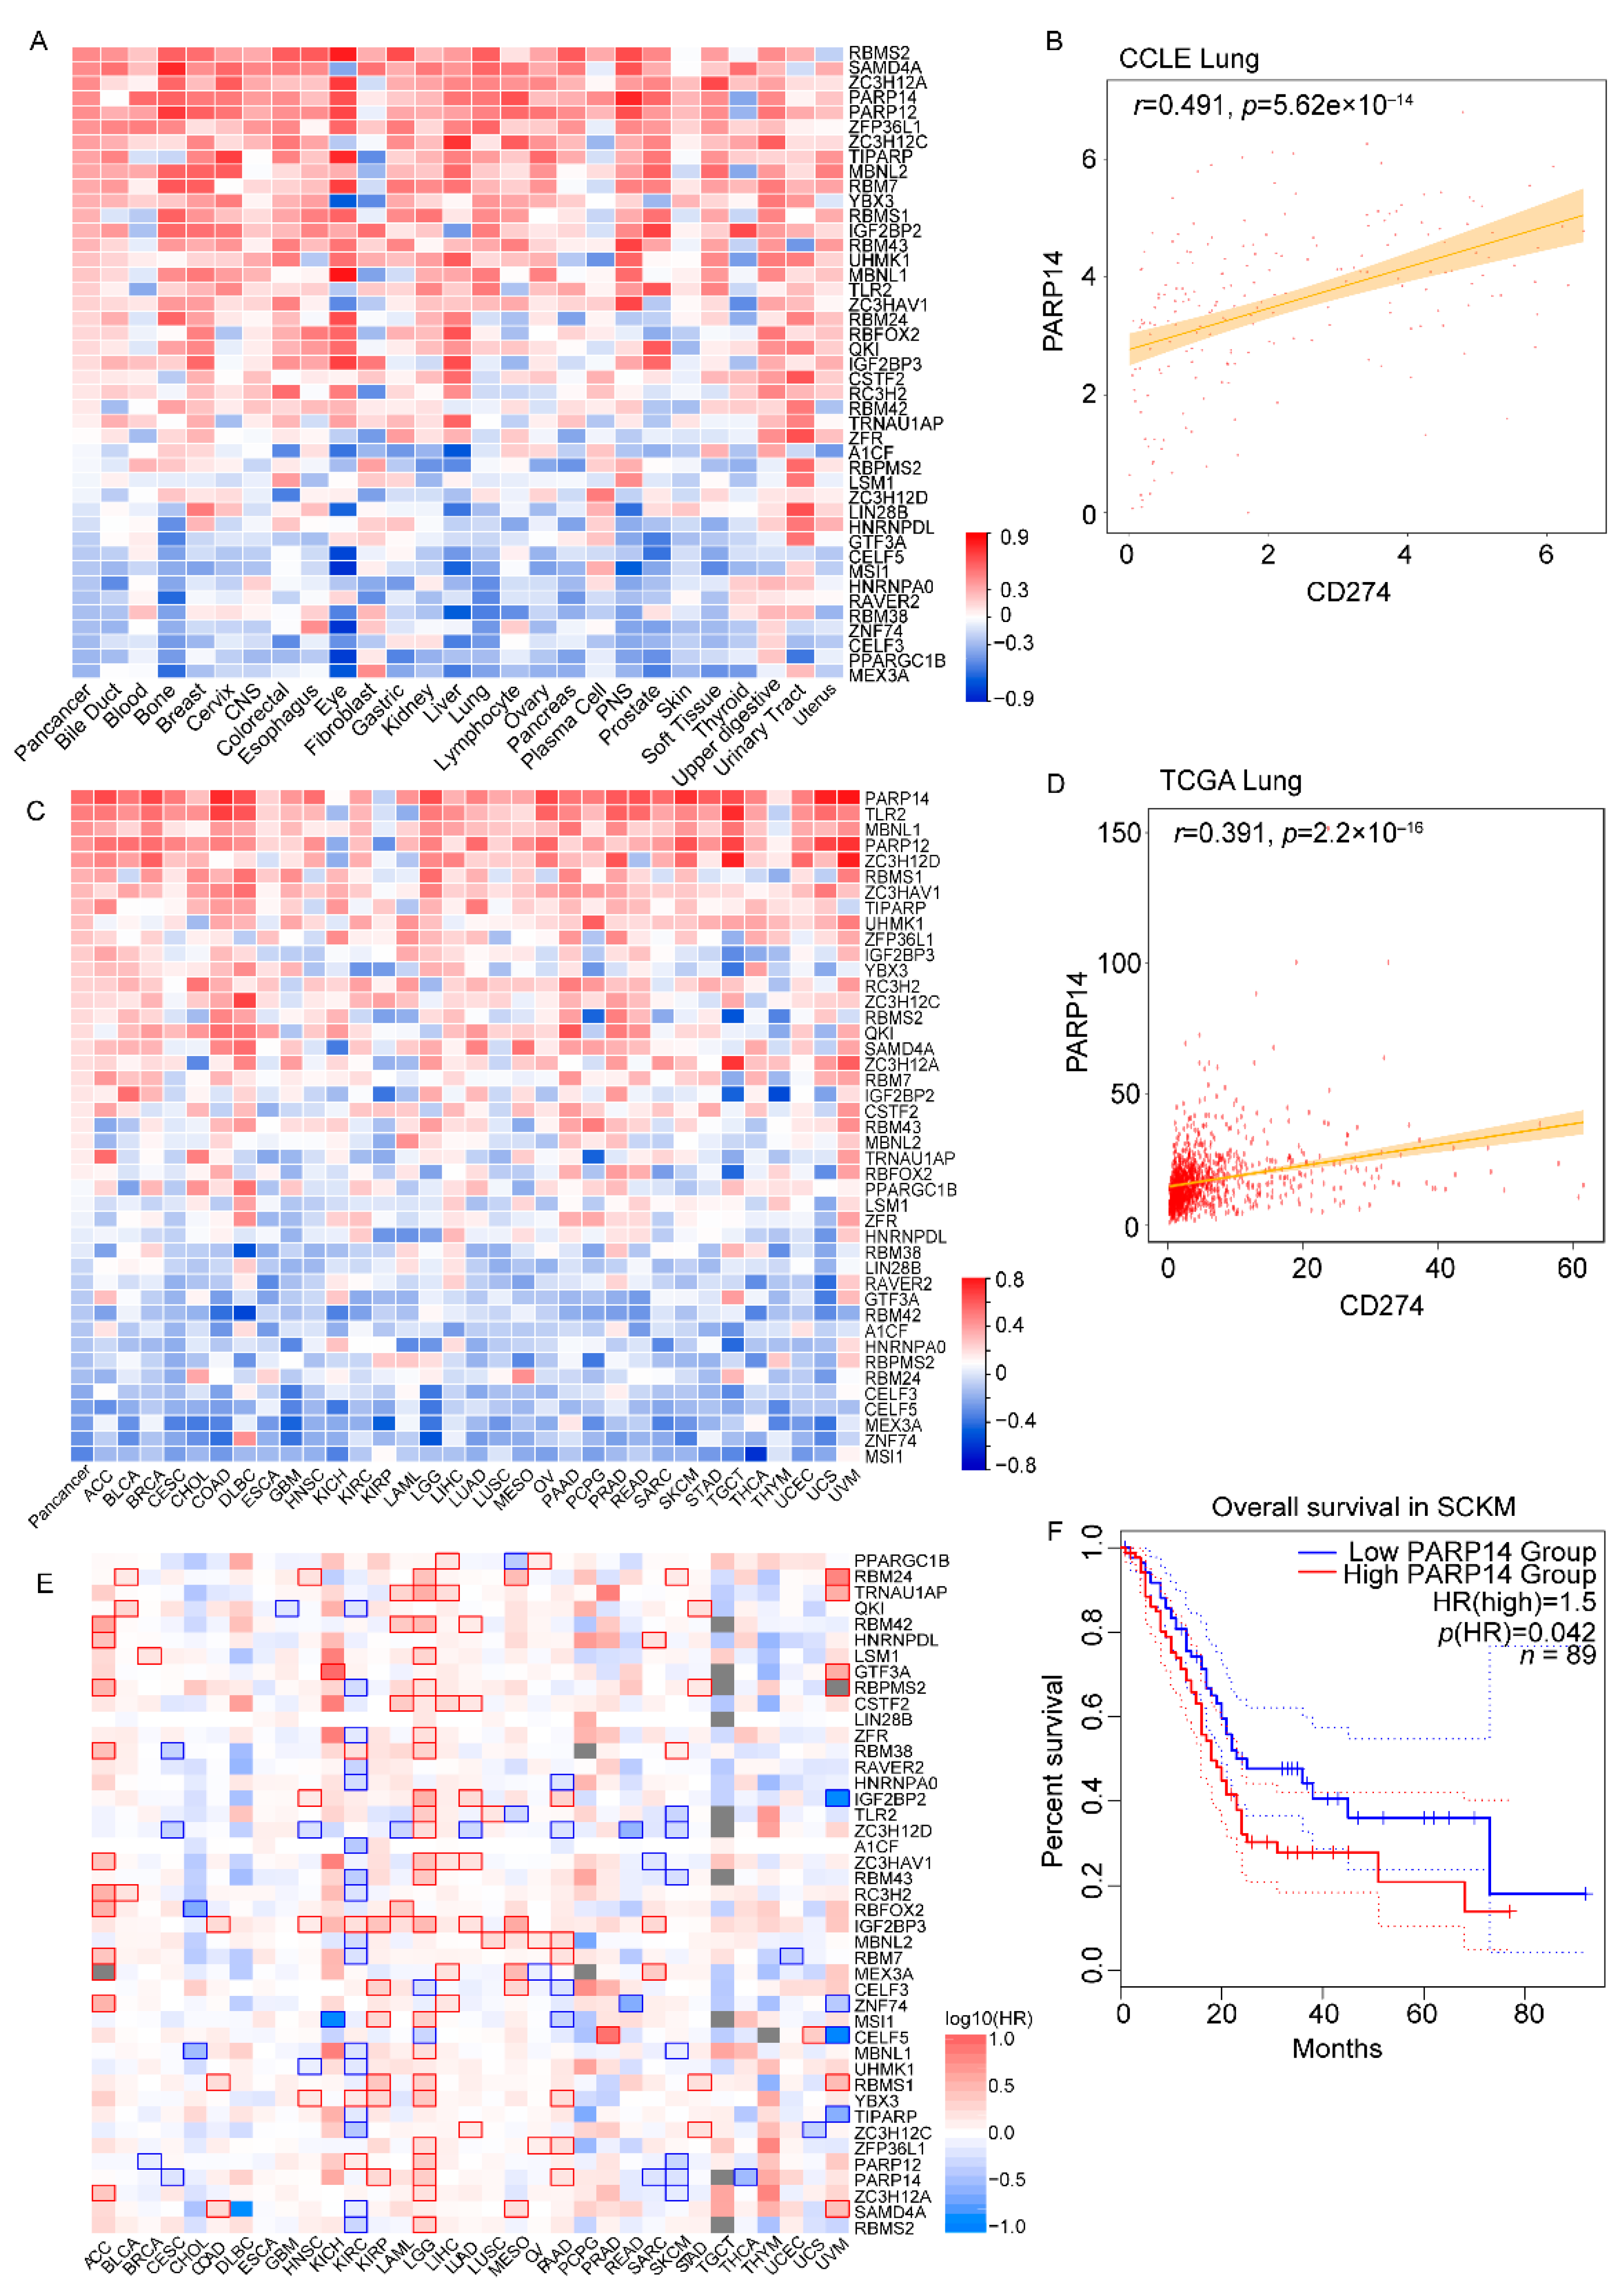
RNA-binding proteins (RBPs) play a crucial role in regulating spatiotemporal gene expression [
13,
14]. They are involved in all processes of RNA metabolism such as RNA splicing, polyadenylation, mRNA stability, and mRNA localization [
15]. The 3′-UTR acts as a hub for post-transcriptional control by recruiting RBPs [
16,
17]. Here, we explored the relationship between RBPs and PD-L1 in cancer cell lines and tissues. This investigation allowed us to identify 43 RBPs that are significantly associated with PD-L1 in a wide range of cancer. Among these identified RBPs, RBMS2 and RBMS1 are two of the most-significantly PD-L1-associated genes. Consistently, a recent publication also reported that RBMS1 is a critical regulator in PD-L1 expression and tumor immunity. RBMS1 directly stabilizes the mRNA of B4GALT1, a glycosyltransferase that promotes PD-L1 maturation and stabilization via mediating the glycosylation of PD-L1 in breast cancer [
18]. Here, we also observed a strong correlation between RBMS1 and PD-L1, not only in breast cancer, but also in multiple cancers. This suggests that RBMS1 may have a broad effect on PD-L1 across different types of cancer. It also supports the idea that our identified PD-L1-associated RBPs have important roles in the regulation of PD-L1, which should be further investigated.
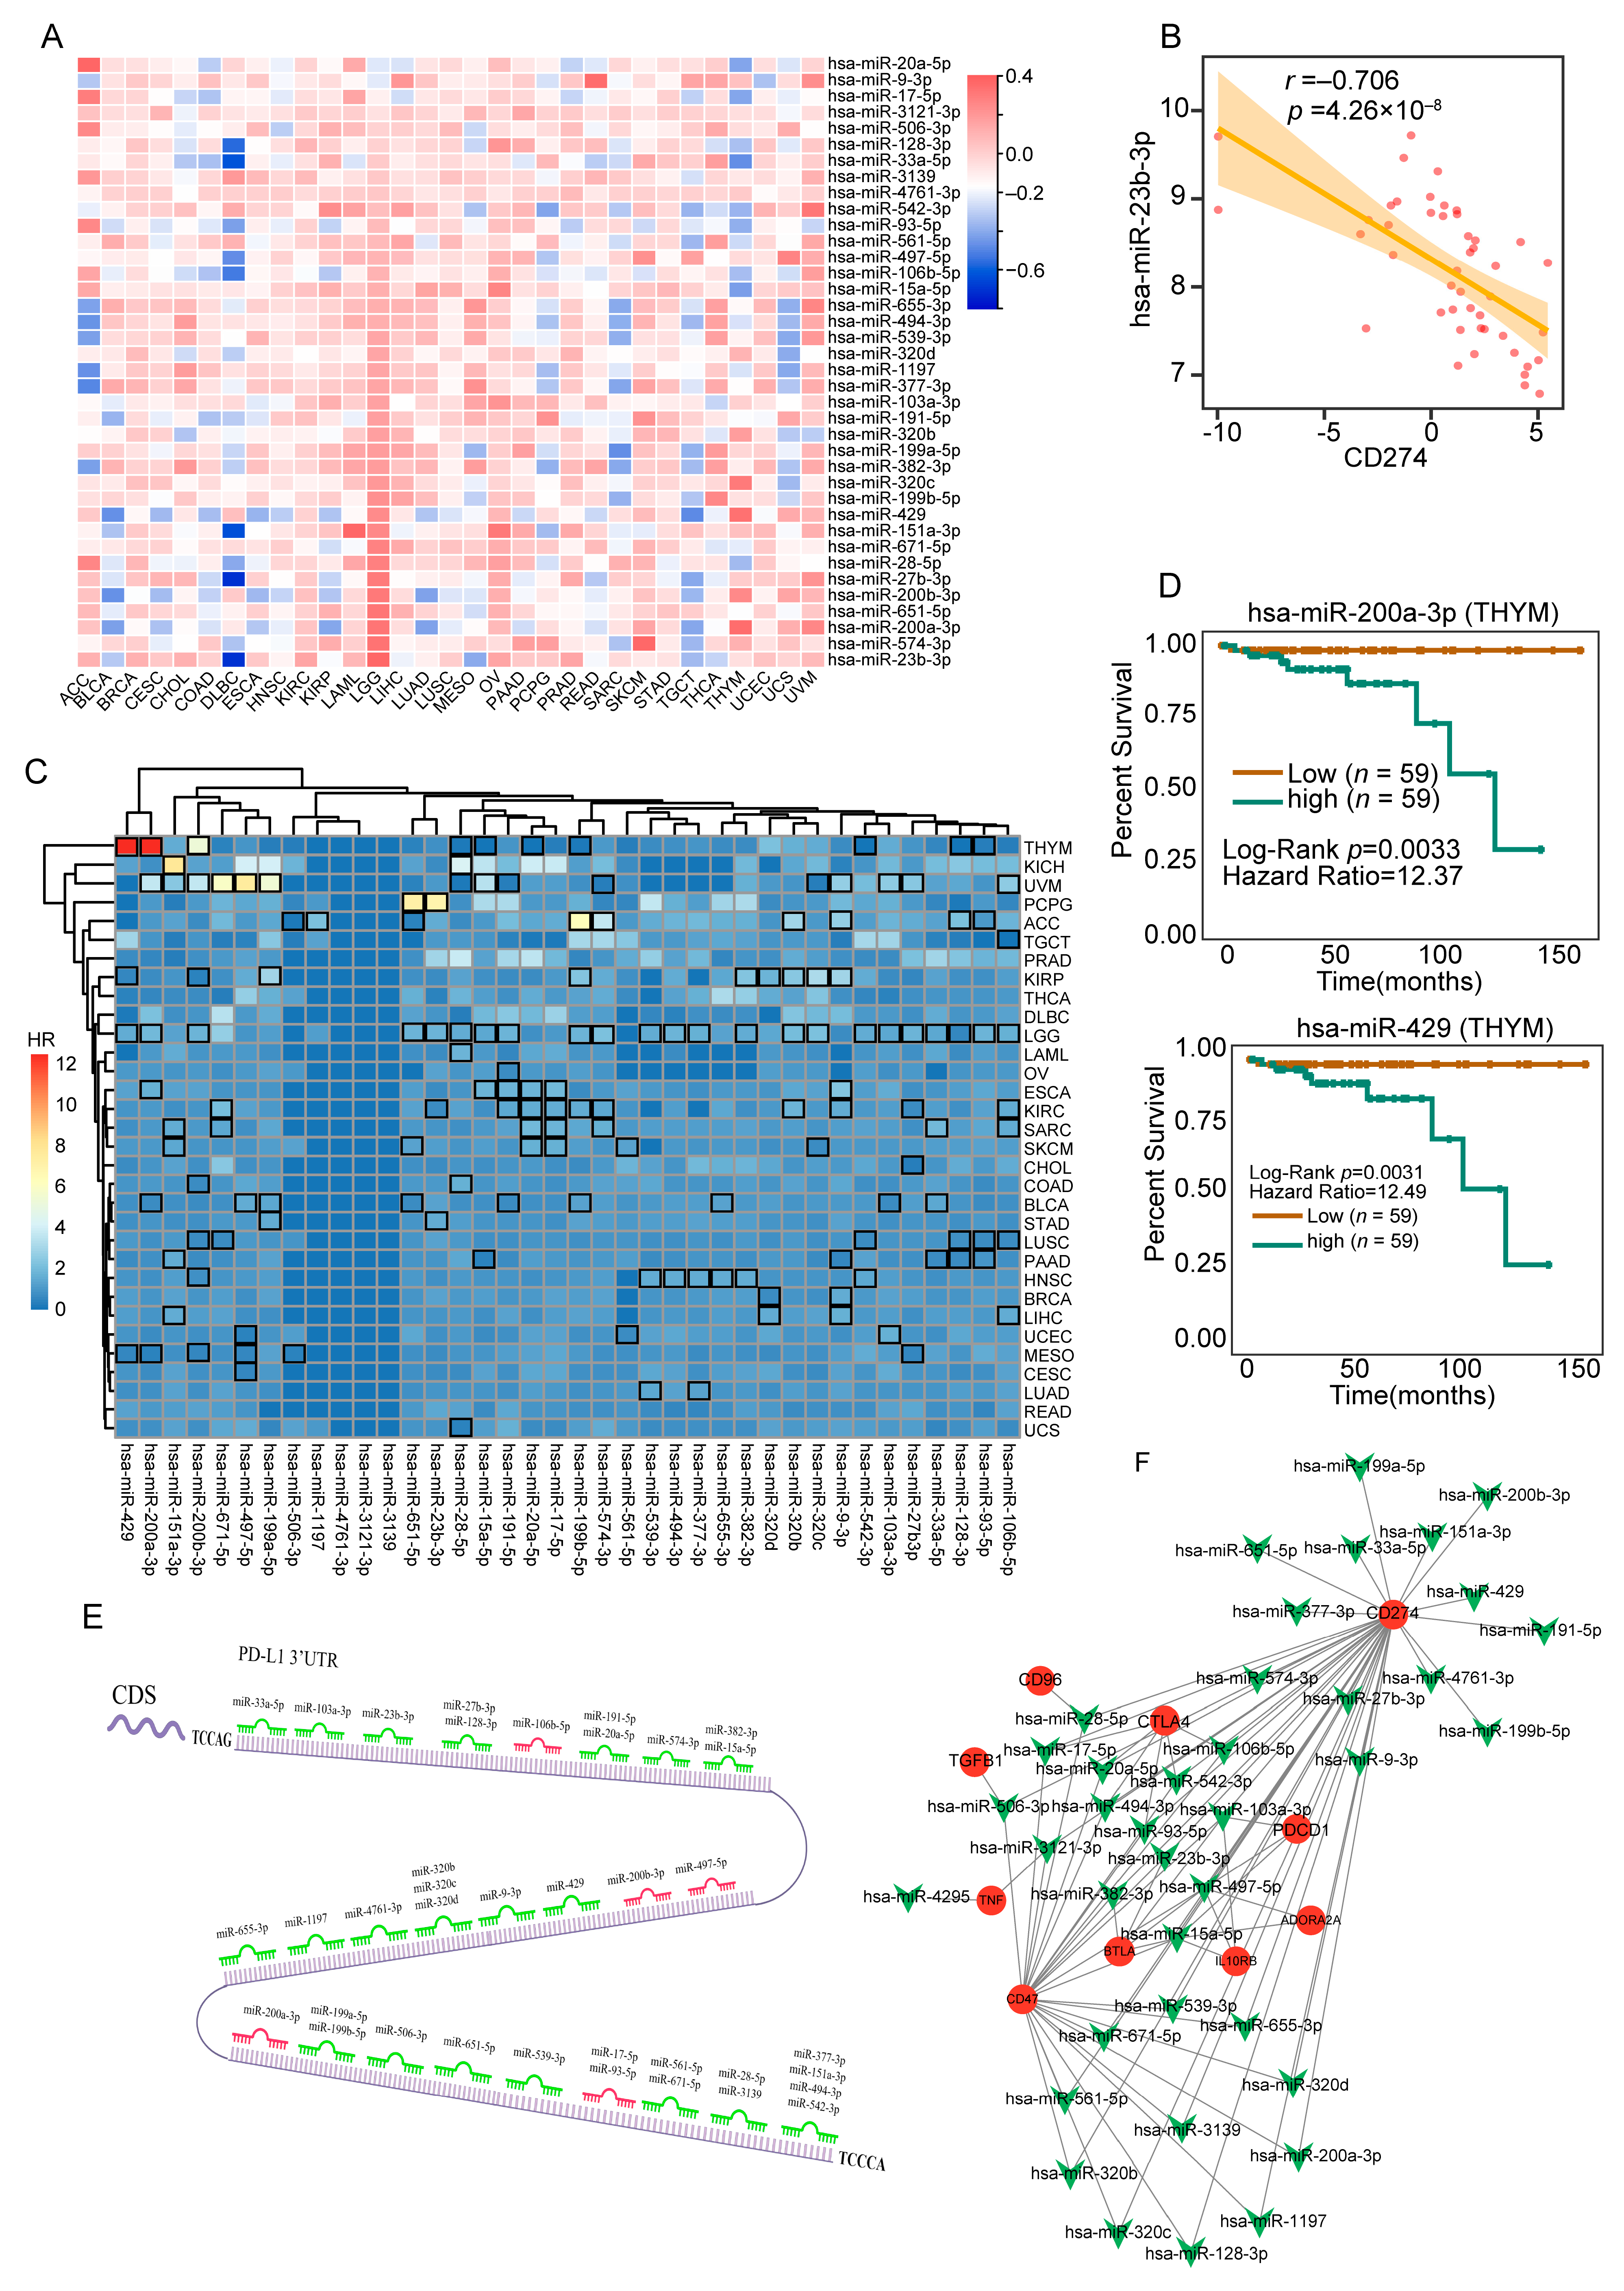
Mature miRNAs induce the silencing of the target mRNA through an imperfect base-pairing, usually within the 3′-UTR [
19]. Besides the important role of miRNAs in carcinogenesis, miRNAs have also gained attention as tools and targets for novel therapeutic approaches [
20]. Although miRNAs have been extensively studied in cancer, there has been a lack of comprehensive analysis on the miRNAs that regulate PD-L1. In this manuscript, we identified 38 PD-L1-associated miRNAs, some of which have already been published. For example, miRNA-497-5p directly targets PD-L1 and downregulates its expression in clear cell renal cell carcinoma [
21]. In addition, miRNA-93-5p downregulates PD-L1 in colorectal cancer [
22]. However, these two publications focused on single cancers. In our analysis, the majority of the identified miRNAs are associated with multiple cancers, suggesting the need for further systematic exploration.
N6-methyladenosine (m6A) is the most-abundant internal modification in mRNA molecules. This modification is reversible and dynamically regulated by proteins known as “Writer”, “Eraser”, and “Reader” [
23]. The PD-L1 mRNA is also modified by m6A, and its regulators have been extensively studied [
24,
25]. The level of PD-L1 mRNA is closely linked with ALKBH5, an Eraser of m6A modifications [
25]. The m6A of PD-L1 is recognized by YTHDF2, which is a Reader of m6A [
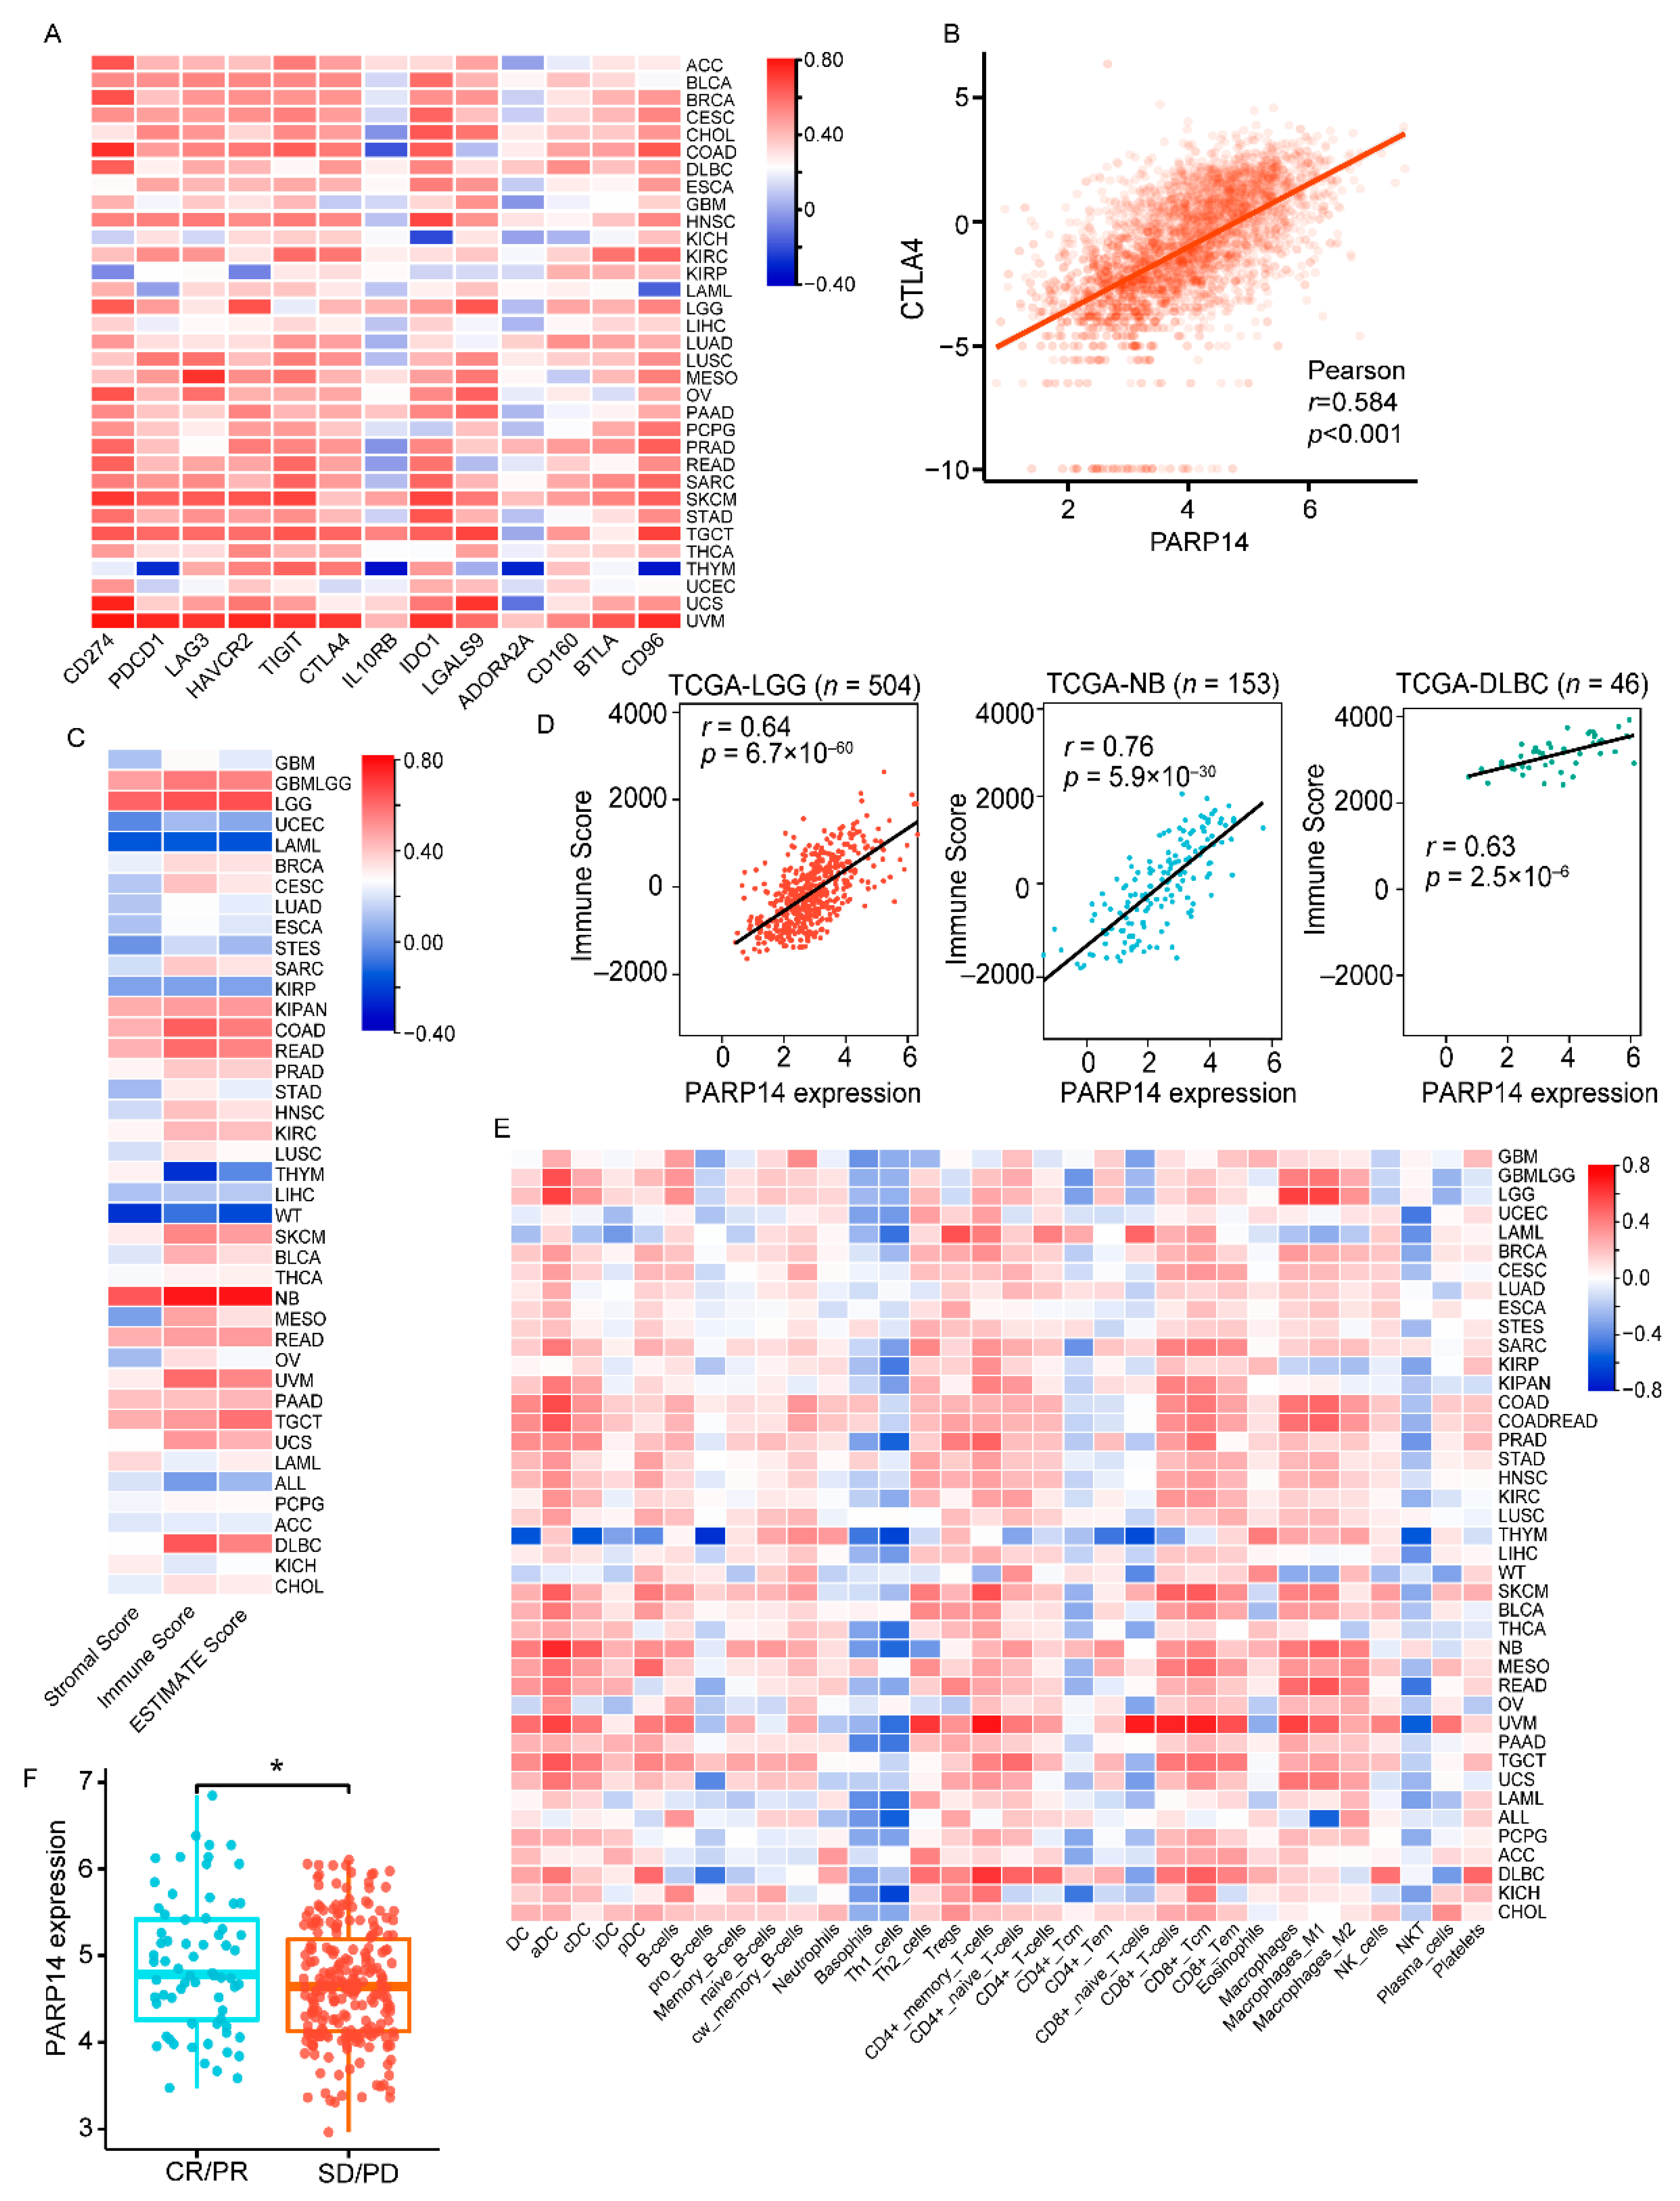
25]. Besides the reported m6A regulators, we also uncovered several new PD-L1-associated m6A regulators. Among them, ALKBH3 shows a significant association with PD-L1 in various types of cancer. Therefore, a thorough investigation of the precise regulation of PD-L1 m6A modification is warranted. Although we verified that the PD-L1-3′-UTR could promote PD-L1 expression in SUM-159 cells, the 3′-UTR regulators (RBP, miRNA, and m6A regulators) based on data mining have not been verified by wet experiments. Finally, we constructed a model using four genes, RBMS1, ZC3HAV1, QKI, and RBM38, to calculate the Tumor Immune Dysfunction and Exclusion (TIDE) score. In the TCGA cohort analysis, the TIDE score based on these four genes showed a good correlation with the patient’s response to ICI. Therefore, the four-gene TIDE score should be further validated in ICI-treated patients and might be beneficial to predict ICI treatment and prognosis.
In summary, we presented compelling evidence highlighting the crucial role of the 3′-UTR in the regulation of PD-L1. More importantly, by a systematic analysis, we identified several novel regulators of PD-L1. These findings contribute to a comprehensive understanding of the post-transcriptional regulation of PD-L1 through the 3′-UTR.

