Article

Screening of Reference Genes under Biotic Stress and Hormone Treatment of Mung Bean (Vigna radiata) by Quantitative Real-Time PCR

1
College of Life Sciences, Nanjing Agricultural University, Nanjing 210095, China
2
Institute of Industrial Crops, Jiangsu Academy of Agricultural Sciences/Jiangsu Key Laboratory for Horticultural Crop Genetic Improvement, Nanjing 210014, China
3
School of Life Sciences, Jiangsu University, Zhenjiang 212013, China
*
Authors to whom correspondence should be addressed.
Genes 2023, 14(9), 1739; https://doi.org/10.3390/genes14091739
Submission received: 4 August 2023 / Revised: 26 August 2023 / Accepted: 29 August 2023 / Published: 30 August 2023
(This article belongs to the Section Plant Genetics and Genomics)

Abstract

:
Mung bean (Vigna radiata) production has been greatly threatened by numerous diseases. Infection with these pathogens causes extensive changes in gene expression and the activation of hormone signal transduction. Quantitative real-time PCR (qRT-PCR) is the most common technique used for gene expression validation. Screening proper reference genes for mung bean under pathogen infection and hormone treatment is a prerequisite for ensuring the accuracy of qRT-PCR data in mung bean disease-resistance research. In this study, six candidate reference genes (Cons4, ACT, TUA, TUB, GAPDH, and EF1α) were selected to evaluate the expression stability under four soil-borne disease pathogens (Pythium myriotylum, Pythium aphanidermatum, Fusarium oxysporum, and Rhizoctonia solani) and five hormone treatments (SA, MeJA, ETH, ABA, and GA3). In the samples from different treatments, the Ct value distribution of the six candidate reference genes was different. Under the condition of hormone treatment, the Ct value ranged from a minimum of 17.87 for EF1α to a maximum of 29.63 for GAPDH. Under the condition of pathogen infection, the Ct value ranged from a minimum of 19.43 for EF1α to a maximum of 31.82 for GAPDH. After primer specificity analysis, it was found that GAPDH was not specific, so the five reference genes Cons4, ACT, TUA, TUB, and EF1α were used in subsequent experiments. The software products GeNorm, NormFinder, BestKeeper and RefFinder were used for qRT-PCR data analysis. In general, the best candidates reference genes were: TUA for SA, ABA, GA3, and Pythium myriotylum treatment; TUB for ETH treatment; ACT for MeJA and Fusarium oxysporum treatment; and EF1α for Pythium aphanidermatum and Rhizoctonia solani treatment. The most stably expressed genes in all samples were TUA, while Cons4 was the least stable reference gene. Finally, the reliability of the reference gene was further validated by analysis of the expression profiles of four mung bean genes (Vradi0146s00260, Vradi0158s00480, Vradi07g23860, and Vradi11g03350) selected from transcriptome data. Our results provide more accurate information for the normalization of qRT-PCR data in mung bean response to pathogen interaction.

1. Introduction

Mung bean is an important industrial crop belonging to the Vigna genus and is considered a medicine–food homology crop, making it one of the most significant commercial products in Asia [1,2]. Mung bean seeds are a rich source of vitamins, proteins and trace minerals, making them highly nutritious and therapeutically valuable. During production in the field, numerous diseases influence mung bean growth and development, leading to yield loss and quality degradation. Among these, soil-borne diseases caused by P myriotylum, P aphanidermatum, F oxysporum and R solani usually affect the entire developmental stage. For instance, when mung bean root rot develops, it causes the aboveground part of the plant to become dwarfed, withered, and yellow; the root starts to discolor from the tip of the root and become water-soaked; and the lower part of the main root will first appear brown, turning to russet in severe cases. The lower part of the principal root completely rots, resulting in the death of seedlings and posing a quantitative and qualitative threat to the mung bean crop [3,4,5,6]. P. myriotylum causes pre-emergence rot and root rot of Phaseolus vulgaris seedlings [3]. Turmeric rhizome rot is mainly caused by P. aphanidermatum, which is considered to be the principal disease that hinders the production of turmeric, resulting in a reduction in turmeric production of between 5% and 30% [7,8]. R. solani is one of the crucial soil-borne necrotrophic phytopathogens causing disease in staple crops, such as rice sheath blight disease, potato black scurf disease, soybean rhizoctonia foliar blight disease, and corn sheath blight [9,10,11]. F. oxysporum induces vascular wilt in tomato, resulting in accelerated wilting of tomato plants and 10–80% yield loss. It also causes wilt in chickpea plants, which can result in 10–100% yield loss [12,13]. In response to pathogen infection, almost the entire plant genome (97% to 99%) undergoes transcriptional modulation [14]. To understand plant–pathogen interactions, the gene expression assay is an excellent method to uncover candidate genes for the signaling and metabolic pathways.
The quantitative real-time polymerase chain reaction (qRT-PCR) method is a highly sensitive tool for detecting the expression of specific genes compared to traditional PCR [15,16,17]. There are two approaches to qRT-PCR—absolute quantification and relative quantification [18,19]. Relative quantification is the most frequently utilized approach to determine gene expression levels and differences. Nevertheless, several limitations impact the experimental outcomes, such as the RNA quality and concentration, reverse-transcription cDNA concentration, and amplification efficiency [20,21,22]. Relative quantification necessitates the use of internal reference genes to rectify the data when interpreting the results, thereby improving the accuracy of the quantitative results. The expression levels of an ideal reference gene should show little variation across different tissues, developmental stages, and various stresses [23]. Therefore, the selection of appropriate reference genes is a critical prerequisite for the accurate analysis of qRT-PCR results.
In botany, the traditionally used reference genes are usually involved in cellular biochemical pathways or important components of the cytoskeleton, such as Actin (ACT), Elongation factor-1a (EF1α), α-Tubulin (TUA), 18S ribosomal RNA (18SrRNA), β-Tubulin (TUB), and Glyceraldehyde-3-phosphate dehydrogenase (GAPDH) [24,25,26,27]. However, several studies indicate that the classic reference genes show unstable expression in many species, especially under different treatment conditions [28,29,30]. For instance, in soybean, GmEF1α and GmEF1β were most stable in roots infected with Meloidogyne incognita, while GmCYP2 and GmELF1α were the most stable genes in leaves infested with Anticarsia gemmatalis [31]. To select appropriate reference genes for qRT-PCR analysis, it is important to consider their expression stability across different stress conditions. To our knowledge, no studies have evaluated the expression stability of reference genes under biological stress and hormone treatment in mung bean.
In this study, six candidate reference genes—ACT, TUA, TUB, GAPDH, EF1α, and Cons4—were selected based on the mung bean genome and related literature reports. The expression stabilities of these six candidate reference genes’ responses to infection by four phytopathogens and five hormone treatments were systematically analyzed by qRT-PCR. The gene stability analysis software GeNorm [32], NormFinder [33], BestKeeper [34] and RefFinder [35] were used to evaluate the stability of the candidate reference genes. Finally, four genes were selected according to the transcriptome data to verify the selected candidate reference genes.

2. Materials and Methods

2.1. Plant Materials and Treatments

Mung bean seeds “sulv 1” were planted in plastic pots (7 cm × 7 cm) filled with mixotrophism substrate (vermiculite/nutrient soil = 1:1). The pots were placed in a greenhouse (25 °C, 16 h light/8 h dark). Selected fourteen-day-old plants were used as subsequent experimental materials. The plant roots were immersed in mycelial liquid (1 L/dish) under soil-borne disease pathogen treatment (P. myriotylum, P. aphanidermatum, F. oxysporum, or R. solani). For hormone treatment (100 μM SA, 50 μM MeJA, 1 mM ETH, 50 μM ABA, or 50 μM GA3), the plant roots were immersed in different concentrations of hormone solutions. After 30 min of treatment, plant roots taken out and cultured in water. Samples were collected at 0, 12, 24, and 48 h after the respective treatments. Each time point was completed with three replicates, each comprising three plant roots, and stored at −80 °C.

2.2. RNA Extraction and cDNA Synthesis

An RNA extraction kit (Vazyme, Nanjing, China) was used for total RNA extraction following the manufacturer’s instructions. The RNA concentration was measured using a MICRO Spectrophotometer-k5800 (KAIAO, Beijing, China). The integrity of the RNA was verified by 1% agarose gel electrophoresis. Based on the recommendation of the HiScript III 1st Strand cDNA Synthesis Kit (Vazyme, Nanjing, China), 1 μg total RNA was used for cDNA synthesis. The total system volume was 20 µL.

2.3. Primer Design

According to the mung bean genome and related literature reports [36], six candidate reference genes were screened: Cons4, ACT, TUA, TUB, GAPDH and EF1α (Table 1). qRT-PCR primers were designed using Primer 5.0.

2.4. PCR and Quantitative Real-Time PCR Analysis

To detect the specificity of the primers, 1% agarose gel electrophoresis was performed. The reaction mixture consisted of 10 µL 2 × Rapid Taq Master Mix (Vazyme, Nanjing, China), 8 µL ddH2O, 1 µL cDNA, and 1 µL each of the forward and reverse amplification primers, resulting in a final volume of 20 µL. To perform qRT-PCR, LightCycler® 480 software (Roche, Shanghai, China) was used. All samples were subjected to three technical replicates and three biological replicates. The reaction mixture comprised 10 µL 2 × Taq Pro Universal SYBR qPCR Master Mix (Vazyme, Nanjing, China), 7.2 µL ddH2O, 2 µL cDNA, and 0.4 µL each of the forward and reverse amplification primers for a final volume of 20 µL. The cDNAs diluted several times were used as qRT-qPCR amplification templates. A curve was drawn to obtain the R2 value, and the amplification efficiency was calculated according to the efficiency calculation formula.

2.5. Stability Analysis of Candidate Reference Genes

The sample cycle threshold (Ct) value was obtained according to the RT-qPCR experiment. The data were processed using GeNorm (https://genorm.cmgg.be/, accessed on 24 August 2023), NormFinder (https://genorm.cmgg.be/, accessed on 24 August 2023), and BestKeeper (https://www.gene-quantification.de/bestkeeper.html, accessed on 24 August 2023) to obtain the order of the stability of the internal reference genes. RefFinder (http://blooge.cn/RefFinder/, accessed on 24 August 2023) was used to comprehensively evaluate the analysis results of the above three programs to obtain stable reference genes. The stable reference genes were selected to analyze the expression patterns of the Vradi0146s00260, Vradi0158s00480, Vradi07g23860, and Vradi11g03350 genes under infection by P. myriotylum. According to the expression trend and RNA-seq trend analysis, the selected reference genes were further verified.

3. Results

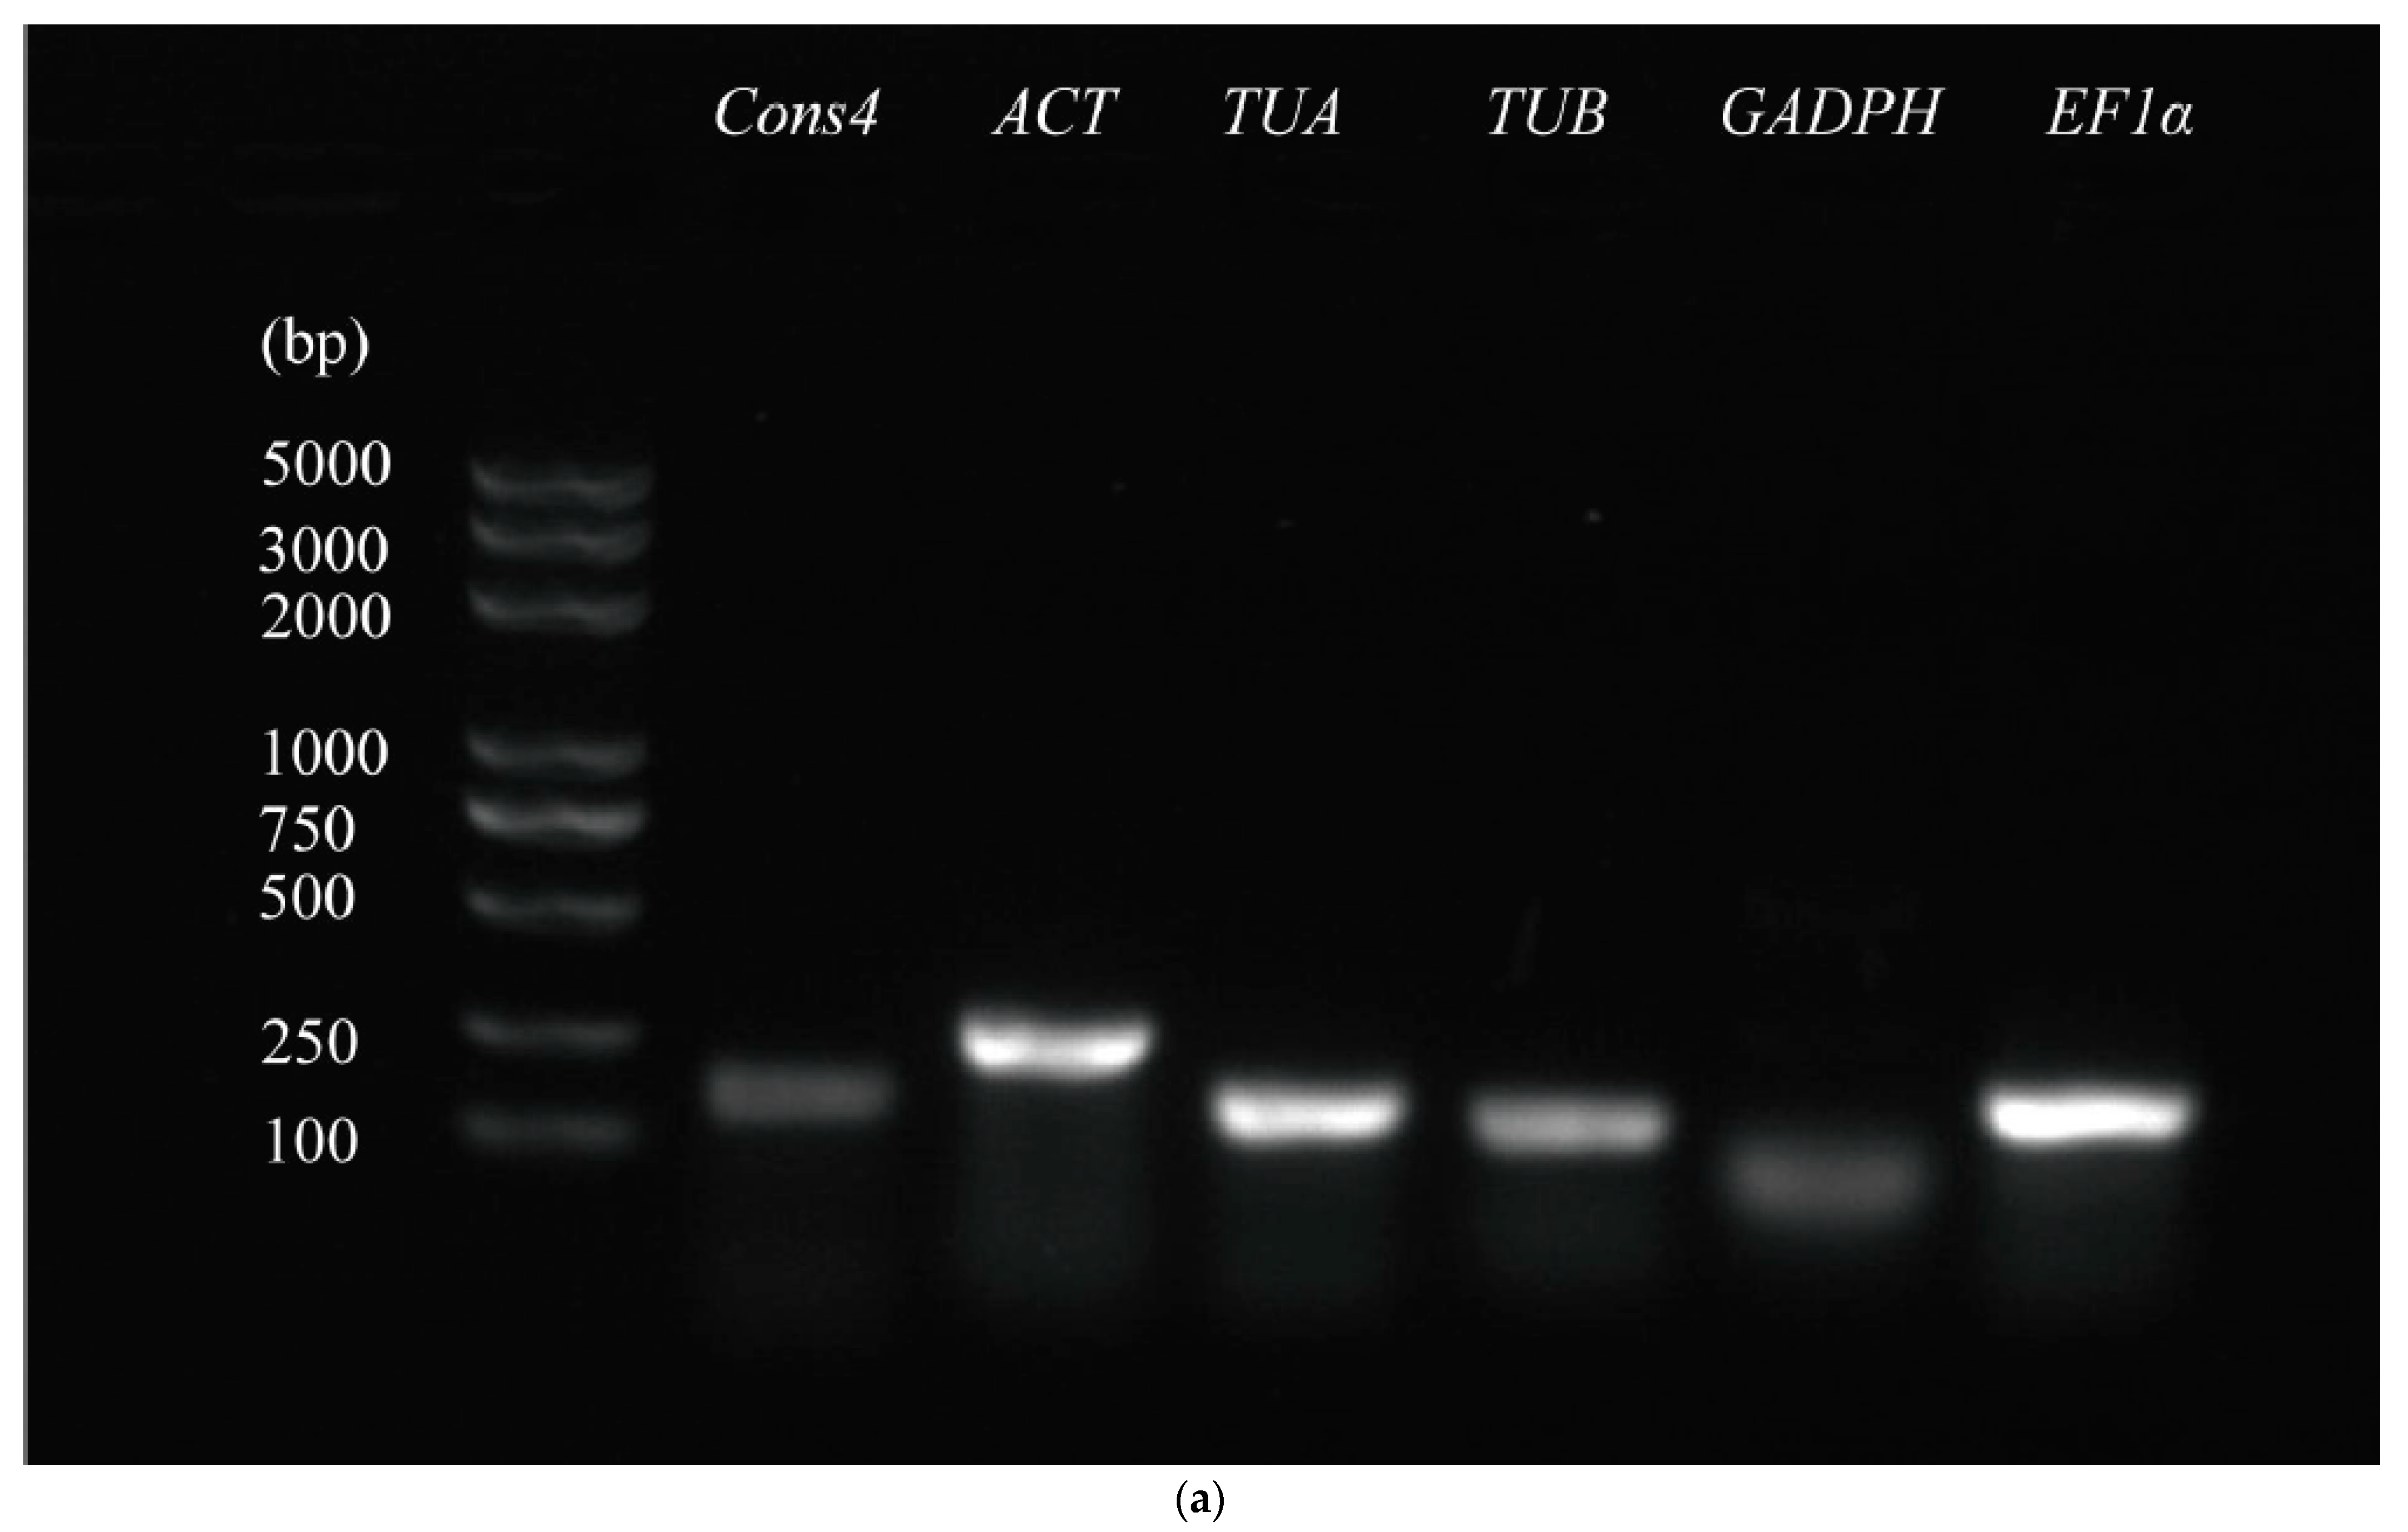
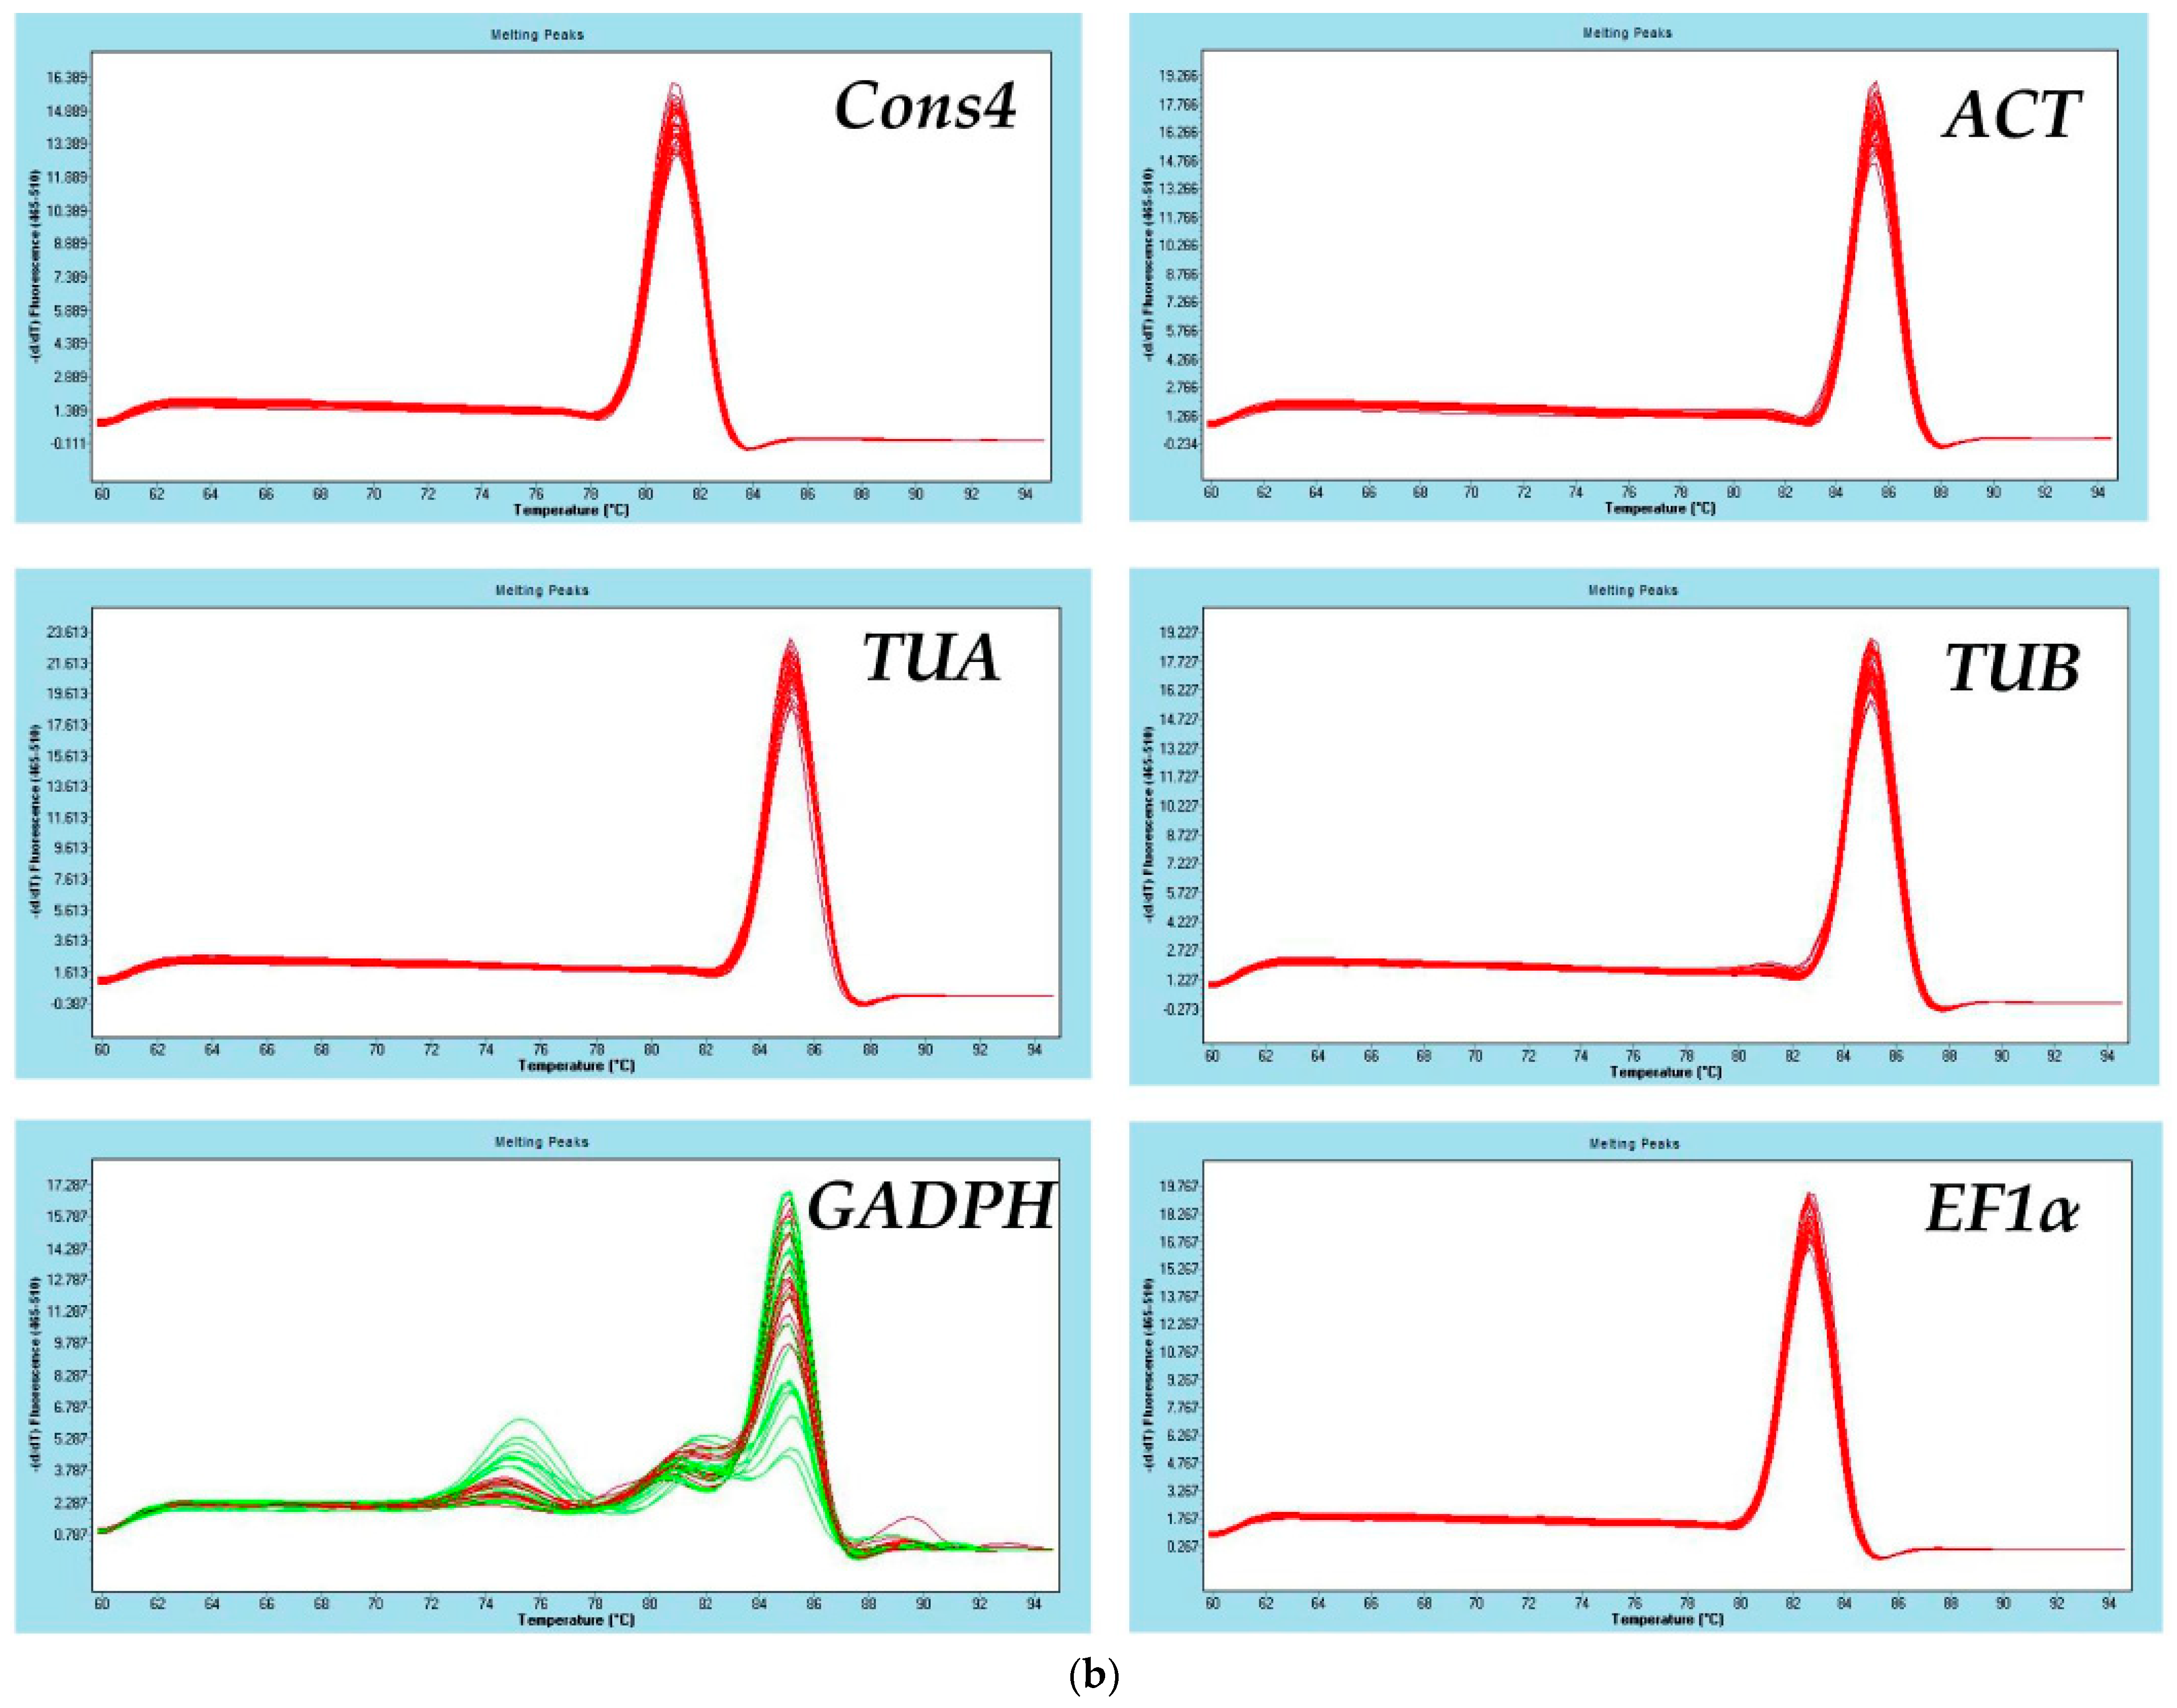
3.1. Primer Specificity and Amplification Efficiency of Candidate Reference Genes

The PCR amplification products of the six candidate reference genes (Cons4, ACT, TUA, TUB, GAPDH, and EF1α) were analyzed via 1% agarose gel electrophoresis using the cDNA of each sample as a template. The amplified band size was consistent with the expected fragment sizes, and the band was single without a primer dimer, as shown in Figure 1a. After qRT-qPCR detection, the melting curve of each reference gene primer was obtained, as depicted in Figure 1b. The GAPDH reference gene showed a double signal peak, while the other five reference genes showed a single signal peak. The primer amplification efficiency was ideal, and the amplification specificity was high.

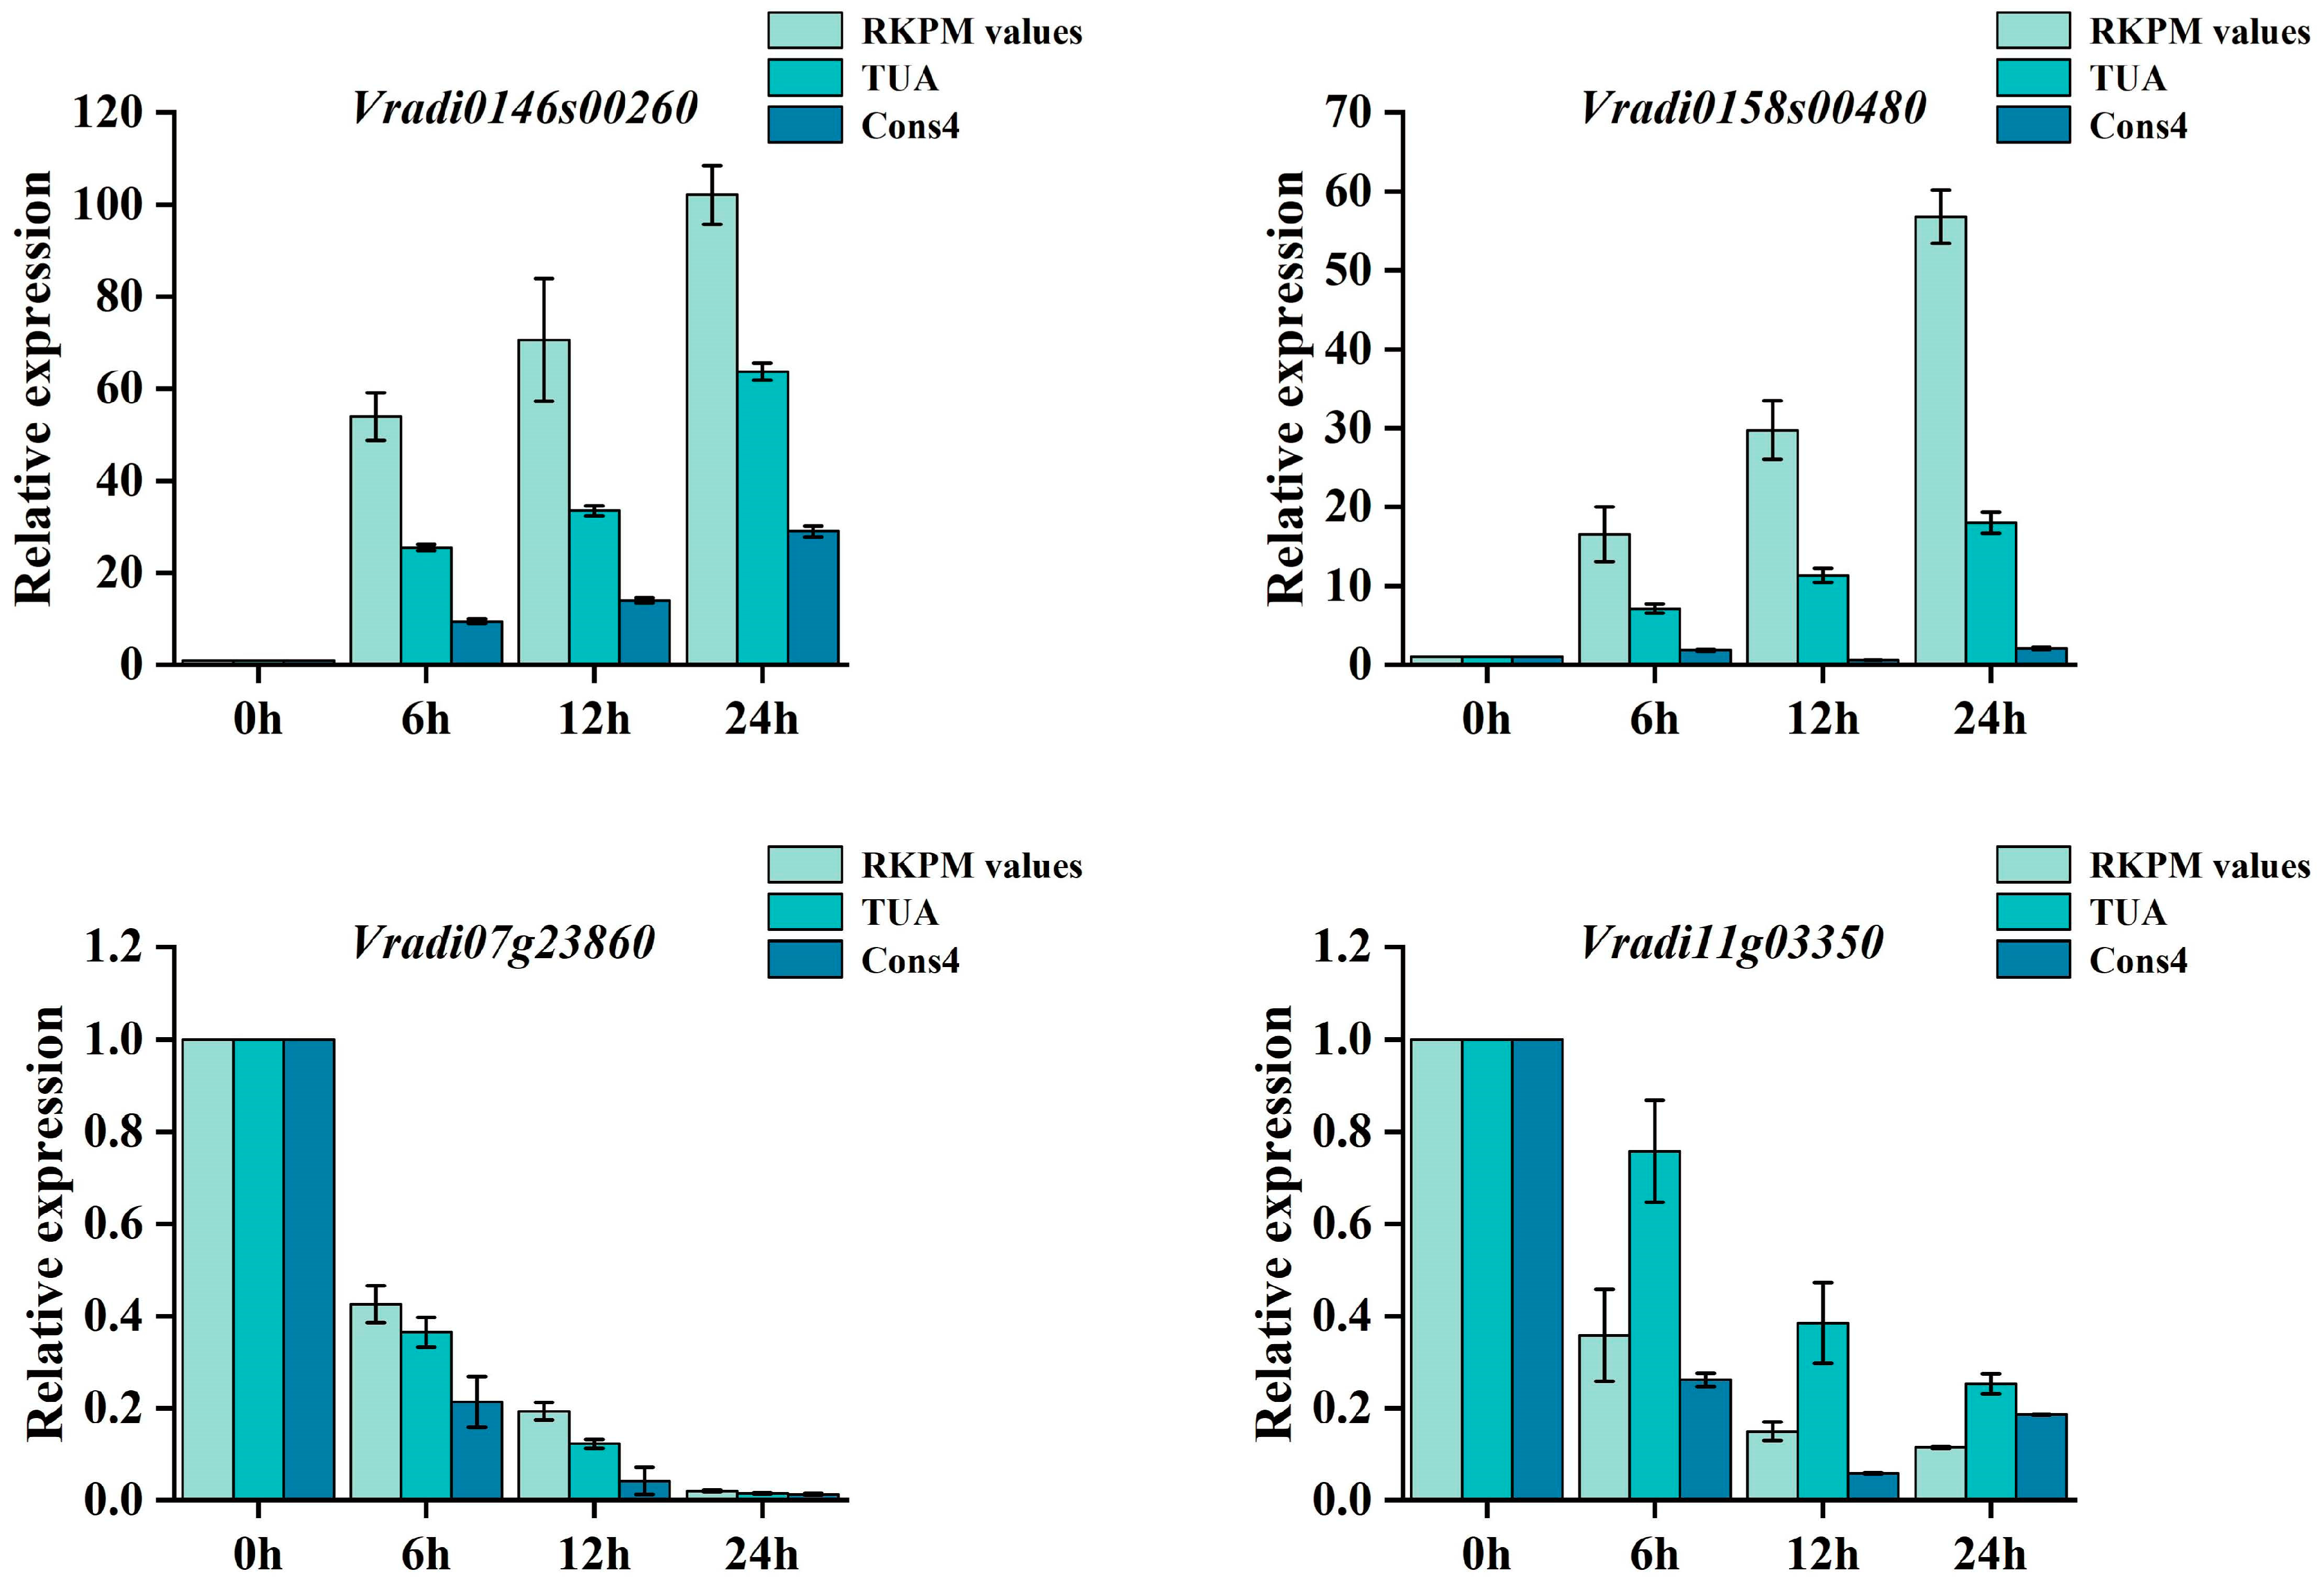
3.2. Expression Analysis of Candidate Reference Genes under Biotic Stress and Hormone Treatment

Three biological replicates were set up for the roots of mung bean treated with four soil-borne disease pathogens and five hormones at different time points. The higher the Ct value, the smaller the template concentration and the lower the gene expression. The change in Ct value between different treatments reflects the difference in gene expression between samples. In the samples from different treatments, the Ct value distribution of the six candidate reference genes was different. Under the condition of hormone treatment, the Ct value ranged from a minimum of 17.87 for EF1α to a maximum of 29.63 for GAPDH. The highest average expression among the candidate reference genes was found for EF1α, with an average Ct value of 20.74, and the lowest average expression was found for GAPDH, with an average Ct value of 27.67. In addition, the Ct value of TUB showed the largest difference, ranging from 22.60 to 27.91, with a difference of 5.30 (Figure 2a). Under the condition of pathogen infection, the Ct value ranged from a minimum of 19.43 for EF1α to a maximum of 31.82 for GAPDH. The highest average expression of candidate reference genes was found for EF1α, with an average Ct value of 22.03. The lowest average expression was found for GAPDH, with an average Ct value of 28.44. In addition, the Ct value of Cons4 was the largest, ranging from 21.89 to 28.32, with a difference of 6.43 (Figure 2b). The expression of these reference genes is unstable. Under certain conditions, appropriate reference genes must be screened.

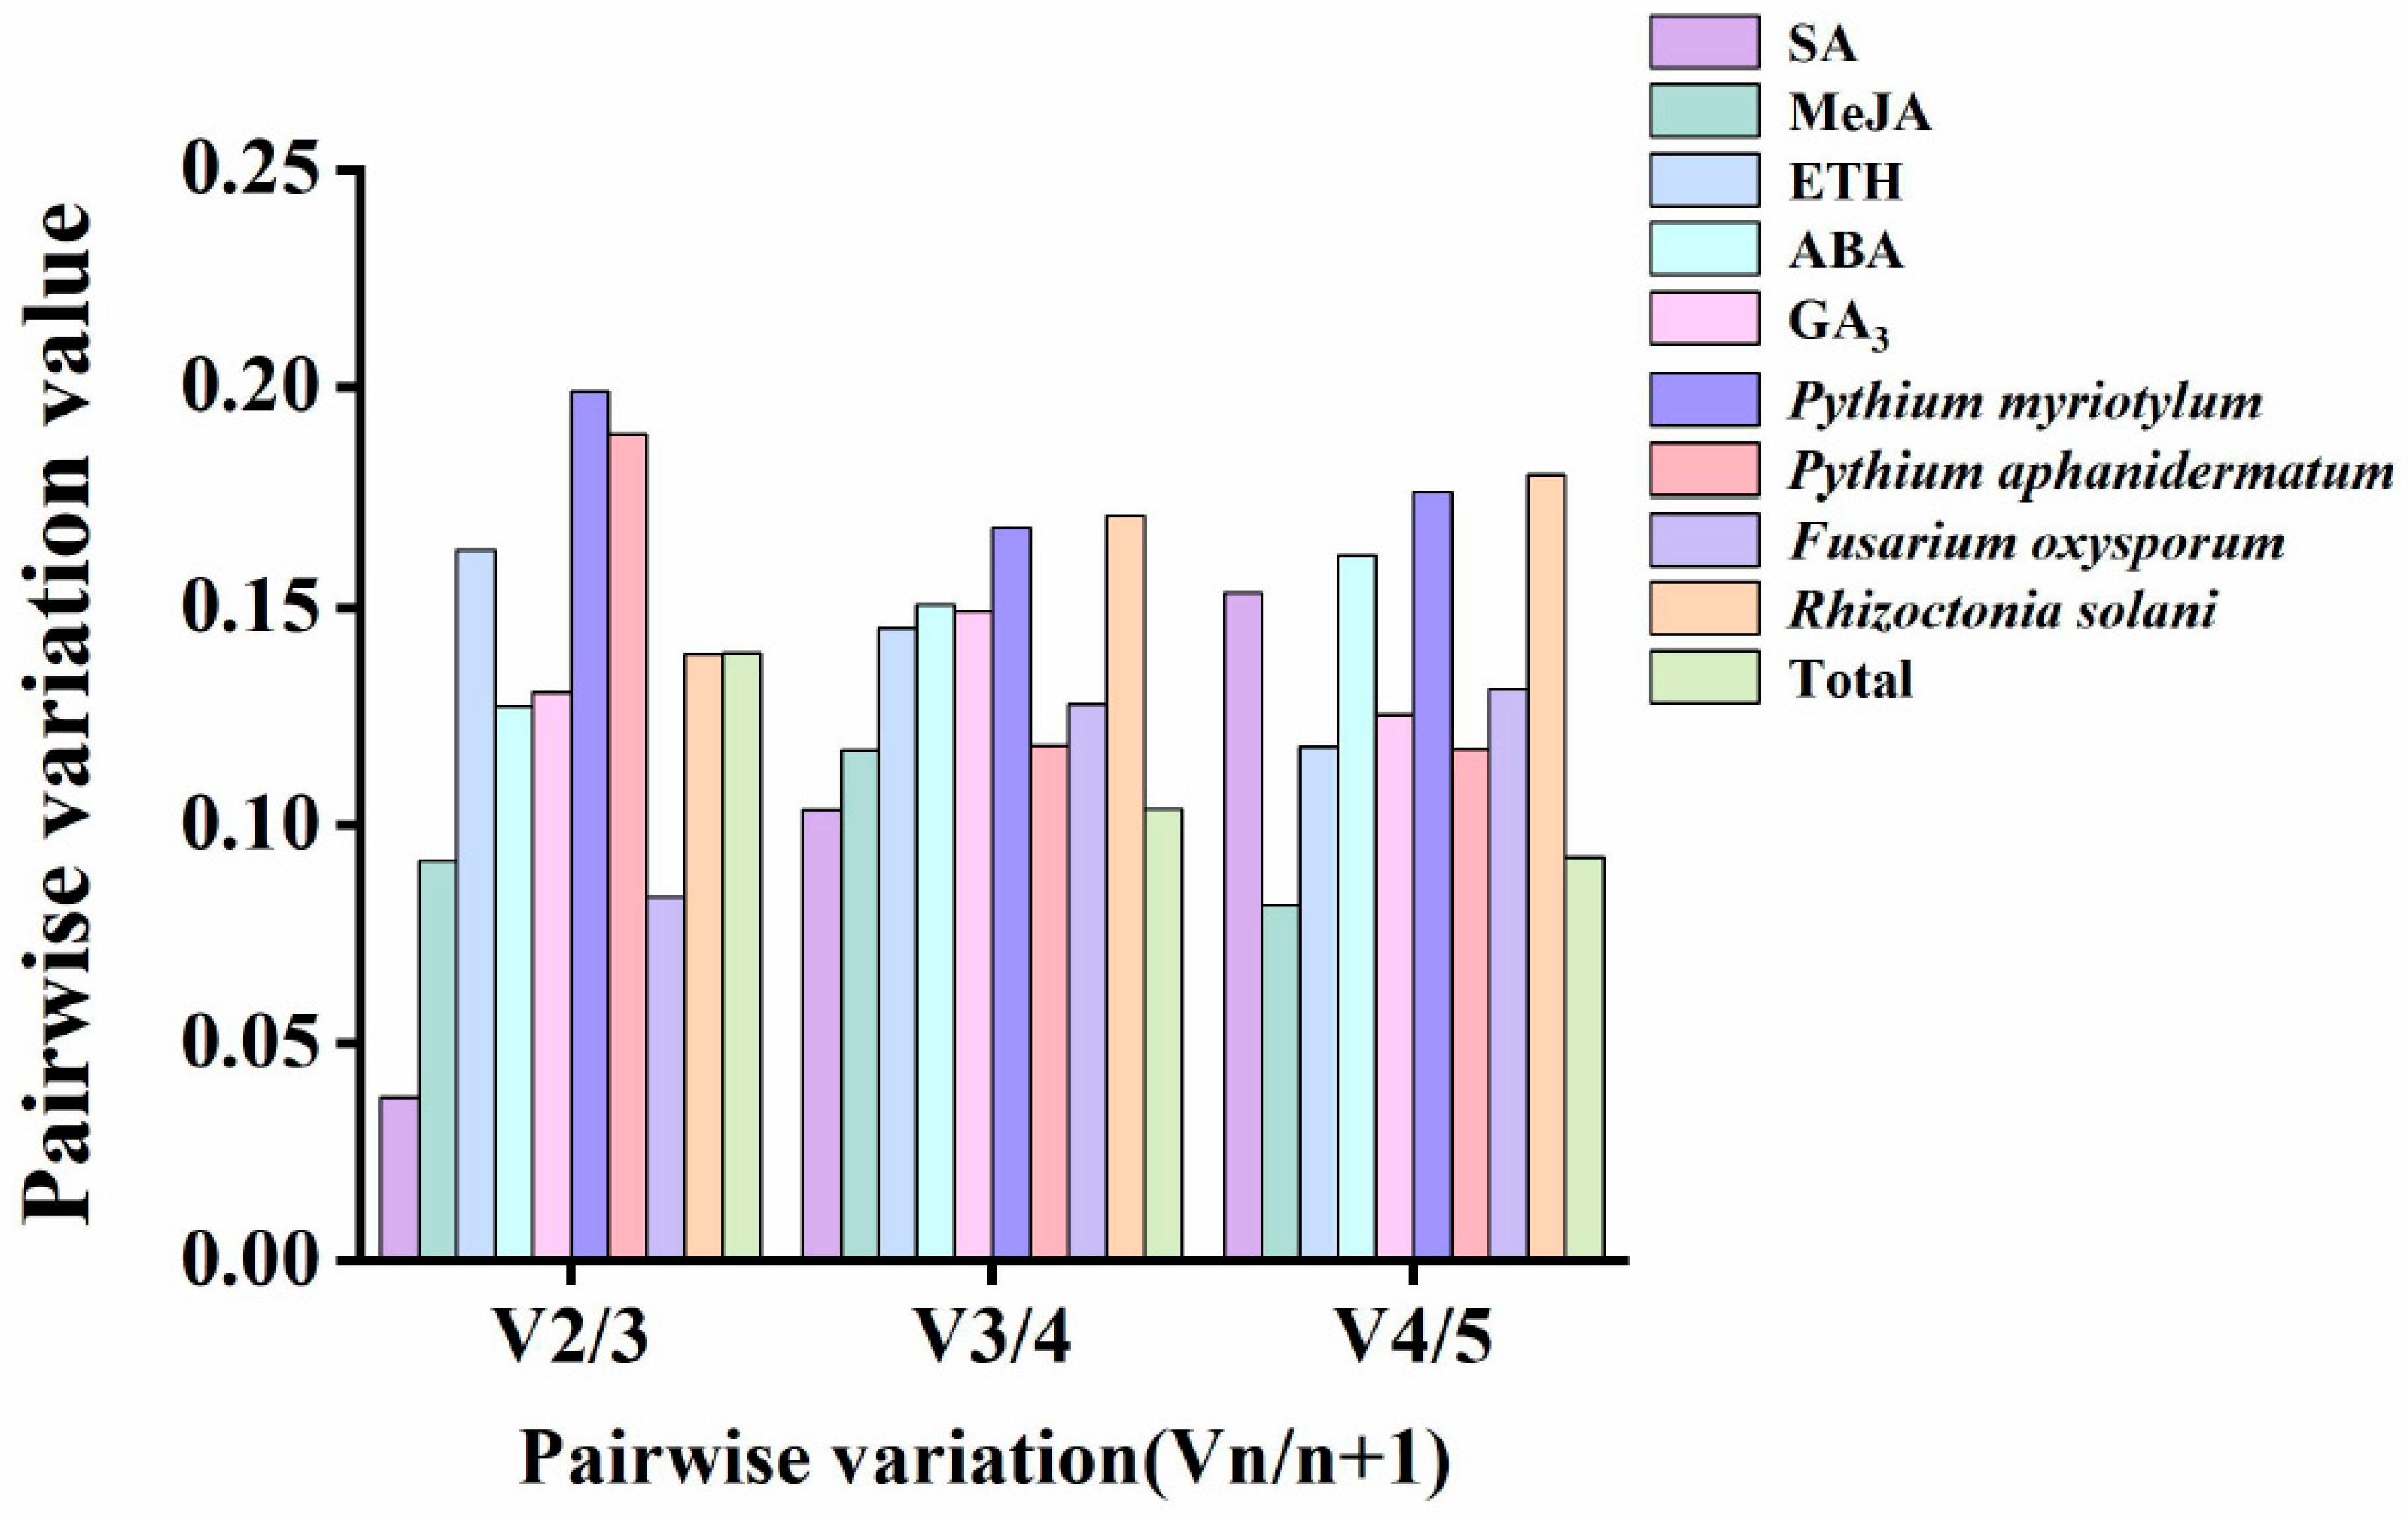
3.3. Stability Analysis of the Candidate Reference Genes

The stability value M was determined using the statistical software GeNorm, and the M values obtained under different treatments for the five internal reference genes were sorted. The smaller the M value, the more stable the expression of the internal reference gene. The M values of the five internal reference genes in this study were all available (M < 1.5). The M value of Cons4 and ACT under SA treatment was the lowest (M = 0.071), and their expression was the most stable. We found that under MeJA treatment, the expression of the ACT and TUA genes had the lowest M value (M = 0.167). Meanwhile, under ETH treatment, the expression of the ACT and TUB genes was the most stable (M = 0.403). When subjected to ABA and GA3 treatments, the expression of the ACT and EF1α genes (M = 0.197), and that of the Cons4 and EF1α genes (M = 0.410), was found to be the most stable. In terms of pathogen infection, the most stably expressed genes were ACT and TUB (M = 0.170) in P. myriotylum infection, Cons4 and TUA (M = 0.147) in P. aphanidermatum infection, ACT and TUA (M = 0.041) in F. oxysporum infection, and TUA and EF1α (M = 0.328) in R. solani infection. Overall, the analysis showed that the TUA and EF1α genes had the best stability (M = 0.411) (Figure 3).
GeNorm software can use multiple internal reference genes to analyze pairwise differences and obtain an optimal pairwise variation value (Vn/n + 1). This is the criterion for selecting the optimal number of internal reference genes. If Vn/n + 1 is less than the software default limit of 0.15, the optimal number of internal reference genes is n + 1. An internal reference gene is not required to remove differences. If it exceeds 0.15, the number of internal reference genes should be increased. Treatments with SA, MeJA, ABA, GA3, F. oxysporum, and R. solani, and a total V2/V3 of <0.15 indicate that two internal reference genes are required for proper comparison of the target gene expression data. For ETH and P. aphanidermatum treatments, V3/V4 < 0.15, so three internal reference genes are required. In the P. myriotylum treatment, V4/V5 was greater than 0.15, requiring a fifth internal reference gene to eliminate differences (Figure 4).
The NormFinder add-on for Microsoft Excel helps one choose the best gene to use as reference by calculating a stability value for how much the gene is expressed. The lower the stability value, the more stable the expression of the reference gene. We found that different genes acted as the most stable reference gene under different treatments. Specifically, under the SA and GA3 treatments, the most stable reference gene was Cons4, with stability values of 0.025 and 0.070, respectively. MeJA, ETH, and P. myriotylum treatments showed ACT to be the most stable reference gene, with stability values of 0.109, 0.122, and 0.202, respectively. EF1α was found to be the most stabile reference gene under ABA and P. aphanidermatum treatment and overall level analysis, with stability values of 0.161, 0.089, and 0.124, respectively. TUA was identified as the most stable reference gene under R. solani treatment, with a stability value of 0.114. TUB was determined to be the most stable reference gene under F. oxysporum treatment, with a stability value of 0.077 (Table 2 and Table 3).
We further analyzed the expression stability of the candidate internal reference genes by obtaining the standard deviation (SD) and coefficient of variation (CV) through BestKeeper analysis of the Ct value of the internal reference genes. The software identified TUB as the most stable reference gene under SA and MeJA treatments, while Cons4 was the most stable under ETH, ABA, and GA3 treatments (Table 4). Under treatment with P. myriotylum, P. aphanidermatum, F. oxysporum, and R. solani, TUB, ACT, TUA, and TUB, respectively, were the most stable reference genes. Overall, TUA was found to be the most stable reference gene, as indicated in Table 5.
The stability of the five candidate reference genes was analyzed using GeNorm, NormFinder, and BestKeeper, and the results were different. Therefore, the results regarding the most stable reference genes analyzed by the three software products were comprehensively evaluated using RefFinder. In the overall level analysis, the most stable internal reference gene was TUA. Under SA, ABA, GA3, and P. myriotylum treatment, the most stable reference gene was TUA. Under ETH treatment, the most stable reference gene was TUB. The most stable reference gene under MeJA and F. oxysporum treatment was ACT. EF1α was the most stable reference gene under P. aphanidermatum and R. solani treatment (Table 6).

3.4. Stability Analysis of the Candidate Reference Genes

According to the results of the RefFinder comprehensive evaluation, TUA was selected as the most stable reference gene and Cons4 was selected as the least stable reference gene. To further verify the reliability of the results, qRT-PCR analysis was performed on four selected genes (Vradi0146s00260, Vradi0158s00480, Vradi07g23860, and Vradi11g03350) with TUA and Cons4 as the internal reference genes. When the most stable reference gene (TUA) was selected, the expression levels of Vradi0146s00260, Vradi0158s00480, Vradi07g23860, and Vradi11g03350 at 6 hpi, 12 hpi, and 24 hpi showed a higher similarity to the fold change observed in the RNA-seq data. Meanwhile, the qRT-PCR trend for the four target genes was consistent with the RNA-seq data analysis results. However, the target genes’ expression levels varied greatly in the case of Cons4 (Figure 5). In conclusion, the results of the stability analysis were reliable.

4. Discussion

qRT-PCR is a powerful tool for quantitative analysis of gene expression [37]. The data obtained by qRT-PCR must be corrected using internal reference genes to increase their reliability. However, the expression of commonly used reference genes varies under different conditions in different species, which requires us to select stable reference genes according to the corresponding experimental materials and experimental conditions [38]. In this study, five candidate reference genes were found to be highly specific (Figure 1), and an expression analysis was conducted in root tissues after various biotic stresses and hormone treatments.
To assess the stability of the reference genes, we utilized four different statistical methods. The results from GeNorm and NormFinder showed similar stability rankings for the reference genes [39,40,41], while BestKeeper analysis generated different rankings. Specifically, GeNorm and NormFinder identified ACT as the most stable reference gene under MeJA, ETH, and P. myriotylum treatments (Figure 4, Table 2). However, the BestKeeper results showed that TUB and Cons4 had the most stable expression under the MeJA, ETH, and P. myriotylum treatments (Table 3). RefFinder was further used to comprehensively evaluate the ranking results of the first three software products. The findings revealed that TUA exhibited the highest stability in the overall level analysis and in SA, ABA, GA3, and P. myriotylum treatment. TUA has a number of important functions. It not only is an important component of the cytoskeleton but also participates in various life activities, such as intracellular material transportation and shape maintenance. Previous studies have shown that TUA can serve as a suitable reference gene for various stages of female flower bud differentiation in Juglans regia [42], somatic embryogenesis (SE) in Liriodendron chinense [43], and abiotic stress in Diospyros kaki Thunb [44]. Our results also showed that ACT can be used as a reference gene in the root of mung bean under MeJA treatments, and it has been shown to serve as a reference gene in Vigna angularis under biotic stresses and as a reference gene in Glycyrrhiza adapted to abiotic stresses [45]. However, in Cucurbitaceae, TUA was found to be the most unstable reference gene under oxidative stresses and plant growth regulators [46].At the same time, ACT is not suitable as an internal reference gene under biotic stress in maize and sunflower [29]. Therefore, it is evident that there is no ideal reference gene that can be used for all experiments. To verify the reliability of the selected candidate reference genes, we selected four genes that responded severely after P. myriotylum infection based on transcriptome data. Among them, Vradi0146s00260 and Vradi0158s00480 are members of the WRKY family, and their expression was upregulated during P. myriotylum infection. On the other hand, Vradi07g23860 and Vradi11g03350 belong to the JAZ family, and their expression was downregulated during P. myriotylum infection. According to previous research, WRKY transcription factors can regulate a variety of plant biological process signal networks such as salicylic acid (SA), ethylene (ET), and jasmonic acid (JA) [47,48]. The jasmonate ZIM-domain (JAZ) protein is an important negative regulator in the JA signaling pathway [49,50]. WRKY and JAZ play an important role in plant defense response. MdWRKY75e overexpression strengthens the resistance to Alternaria alternata, mainly via the jasmonic acid (JA) signaling pathway [48]. Additionally, SlWRKY30 decreases the severity of Ralstonia solanacearum infection (RSI)-induced bacterial wilt in tomato, increased H2O2 accumulation and cell necrosis, and it was a positive regulator of RSI in tomato [51]. Silencing of JAZ1/2 en-hances soybean resistance against Phytophthora sojae [50]. We further used the most stable reference gene (TUA) and the least stable reference gene (Cons4) to standardize the relative expression levels of the Vradi0146s00260, Vradi0158s00480, Vradi07g23860, and Vradi11g03350 genes under P. myriotylum infection. The results showed that the expression levels of the target genes were in general agreement with the RNA-seq data when we selected TUA as the reference gene.

5. Conclusions

Our study showed that the expression stability varied among the five candidate reference genes under various biotic stresses and hormone treatments. An analysis using four programs (GeNorm, NormFinder, BestKeeper, and RefFinder) showed that TUA was the best reference gene for qRT-PCR analysis. ACT was the most stable reference gene under MeJA and F. oxysporum treatment. EF1α was identified as the most stable reference gene under P. aphanidermatum and R. solani treatments. The findings of this study can be used as a valuable reference for selecting appropriate internal reference genes when studying resistance genes under mung bean root rot infection conditions. Furthermore, this study provides a strong basis for future research on the role of mung bean root rot resistance-related genes in the defense response against P. myriotylum.

Author Contributions

Conceptualization, D.X. and Q.Y.; methodology, Y.Z. (Yanyan Zhou); software, Y.Z. (Yanyan Zhou); validation, H.L., T.W., Y.Z. (Yu Zheng), Y.Z. (Yanyan Zhou) and R.W.; formal analysis, Y.Z. (Yanyan Zhou); investigation, H.L.; resources, Q.Y.; data curation, Y.Z. (Yanyan Zhou); writing—original draft preparation, Y.Z. (Yanyan Zhou); writing—review and editing, Q.Y.; visualization, H.L.; supervision, X.C.; project administration, X.Y.; funding acquisition, X.C. All authors have read and agreed to the published version of the manuscript.

Funding

This research was funded by National Key R&D Program of China (2019YFE0109100), the China Agriculture Research System—Food Legumes (CARS08-G15) and the Jiangsu Seed Industry Revitalization Project (JBGS [2021]004).

Institutional Review Board Statement

Not applicable.

Informed Consent Statement

Not applicable.

Data Availability Statement

Not applicable.

Conflicts of Interest

The authors declare no conflict of interest.

References

  1. Kim, S.K.; Nair, R.M.; Lee, J.; Lee, S.-H. Genomic resources in mung bean for future breeding programs. Front. Plant Sci. 2015, 6, 626. [Google Scholar] [CrossRef]
  2. Kang, Y.J.; Kim, S.K.; Kim, M.Y.; Lestari, P.; Kim, K.H.; Ha, B.-K.; Jun, T.H.; Hwang, W.J.; Lee, T.; Lee, J.; et al. Genome sequence of mung bean and insights into evolution within Vigna species. Nat. Commun. 2014, 5, 5443. [Google Scholar] [CrossRef] [PubMed]
  3. Rossman, D.R.; Rojas, A.; Jacobs, J.L.; Mukankusi, C.; Kelly, J.D.; Chilvers, M.I. Pathogenicity and virulence of soilborne oomycetes on Phaseolus vulgaris. Plant Dis. 2017, 101, 1851–1859. [Google Scholar] [CrossRef] [PubMed]
  4. Yan, Q.; Zhang, Q.; Ding, P.; Yuan, X.; Wu, R.; Chen, J.; Xue, C.; Chen, X. First Report of root rot on mung bean caused by Pythium myriotylum in China. Plant Dis. 2021, 105, 233. [Google Scholar] [CrossRef]
  5. Yan, Q.; Hu, Y.; Zhang, Q.; Yuan, X.; Wu, R.; Chen, J.; Xue, C.; Chen, X. Occurrence of Root Rot Caused by Pythium aphanidermatum on mung bean (Vigna radiata) in China. Plant Dis. 2021, 105, 3764. [Google Scholar] [CrossRef]
  6. Kamoun, S.; Furzer, O.; Jones, J.D.G.; Judelson, H.S.; Ali, G.S.; Dalio, R.J.D.; Roy, S.G.; Schena, L.; Zambounis, A.; Panabières, F.; et al. The Top 10 oomycete pathogens in molecular plant pathology. Mol. Plant Pathol. 2015, 16, 413–434. [Google Scholar] [CrossRef]
  7. Kharshandi, F.; Kayang, H. Antagonistic Potential of rhizobacterial isolates against fungal pathogens causing rhizome rot in turmeric. Arch. Microbiol. 2023, 205, 221. [Google Scholar] [CrossRef]
  8. Chenniappan, C.; Daniel, G.; Ponmurugan, P.; Narayanasamy, M. Association of multiple fungal pathogens to rhizome rot disease of turmeric. Arch. Phytopathol. Plant Prot. 2020, 53, 440–458. [Google Scholar] [CrossRef]
  9. Akber, M.A.; Mubeen, M.; Sohail, M.A.; Khan, S.W.; Solanki, M.K.; Khalid, R.; Abbas, A.; Divvela, P.K.; Zhou, L. Global Distribution, Traditional and modern detection, diagnostic, and management approaches of Rhizoctonia solani associated with legume crops. Front. Microbiol. 2022, 13, 1091288. [Google Scholar] [CrossRef]
  10. Cao, W.; Zhang, H.; Zhou, Y.; Zhao, J.; Lu, S.; Wang, X.; Chen, X.; Yuan, L.; Guan, H.; Wang, G.; et al. Suppressing chlorophyll degradation by silencing OsNYC3 improves rice resistance to Rhizoctonia solani, the causal agent of sheath blight. Plant Biotechnol. J. 2022, 20, 335–349. [Google Scholar] [CrossRef]
  11. Molla, K.A.; Karmakar, S.; Molla, J.; Bajaj, P.; Varshney, R.K.; Datta, S.K.; Datta, K. Understanding sheath blight resistance in rice: The road behind and the road ahead. Plant Biotechnol. J. 2020, 18, 895–915. [Google Scholar] [CrossRef] [PubMed]
  12. Arora, H.; Sharma, A.; Poczai, P.; Sharma, S.; Haron, F.F.; Gafur, A.; Sayyed, R.Z. Plant-derived protectants in combating soil-borne fungal infections in tomato and chilli. J. Fungi 2022, 8, 213. [Google Scholar] [CrossRef] [PubMed]
  13. Mageshwaran, V.; Gupta, R.; Singh, S.; Sahu, P.K.; Singh, U.B.; Chakdar, H.; Bagul, S.Y.; Paul, S.; Singh, H.V. Endophytic bacillus subtilis antagonize soil-borne fungal pathogens and suppress wilt complex disease in chickpea plants (Cicer arietinum L.). Front. Microbiol. 2022, 13, 994847. [Google Scholar] [CrossRef]
  14. Zhou, L.; Mideros, S.X.; Bao, L.; Hanlon, R.; Arredondo, F.D.; Tripathy, S.; Krampis, K.; Jerauld, A.; Evans, C.; St Martin, S.K.; et al. Infection and genotype remodel the entire soybean transcriptome. BMC Genom. 2009, 10, 49. [Google Scholar] [CrossRef]
  15. Bachmann, A.; Lavstsen, T. Analysis of var gene transcript patterns by quantitative real-time PCR. Methods Mol. Biol. 2022, 2470, 149–171. [Google Scholar] [CrossRef]
  16. Gao, K.; Khan, W.U.; Li, J.; Huang, S.; Yang, X.; Guo, T.; Guo, B.; Wu, R.; An, X. Identification and validation of reliable reference genes for gene expression studies in Koelreuteria paniculata. Genes 2022, 13, 714. [Google Scholar] [CrossRef]
  17. Tian, Y.; Chu, Z.; Wang, H.; Wang, G.; Wu, S.; Yang, Y. Selection and validation of reference genes for quantitative real-time PCR in Cymbidium sinense. Biotechniques 2022, 72, 51–59. [Google Scholar] [CrossRef]
  18. Zhao, J.; Yang, J.; Wang, X.; Xiong, Y.; Xiong, Y.; Dong, Z.; Lei, X.; Yan, L.; Ma, X. Selection and validation of reference genes for qRT-PCR gene expression analysis in Kengyilia melanthera. Genes 2022, 13, 1445. [Google Scholar] [CrossRef]
  19. Chen, Z.; Halford, N.G.; Liu, C. Real-time quantitative PCR: Primer design, reference gene selection, calculations and statistics. Metabolites 2023, 13, 806. [Google Scholar] [CrossRef]
  20. Wang, W.; Hu, S.; Cao, Y.; Chen, R.; Wang, Z.; Cao, X. Selection and evaluation of reference genes for qRT-PCR of Scutellaria baicalensis Georgi under different experimental conditions. Mol. Biol. Rep. 2021, 48, 1115–1126. [Google Scholar] [CrossRef]
  21. Song, H.; Mao, W.; Duan, Z.; Que, Q.; Zhou, W.; Chen, X.; Li, P. Selection and validation of reference genes for measuring gene expression in Toona ciliata under different experimental conditions by quantitative real-time PCR analysis. BMC Plant Biol. 2020, 20, 450. [Google Scholar] [CrossRef] [PubMed]
  22. Jiang, Y.; Jin, H.; Li, X.; Yan, D.; Zhang, Y.; Li, M.; Gao, J.; Lu, B.; Chen, C.; Jiang, Y. Development of a novel real-time quantitative PCR method for detection of Ilyonectria robusta, the predominant species causing ginseng rusty root rot. Plant Dis. 2023, 107, 1680–1689. [Google Scholar] [CrossRef]
  23. Thellin, O.; Zorzi, W.; Lakaye, B.; De Borman, B.; Coumans, B.; Hennen, G.; Grisar, T.; Igout, A.; Heinen, E. Housekeeping genes as internal standards: Use and limits. J. Biotechnol. 1999, 75, 291–295. [Google Scholar] [CrossRef] [PubMed]
  24. Sinha, P.; Saxena, R.K.; Singh, V.K.; Krishnamurthy, L.; Varshney, R.K. Selection and validation of housekeeping genes as reference for gene expression studies in Pigeonpea (Cajanus cajan) under heat and salt stress conditions. Front. Plant Sci. 2015, 6, 1071. [Google Scholar] [CrossRef] [PubMed]
  25. Nicot, N.; Hausman, J.-F.; Hoffmann, L.; Evers, D. Housekeeping gene selection for real-time RT-PCR normalization in potato during biotic and abiotic stress. J. Exp. Bot. 2005, 56, 2907–2914. [Google Scholar] [CrossRef]
  26. Jian, B.; Liu, B.; Bi, Y.; Hou, W.; Wu, C.; Han, T. Validation of internal control for gene expression study in soybean by quantitative real-time PCR. BMC Mol. Biol. 2008, 9, 59. [Google Scholar] [CrossRef]
  27. Czechowski, T.; Stitt, M.; Altmann, T.; Udvardi, M.K.; Scheible, W.-R. Genome-wide identification and testing of superior reference genes for transcript normalization in Arabidopsis. Plant Physiol. 2005, 139, 5–17. [Google Scholar] [CrossRef]
  28. Gao, M.; Liu, Y.; Ma, X.; Shuai, Q.; Gai, J.; Li, Y. Evaluation of reference genes for normalization of gene expression using quantitative RT-PCR under aluminum, cadmium, and heat stresses in soybean. PLoS ONE 2017, 12, e0168965. [Google Scholar] [CrossRef]
  29. Liu, Y.; Liu, J.; Xu, L.; Lai, H.; Chen, Y.; Yang, Z.; Huang, B. Identification and validation of reference genes for seashore paspalum response to abiotic stresses. Int. J. Mol. Sci. 2017, 18, 1322. [Google Scholar] [CrossRef]
  30. Chi, C.; Shen, Y.; Yin, L.; Ke, X.; Han, D.; Zuo, Y. Selection and validation of reference genes for gene expression analysis in Vigna angularis using quantitative real-time RT-PCR. PLoS ONE 2016, 11, e0168479. [Google Scholar] [CrossRef]
  31. de Jesus Miranda, V.; Coelho, R.R.; Viana, A.A.B.; de Oliveira Neto, O.B.; Carneiro, R.M.D.G.; Rocha, T.L.; de Sa, M.F.G.; Fragoso, R.R. Validation of reference genes aiming accurate normalization of qPCR data in soybean upon nematode parasitism and insect attack. BMC Res. Notes 2013, 6, 196. [Google Scholar] [CrossRef]
  32. Vandesompele, J.; De Preter, K.; Pattyn, F.; Poppe, B.; Van Roy, N.; De Paepe, A.; Speleman, F. Accurate normalization of real-time quantitative RT-PCR data by geometric averaging of multiple internal control genes. Genome Biol. 2002, 3, research0034.1. [Google Scholar] [CrossRef] [PubMed]
  33. Andersen, C.L.; Jensen, J.L.; Ørntoft, T.F. Normalization of real-time quantitative reverse transcription-PCR data: A model-based variance estimation approach to identify genes suited for normalization, applied to bladder and colon cancer data sets. Cancer Res. 2004, 64, 5245–5250. [Google Scholar] [CrossRef] [PubMed]
  34. Pfaffl, M.W.; Tichopad, A.; Prgomet, C.; Neuvians, T.P. Determination of stable housekeeping genes, differentially regulated target genes and sample integrity: BestKeeper--Excel-based tool using pair-wise correlations. Biotechnol. Lett. 2004, 26, 509–515. [Google Scholar] [CrossRef]
  35. Xie, F.; Xiao, P.; Chen, D.; Xu, L.; Zhang, B. MiRDeepFinder: A miRNA analysis tool for deep sequencing of plant small RNAs. Plant Mol. Biol. 2012, 80, 75–84. [Google Scholar] [CrossRef]
  36. Qian, M.; Yang, N.; Zhu, C.; Xia, Y. Selection and validation of reference genes for real-time fluorescence quantitative PCR in mung beans. Plant Physiol. J. 2021, 57, 2203–2212. [Google Scholar] [CrossRef]
  37. Yang, J.; Yang, X.; Kuang, Z.; Li, B.; Lu, X.; Cao, X.; Kang, J. Selection of suitable reference genes for qRT-PCR expression analysis of Codonopsis pilosula under different experimental conditions. Mol. Biol. Rep. 2020, 47, 4169–4181. [Google Scholar] [CrossRef]
  38. Nolan, T.; Hands, R.E.; Bustin, S.A. Quantification of mRNA using real-time RT-PCR. Nat. Protoc. 2006, 1, 1559–1582. [Google Scholar] [CrossRef]
  39. Li, L.; Wang, K.; Zhao, M.; Li, S.; Jiang, Y.; Zhu, L.; Chen, J.; Wang, Y.; Sun, C.; Chen, P.; et al. Selection and validation of reference genes desirable for gene expression analysis by qRT-PCR in MeJA-treated ginseng hairy roots. PLoS ONE 2019, 14, e0226168. [Google Scholar] [CrossRef]
  40. Chen, X.; Mao, Y.; Huang, S.; Ni, J.; Lu, W.; Hou, J.; Wang, Y.; Zhao, W.; Li, M.; Wang, Q.; et al. Selection of suitable reference genes for quantitative real-time PCR in Sapium sebiferum. Front. Plant Sci. 2017, 8, 637. [Google Scholar] [CrossRef]
  41. Wang, G.; Tian, C.; Wang, Y.; Wan, F.; Hu, L.; Xiong, A.; Tian, J. Selection of reliable reference genes for quantitative RT-PCR in Garlic under salt stress. PeerJ 2019, 7, e7319. [Google Scholar] [CrossRef] [PubMed]
  42. Zhou, L.; Niu, J.; Quan, S. Identification of appropriate reference genes for RT-qPCR analysis in Juglans regia L. PLoS ONE 2018, 13, e0209424. [Google Scholar] [CrossRef]
  43. Li, T.; Yuan, W.; Qiu, S.; Shi, J. Selection of reference genes for gene expression analysis in Liriodendron hybrids’ somatic embryogenesis and germinative tissues. Sci. Rep. 2021, 11, 4957. [Google Scholar] [CrossRef] [PubMed]
  44. Wang, P.; Xiong, A.; Gao, Z.; Yu, X.; Li, M.; Hou, Y.; Sun, C.; Qu, S. Selection of suitable reference genes for RT-qPCR normalization under abiotic stresses and hormone stimulation in Persimmon (Diospyros kaki Thunb). PLoS ONE 2016, 11, e0160885. [Google Scholar] [CrossRef] [PubMed]
  45. Li, Y.; Liang, X.; Zhou, X.; Wu, Z.; Yuan, L.; Wang, Y.; Li, Y. Selection of reference genes for qRT-PCR analysis in medicinal plant Glycyrrhiza under abiotic stresses and hormonal treatments. Plants 2020, 9, 1441. [Google Scholar] [CrossRef]
  46. Migocka, M.; Papierniak, A. Identification of suitable reference genes for studying gene expression in cucumber plants subjected to abiotic stress and growth regulators. Mol. Breed. 2011, 28, 343–357. [Google Scholar] [CrossRef]
  47. Abdullah-Zawawi, M.-R.; Ahmad-Nizammuddin, N.-F.; Govender, N.; Harun, S.; Mohd-Assaad, N.; Mohamed-Hussein, Z.-A. Comparative genome-wide analysis of WRKY, MADS-Box and MYB transcription factor families in Arabidopsis and rice. Sci. Rep. 2021, 11, 19678. [Google Scholar] [CrossRef]
  48. Hou, Y.; Yu, X.; Chen, W.; Zhuang, W.; Wang, S.; Sun, C.; Cao, L.; Zhou, T.; Qu, S. MdWRKY75e enhances resistance to Alternaria alternata in Malus domestica. Hortic. Res. 2021, 8, 225. [Google Scholar] [CrossRef]
  49. Sun, Y.; Liu, C.; Liu, Z.; Zhao, T.; Jiang, J.; Li, J.; Xu, X.; Yang, H. Genome-wide identification, characterization and expression analysis of the JAZ gene family in resistance to gray leaf spots in tomato. Int. J. Mol. Sci. 2021, 22, 9974. [Google Scholar] [CrossRef]
  50. Zhao, Y.; Yang, B.; Xu, H.; Wu, J.; Xu, Z.; Wang, Y. The Phytophthora effector Avh94 manipulates host jasmonic acid signaling to promote infection. J. Integr. Plant Biol. 2022, 64, 2199–2210. [Google Scholar] [CrossRef]
  51. Dang, F.; Lin, J.; Li, Y.; Jiang, R.; Fang, Y.; Ding, F.; He, S.; Wang, Y. SlWRKY30 and SlWRKY81 synergistically modulate tomato immunity to Ralstonia solanacearum by directly regulating SlPR-STH2. Hortic. Res. 2023, 10, uhad050. [Google Scholar] [CrossRef] [PubMed]
Figure 1. Primer specificity of candidate reference genes. (a) The primer specificity of candidate reference genes was detected by agarose electrophoresis; (b) melting curve of qRT-PCR for candidate internal reference genes in mung bean.
Genes 14 01739 g001aGenes 14 01739 g001b
Figure 2. Ct value ranking of candidate internal reference genes (a) in hormone-treated samples and (b) in biotic stress samples. The boxes indicate the 25th and 75th percentiles. Error bars represent maximum and minimum values. The line across each box indicates the median.
Genes 14 01739 g002
Figure 3. The average expression stability values (M) of the candidate internal reference genes were analyzed and ranked by GeNorm calculation. (a) Five hormone treatments (100 μM SA, 50 μM MeJA, 1 mM ETH, 50 μM ABA, 50 μM GA3); (b) four soil-borne disease pathogen treatments (P. myriotylum, P. aphanidermatum, F. oxysporum, and R. solani); (c) overall analysis of the results of the nine treatments. A lower average expression stability (M value) indicates more stable expression.
Genes 14 01739 g003
Figure 4. Pairwise variation (V) of candidate internal reference genes.
Genes 14 01739 g004
Figure 5. Relative expression of genes at different time points after treatments of P myriotylum normalized to the expression of the most stable reference gene (TUA) and least stable reference gene (Cons4). The error bar indicates the standard error.
Genes 14 01739 g005
Table 1. Information on the candidate reference genes for mung bean and their amplicon characteristics.
Gene NameGene IDPrimer Sequence F/R (5′-3′)Amplicon Length (bp)Tm (°C)Efficiency (%)R2
Cons4Vradi11g01010F:TCGCCAGATATTGCAGATAA15681.24104.430.996
R:GGAGGAACAGTAGAAAGGGT
ACTVradi03g00210F:GGCGGTGTTCCCTAGCATTG24685.5995.960.999
R:AGCGGTGCCTCGGTAAGAAG
TUAVradi08g19840F:GGTCAAATGCCAAGTGACAAAACAG15085.2197.3920.998
R:GTAAGGTCCAGTCCTAACCTCATCG
TUBVradi05g13910F:GCTTATGGATCTTGAACCTGGAA13685.1197.8690.997
R:GCCTTCGGTATAATGACCTTTCG
GADPHVradi0043s00410F:CGTTTTCACCCCTTTTCCG25885.06113.7810.983
R:CGTGATGCTTCCAGTGTCCG
EF1αVradi01g08330F:AGCGTGAAAGAGGAATTACCATCG15382.6598.0950.999
R:CAATAATAAGGACAGCACAATCAG
Table 2. Analysis and ranking, using NormFinder, of the expression stability values of candidate internal reference genes under five hormone treatments.
Gene NameSAMeJAETHABAGA3
Stability ValueRank Stability ValueRank Stability ValueRank Stability ValueRank Stability ValueRank
Cons40.02467653310.22222187630.38452994150.25934448430.0699605041
ACT0.02467653320.10924204210.12237725410.33350500440.4130259315
TUA0.03789454930.14767141620.33975766530.21139467120.1764622682
TUB0.37723680740.25328002840.28765831720.54749839550.3792572354
EF1α0.52570688350.26609432750.37028405340.16075249810.3329454383
Table 3. Analysis and ranking, using NormFinder, of the expression stability value and the overall level stability values of candidate internal reference genes under four soil-borne disease pathogen treatments.
Gene NamePythium myriotylumPythium aphanidermatumFusarium oxysporumRhizoctonia solaniTotal
Stability ValueRank Stability ValueRank Stability ValueRank Stability ValueRank Stability ValueRank
Cons40.59063882150.30976103830.44461504250.6068004250.2317318884
ACT0.20203691810.38761498850.25170082840.53043702540.2995572875
TUA0.44540260740.33795177640.23560177330.11378925410.2478032213
TUB0.27485050530.18415825620.07671081110.31656875730.2850543432
EF1α0.25385719920.08887401410.16878601520.11378925420.1240833361
Table 4. Analysis of the expression stability of candidate reference genes under five hormone treatments according to BestKeeper. CV: coefficient of variation; SD: standard deviation.
Gene NameSAMeJAETHABAGA3
CVSDRankCVSDRankCVSDRankCVSDRankCVSDRank
Cons43.70.8643.470.7953.070.7314.51.0714.921.151
ACT3.740.8331.950.4224.51.0224.991.1323.670.822
TUA3.380.7722.520.5635.321.2646.491.5535.731.353
TUB2.040.4811.370.3114.741.1737.361.8555.061.215
EF1α6.371.2654.090.7847.711.5558.181.6747.271.454
Table 5. Analysis of the expression stability and the overall level stability of candidate internal reference genes under four soil-borne disease pathogen treatments, according to BestKeeper. CV: coefficient of variation; SD: standard deviation.
Gene NamePythium myriotylumPythium aphanidermatumFusarium oxysporumRhizoctonia solaniTotal
CVSDRankCVSDRankCVSDRankCVSDRankCVSDRank
Cons45.381.3554.641.0944.551.255.531.4545.891.445
ACT2.450.5622.670.612.520.6226.581.6654.481.041
TUA3.490.8635.021.2152.30.614.551.235.721.413
TUB1.720.4513.860.9732.440.6533.250.9215.551.424
EF1α4.731.0443.560.7324.220.9744.941.1225.71.222
Table 6. Comprehensive ranking of candidate reference gene stability analyzed using RefFinder.
RankHormone Induction Biotic Stress
SAMeJAETHABAGA3Pythium myriotylumPythium aphanidermatumFusarium oxysporumRhizoctonia solaniTotal
1TUAACTTUBTUATUATUAEF1αACTEF1αTUA
2TUBTUBACTEF1αTUBEF1αCons4TUATUAEF1α
3ACTTUAEF1αTUBACTTUBTUBEF1αTUBACT
4EF1αEF1αTUACons4EF1αACTTUACons4Cons4TUB
5Cons4Cons4Cons4ACTCons4Cons4ACTTUBACTCons4
Disclaimer/Publisher’s Note: The statements, opinions and data contained in all publications are solely those of the individual author(s) and contributor(s) and not of MDPI and/or the editor(s). MDPI and/or the editor(s) disclaim responsibility for any injury to people or property resulting from any ideas, methods, instructions or products referred to in the content.

