
Enhancing Transcriptional Reprogramming of Mesenchymal Glioblastoma with Grainyhead-like 2 and HDAC Inhibitors Leads to Apoptosis and Cell-Cycle Dysregulation

Abstract
:1. Introduction
2. Materials and Methods
2.1. Cell Culture
2.2. Generation of Cell Lines via Lentiviral Transduction
2.3. Cell Lysis and Immunoblots
2.4. Annexin V Flow Cytometry
2.5. Cell-Cycle Analysis by Flow Cytometry
2.6. Rapid Immunoprecipitation and Mass Spectrometry of Endogenous Proteins (RIME)
2.7. Immunofluorescence
3. Results
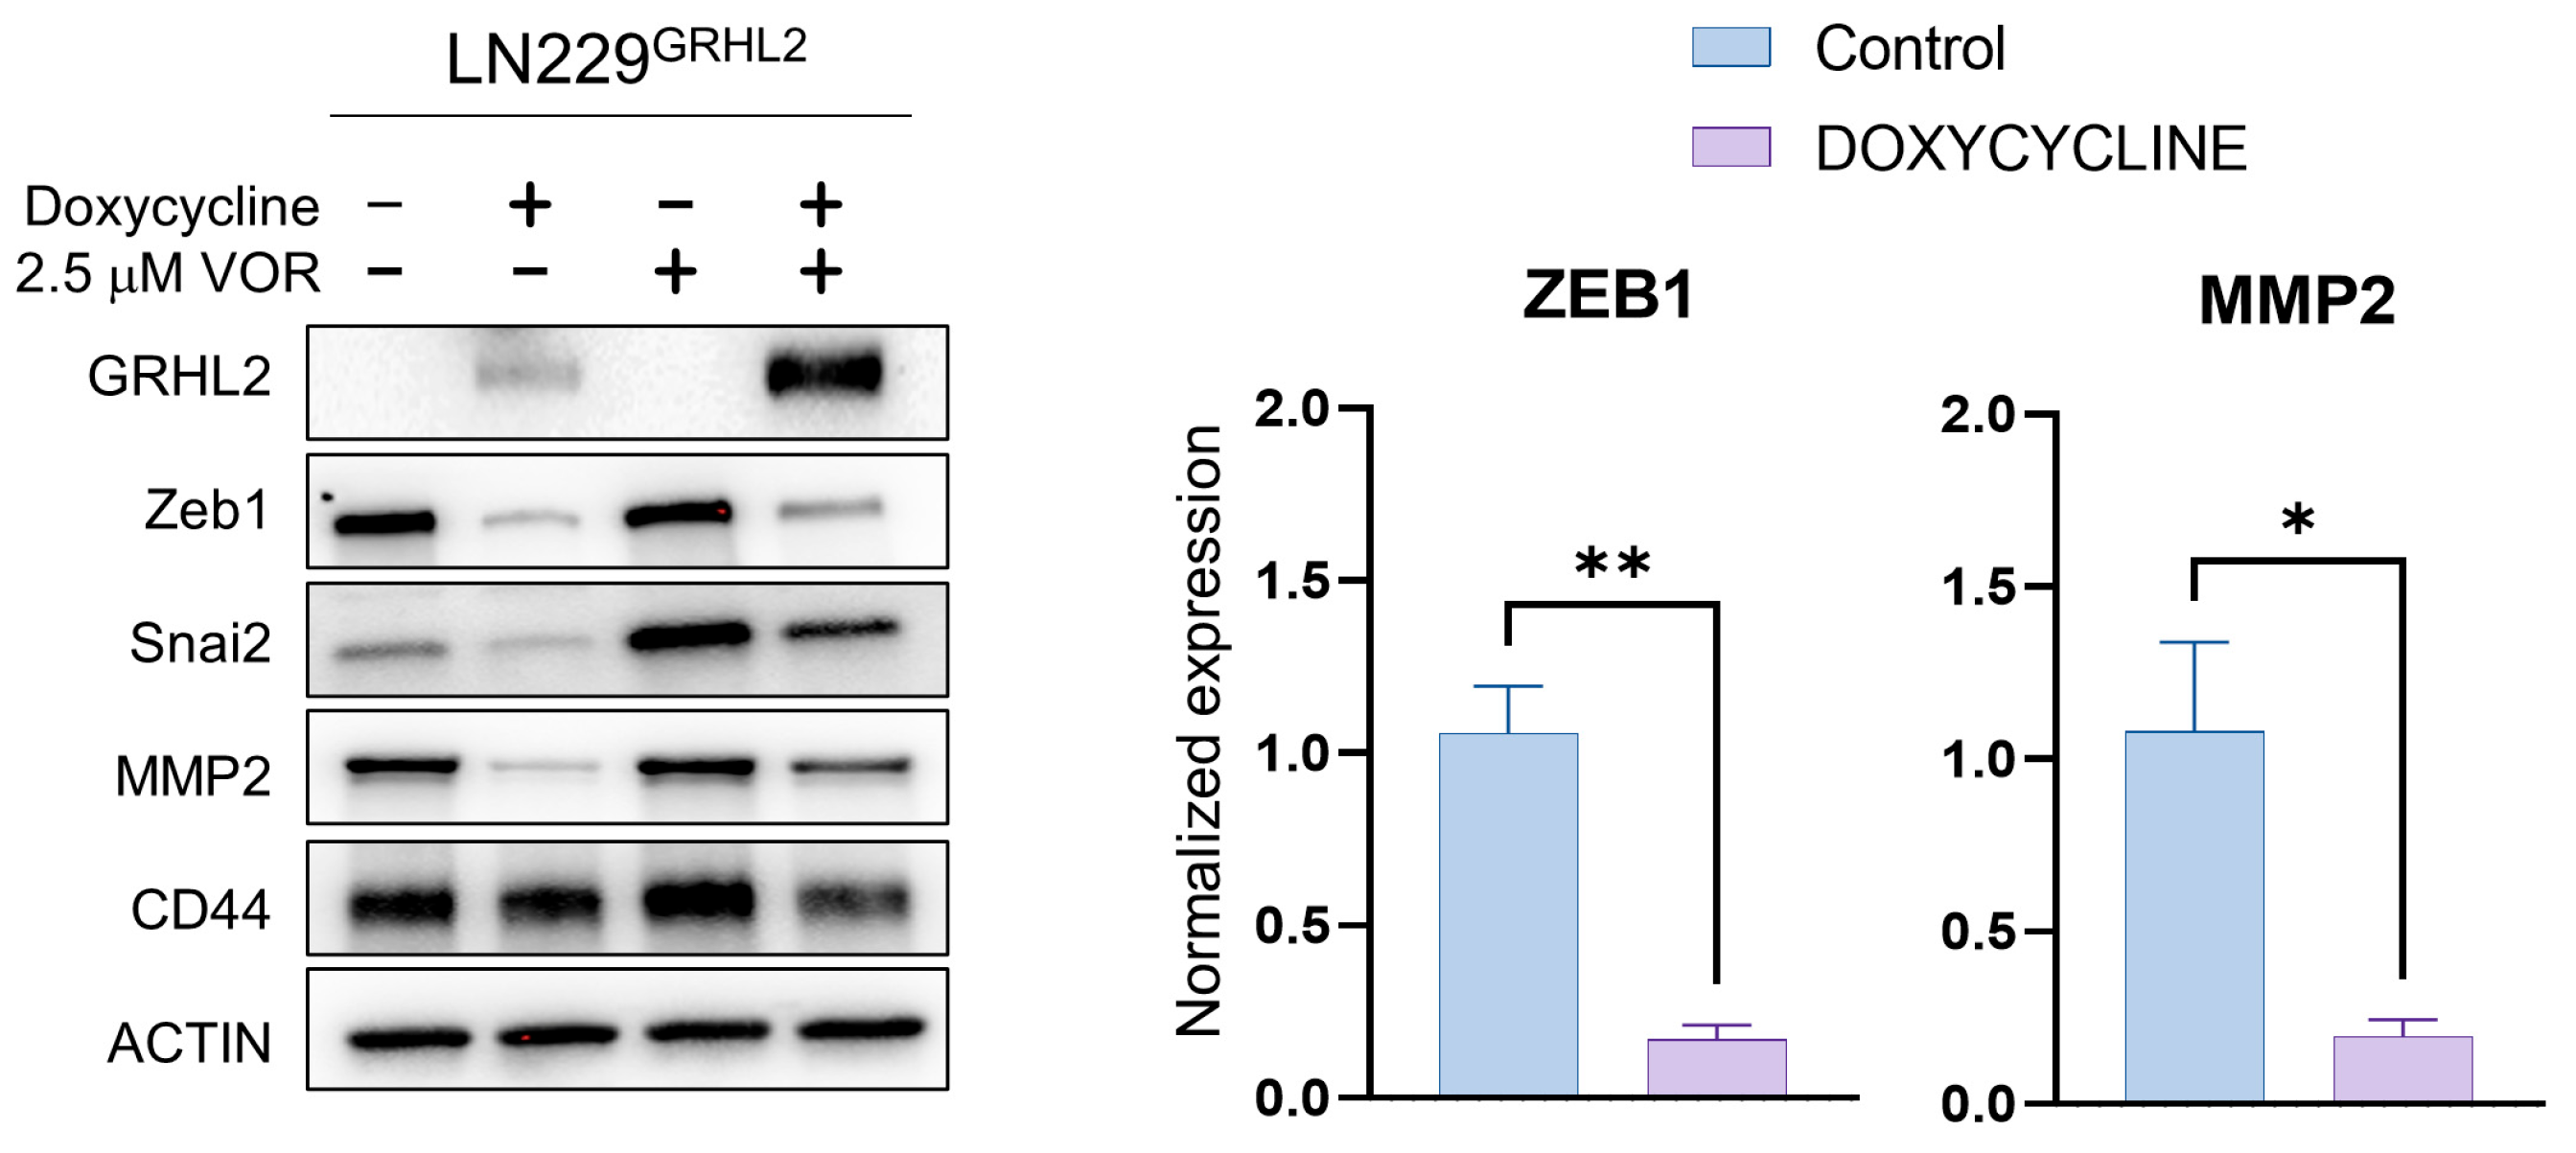
3.1. GRHL2 Induction Represses Mesenchymal Protein Expression and Enhances HDAC inhibitor-Mediated Apoptosis
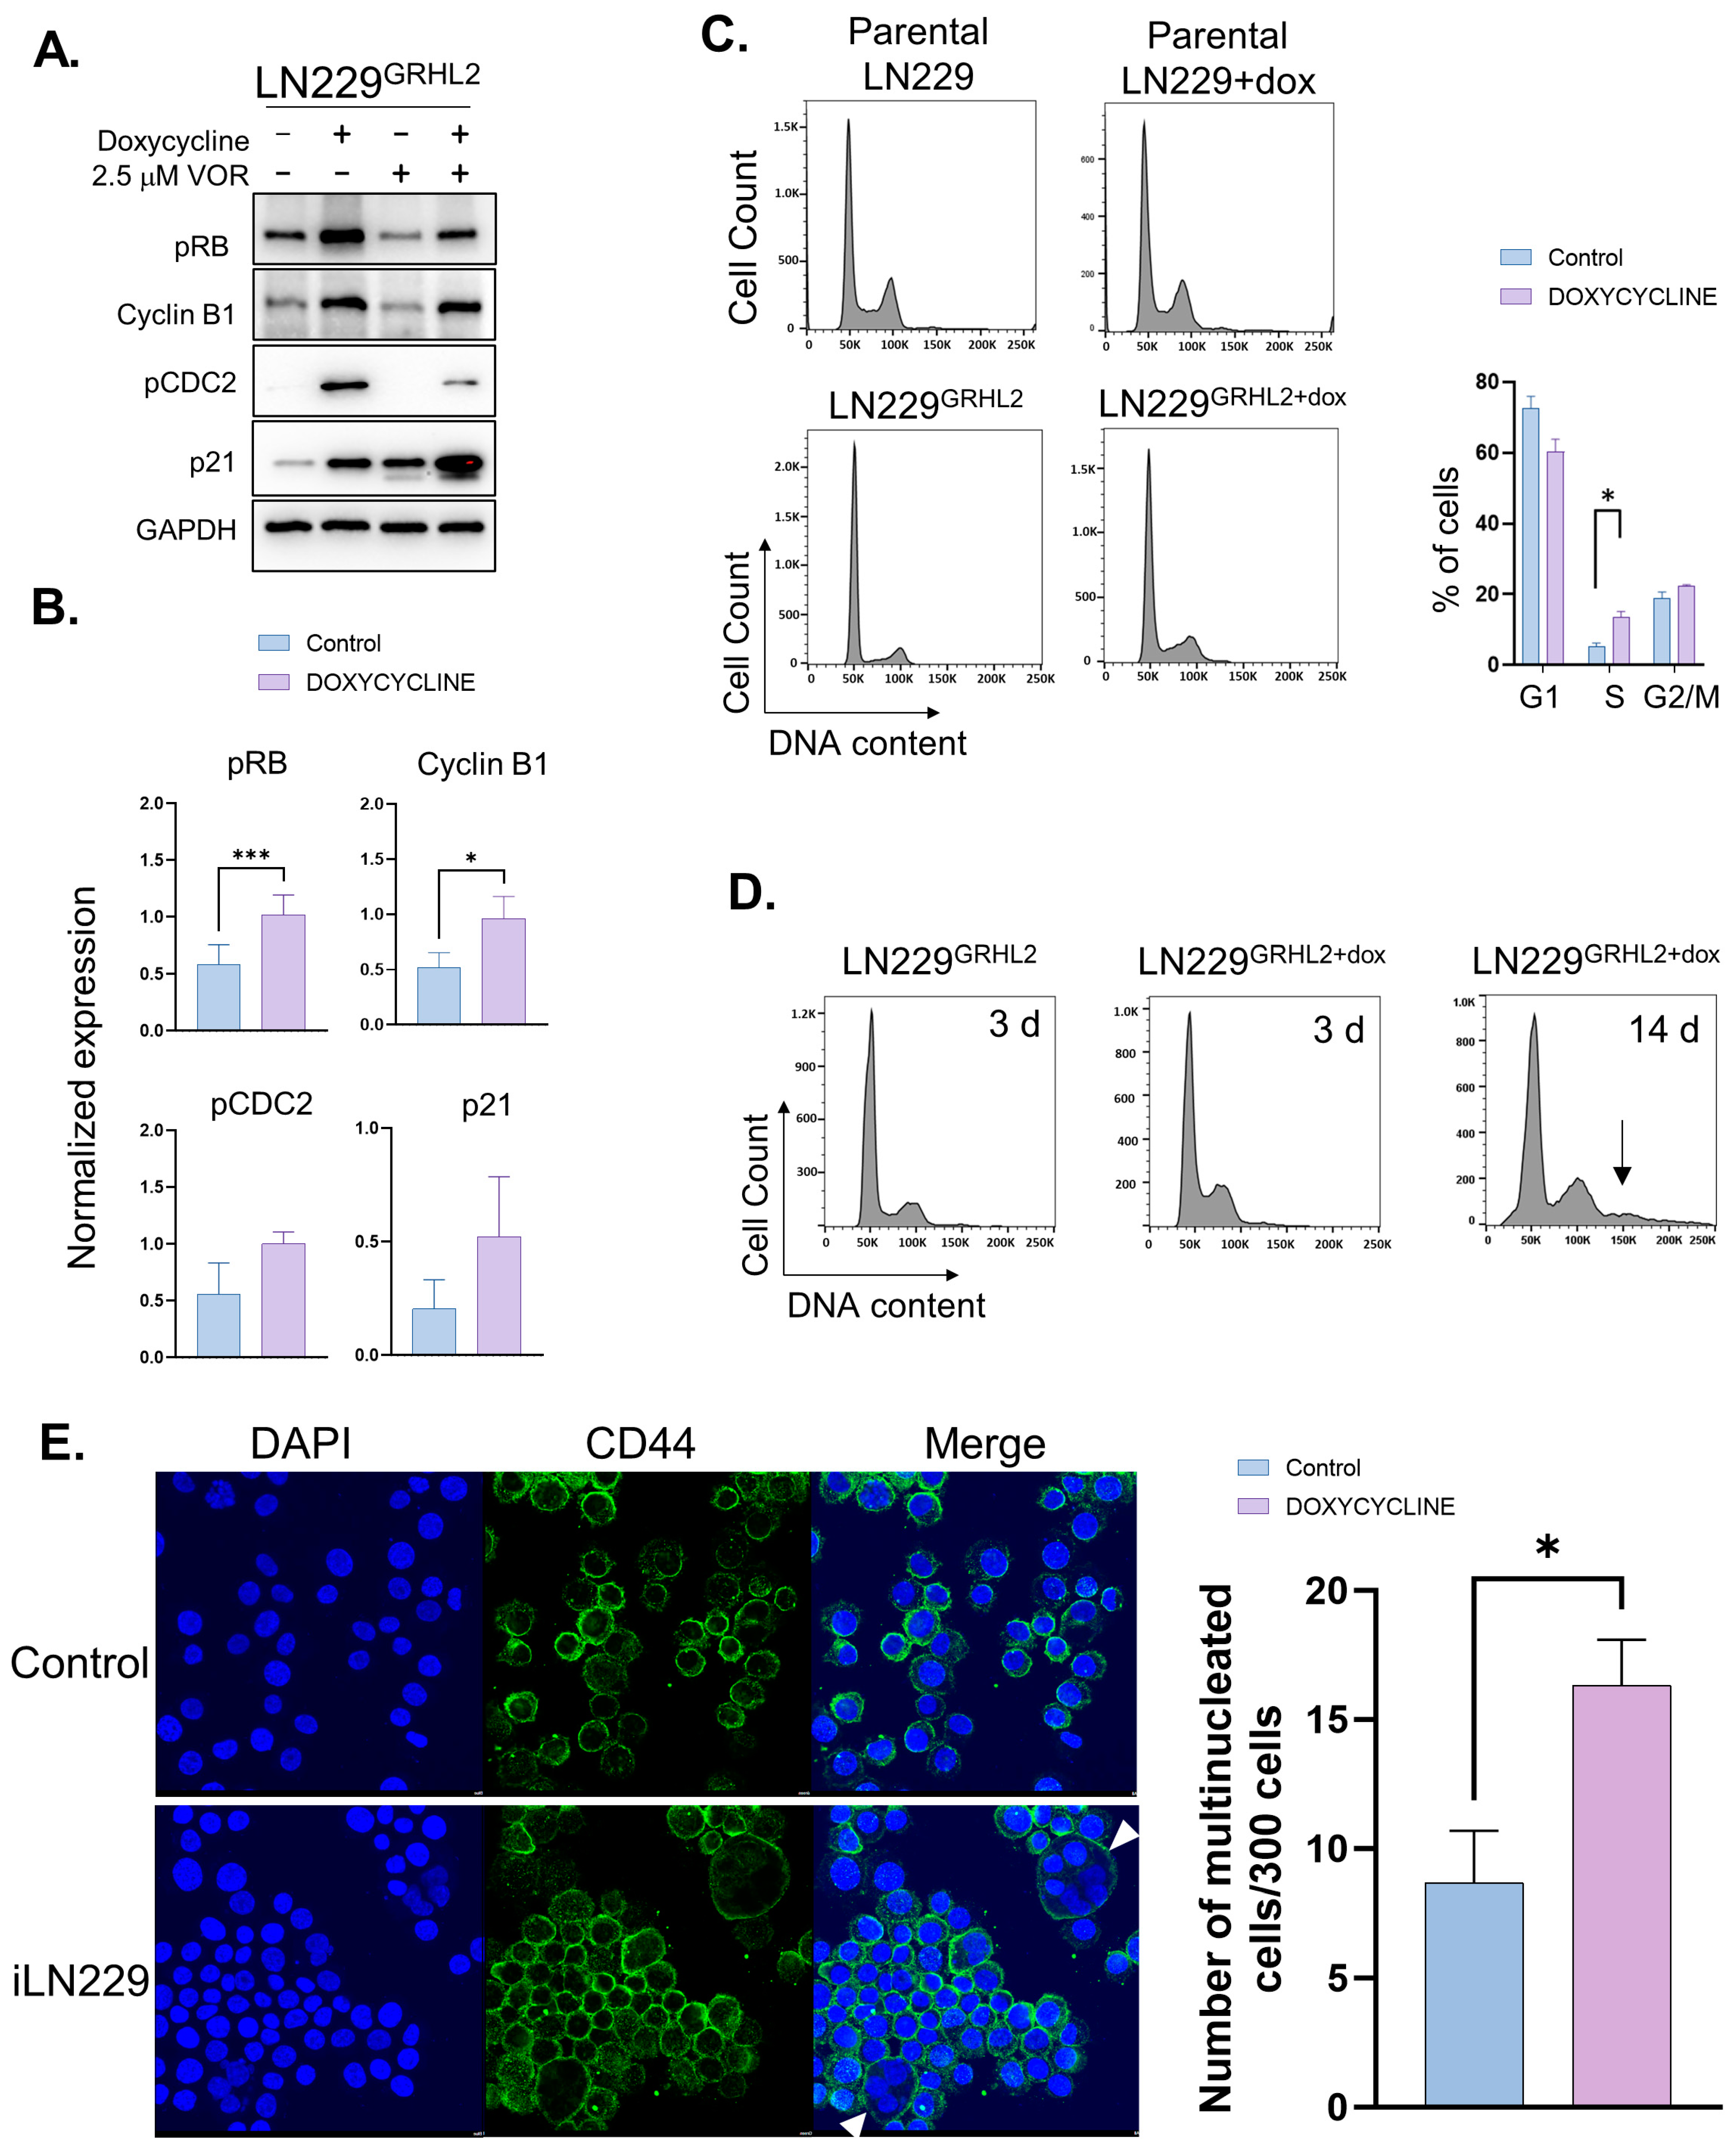
3.2. GRHL2 Expression in GBM Causes Cell-Cycle Defects
4. Discussion
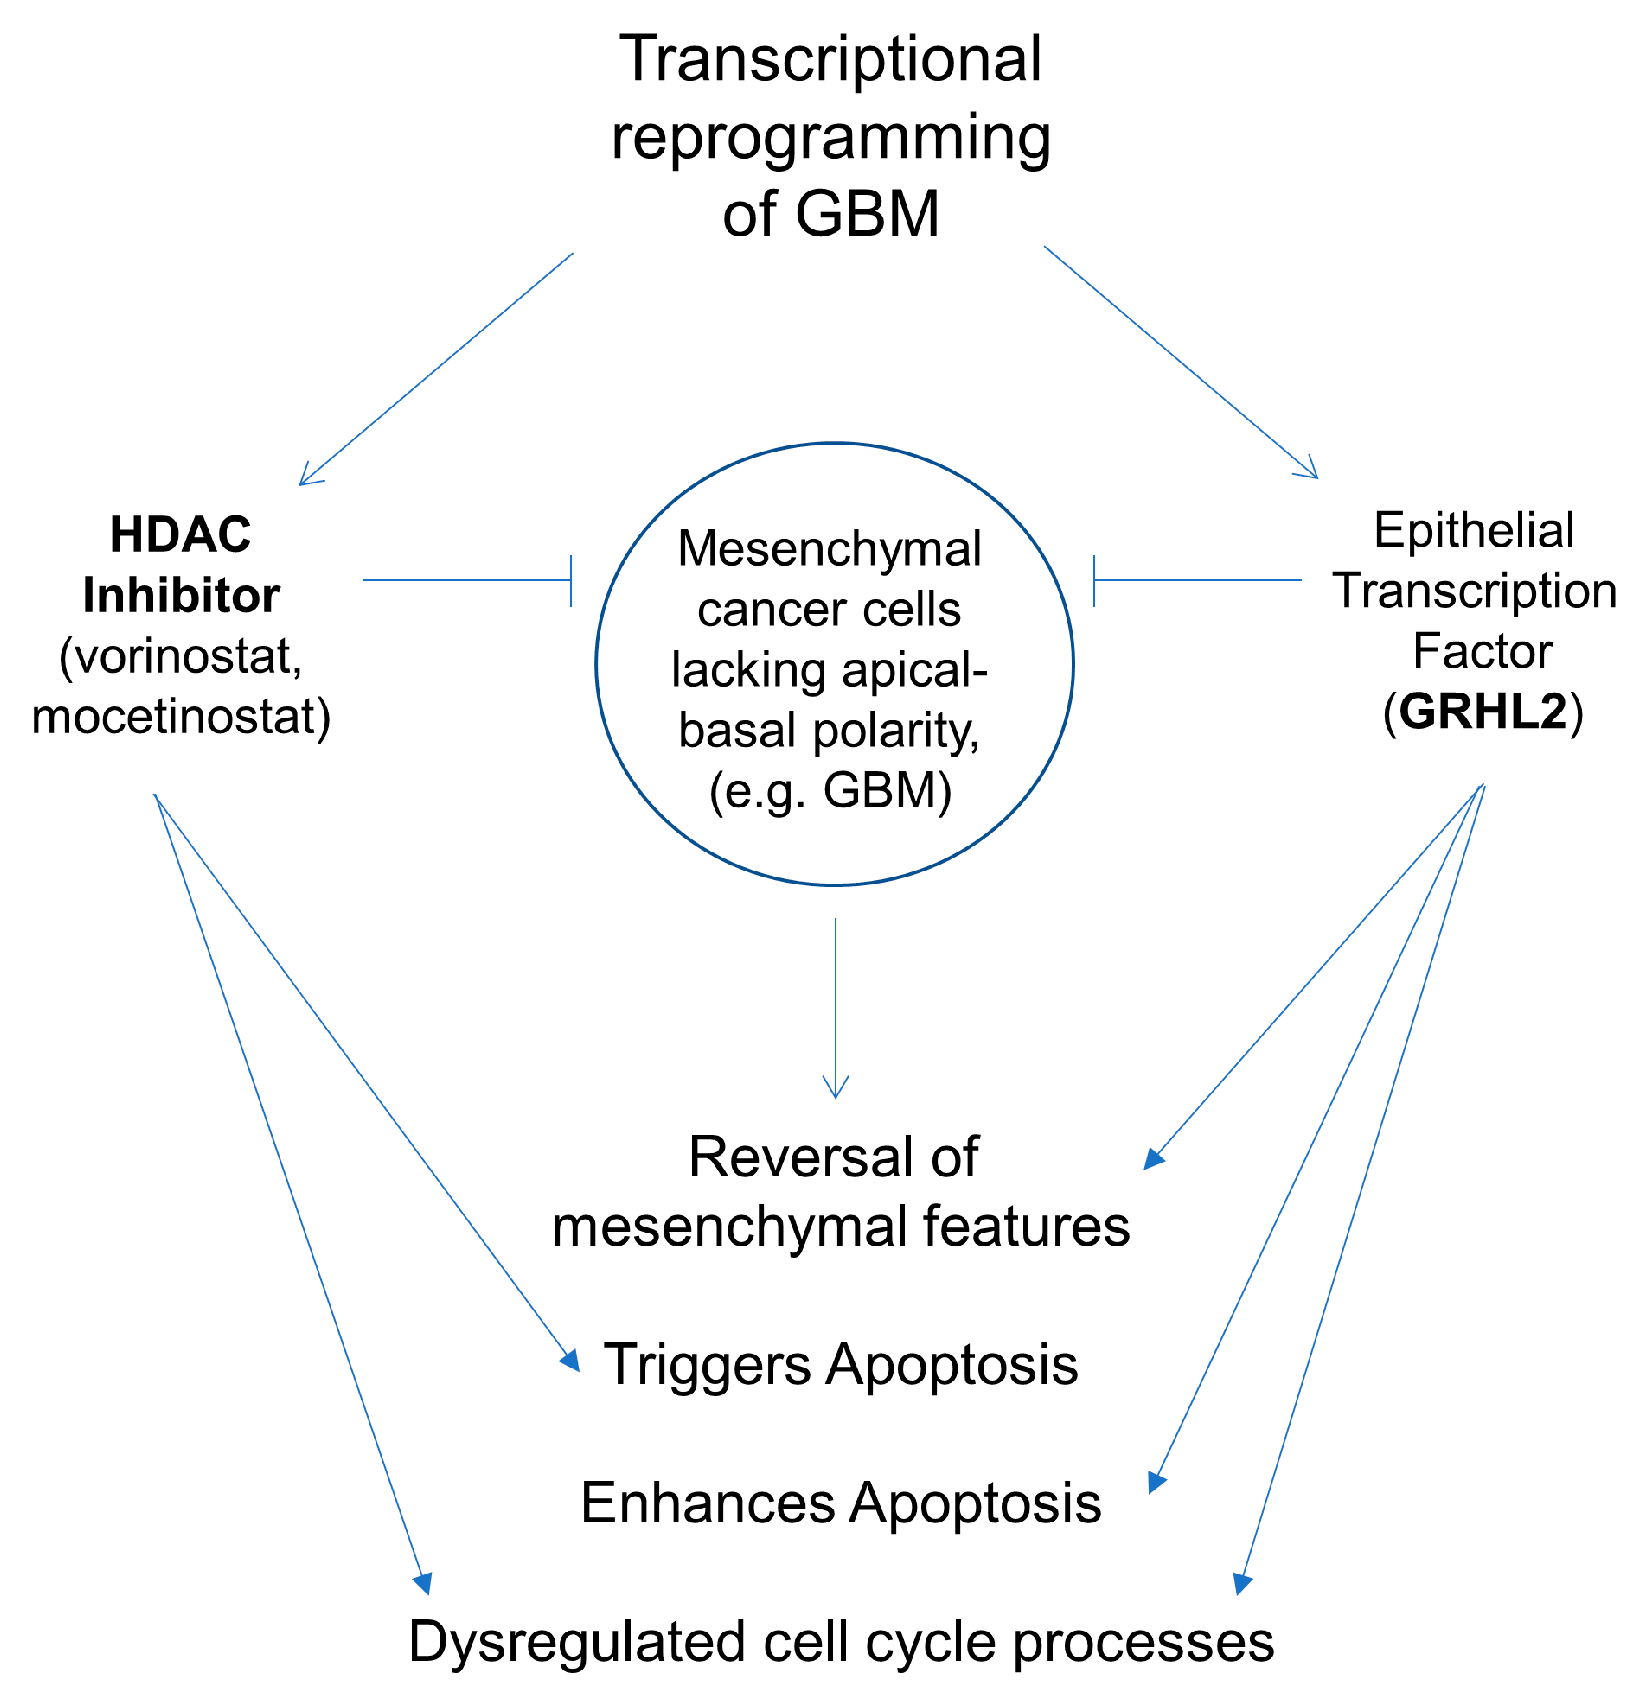
5. Conclusions
Supplementary Materials
Author Contributions
Funding
Institutional Review Board Statement
Informed Consent Statement
Data Availability Statement
Conflicts of Interest
References
- Li, K.; Lu, D.; Guo, Y.; Wang, C.; Liu, X.; Liu, Y.; Liu, D. Trends and Patterns of Incidence of Diffuse Glioma in Adults in the United States, 1973–2014. Cancer Med. 2018, 7, 5281–5290. [Google Scholar] [CrossRef] [PubMed]
- Tan, A.C.; Ashley, D.M.; López, G.Y.; Malinzak, M.; Friedman, H.S.; Khasraw, M. Management of Glioblastoma: State of the Art and Future Directions. CA Cancer J. Clin. 2020, 70, 299–312. [Google Scholar] [CrossRef] [PubMed]
- Poon, M.T.C.; Sudlow, C.L.M.; Figueroa, J.D.; Brennan, P.M. Longer-Term (≥2 Years) Survival in Patients with Glioblastoma in Population-Based Studies Pre- and Post-2005: A Systematic Review and Meta-Analysis. Sci. Rep. 2020, 10, 11622. [Google Scholar] [CrossRef] [PubMed]
- Chan, J.L.; Lee, S.W.; Fraass, B.A.; Normolle, D.P.; Greenberg, H.S.; Junck, L.R.; Gebarski, S.S.; Sandler, H.M. Survival and Failure Patterns of High-Grade Gliomas after Three-Dimensional Conformal Radiotherapy. J. Clin. Oncol. 2002, 20, 1635–1642. [Google Scholar] [CrossRef]
- Chandra, A.; Jahangiri, A.; Chen, W.; Nguyen, A.T.; Yagnik, G.; Pereira, M.P.; Jain, S.; Garcia, J.H.; Shah, S.S.; Wadhwa, H.; et al. Clonal ZEB1-Driven Mesenchymal Transition Promotes Targetable Oncologic Antiangiogenic Therapy Resistance. Cancer Res. 2020, 80, 1498–1511. [Google Scholar] [CrossRef]
- Edwards, L.A.; Kim, S.; Madany, M.; Nuno, M.; Thomas, T.; Li, A.; Berel, D.; Lee, B.S.; Liu, M.; Black, K.L.; et al. ZEB1 Is a Transcription Factor That Is Prognostic and Predictive in Diffuse Gliomas. Front. Neurol. 2019, 9, 1199. [Google Scholar] [CrossRef]
- Akiyama, Y.; Ashizawa, T.; Komiyama, M.; Miyata, H.; Oshita, C.; Omiya, M.; Iizuka, A.; Kume, A.; Sugino, T.; Hayashi, N.; et al. YKL-40 Downregulation Is a Key Factor to Overcome Temozolomide Resistance in a Glioblastoma Cell Line. Oncol. Rep. 2014, 32, 159–166. [Google Scholar] [CrossRef]
- Azam, Z.; Shing-Shun Tony, T.O.; Tannous, B.A. Mesenchymal Transformation: The Rosetta Stone of Glioblastoma Pathogenesis and Therapy Resistance. Adv. Sci. 2020, 7, 2002015. [Google Scholar] [CrossRef]
- Osuka, S.; Van Meir, E.G. Overcoming Therapeutic Resistance in Glioblastoma: The Way Forward. J. Clin. Investig. 2017, 127, 415–426. [Google Scholar] [CrossRef]
- Phillips, H.S.; Kharbanda, S.; Chen, R.; Forrest, W.F.; Soriano, R.H.; Wu, T.D.; Misra, A.; Nigro, J.M.; Colman, H.; Soroceanu, L.; et al. Molecular Subclasses of High-Grade Glioma Predict Prognosis, Delineate a Pattern of Disease Progression, and Resemble Stages in Neurogenesis. Cancer Cell 2006, 9, 157–173. [Google Scholar] [CrossRef]
- Verhaak, R.G.W.; Hoadley, K.A.; Purdom, E.; Wang, V.; Qi, Y.; Wilkerson, M.D.; Miller, C.R.; Ding, L.; Golub, T.; Mesirov, J.P.; et al. Integrated Genomic Analysis Identifies Clinically Relevant Subtypes of Glioblastoma Characterized by Abnormalities in PDGFRA, IDH1, EGFR, and NF1. Cancer Cell 2010, 17, 98–110. [Google Scholar] [CrossRef] [PubMed]
- Brennan, C.W.; Verhaak, R.G.W.; McKenna, A.; Campos, B.; Noushmehr, H.; Salama, S.R.; Zheng, S.; Chakravarty, D.; Sanborn, J.Z.; Berman, S.H.; et al. The Somatic Genomic Landscape of Glioblastoma. Cell 2013, 155, 462. [Google Scholar] [CrossRef] [PubMed]
- Wang, Q.; Hu, B.; Hu, X.; Kim, H.; Squatrito, M.; Scarpace, L.; deCarvalho, A.C.; Lyu, S.; Li, P.; Li, Y.; et al. Tumor Evolution of Glioma-Intrinsic Gene Expression Subtypes Associates with Immunological Changes in the Microenvironment. Cancer Cell 2017, 32, 42–56.e6. [Google Scholar] [CrossRef] [PubMed]
- Kim, Y.; Varn, F.S.; Park, S.H.; Yoon, B.W.; Park, H.R.; Lee, C.; Verhaak, R.G.W.; Paek, S.H. Perspective of Mesenchymal Transformation in Glioblastoma. Acta Neuropathol. Commun. 2021, 9, 50. [Google Scholar] [CrossRef] [PubMed]
- Martinez-Lage, M.; Lynch, T.M.; Bi, Y.; Cocito, C.; Way, G.P.; Pal, S.; Haller, J.; Yan, R.E.; Ziober, A.; Nguyen, A.; et al. Immune Landscapes Associated with Different Glioblastoma Molecular Subtypes. Acta Neuropathol. Commun. 2019, 7, 203. [Google Scholar] [CrossRef] [PubMed]
- Yoo, K.C.; Suh, Y.; An, Y.; Lee, H.J.; Jeong, Y.J.; Uddin, N.; Cui, Y.H.; Roh, T.H.; Shim, J.K.; Chang, J.H.; et al. Proinvasive Extracellular Matrix Remodeling in Tumor Microenvironment in Response to Radiation. Oncogene 2018, 37, 3317–3328. [Google Scholar] [CrossRef] [PubMed]
- Joseph, J.V.; Conroy, S.; Pavlov, K.; Sontakke, P.; Tomar, T.; Eggens-Meijer, E.; Balasubramaniyan, V.; Wagemakers, M.; den Dunnen, W.F.A.; Kruyt, F.A.E. Hypoxia Enhances Migration and Invasion in Glioblastoma by Promoting a Mesenchymal Shift Mediated by the HIF1α-ZEB1 Axis. Cancer Lett. 2015, 359, 107–116. [Google Scholar] [CrossRef]
- Singh, A.; Settleman, J. EMT, Cancer Stem Cells and Drug Resistance: An Emerging Axis of Evil in the War on Cancer. Oncogene 2010, 29, 4741–4751. [Google Scholar] [CrossRef]
- Siebzehnrubl, F.A.; Silver, D.J.; Tugertimur, B.; Deleyrolle, L.P.; Siebzehnrubl, D.; Sarkisian, M.R.; Devers, K.G.; Yachnis, A.T.; Kupper, M.D.; Neal, D.; et al. The ZEB1 Pathway Links Glioblastoma Initiation, Invasion and Chemoresistance. EMBO Mol. Med. 2013, 5, 1196–1212. [Google Scholar] [CrossRef]
- Xiang, J.; Fu, X.; Ran, W.; Wang, Z. Grhl2 Reduces Invasion and Migration through Inhibition of TGFβ-Induced EMT in Gastric Cancer. Oncogenesis 2017, 6, e284. [Google Scholar] [CrossRef]
- Werth, M.; Walentin, K.; Aue, A.; Schönheit, J.; Wuebken, A.; Pode-Shakked, N.; Vilianovitch, L.; Erdmann, B.; Dekel, B.; Bader, M.; et al. The Transcription Factor Grainyhead-like 2 Regulates the Molecular Composition of the Epithelial Apical Junctional Complex. Development 2010, 137, 3835–3845. [Google Scholar] [CrossRef]
- Gao, X.; Bali, A.S.; Randell, S.H.; Hogan, B.L.M. GRHL2 Coordinates Regeneration of a Polarized Mucociliary Epithelium from Basal Stem Cells. J. Cell Biol. 2015, 211, 669. [Google Scholar] [CrossRef]
- Lu, M.S.; Johnston, C.A. Molecular Pathways Regulating Mitotic Spindle Orientation in Animal Cells. Development 2013, 140, 1843. [Google Scholar] [CrossRef]
- Royer, C.; Lu, X. Epithelial Cell Polarity: A Major Gatekeeper against Cancer? Cell Death Differ. 2011, 18, 1470. [Google Scholar] [CrossRef]
- Jung, H.Y.; Fattet, L.; Tsai, J.H.; Kajimoto, T.; Chang, Q.; Newton, A.C.; Yang, J. Apical-Basal Polarity Inhibits Epithelial-Mesenchymal Transition and Tumour Metastasis via PAR Complex-Mediated SNAI1 Degradation. Nat. Cell Biol. 2019, 21, 359. [Google Scholar] [CrossRef] [PubMed]
- Chung, V.Y.; Tan, T.Z.; Ye, J.; Huang, R.-L.; Lai, H.-C.; Kappei, D.; Wollmann, H.; Guccione, E.; Huang, R.Y.-J. The Role of GRHL2 and Epigenetic Remodeling in Epithelial–Mesenchymal Plasticity in Ovarian Cancer Cells. Commun. Biol. 2019, 2, 272. [Google Scholar] [CrossRef] [PubMed]
- Shen, J.; Lv, X.; Zhang, L. GRHL2 Acts as an Anti-Oncogene in Bladder Cancer by Regulating ZEB1 in Epithelial-Mesenchymal Transition (EMT) Process. Onco Targets Ther. 2020, 13, 2511–2522. [Google Scholar] [CrossRef]
- Quan, Y.; Xu, M.; Cui, P.; Ye, M.; Zhuang, B.; Min, Z. Grainyhead-like 2 Promotes Tumor Growth and Is Associated with Poor Prognosis in Colorectal Cancer. J. Cancer 2015, 6, 342. [Google Scholar] [CrossRef]
- Nie, Y.; Ding, Y.; Yang, M. GRHL2 Upregulation Predicts a Poor Prognosis and Promotes the Resistance of Serous Ovarian Cancer to Cisplatin. Onco Targets Ther. 2020, 13, 6303–6314. [Google Scholar] [CrossRef]
- Milazzo, G.; Mercatelli, D.; Di Muzio, G.; Triboli, L.; De Rosa, P.; Perini, G.; Giorgi, F.M. Histone Deacetylases (HDACs): Evolution, Specificity, Role in Transcriptional Complexes, and Pharmacological Actionability. Genes 2020, 11, 556. [Google Scholar] [CrossRef] [PubMed]
- West, A.C.; Johnstone, R.W. New and Emerging HDAC Inhibitors for Cancer Treatment. J. Clin. Investig. 2014, 124, 30–39. [Google Scholar] [CrossRef] [PubMed]
- Dong, Z.; Cui, H. Epigenetic Modulation of Metabolism in Glioblastoma. Semin. Cancer Biol. 2019, 57, 45–51. [Google Scholar] [CrossRef] [PubMed]
- Egler, V.; Korur, S.; Failly, M.; Boulay, J.L.; Imber, R.; Lino, M.M.; Merlo, A. Histone Deacetylase Inhibition and Blockade of the Glycolytic Pathway Synergistically Induce Glioblastoma Cell Death. Clin. Cancer Res. 2008, 14, 3132–3140. [Google Scholar] [CrossRef] [PubMed]
- Zhang, Z.; Wang, Y.; Chen, J.; Tan, Q.; Xie, C.; Li, C.; Zhan, W.; Wang, M. Silencing of Histone Deacetylase 2 Suppresses Malignancy for Proliferation, Migration, and Invasion of Glioblastoma Cells and Enhances Temozolomide Sensitivity. Cancer Chemother. Pharmacol. 2016, 78, 1289–1296. [Google Scholar] [CrossRef] [PubMed]
- Was, H.; Krol, S.K.; Rotili, D.; Mai, A.; Wojtas, B.; Kaminska, B.; Maleszewska, M. Histone Deacetylase Inhibitors Exert Anti-Tumor Effects on Human Adherent and Stem-like Glioma Cells. Clin. Epigenet. 2019, 11, 11. [Google Scholar] [CrossRef]
- Nguyen, T.T.T.; Zhang, Y.; Shang, E.; Shu, C.; Torrini, C.; Zhao, J.; Bianchetti, E.; Mela, A.; Humala, N.; Mahajan, A.; et al. HDAC Inhibitors Elicit Metabolic Reprogramming by Targeting Super-Enhancers in Glioblastoma Models. J. Clin. Investig. 2020, 130, 3699–3716. [Google Scholar] [CrossRef] [PubMed]
- Sharma, V.; Koul, N.; Joseph, C.; Dixit, D.; Ghosh, S.; Sen, E. HDAC Inhibitor, Scriptaid, Induces Glioma Cell Apoptosis through JNK Activation and Inhibits Telomerase Activity. J. Cell Mol. Med. 2010, 14, 2151–2161. [Google Scholar] [CrossRef]
- Lee, D.H.; Ryu, H.W.; Won, H.R.; Kwon, S.H. Advances in Epigenetic Glioblastoma Therapy. Oncotarget 2017, 8, 18577–18589. [Google Scholar] [CrossRef]
- Li, S.; Chen, X.; Mao, L.; Zahid, K.R.; Wen, J.; Zhang, L.; Zhang, M.; Duan, J.; Duan, J.; Yin, X.; et al. Histone Deacetylase 1 Promotes Glioblastoma Cell Proliferation and Invasion via Activation of PI3K/AKT and MEK/ERK Signaling Pathways. Brain Res. 2018, 1692, 154–162. [Google Scholar] [CrossRef]
- Falkenberg, K.J.; Johnstone, R.W. Histone Deacetylases and Their Inhibitors in Cancer, Neurological Diseases and Immune Disorders. Nat. Rev. Drug Discov. 2014, 13, 673–691. [Google Scholar] [CrossRef]
- Sun, Y.; Sun, Y.; Yue, S.; Wang, Y.; Lu, F. Histone Deacetylase Inhibitors in Cancer Therapy. Curr. Top. Med. Chem. 2018, 18, 30–37. [Google Scholar] [CrossRef] [PubMed]
- Cuperlovic-Culf, M.; Touaibia, M.; St-Coeur, P.D.; Poitras, J.; Morin, P.; Culf, A.S. Metabolic Effects of Known and Novel HDAC and SIRT Inhibitors in Glioblastomas Independently or Combined with Temozolomide. Metabolites 2014, 4, 807–830. [Google Scholar] [CrossRef]
- Telles, E.; Seto, E. Modulation of Cell Cycle Regulators by HDACs. Front. Biosci. 2012, 4, 831. [Google Scholar] [CrossRef]
- Lathia, J.D.; Mack, S.C.; Mulkearns-Hubert, E.E.; Valentim, C.L.L.; Rich, J.N. Cancer Stem Cells in Glioblastoma. Genes Dev. 2015, 29, 1203–1217. [Google Scholar] [CrossRef]
- Nguyen, T.T.; Westhoff, M.-A.; Karpel-Massler, G.; Siegelin, M.D. Targeting Super-Enhancers Reprograms Glioblastoma Central Carbon Metabolism. Oncotarget 2021, 12, 1309–1313. [Google Scholar] [CrossRef]
- Asklund, T.; Kvarnbrink, S.; Holmlund, C.; Wibom, C.; Bergenheim, T.; Henriksson, R.; Hedman, H. Synergistic Killing of Glioblastoma Stem-like Cells by Bortezomib and HDAC Inhibitors. Anticancer Res. 2012, 32, 2407–2413. [Google Scholar]
- Bose, P.; Dai, Y.; Grant, S. Histone Deacetylase Inhibitor (HDACI) Mechanisms of Action: Emerging Insights. Pharmacol. Ther. 2014, 143, 323–336. [Google Scholar] [CrossRef] [PubMed]
- Vaubel, R.A.; Tian, S.; Remonde, D.; Schroeder, M.A.; Mladek, A.C.; Kitange, G.J.; Caron, A.; Kollmeyer, T.M.; Grove, R.; Peng, S.; et al. Genomic and Phenotypic Characterization of a Broad Panel of Patient-Derived Xenografts Reflects the Diversity of Glioblastoma. Clin. Cancer Res. 2020, 26, 1094–1104. [Google Scholar] [CrossRef]
- Walker, K.; Hjelmeland, A. Method for Efficient Transduction of Cancer Stem Cells. J. Cancer Stem Cell Res. 2014, 2, 1. [Google Scholar] [CrossRef]
- Cieply, B.; Farris, J.; Denvir, J.; Ford, H.; Frisch, S.M. Epithelial-Mesenchymal Transition and Tumor Suppression Are Controlled by a Reciprocal Feedback Loop between ZEB1 and Grainyhead-like-2. Cancer Res. 2013, 73, 6299. [Google Scholar] [CrossRef]
- Chung, V.Y.; Tan, T.Z.; Tan, M.; Wong, M.K.; Kuay, K.T.; Yang, Z.; Ye, J.; Muller, J.; Koh, C.M.; Guccione, E.; et al. GRHL2-MiR-200-ZEB1 Maintains the Epithelial Status of Ovarian Cancer through Transcriptional Regulation and Histone Modification. Sci. Rep. 2016, 6, 19943. [Google Scholar] [CrossRef] [PubMed]
- Meidhof, S.; Brabletz, S.; Lehmann, W.; Preca, B.; Mock, K.; Ruh, M.; Schüler, J.; Berthold, M.; Weber, A.; Burk, U.; et al. ZEB1-Associated Drug Resistance in Cancer Cells Is Reversed by the Class I HDAC Inhibitor Mocetinostat. EMBO Mol. Med. 2015, 7, 831–847. [Google Scholar] [CrossRef] [PubMed]
- Grasso, C.S.; Tang, Y.; Truffaux, N.; Berlow, N.E.; Liu, L.; Debily, M.A.; Quist, M.J.; Davis, L.E.; Huang, E.C.; Woo, P.J.; et al. Functionally Defined Therapeutic Targets in Diffuse Intrinsic Pontine Glioma. Nat. Med. 2015, 21, 555–559. [Google Scholar] [CrossRef] [PubMed]
- Hockly, E.; Richon, V.M.; Woodman, B.; Smith, D.L.; Zhou, X.; Rosa, E.; Sathasivam, K.; Ghazi-Noori, S.; Mahal, A.; Lowden, P.A.S.; et al. Suberoylanilide Hydroxamic Acid, a Histone Deacetylase Inhibitor, Ameliorates Motor Deficits in a Mouse Model of Huntington’s Disease. Proc. Natl. Acad. Sci. USA 2003, 100, 2041–2046. [Google Scholar] [CrossRef]
- Eyüpoglu, I.Y.; Hahnen, E.; Buslei, R.; Siebzehnrübl, F.A.; Savaskan, N.E.; Lüders, M.; Tränkle, C.; Wick, W.; Weller, M.; Fahlbusch, R.; et al. Suberoylanilide Hydroxamic Acid (SAHA) Has Potent Anti-Glioma Properties in Vitro, Ex Vivo and In Vivo. J. Neurochem. 2005, 93, 992–999. [Google Scholar] [CrossRef]
- Choi, M.A.; Park, S.Y.; Chae, H.Y.; Song, Y.; Sharma, C.; Seo, Y.H. Design, Synthesis and Biological Evaluation of a Series of CNS Penetrant HDAC Inhibitors Structurally Derived from Amyloid-β Probes. Sci. Rep. 2019, 9, 13187. [Google Scholar] [CrossRef]
- Bhat, K.P.L.; Balasubramaniyan, V.; Vaillant, B.; Ezhilarasan, R.; Hummelink, K.; Hollingsworth, F.; Wani, K.; Heathcock, L.; James, J.D.; Goodman, L.D.; et al. Mesenchymal Differentiation Mediated by NF-ΚB Promotes Radiation Resistance in Glioblastoma. Cancer Cell 2013, 24, 331–346. [Google Scholar] [CrossRef]
- Jin, X.; Kim, L.J.Y.; Wu, Q.; Wallace, L.C.; Prager, B.C.; Sanvoranart, T.; Gimple, R.C.; Wang, X.; Mack, S.C.; Miller, T.E.; et al. Targeting Glioma Stem Cells through Combined BMI1 and EZH2 Inhibition. Nat. Med. 2017, 23, 1352–1361. [Google Scholar] [CrossRef]
- Singh, S.K.; Hawkins, C.; Clarke, I.D.; Squire, J.A.; Bayani, J.; Hide, T.; Henkelman, R.M.; Cusimano, M.D.; Dirks, P.B. Identification of Human Brain Tumour Initiating Cells. Nature 2004, 432, 396–401. [Google Scholar] [CrossRef]
- Singh, S.K.; Clarke, I.D.; Terasaki, M.; Bonn, V.E.; Hawkins, C.; Squire, J.; Dirks, P.B. Identification of a Cancer Stem Cell in Human Brain Tumors. Cancer Res. 2003, 63, 5821–5828. [Google Scholar]
- Gimple, R.C.; Bhargava, S.; Dixit, D.; Rich, J.N. Glioblastoma Stem Cells: Lessons from the Tumor Hierarchy in a Lethal Cancer. Genes Dev. 2019, 33, 591–609. [Google Scholar] [CrossRef]
- Mohammed, H.; Taylor, C.; Brown, G.D.; Papachristou, E.K.; Carroll, J.S.; D’Santos, C.S. Rapid Immunoprecipitation Mass Spectrometry of Endogenous Proteins (RIME) for Analysis of Chromatin Complexes. Nat. Protoc. 2016, 11, 316–326. [Google Scholar] [CrossRef]
- Farris, J.C.; Pifer, P.M.; Zheng, L.; Gottlieb, E.; Denvir, J.; Frisch, S.M. Grainyhead-like 2 Reverses the Metabolic Changes Induced by the Oncogenic Epithelial-Mesenchymal Transition: Effects on Anoikis. Mol. Cancer Res. 2016, 14, 528–538. [Google Scholar] [CrossRef]
- Quan, Y.; Jin, R.; Huang, A.; Zhao, H.; Feng, B.; Zang, L.; Zheng, M. Downregulation of GRHL2 Inhibits the Proliferation of Colorectal Cancer Cells by Targeting ZEB1. Cancer Biol. Ther. 2014, 15, 878–887. [Google Scholar] [CrossRef] [PubMed]
- Aguilar-Aragon, M.; Bonello, T.T.; Bell, G.P.; Fletcher, G.C.; Thompson, B.J. Adherens Junction Remodelling during Mitotic Rounding of Pseudostratified Epithelial Cells. EMBO Rep. 2020, 21, e49700. [Google Scholar] [CrossRef] [PubMed]
- Lamouille, S.; Xu, J.; Derynck, R. Molecular Mechanisms of Epithelial–Mesenchymal Transition. Nat. Rev. Mol. Cell Biol. 2014, 15, 178. [Google Scholar] [CrossRef] [PubMed]


| Antibody | Catalogue Number |
|---|---|
| BIM | Cell Signaling Technologies, 2933 |
| CD44 | R&D Systems, BBA10 |
| Cleaved Caspase 3 | Cell Signaling Technologies, 9664 |
| GRHL2 | Invitrogen, PA5-28973 |
| SNAI2 | Cell Signaling Technologies, 9585 |
| H3K9ac | Cell Signaling Technologies, 9766 |
| MMP2 | Cell Signaling Technologies, 40994 |
| ZEB1 | Cell Signaling Technologies, 70512 |
| b-Actin | Santa Cruz, sc-47778 |
| pH2AX | Cell Signaling Technologies, 9718 |
| pRB | Cell Signaling Technologies, 9308 |
| Cyclin B1 | Cell Signaling Technologies, 12231 |
| TK1 | Cell Signaling Technologies, 28755 |
| pCDC2 | Cell Signaling Technologies, 4539 |
| P21 Cell | Signaling Technologies, 2947 |
| Cyclin E1 | Cell Signaling Technology, 20808 |
| CD44 | R&D Systems, BBA10 |
Disclaimer/Publisher’s Note: The statements, opinions and data contained in all publications are solely those of the individual author(s) and contributor(s) and not of MDPI and/or the editor(s). MDPI and/or the editor(s) disclaim responsibility for any injury to people or property resulting from any ideas, methods, instructions or products referred to in the content. |
© 2023 by the authors. Licensee MDPI, Basel, Switzerland. This article is an open access article distributed under the terms and conditions of the Creative Commons Attribution (CC BY) license (https://creativecommons.org/licenses/by/4.0/).
Share and Cite
Kotian, S.; Carnes, R.M.; Stern, J.L. Enhancing Transcriptional Reprogramming of Mesenchymal Glioblastoma with Grainyhead-like 2 and HDAC Inhibitors Leads to Apoptosis and Cell-Cycle Dysregulation. Genes 2023, 14, 1787. https://doi.org/10.3390/genes14091787
Kotian S, Carnes RM, Stern JL. Enhancing Transcriptional Reprogramming of Mesenchymal Glioblastoma with Grainyhead-like 2 and HDAC Inhibitors Leads to Apoptosis and Cell-Cycle Dysregulation. Genes. 2023; 14(9):1787. https://doi.org/10.3390/genes14091787
Chicago/Turabian StyleKotian, Spandana, Rachel M. Carnes, and Josh L. Stern. 2023. "Enhancing Transcriptional Reprogramming of Mesenchymal Glioblastoma with Grainyhead-like 2 and HDAC Inhibitors Leads to Apoptosis and Cell-Cycle Dysregulation" Genes 14, no. 9: 1787. https://doi.org/10.3390/genes14091787
APA StyleKotian, S., Carnes, R. M., & Stern, J. L. (2023). Enhancing Transcriptional Reprogramming of Mesenchymal Glioblastoma with Grainyhead-like 2 and HDAC Inhibitors Leads to Apoptosis and Cell-Cycle Dysregulation. Genes, 14(9), 1787. https://doi.org/10.3390/genes14091787