1. Introduction
Understanding the biology of colorectal carcinoma (CRC) has led to therapeutic breakthroughs, improving patient care. Yet, intratumor heterogeneity challenges single-site biopsies in unveiling genomic landscapes. With emerging targeted therapies, it becomes crucial to screen tumours for genomic changes and understand resistance. It is also important to note the changes in circulating tumour cells (CTCs), which may differ genomically from the primary tumour and could provide a better reflection of the current disease status. In this context, the utilisation of CTCs, which can be captured through a minimally invasive blood test, emerges as a promising avenue to gain valuable insights into intratumor heterogeneity and tumour evolution.
Around 52% of patients with CRCs are accompanied by a mutation in
KRAS (Kirsten rat sarcoma virus). In these patients, activating mutations in the oncogene
KRAS usually occur at exon 2 (codons 12 and 13), and less frequently at exons 3 (codons 59 and 61) and 4 (codons 117 and 146) [
1,
2]. These mutations predict poor response to standard targeted therapy and anti-EGFR (epidermal growth factor receptor) treatment because they activate the
RAS/MAPK (mitogen-activated protein kinase) pathway constitutively [
3]. However, a large portion of the patients do not carry
KRAS mutations and the durability of response in patients with
KRAS mutations may be short due to the development of resistance.
On the other hand, the discovery of immune checkpoint inhibitors, such as anti-PD-1 (programmed cell delath protein 1) and anti-CTLA-4 (cytotoxic T-lymphocyte-associated protein 4, CD152) antibodies, has shown improved patient outcomes for numerous cancers, including CRC [
4,
5,
6]. Altered expressions of
KRAS,
BRAF,
p53,
MYC,
APC (adenomatous polyposis coli), and
PTEN (phosophatase and tensin homolog) play a role in controlling tumour–immune system crosstalk. Also, they can modulate the expression of immune checkpoint molecules such as
PD-1, PD-L1 (programmed cell death ligand 1),
PD-L2 (programmed cell death ligand 2),
CTLA-4 ),
CD47, etc., in several cancers [
7,
8,
9,
10,
11,
12,
13,
14,
15,
16,
17,
18,
19]. For instance, loss of
p53 activity increases PD-L1 surface expression, leading to T-cell inactivation [
20]. Several oncogenic events, such as
KRAS mutation or
MYC activation, have also been shown to suppress or evade anti-tumour immune responses via immune checkpoint molecules [
21,
22].
For the past few decades, CTCs have been studied extensively because of their potential as a non-invasive liquid biomarker for prognostic and predictive value [
23,
24]. In addition to cell enumeration, the genetic profiling of CTCs has gained growing interest as a means to investigate intratumor heterogeneity [
25,
26]. To illustrate, Kalikaki et al. (2014) examined
KRAS mutations within CTC-enriched samples, revealing the presence of detectable mutations in CTCs compared to matched primary tumours [
25]. When evaluating
KRAS mutations in consecutive blood samples, it was observed that the mutational status of
KRAS in individual patients’ CTCs varied during the course of treatment. Given the existence of intratumor heterogeneity in various tumour types [
27,
28,
29], an important query emerges concerning whether CTCs possess the capability to mirror the genetic attributes of tumours. To delve into this matter, we performed an investigation into the sequence profiles of CTCs and their corresponding primary tumours. Additionally, we aimed to compare the
KRAS and
CTLA-4 expression levels with the
KRAS mutation status in patients with CRCs to characterise the clinical and molecular aspects of
KRAS-mutated CTCs in patients with CRC to determine whether the mutation affects the expression of
CTLA-4 in CTCs in colon carcinogenesis.
Hence, the genetic profiling of CTCs holds promise as an innovative approach to gain a more comprehensive understanding of the dynamic characteristics of tumours in real-time, providing an alternative to invasive procedures. Furthermore, it could contribute to the development of treatment strategies for CRC patients by elucidating the genetic basis of immunotherapeutic target molecules on a real-time platform. However, the actual clinical utility of CTCs in revealing KRAS mutation status along with immunotherapeutic target molecules is yet to be fully determined.
Our previous study found a positive correlation between
CTLA-4 mRNA and
KRAS mRNA expressions in CTCs isolated from patients with CRC [
30]. This may suggest that the activation of driver genes could regulate immune response through altered immune checkpoint pathways. To delve into this matter, we performed an investigation into the sequence profiles of CTCs and their corresponding primary tumours. Additionally, we aimed to compare the
KRAS and
CTLA-4 expression level with the
KRAS mutation status in patients with CRCs to characterise the clinical and molecular aspects of
KRAS-mutated CTCs in patients with CRC to determine whether mutation affects the expression of
CTLA-4 in CTCs in colon carcinogenesis.
2. Materials and Methods
2.1. Population and Sample Recruitment
Consecutive patients who underwent resection of CRC by a colorectal surgeon (CTL) at Gold Coast University Hospital, Queensland, Australia, gave consent for the collection of peripheral blood and cancer tissue. From each patient, 10 mL of peripheral blood was freshly collected in heparin-containing BD (Becton Dickinson, Franklin Lakes, NJ, USA) vacutainer tubes at the time of surgery and was processed within one hour of collection. The tissues collected were immediately snap-frozen with liquid nitrogen and stored at −80 °C until use. Ethical approval was obtained from the Griffith University Human Research Ethics Committee (GU Ref No: MSC/17/10/HREC). Before enrolling in the trial, all patients provided written informed consent. A pathologist (A.K.L.) evaluated the pathological characteristics of resected tissues collected from patients with CRC along the lines of the World Health Organisation (WHO) classification of tumours [
31]. The clinical and pathological characteristics, including patient age, gender, tumour size, site, histological subtype, microsatellite instability (MSI) status, and pathological staging, were also collected [
32]. Among 57 patients, a total of 23 patients positive for CTCs were used in this study.
Table 1 demonstrates the demographic characteristics of patients.
2.2. CTC Enrichment and Staining
CTCs were enriched from 10 mL of peripheral blood according to the manufacturer’s protocol (EasySep
TM Direct Human CTC Enrichment Kit, STEMCELL Technologies, Vancouver, BC, Canada). The procedures of CTC enrichment and isolation as well as the cell spiking method to verify the specificity and sensitivity of this method have been previously reported in detail [
30,
33]. The enriched cell pellets were seeded in a 96-well plate after centrifugation at 450 rcf for 7 min and incubated at 37 °C for 12 h.
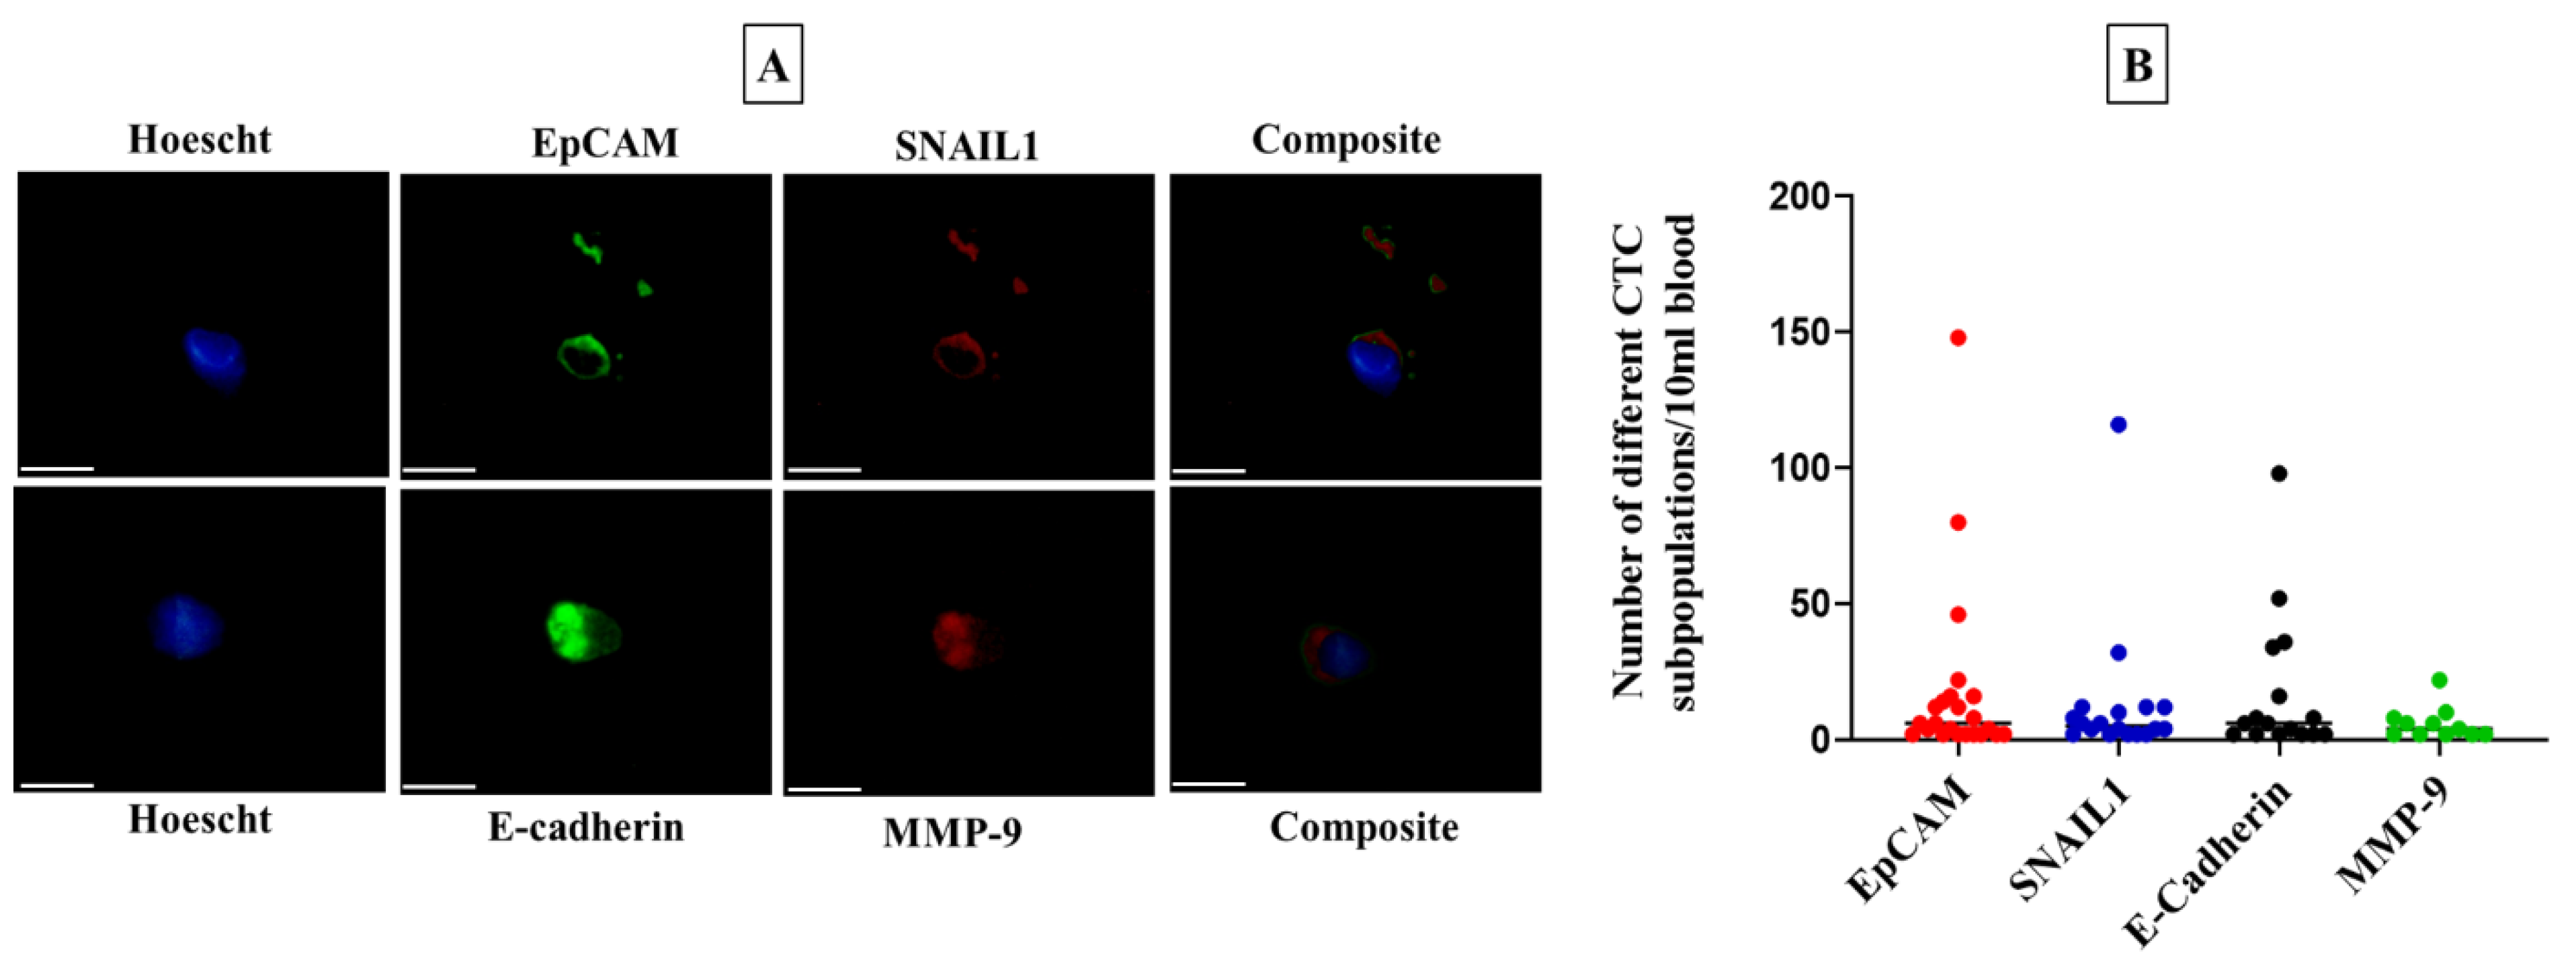
Immunofluorescence staining was performed to identify CTCs as described previously [
30]. Mouse anti-EPCAM antibody (Thermo Fisher Scientific, Waltham, MA, USA), goat anti-SNAI1 (Santa Cruz Biotechnology, Paso Robles, CA, USA), mouse anti-E-cadherin (Santa Cruz Biotechnology), and goat anti-MMP9 (C-20) (Santa Cruz Biotechnology) were used as primary antibodies and rabbit-anti-mouse IgG fluorescein isothiocyanate (FITC) and rabbit anti-goat IgG (H + L) Texas Red (Sigma-Aldrich, St. Louis, MO, USA) as secondary antibodies. Hoechst 33342 (Thermo Fisher Scientific, Waltham, MA, USA) was used to stain the nucleus. The stained cells were counted by a Widefield Microscope: Nikon Ti-2 (Nikon Corporation, Tokyo, Japan) at 20× magnification. The possible cross-species binding of selected secondary antibodies was checked to avoid overlapping results as previously published [
30].
2.3. Extraction of DNA and RNA and cDNA Conversion
The selected frozen tissues were sectioned into 5–6 μm slices using a cryostat (Leica Biosystems, Mt Waverley, VIC, Australia) for haematoxylin and eosin staining. The sections were then examined by an anatomical pathologist (A.K.L.) to confirm that cancer cells made up more than 70% of the volume of the samples. DNA was extracted and purified from selected tissue sections with Qiagen DNeasy Blood & Tissue kits (Qiagen Pty. Ltd., Hilden, Germany) following the manufacturer’s guidelines. RNA was extracted from the fresh frozen tissue sections using the Qiagen miRNeasy Mini Kit. DNA and RNA from CTCs were extracted using the Qiagen AllPrep DNA/RNA Mini Kit. The purity of the extracted DNA and RNA was measured with the optical density method (260/280 ratio) using a nanodrop spectrophotometer (BioLab, Ipswich, MA, USA). The concentrations were noted in ng/μL.
2.4. Whole-Genome Amplification (WGA) Reaction
Due to the low number of cells in CTC fractions, DNA isolated from CTC fractions was subsequently amplified according to the manufacturer’s protocol using the REPLI-g Advanced DNA Single Cell Kit (Qiagen Pty. Ltd., Hilden, Germany). Briefly, 15 μL of DNA was incubated with 2 μL of DNA lysis buffer (DLB) for 3 min at room temperature, and then 3 μL of stop solution was added. When the DNA had been denatured, it was added to a master mix consisting of 29 L of reaction buffer and 2 L of REPLI-g sc DNA polymerase. The reaction was incubated for 2 h at 30 °C followed by 3 min at 65 °C. DNA for WGA was stored at −80 °C.
2.5. Primer Design
KRAS and
CTLA-4 gene expression was analysed using 5ʹ GGCCTGCTGAAAATGACTG 3ʹ forward and 5ʹ CTTGCTTCCTGTAGGAATCCTC 3ʹ reverse, and 5′ TTGCTAAAGAAAAGAAGCCC 3ʹ forward and 5ʹ AAAGTTAGAATTGCCTCAGC 3′ reverse primers, respectively. Primers specific for detecting
KRAS mutations in exon 2 and exon 3, specifically the common
KRAS mutations at codon 12, codon 13, codon 59, and codon 61, were designed using Primer3web version 4.1.0 [
34].
KRAS exon 2 was amplified using 5′ AAGCGTCGATGGAGGAG 3′ forward primer and 5ʹ CGTCAAGGCACTCTTGC 3′ reverse primer. Exon 3 was amplified using 5ʹ TCCAGACTGTGTTTCTCCCTTC 3′ forward and 5′ CAAAGAAAGCCCTCCCCAGT 3ʹ reverse primer. All primers were cross-checked for specificity using Primer Blast (
https://www.ncbi.nlm.nih.gov/tools/primer-blast/, accessed on 17 November 2022). The primer pairs were purchased from Sigma-Aldrich (St. Louis, MO, USA) and Integrated DNA Technologies Australia Pty Ltd. (Melbourne, VIC, Australia).
2.6. Quantitative Real-Time Polymerase Chain Reaction Analysis
First-strand complementary DNA (cDNA) was synthesised by converting 1 μg of total RNA into cDNA by the SensiFAST cDNA synthesis kit (Meridian Bioscience, Cincinnati, OH, USA) according to the manufacturer’s guidelines. Alterations in KRAS and CTLA-4 gene expressions in CTC fractions and CRC tissue samples were investigated using real-time polymerase chain reaction (RT-PCR) (QuantStudio, Thermo Fisher Scientific, Waltham, MA, USA). Quantitative PCR was performed in a volume of 10 μL reaction mixture consisting of 5 μL of SensiFAST SYBR No-ROX (Bioline, Meridian Bioscience, London, UK), 0.4 μL of 10 μmoL/L forward and reverse primer, 3.2 μL of 0.1% diethylpyrocarbonate (DEPC)-treated water, and 1 μL of cDNA template (100 ng/μL). The housekeeping gene, β-actin, was used as an internal control because of the established consistent results in CRC tissues [
35]. The Ct values <35 for all target genes and <30 for housekeeping genes were included in the gene expression analysis. The gene expression analysis was performed as previously reported [
30,
36,
37]. If the fold change value was greater than 1, the gene expression level was categorised as high; conversely, if it was less than 1, the expression level was considered low. Healthy blood samples (
n = 6) were used as calibrators to exclude the possible leukocyte contamination in CTC fractions, as discussed in the previous reports [
30].
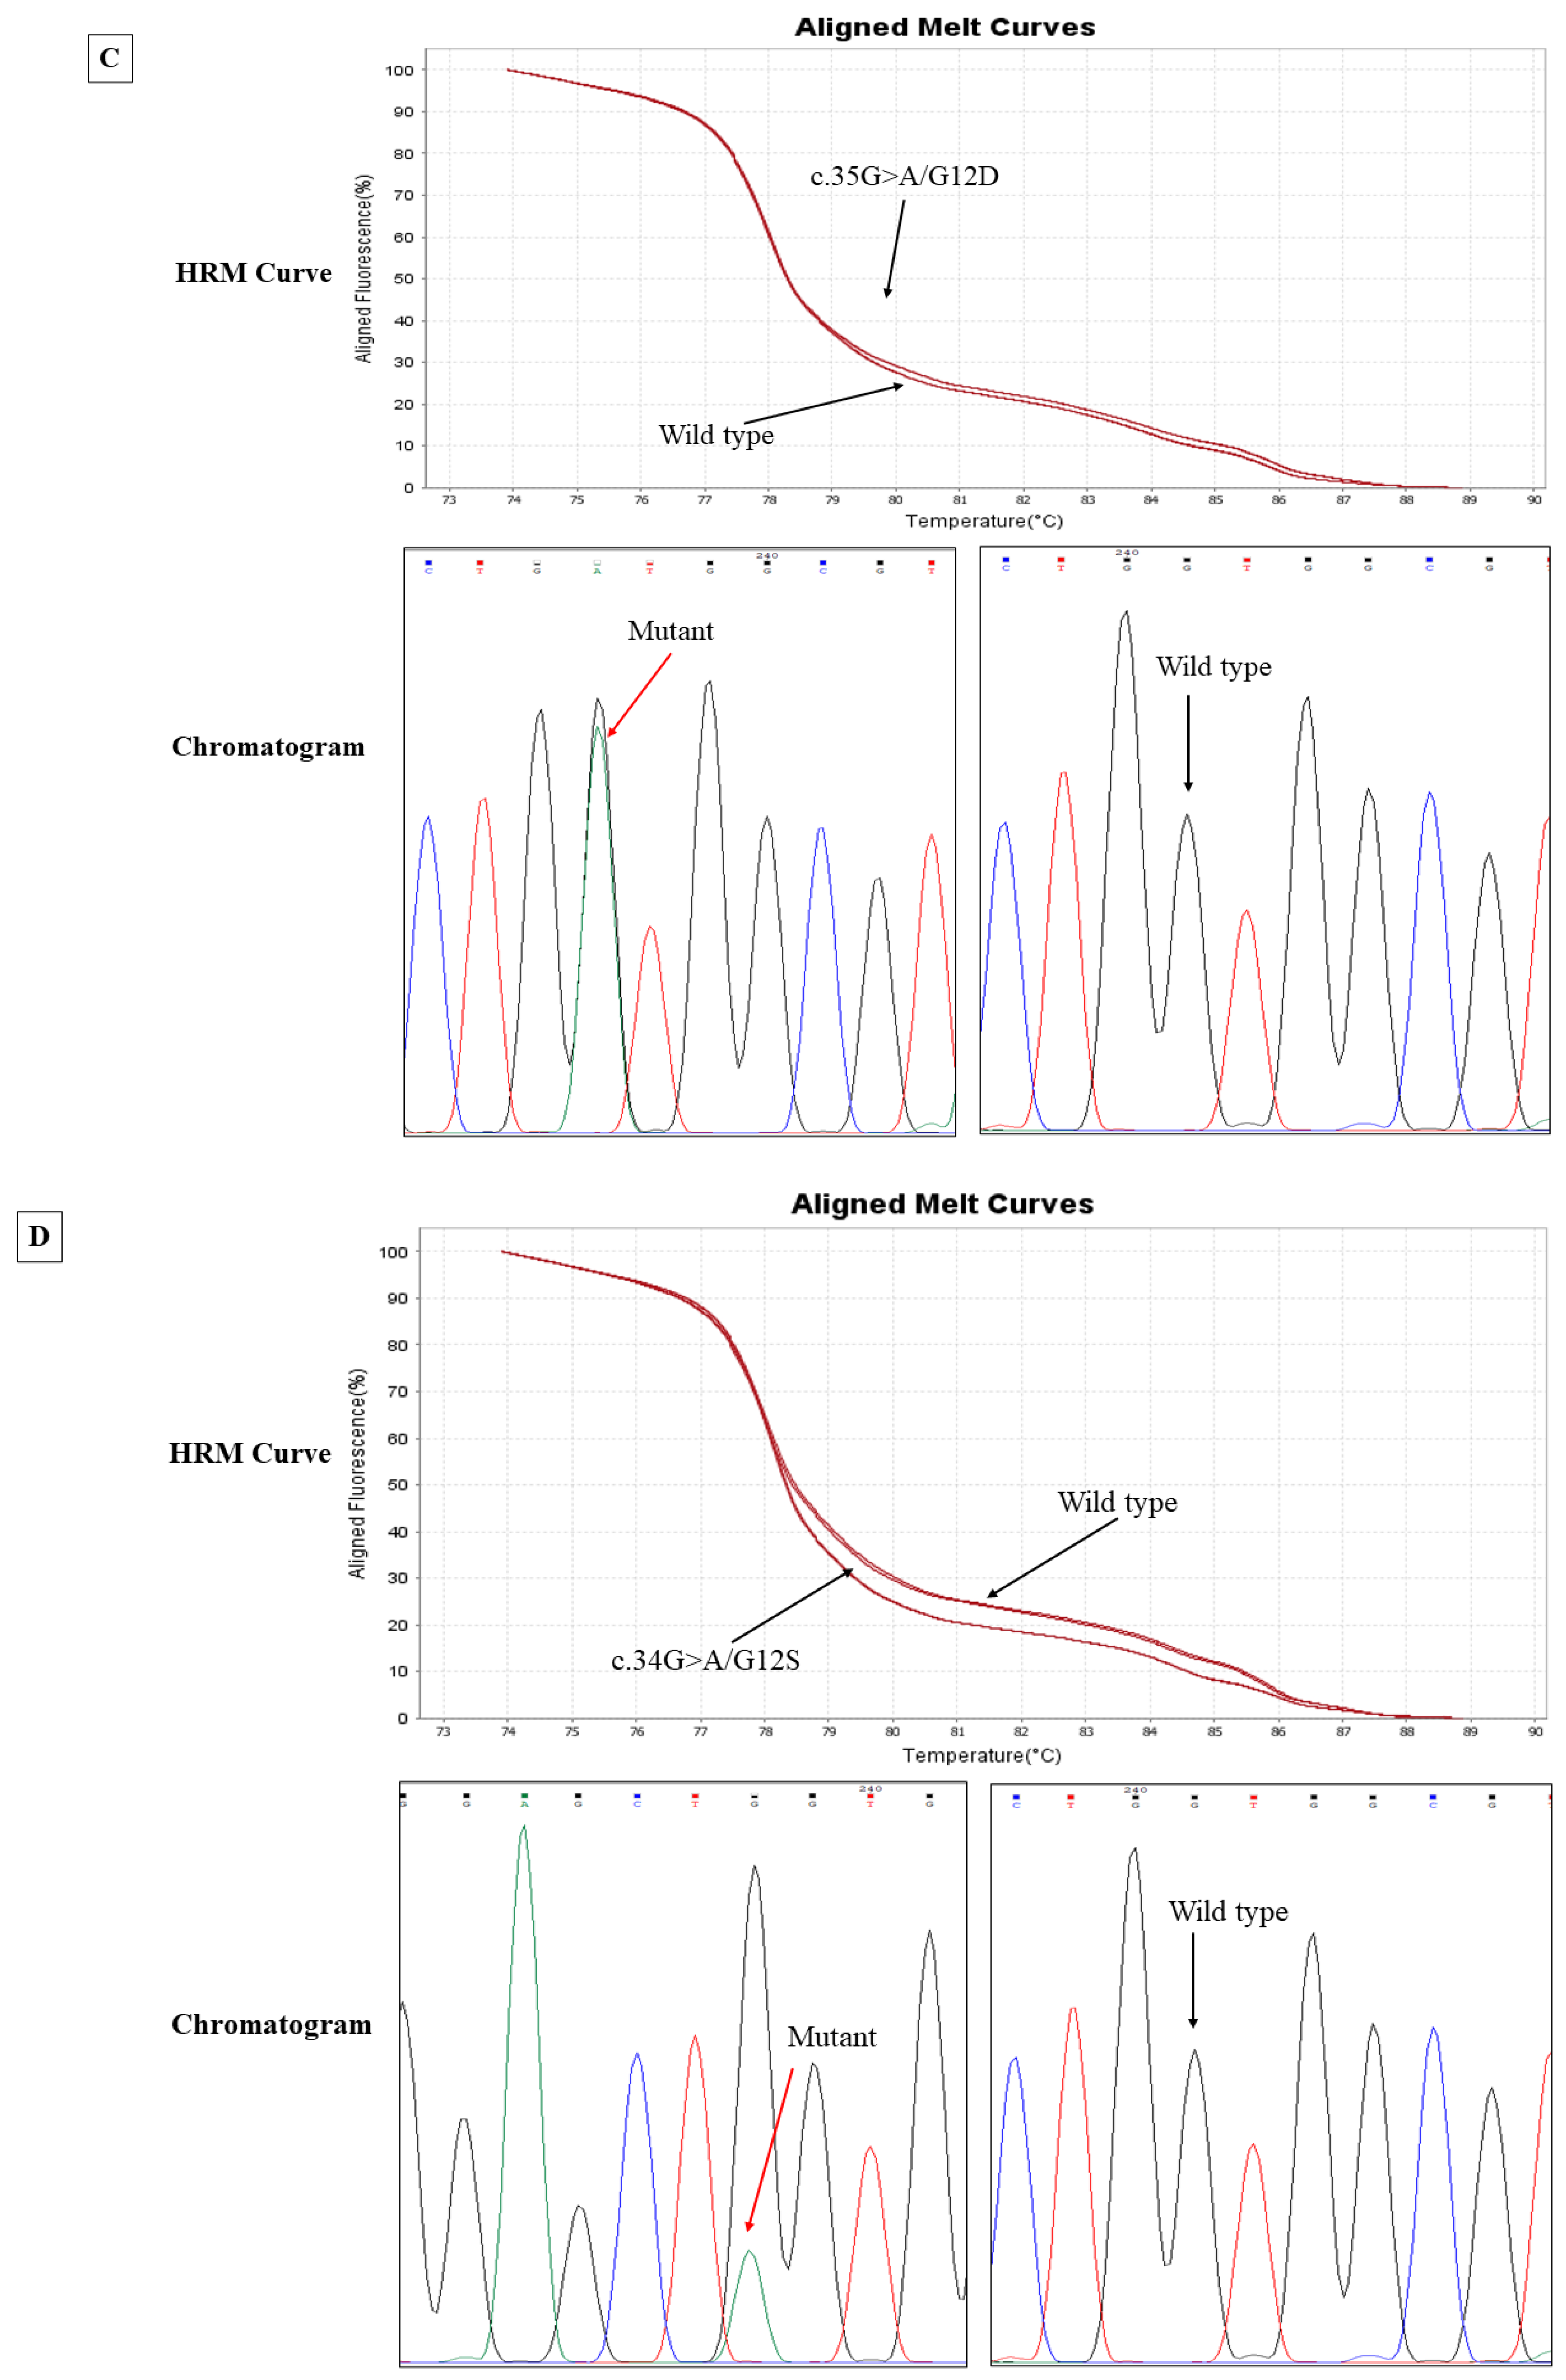
2.7. High-Resolution Melt (HRM) Curve Analysis
Genomic DNA extracted from CRC tissues and matched CTCs were used for HRM analysis to screen the mutations in the
KRAS gene at known mutation sites. HRM curve analysis and target gene amplification were performed on QuantStudio 6/7 Flex systems using HRM software version 3.2 (Thermo Fisher, Waltham, MA, USA). Exons 2 and 3 of
KRAS were amplified using SensiMIX HRM mastermix (Meridian Bioscience, Cincinnati, OH, USA) following the manufacturer’s protocol. Melt curves were recorded for every 0.05 °C/s temperature rise between 65 and 85 °C. When both replicates of HRM analysis showed a variation relative to the wild type, we considered the result as a mutant, as described in previous reports [
38,
39,
40].
2.8. Sanger Sequencing
Following HRM, the unpurified products were sent to the Australian Genome Research Facility (AGRF) for sequencing. The unpurified PCR products were first cleaned up from gel and purified within the AGRF facility and then sequenced using the respective forward and reverse primer by the Big Dye Terminator chemistry version 3.1 (Applied Biosystems, Foster City, CA, USA) with standardised cycling PCR conditions and analysed by the 3730xl Capillary sequencer (Applied Biosystems). The DNA sequencing reactions were produced by following the AGRF sample preparation guide. The resultant chromatograms were analysed by a sequence analyser, Chromas 2.5.0 software. The identification of mutations was made by NCBI BLAST: Basic Local Alignment Tool (
https://blast.ncbi.nlm.nih.gov/Blast.cgi, accessed on 15 February 2023) and further verified by Indigo: Rapid Indel Discovery in Sanger Chromatograms (
https://www.gear-genomics.com/indigo, accessed on 15 February 2023). Both forward and reverse sequences were meticulously analysed to confirm mutations.
2.9. Statistical Analysis
Gene expression analysis of KRAS and CTLA-4 in CTCs and matched tumour tissues was performed using GraphPad Prism 7 (San Diego, CA, USA). Comparisons of KRAS and CTLA-4 expressions (fold changes) and KRAS mutation status and clinicopathological parameters were performed using the chi-square test, the likelihood ratio, and Fisher’s exact test (Version 29; IBM SPSS Inc., Armonk, NY, USA). The statistical significance level was considered at p < 0.05.
4. Discussion
Since CTCs can provide real-time information regarding tumour biology, genotyping them can provide a platform for research into cellular heterogeneities, resistance mechanisms, and therapeutic targets in cancer. In this study, we compared the prevalence of KRAS mutations in CTCs to that of their corresponding primary tumours from patients with CRC.
We found no concordance of
KRAS status between CTC and primary tumours, which is consistent with a previous report [
41]. However, few previous studies found higher concordance between CTCs and primary tumours [
42,
43,
44,
45]. This discrepancy may happen because the CTC subclone that is shed into the bloodstream might be genetically distinct from the primary tumour sections that were analysed. Several studies have also attempted to account for the fact that CTCs harbouring
KRAS mutations are dissimilar to their matched primary tumours [
26,
45,
46,
47]. Intratumor heterogeneity is one of the reasons for this discordance, suggesting that both
KRAS wild-type and mutant subpopulations of cells may coexist within the same tumour and compete with one another for shedding into the bloodstream. Another reason is that as tumours evolve, CTCs may acquire unique mutations, which could explain why mutations exist in CTCs but not in the primary tumours. Despite the low sample size, these findings could imply that
KRAS wild-type CTCs are often found in the peripheral blood of patients harbouring mutant primary tumours.
KRAS mutant status was associated with unique clinical–pathological features in patients with CRC. Most mutations in the current study, in both CTCs and CRC tissues, were from advanced local tumour spread and pathological stages and showed a higher rate of lymph nodes with metastatic carcinoma. These findings are consistent with previous findings that patients with
KRAS mutations are more likely to be aggressive, which promotes tumour progression [
48,
49]. Previous research also supports the hypothesis that
KRAS mutations are more common in patients exhibiting the microsatellite stability phenotype [
48,
50]. Perineural invasion (PNI) is associated with a poorer prognosis, because neoplastic cells positioned along nerve fascicles are difficult to remove during radical surgery, leading to disease recurrence [
51,
52,
53]. In the current study, almost all patients with perineural invasion had
KRAS mutations, suggesting that
KRAS mutation status can predict tumour growth and progression as well as recurrence, though we did not find any correlation between
KRAS status and disease recurrence. The lack of association between CTCs and primary tumours may be due to the low frequency of mutations and the small number of cases analysed.
The present work also investigated KRAS and CTLA-4 mRNA expression in CTCs and matched primary tumour tissues. A correlation between these two genes suggests a potential role of CTLA-4 in the KRAS-mediated carcinogenic pathway. It is worth noting that high expression of CTLA-4 is observed in most KRAS-mutated CTCs and CRC tissues. Additionally, higher CTLA-4 expression was more likely to be aggressive, to be of higher histological grade and advanced tumour stages, as well as advanced pathological stages. These results suggest the cancer-promoting function of CTLA-4 in CRC through immune escape pathways, thus facilitating tumour spread.
However, different CTC subpopulations and the usage of CTC fractions rather than a single CTC, which might be contaminated with diverse cell populations such as leukocytes or normal epithelial cells due to the limitation of the CTC isolation procedure, may confound the conclusions of the current experiment. Molecular characterisation of CTCs at the single-cell level would avoid this limitation. To address this problem, three blood samples from patients negative for CTCs were analysed for
KRAS mutations, as discussed in a previous report [
42]. Although no mutations were found, PCR amplification detected the presence of haematopoietic cells in those samples. Nonetheless, it is suggested that the constraints inherent in the process of amplification and sequencing could potentially contribute to the observed heterogeneity [
26]. Moreover, the utilisation of distinct sequencing techniques could potentially lead to disparate outcomes in terms of mutations detected. In a comparative study involving high-resolution melt (HRM), allele-specific PCR (ASPCR), and pyrosequencing methods, Suhaimi et al. observed discrepancies in the mutation status determined through the aforementioned approaches [
47].
In conclusion, given the inherent restrictions of current molecular biomarkers due to intratumor heterogeneity, these results may facilitate the assessment of clonal dynamics in a single individual patient. However, due to the limited number of KRAS mutations detected in CTCs, we could not show the correlation between CTLA-4 expression and KRAS mutations in CTCs. More research is warranted to determine the clinical significance of genomic profiling of CTCs during KRAS-mediated CRC carcinogenesis in predicting responsiveness to anti-CTLA-4 targeted therapy.


 ,
, 


