Article

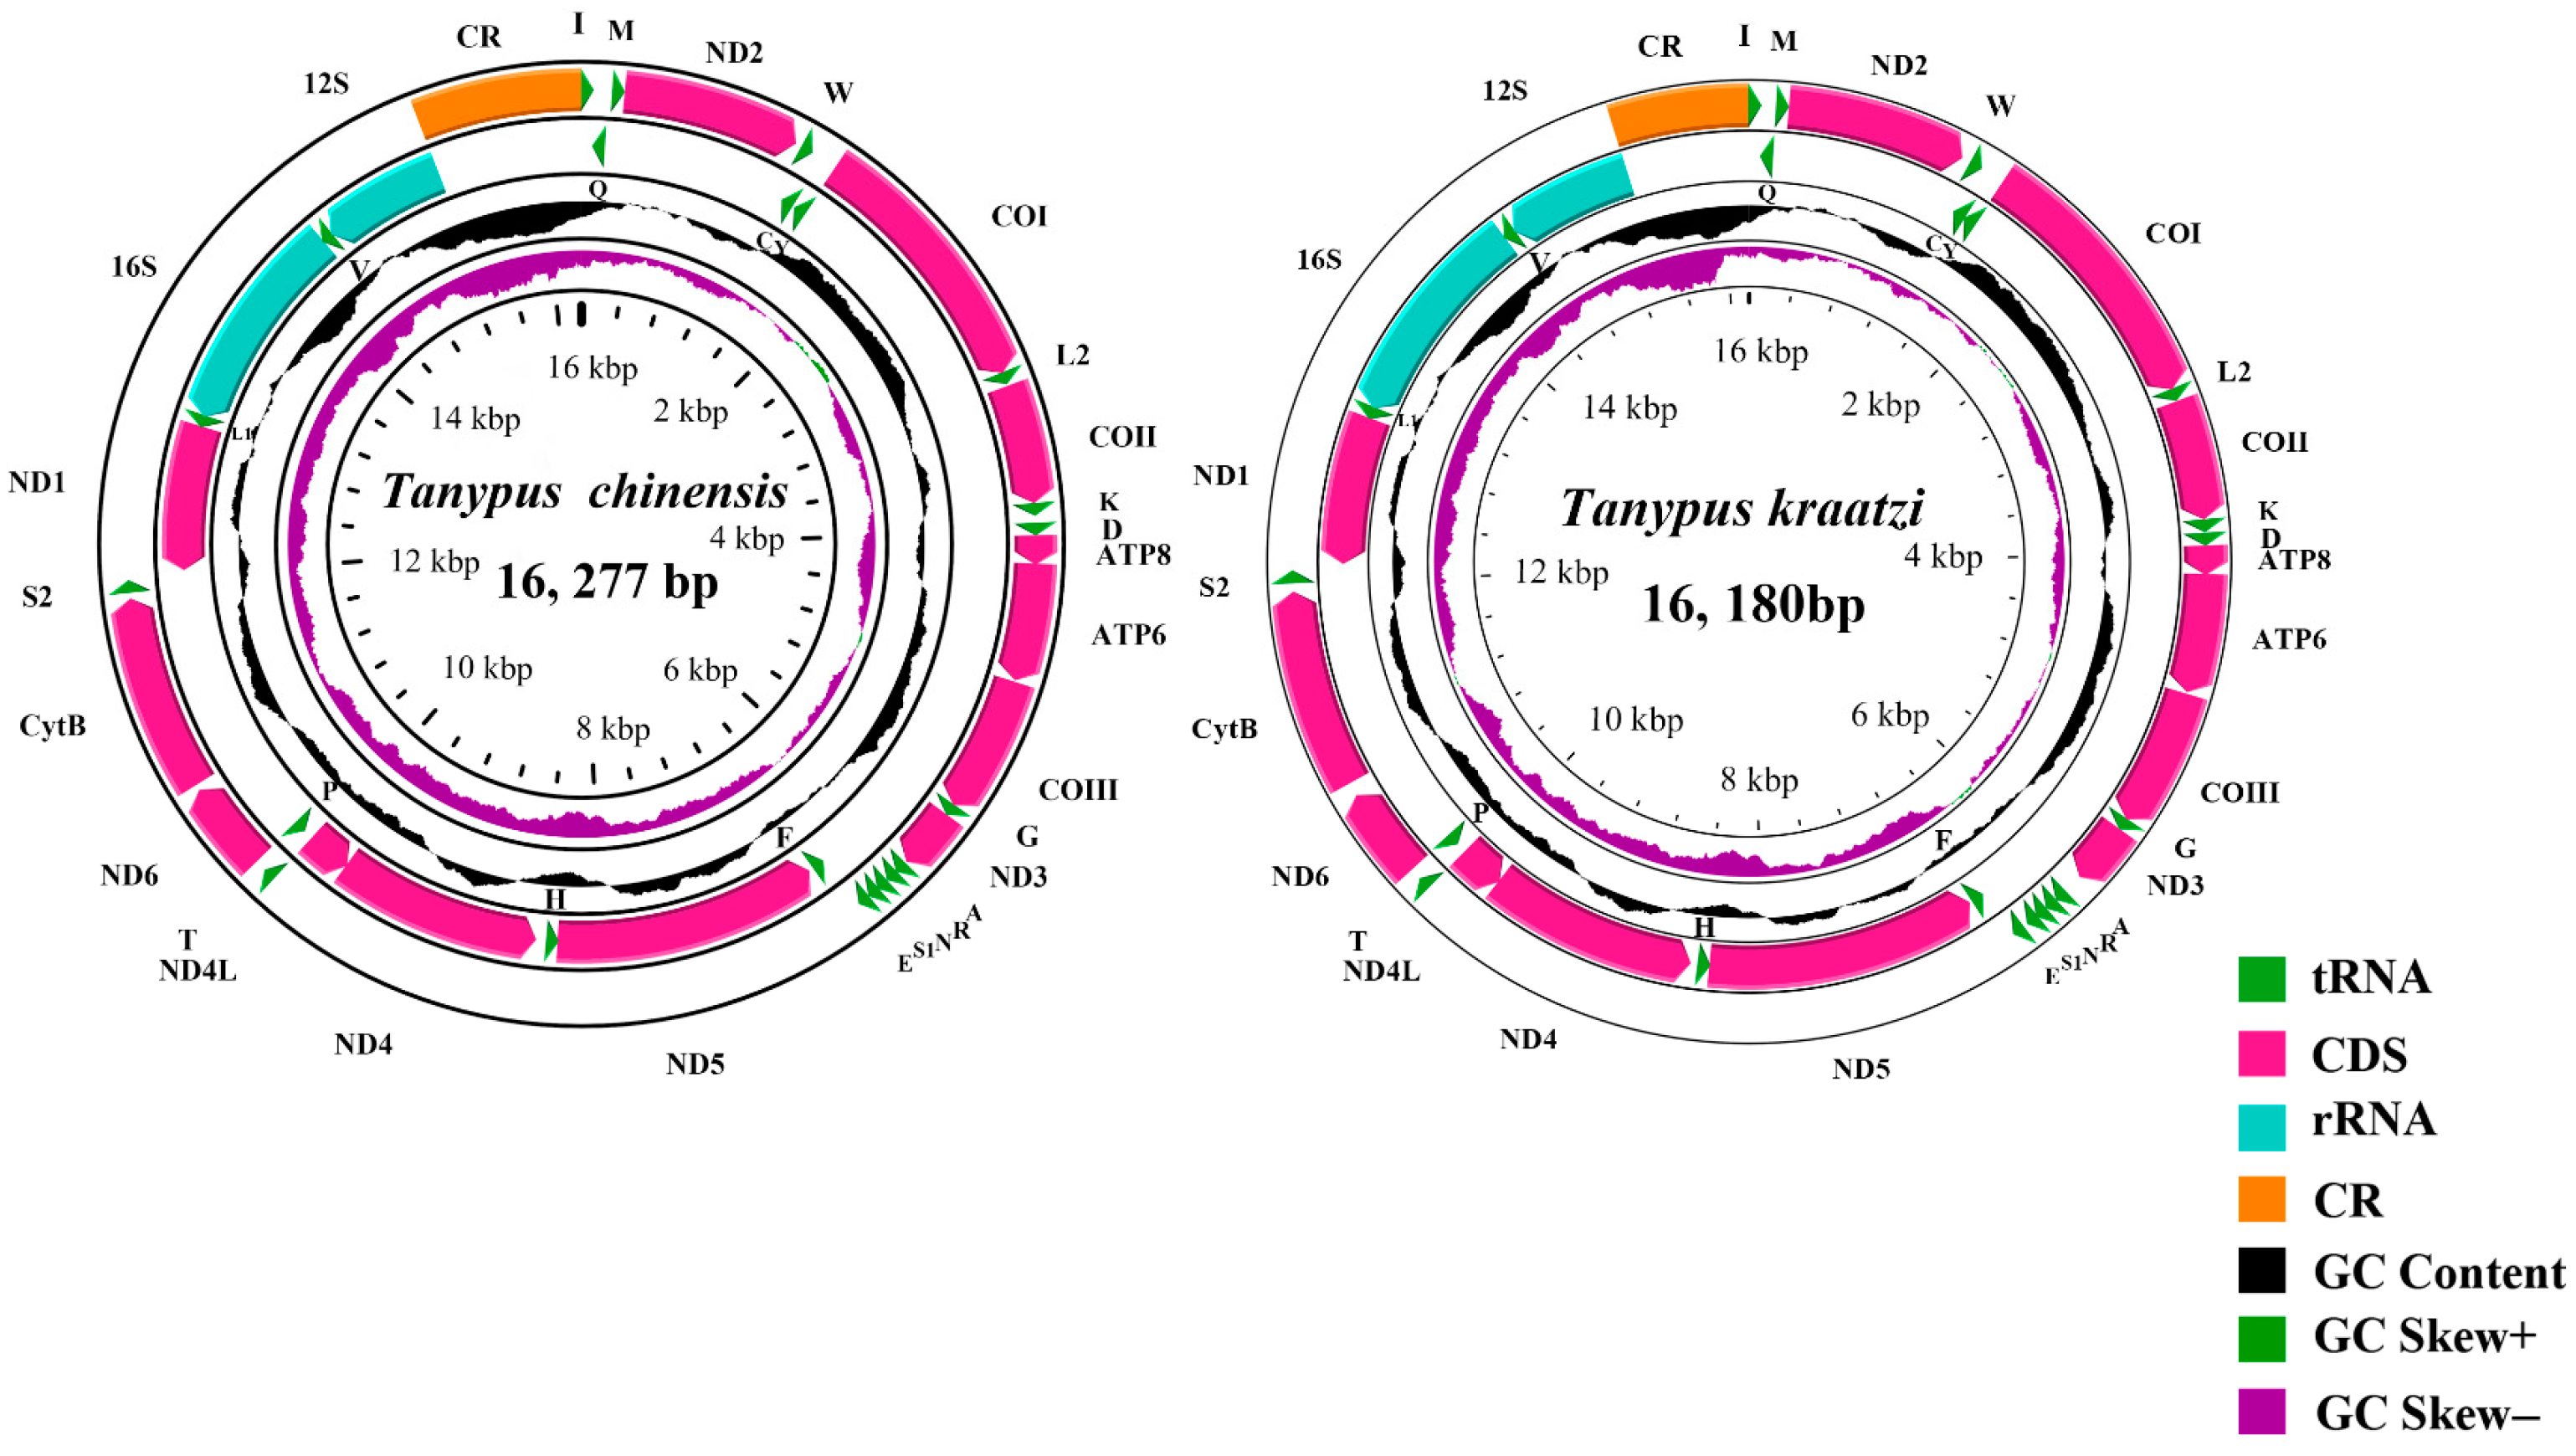
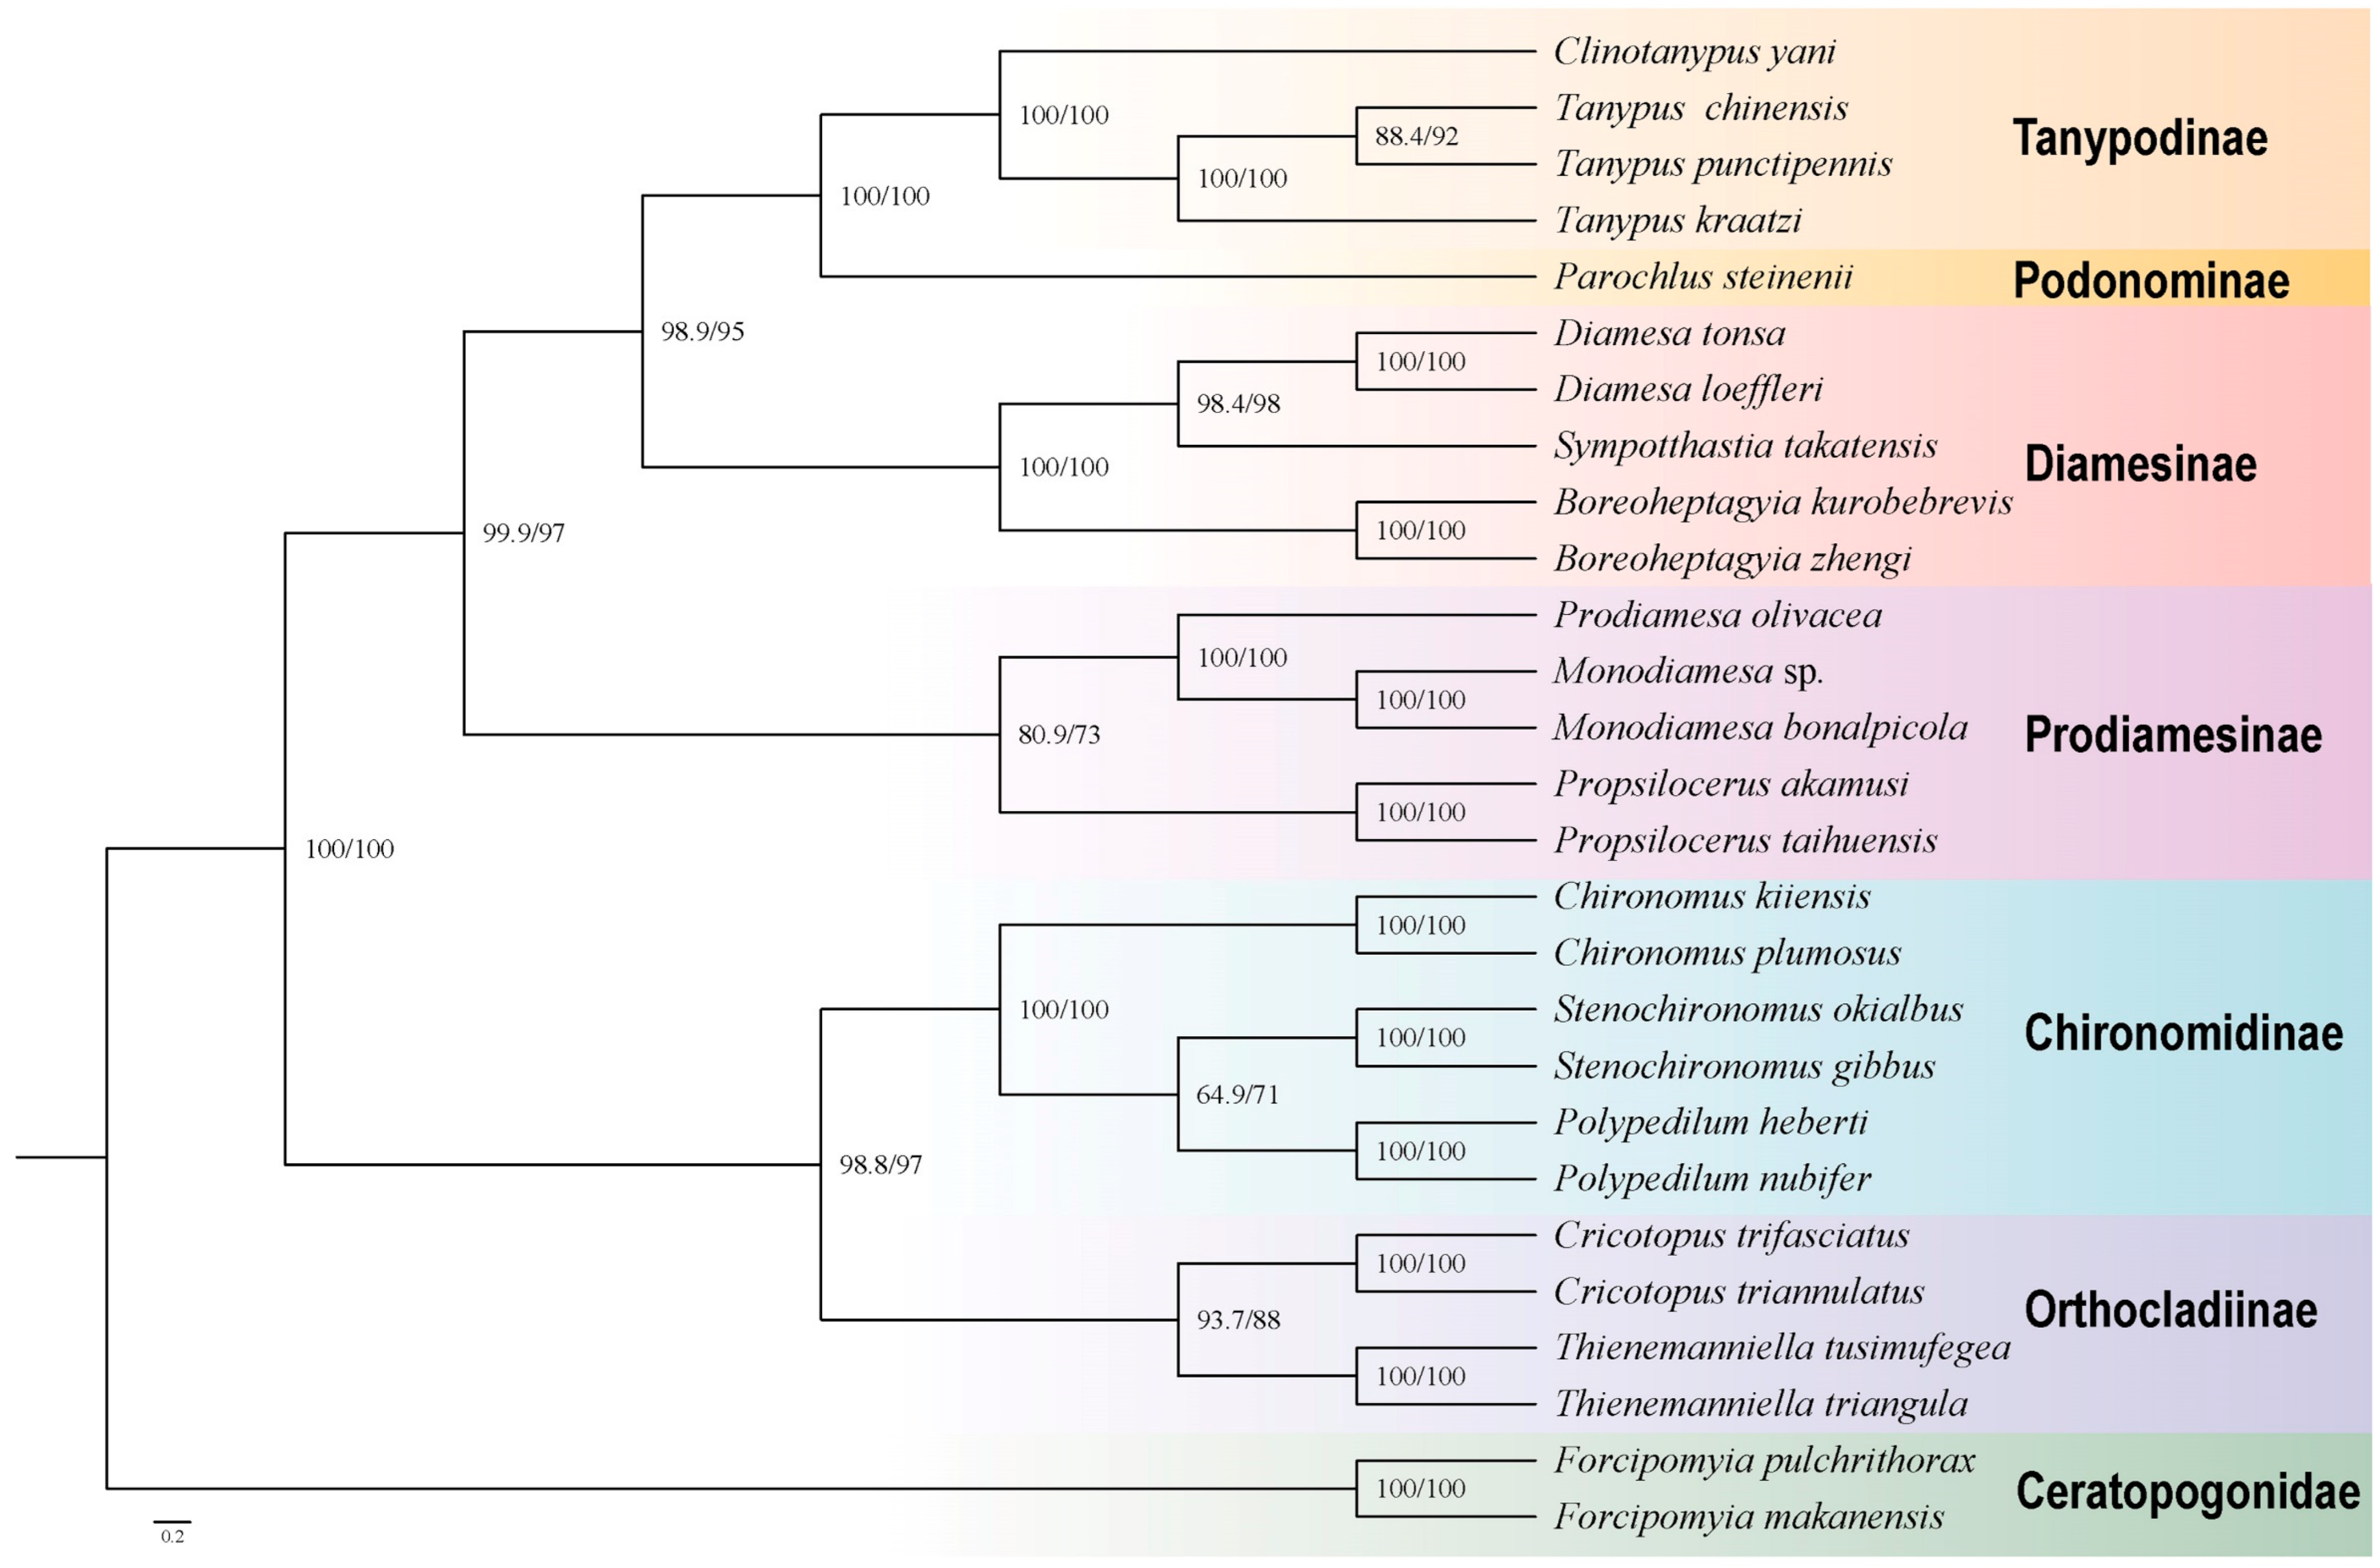
Complete Mitochondrial Genome of Tanypus chinensis and Tanypus kraatzi (Diptera: Chironomidae): Characterization and Phylogenetic Implications

1
Yinshanbeilu Grassland Eco-Hydrology National Observation and Research Station, China Institute of Water Resources and Hydropower Research, Beijing 100038, China
2
Grassland Research Institute of Chinese Academy of Agricultural Science, Hohhot 010010, China
3
Tianjin Key Laboratory of Conservation and Utilization of Animal Diversity, Tianjin Normal University, Tianjin 300387, China
4
College of Prataculture, Qingdao Agricultural University, Qingdao 266109, China
5
Changjiang Basin Ecology and Environment Monitoring and Scientific Research Center, Changjiang Basin Ecology and Environment Administration, Ministry of Ecology and Environment, Wuhan 430010, China
*
Authors to whom correspondence should be addressed.
Genes 2024, 15(10), 1281; https://doi.org/10.3390/genes15101281 (registering DOI)
Submission received: 9 September 2024 / Revised: 23 September 2024 / Accepted: 26 September 2024 / Published: 29 September 2024

Abstract

:
Background: Chironomidae occupy a pivotal position within global aquatic ecosystems. The unique structural attributes of the mitochondrial genome provide profound insights and compelling evidence, underpinning the morphological classification of organisms and substantially advancing our understanding of the phylogenetic relationships within Chironomidae. Results: We have meticulously sequenced, assembled, and annotated the mitogenomes of Tanypus chinensis (Wang, 1994) and Tanypus kraatzi (Kieffer, 1912), incorporating an additional 25 previously published mitogenomes into our comprehensive analysis. This extensive dataset enables us to delve deeper into the intricate characteristics and nuances of these mitogenomes, facilitating a more nuanced understanding of their genetic makeup. Conclusions: The genomic nucleotide composition of T. kraatzi was 39.10% A, 36.51% T, 14.33% C, and 10.06% G, with a total length of 1508 bp. The genomic nucleotide composition of T. chinensis was 39.61% A, 36.27% T, 14.55% C, and 9.57% G, with a total length of 1503 bp. This significant enrichment of the chironomid mitogenome library establishes a novel foundation for further exploration in the realm of phylogenetics.

1. Introduction

Chironomidae, a group of Diptera insects belonging to the suborder of Nematocera, known as non-biting midges in adults and bloodworms during the larval stage, occupy a pivotal position within global aquatic ecosystems [1,2]. Their unparalleled species diversity and remarkable resilience to diverse environmental fluctuations render them an exemplary model for delving into the mechanisms of genetic adaptability among aquatic insects [3]. The Chironomidae family, comprising an extensive array of 11 sub-families, boasts an impressive tally of over 6200 species [2]. Among these, the subfamilies of Orthocladiinae, Tanypodinae, and Chironominae stand out, housing the largest concentration of species and exhibiting a widespread distribution across the globe [4].
Tanypus, erected by Meigen in 1803, serves as the type genus of the Tanypodinae subfamily [5]. The larvae of those species reside in sediments found within stagnant and slowly flowing water bodies, particularly in temperate to warm climatic zones [6]. Remarkably, they exhibit a remarkable tolerance to high nutrient concentrations and varying degrees of salinity in these environments [6]. Currently, there are 30 species recorded globally within this genus, with only 3 species documented in China [5,7]. Tanypus punctipennis Meigen 1818 is widely distributed worldwide, including many regions in China [5]. Tanypus formosaus (Kieffer, 1912) is restricted to the distribution in Taiwan Province, China [8]. Tanypus chinensis Wang 1994 is currently restricted to a limited distribution in China within regions such as Guizhou Province, the Inner Mongolia Autonomous Region, Hunan Province, Liaoning Province, and Hebei Province [8]. Tanypus kraatzi (Kieffer, 1912) is a widely distributed species in the Palearctic region, yet there are currently no recorded occurrences of it within China. The first record of this species in China can be found in [5].
Recently, insect mitochondrial genomes have garnered substantial research attention, showcasing an extraordinary degree of conservation in their intricate structural architecture [9]. This remarkable feature underscores their significance as a subject of intense scientific scrutiny, revealing insights into the evolutionary history and functional mechanisms of these vital cellular organelles [9,10]. The distinctive attributes of the mitochondrial genome provide invaluable insights and robust evidence, profoundly enriching our comprehension of morphological classification [11]. This, in turn, contributes immensely to the advancement of Chironomidae phylogeny studies, offering a deeper understanding of the evolutionary relationships and diversity within this fascinating insect group [12,13]. However, there are relatively few reports on the mitochondrial genomes of the subfamily Tanypodinae, with only two species, Clinotanypus yani (Cheng and Wang, 2008) and T. punctipennis Meigen 1818 having their mitochondrial genomes annotated [13,14].
To gain more information on the mitochondrial genomes of the subfamily Tanypodinae, and to gain insights into the internal phylogenetic relationships within the Chironomidae, here we have sequenced, assembled, and annotated the mitogenomes of T. chinensis (Wang, 1994) and T. kraatzi (Kieffer, 1912). Adult males of those two species are readily characterized by the possession of an ovoid scutal tubercle. Furthermore, to gain a deeper understanding of the mitogenome characteristics, we integrated 25 previously published mitogenomes into our analysis. Employing robust Bayesian Inference (BI) and Maximum Likelihood (ML) methods across diverse databases, we reconstructed the intricate phylogenetic relationships among the subfamilies Tanypodinae, Podonominae, Diamesinae, Prodiamesinae, Chironomidae, and Orthocladiinae. This comprehensive analysis, encompassing 27 mitochondrial genomes, was augmented by selecting the family Ceratopogonidae as outgroups, providing valuable insights into the evolutionary history of these taxa.

2. Materials and Methods

2.1. Sampling and Sequencing

Samples of T. chinensis (three adult males) were collected from Huanghuagou Scenic Area, Wulanchabu City, Inner Mongolia Autonomous Region of China (112°52′91″ E, 41°13′30″ N) on 23 July 2018, and T. kraatzi (two adult males and one larva) from Lakes in Taizhou University, Taizhou City, Zhejiang Province of China (121°38′98″ E, 28°65′29″ N) on 14 July 2010. Species identification relies heavily on a dual approach encompassing morphological assessment and barcode comparison, with the morphological traits of the two species in question adhering to the descriptions outlined in [15,16]. The genomic DNA was meticulously extracted from the thorax and leg tissues, utilizing the Qiagen DNA Blood and Tissue Kit at Tianjin Normal University (TJNU), Tianjin, China, adhering to the standardized protocol. Prior to the DNA extraction process and morphological examination, all samples underwent a preservation step in a solution of 85% ethanol since the time of collection, maintained at a temperature of −20 °C. These voucher specimens have been archived at the College of Life Sciences, TJNU, in Tianjin, China, ensuring their availability for future reference and analytical endeavors.
To amplify the standard 658 bp mitochondrial cytochrome c oxidase subunit I (COI) barcode region, we employed universal primers LCO1490 and HCO2198, adhering to the methodologies established in [17,18]. Subsequently, the entire genome sequences were entrusted to Berry Genomics, Beijing, China, for high-throughput sequencing. The Illumina Truseq Nano DNA HT Sample Preparation Kit (USA) facilitated the preparation of sequencing libraries, ensuring optimal conditions for downstream analyses.
Utilizing the Illumina Nova 6000 platform (PE150), we sequenced DNA fragments with an insert size of 350 bp, adopting a paired-end strategy that maximized data throughput. The raw sequencing reads were then subjected to rigorous quality control, where Trimmomatic was employed to trim and clean the data, eliminating low-quality sequences and artifacts. The resulting high-quality, clean reads were subsequently utilized for downstream bioinformatics analyses [19], marking the first step towards elucidating the genetic makeup and evolutionary relationships of these species.

2.2. Assembly, Annotation, and Composition Analyses

To reconstruct the mitogenome sequences from scratch, we leveraged NOVOPlasty v3.8.3 (Brussels, Belgium), utilizing the COI barcoding sequence as the initial seed and experimenting with a diverse range of k-mer sizes, spanning from 23 to 39 bp, to optimize the assembly process [20]. The annotation of the assembled mitogenome adhered to the rigorous methodology outlined in [13], ensuring accurate identification of functional elements. The secondary structure of tRNAs was meticulously examined using the MITOS 2 WebServer, providing insights into their conformational features. For the annotation of rRNAs and Protein-Coding Genes (PCGs), we adopted a hybrid approach, initially leveraging the Clustal Omega algorithm within Geneious for automated annotations, followed by manual refinement to ensure accuracy. Furthermore, the Clustal W function integrated within MEGA 11 was employed as an additional layer of verification, refining the boundaries of rRNAs and PCGs [21,22]. To gain insights into the nucleotide composition and biases within the mitogenome, we utilized SeqKit v0.16.0, a powerful tool developed in Chongqing, China [23]. This analysis revealed not only the overall nucleotide composition but also the specific composition of each gene. The visual representation of the mitogenome was crafted using the CGView server URL: https://cgview.ca/ (accessed on 25 March 2024), providing a comprehensive and intuitive overview of the genetic architecture. To delve deeper into the codon usage patterns, we employed MEGA 11 [24], which facilitated the calculation of nucleotide composition, codon usage, and relative synonymous codon usage. Additionally, we quantified the bias in nucleotide composition using the AT-skew, defined as (A − T)/(A + T), and the GC-skew, calculated as (G − C)/(G + C), offering insights into the potential evolutionary pressures shaping the mitogenome. Lastly, to understand the evolutionary dynamics of the mitogenome, we computed the synonymous (Ks) and non-synonymous substitution rates (Ka) using DnaSP6 [25]. This analysis shed light on the selective pressures acting on the mitogenome, distinguishing between changes that alter amino acid sequences (non-synonymous) and those that do not (synonymous).
Table 1. Mitogenomes of the 27 species used in this study.
FamilySpeciesGenBank
Accession Number
Reference
ChironomidaeClinotanypus yaniMW373524[2]
Tanypus chinensisPQ014462This study
Tanypus punctipennisMZ475054[14]
Tanypus kraatziPQ014453This study
Parochlus steineniiNC027591NCBI
Diamesa tonsaMZ158292[11]
Diamesa loefferiMZ127838[11]
Sympotthastia takatensisMZ231026[11]
Boreoheptagyia kurobebrevisMZ043576[11]
Boreoheptagyia zhengiOM302508[11]
Prodiamesa olivaceaMW373525[26]
Monodiamesa sp.MW837769[26]
Monodiamesa bonalpicolaMW837770[26]
Propsilocerus akamusiMW846253[26]
Propsilocerus taihuensisMW837766[26]
Chironomus kiiensisON838253[27]
Chironomus plumosusON838252[27]
Stenochironomus okialbusOL753645[12]
Stenochironomus gibbusOL742440[12]
Polypedilum hebertiOP950225[12]
Polypedilum nubiferMZ747090[27]
Cricotopus trifasciatusOP006250[28]
Cricotopus triannulatusOP006254[28]
Thienemanniella tusimufegeaOR333983[29]
Thienemanniella triangulaOR333981[29]
CeratopogonidaeForcipomvia pulchrithoraxNC084322[30]
Forcipomyia makanensisMK000395[31]

2.3. Phylogenetic Analyses

To delve into the phylogenetic positioning of T. chinensis and T. kraatzi, mitochondrial genome sequences of 27 registered Chironomidae species were retrieved from GenBank at NCBI in Table 1. This comprehensive dataset encompassed six Chironominae species, five Diamesinae species, four Orthocladiinae species, five Prodiamesinae species, two Tanypodinae species, and one Podonominae species. Forcipomyia makanensis and Forcipomyia pulchrithorax (Diptera: Ceratopogonidae: Forcipomyiinae) were used as an outgroup (Table 1). For conducting phylogenetic analysis, a meticulous selection of 27 mitochondrial genomes was made, from which 2 rRNAs and 13 Protein-Coding Genes (PCGs) were extracted. To align these sequences accurately, MAFFT (Osaka, Japan) was utilized, adopting the L-INS-I method to eliminate ambiguous alignment regions for both nucleotide and protein sequences in a batch process. Following alignment, Trimal v1.4.1 (Barcelona, Spain) was applied to refine the alignments by trimming, ensuring high-quality data for further phylogenetic analyses. Five distinct data matrices were generated using FASconCAT-G v1.04 (Santa Cruz, CA, USA), each tailored to capture different aspects of the genetic information. PCG Matrix: comprising all three codon positions of the 13 PCGs, providing a comprehensive view of the coding region. PCG_RNA Matrix: enlarging the scope to include both the 13 PCGs (all codon positions) and the 2 rRNAs, integrating both coding and non-coding elements. PCG12_RNA Matrix: selectively incorporating the first and second codon positions of the PCGs alongside the rRNAs, focusing on the most conserved regions of the coding genes. PCG12 Matrix: narrowing down to just the first and second codon positions of the 13 PCGs, emphasizing the evolutionary signal within these key positions. PCG_AA Matrix: utilizing the amino acid sequences derived from the 13 PCGs, abstracting away from nucleotide-level variations to assess protein-level relationships. To evaluate the heterogeneity among these diverse matrices, AliGROOVE v1.06 (Bonn, Germany) was engaged, leveraging insights from previous studies [17,32,33] as benchmarks. Subsequently, two phylogenetic trees were constructed: a Maximum Likelihood (ML) tree using IQ-tree v2.0.7, and a Bayesian Inference (BI) tree utilizing Phylobayes-MPI v1.8. These analyses offered robust insights into the evolutionary relationships among the mitochondrial genomes under study.

3. Results

The complete mitogenome of T. kraatzi was 16,180 bp and T. chinensis was 16,266 bp long. They consist of 13 Protein-Coding Genes (PCGs), 22 tRNA genes, 2 rRNA genes (totaling 37 genes), and 1 Control Region (Figure 1).
The genomic nucleotide composition of T. kraatzi was 39.10% A, 36.51% T, 14.33% C, and 10.06% G, with an A + T bias of 75.61%. The total length of the 13 PCGs in the mitochondrial genome was 11,216 bp. Most PCGs start with ATN codon excluding COX1 (ACG) and ND5 (GTG). The length of the tRNA genes ranged from 63 to 72 bp (Figure S1), with a total length of 1508 bp. The lengths of the 12S rRNA and 16S rRNA were 811 and 1382 bp, respectively (Table 2).
The genomic nucleotide composition of T. chinensis was 39.61% A, 36.27% T, 14.55% C, and 9.57% G, with an A + T bias of 75.88%. The total length of the 13 PCGs in the mitochondrial genome was 11,216 bp. Most PCGs start with ATN codon excluding COX1 (ACG), ND,1 and ND5 (GTG). The length of the tRNA genes ranged from 64 to 72 bp (Figure S2), with a total length of 1503 bp. The lengths of the 12S rRNA and 16S rRNA were 807 and 1395 bp (Table 3).
The Ka/Ks ratio (ω), a metric for quantifying evolutionary sequence rates under natural selection, consistently fell below one across all 13 Protein-Coding Genes (PCGs) in our study, mirroring trends in other insect species. Varying from 0.025 (COX1) to 0.299 (ATP8), these rates suggest varying levels of purifying selection, with ATP8 evolving fastest and COX1 slowest (Figure 2). Genes under stronger purifying selection, like COX2 and COX1, exhibit lower ω values, while ATP8, ND6, and ND5 reflect a more relaxed selection pressure. These findings underscore the role of natural selection in shaping PCG evolution.
The analysis of heterogeneity divergence differences provides a window into the similarities existing in mitochondrial gene sequences across distinct species. Notably, owing to the degeneracy of codons, the dataset AA exhibited the least heterogeneity, whereas the cds12_rRNA dataset displayed a relatively higher degree of heterogeneity (Figure 3).

4. Discussion

This observation suggests that the mutation rate of the third codon in Protein-Coding Genes (PCG) surpassed that of the first and second codons. Consequently, the positions of the third codons were deemed unsuitable for reconstructing the phylogenetic relationship among the three genera. In our study, we harnessed the power of Bayesian Inference (BI) and Maximum Likelihood (ML) methods, utilizing five distinct matrices that culminated in the generation of ten phylogenetic trees. Our data revealed that T. kraatzi and T. chinensis belonged to the Tanypodinae and were close to the C. yani (Figure 4). They reveal that T. chinensis is a sister taxon to T. punctipennis, and T. kraatzi is a sister taxon to (T. punctipennis + T. chinensis).
In our study, the subfamilies of Tanypodinae and Podonominae were covered to be sister groups, which is consistent with previous morphological-based studies on the internal phylogenetic relationships within the Chironomidae [34,35,36,37,38]. Similarly, phylogenetic analyses based on several short sequence fragments also supported the two subfamilies as sister groups [39]. However, upon extensive sampling, the status of Tanypodinae and Podonominae as sister groups was not supported in subsequent studies such as [4].
The subfamilies Diamesinae and Prodiamesinae were found to be more closely related to the subfamilies Orthocladiinae and Chironomidiinae. Based on morphology, fragments such as COI I, CAD, 18S RNA, and 28S RNA were analyzed, and even studies based on mitochondrial genomes revealed a similar structure [4,25,39]. However, after we expanded the mitochondrial genomic information for species within the subfamilies Diamesinae and Prodiamesinae, the relationship between (((Tanypodinae + Podonominae) + Diamesinae) + Prodiamesinae) and (Orthocladiinae + Chironomidiinae) emerged as a sister group.
In our study, the subfamilies Tanypodinae and Podonominae were considered sister groups, which is largely consistent with previous research findings. Furthermore, Diamesinae was found to be a sister group to (Tanypodinae + Podonominae), resulting in the relationship between (((Tanypodinae + Podonominae) + Diamesinae) + Prodiamesinae) and (Orthocladiinae + Chironomidiinae) emerging as a sister group. This observation is inconsistent with previous results where Diamesinae and Prodiamesinae were based on a limited number of species referring to mitochondrial analysis, thereby offering new insights into the phylogenetic relationships within Chironomidae.

5. Conclusions

The mitochondrial genomes of the genus Tanypus, including those of two species, have been annotated, assembled, and reported for the first time. All newly sequenced mitogenomes had similar structural characters and nucleotide compositions to previously published Chironomidae data. This significant enrichment of the chironomid mitogenome library establishes a novel foundation for further exploration in the realm of phylogenetics.
Given the characteristic differences observed among the larvae, pupae, male, and female adults within different subfamilies of Chironomidae, there exist conflicts between phylogenetic results derived from morphology, short gene fragments, and even mitochondrial genome data. Nonetheless, a growing body of evidence from molecular biology-based phylogenetic relationships underscores the continuing significance of morphological analysis in Chironomid studies. Furthermore, although complete mitochondrial genomic analysis holds potential promise, it requires heightened scrutiny and critical attention. A comprehensive systematic analysis that integrates morphological, biogeographical, and life history characteristics across different life stages of insects, along with genomic data, is necessary and may provide insights into the natural evolutionary relationships.

Supplementary Materials

The following supporting information can be downloaded at https://www.mdpi.com/article/10.3390/genes15101281/s1, Figure S1: Putative secondary structures of the 22 tRNA genes identified in the mitogenome of Tanypus chinensis; Figure S2: Putative secondary structures of the 22 tRNA genes identified in the mitogenome of Tanypus kraatzi.

Author Contributions

Conceptualization, S.G. and X.G.; software, Y.Z. and C.W.; investigation, C.W., Y.Z. and Y.T.; data curation, S.G., W.L. and J.Z.; writing—original draft, W.L., X.G. and J.Z.; writing—review and editing, Y.T. and W.L.; supervision, W.L.; funding acquisition, J.Z. All authors have read and agreed to the published version of the manuscript.

Funding

This research was funded by the National Natural Science Foundation of China (32370489, 32400357) and Yinshanbeilu Grassland Ecohydrology National Observation and Research Station, China Institute of Water Resources and Hydropower Research, Beijing 100038, China, grant No. YSS2022013, YSS202308.

Institutional Review Board Statement

Not applicable.

Informed Consent Statement

Not applicable.

Data Availability Statement

All data are available in the manuscript or the Supplementary Materials.

Acknowledgments

We thank Haoran Yan (M-Grass Ecology And Environment (Group) Company Limited) for providing assistance in specimen collection.

Conflicts of Interest

The authors declare no conflicts of interest.

References

  1. Armitage, P.; Cranston, P.; Pinder, C. The Chironomidae: Biology and Ecology of Non-Biting Midges; Chapman & Hall: London, UK, 1995; 572p. [Google Scholar]
  2. Karima, Z. Chironomidae: Biology, Ecology and Systematics. In The Wonders of Diptera—Characteristics, Diversity, and Significance for the World’s Ecosystems; IntechOpen: London, UK, 2021; 188p. [Google Scholar] [CrossRef]
  3. Liu, W.; Chang, T.; Zhao, K.; Sun, X.; Qiao, H.; Yan, C.; Wang, Y. Genome-wide annotation of cuticular protein genes in non-biting midge Propsilocerus akamusi and transcriptome analysis of their response to heavy metal pollution. Int. J. Biol. Macromol. 2022, 223, 555–566. [Google Scholar] [CrossRef] [PubMed]
  4. Cranston, P.; Hardy, N.; Morse, G. A dated molecular phylogeny for the Chironomidae (Diptera). Syst. Entomol. 2011, 37, 172–188. [Google Scholar] [CrossRef]
  5. Ashe, P.; O’Connor, J.P. Part 1. Buchonomyiinae, Chilenomyiinae, Podonominae, Aphroteniinae, Tanypodinae, Usambaromyiinae, Diamesinae, Prodiamesinae and Telmatogetoninae. In A World Catalogue of Chironomidae (Diptera); Irish Biogeographical Society & National Museum of Ireland: Dublin, Ireland, 2009; 445p. [Google Scholar]
  6. Andersen, T.; Ekrem, T.; Cranston, P.S. The larvae of the Holarctic Chironomidae (Diptera)—Introduction. Insect Syst. Evol. Suppl. 2013, 66, 7–12. [Google Scholar]
  7. Silva, F.L.; Oliveira, C.S. Tanypus urszulae, a new Tanypodinae (Diptera: Chironomidae) from the Neotropical Region. Zootaxa 2016, 4178, 593–600. [Google Scholar] [CrossRef]
  8. Wang, X. A revised checklist of chironomids from China (Diptera). In Late 20th Century Research on Chironomidae: An Anthology from the 13th International Symposium on Chironomidae; Hoffrichter, O., Ed.; Shaker Verl: Aachen, Germany, 2000; pp. 629–652. [Google Scholar]
  9. Brown, W.M.; George, M.; Wilson, A.C. Rapid evolution of animal mitochondrial DNA. Proc. Natl. Acad. Sci. USA 1979, 76, 1967–1971. [Google Scholar] [CrossRef] [PubMed]
  10. Cameron, S. Insect Mitochondrial Genomics: Implications for Evolution and Phylogeny. Annu. Rev. Entomol. 2014, 59, 95–117. [Google Scholar] [CrossRef]
  11. Lin, X.; Liu, Z.; Yan, L.; Duan, X.; Bu, W.; Wang, X.; Zheng, C. Mitogenomes provide new insights of evolutionary history of Boreheptagyiini and Diamesini (Diptera: Chironomidae: Diamesinae). Ecol. Evol. 2022, 12, e8957. [Google Scholar] [CrossRef]
  12. Zhang, D.; He, F.; Li, X.; Aishan, Z.; Lin, X. New Mitogenomes of the Polypedilum Generic Complex (Diptera: Chironomidae): Characterization and Phylogenetic Implications. Insects 2023, 14, 238. [Google Scholar] [CrossRef]
  13. Zheng, C.; Ye, Z.; Zhu, X.; Zhang, H.; Dong, X.; Chen, P.; Bu, W. Integrative taxonomy uncovers hidden species diversity in the rheophilic genus Potamometra (Hemiptera: Gerridae). Zool. Scr. 2019, 49, 174–186. [Google Scholar] [CrossRef]
  14. Jiang, Y.; Zhao, Y.; Lin, X. First report of the complete mitogenome of Tanypus punctipennis Meigen, 1818 (Diptera, Chironomidae) from Hebei Province, China. Mitochondrial DNA Part B 2022, 7, 215–216. [Google Scholar] [CrossRef]
  15. Kieffer, J.J. Quelques nouveaux Tendipédides [Dipt.] obtenus d’éclosion (2e note). Bull. De La Soc. Entomol. De Fr. 1912, 4, 101–103. [Google Scholar] [CrossRef]
  16. Wang, S. New and little-known Chironomidae (Diptera) from the southern provinces of China. Entomotaxonomia 1994, 16, 135–148. [Google Scholar]
  17. Ge, X.; Zang, H.; Ye, X.; Peng, L.; Wang, B.; Lian, G.; Sun, C. Comparative Mitogenomic Analyses of Hydropsychidae Revealing the Novel Rearrangement of Protein-Coding Gene and tRNA (Trichoptera: Annulipalpia). Insects 2022, 13, 759. [Google Scholar] [CrossRef]
  18. Ge, X.Y.; Peng, L.; Vogler, P.A.; Morse, J.C.; Yang, L.F.; Sun, C.H.; Wang, B.X. Massive gene rearrangements of mitochondrial genomes and implications for the phylogeny of Trichoptera (Insecta), Trichoptera (Insecta). Syst. Entomol. 2023, 48, 278–295. [Google Scholar] [CrossRef]
  19. Bolger, A.; Lohse, M.; Usadel, B. Trimmomatic: A flexible trimmer for Illumina sequence data. Bioinformatics 2014, 30, 2114–2120. [Google Scholar] [CrossRef]
  20. Dierckxsens, N.; Mardulyn, P.; Smits, G. NOVOPlasty: De novo assembly of organelle genomes from whole genome data. Nucleic Acids Res. 2016, 45, e18. [Google Scholar] [CrossRef]
  21. Katoh, K.; Standley, D.M. MAFFT Multiple Sequence Alignment Software Version 7: Improvements in Performance and Usability. Mol. Biol. Evol. 2013, 30, 772–780. [Google Scholar] [CrossRef] [PubMed]
  22. Kumar, S.; Stecher, G.; Tamura, K. MEGA7: Molecular Evolutionary Genetics Analysis Version 7.0 for Bigger Datasets. Mol. Biol. Evol. 2016, 33, 1870–1874. [Google Scholar] [CrossRef] [PubMed]
  23. Shen, W.; Le, S.; Li, Y.; Hu, F. SeqKit: A Cross-Platform and Ultrafast Toolkit for FASTA/Q File Manipulation. PLoS ONE 2016, 11, e0163962. [Google Scholar] [CrossRef]
  24. Tamura, K.; Stecher, G.; Kumar, S. MEGA11: Molecular Evolutionary Genetics Analysis Version 11. Mol. Biol. Evol. 2021, 38, 3022–3027. [Google Scholar] [CrossRef]
  25. Rozas, J.; Ferrer-Mata, A.; Sánchez-DelBarrio, J.C.; Guirao-Rico, S.; Librado, P.; RamosOnsins, S.E.; Sánchez-Gracia, A. DnaSP 6: DNA Sequence Polymorphism Analysis of Large Data Sets. Mol. Biol. Evol. 2017, 34, 3299–3302. [Google Scholar] [CrossRef] [PubMed]
  26. Lin, X.; Zhao, Y.; Yan, L.; Liu, W.; Bu, W.; Wang, X.; Zheng, C. Mitogenomes provide new insights into the evolutionary history of Prodiamesinae (Diptera: Chironomidae). Zool. Scr. 2021, 51, 119–132. [Google Scholar] [CrossRef]
  27. Fang, X.; Wang, X.; Mao, B.; Xiao, Y.; Shen, M.; Fu, Y. Comparative mitogenome analyses of twelve non-biting flies and provide insights into the phylogeny of Chironomidae (Diptera: Culicomorpha). Sci. Rep. 2023, 13, 9200. [Google Scholar] [CrossRef]
  28. Li, S.; Chen, M.; Sun, L.; Wang, R.; Li, C.; Gresens, S.; Li, Z.; Lin, X. New mitogenomes from the genus Cricotopus (Diptera: Chironomidae, Orthocladiinae): Characterization and phylogenetic implications. Arch. Insect Biochem. Physiol. 2023, 115, e22067. [Google Scholar] [CrossRef]
  29. Qi, Y.; Bu, W.; Zheng, C.; Lin, X.; Jiao, K. New data on mitogenomes of Thienemanniella Kieffer, 1911 (Diptera: Chironomidae, Orthocladiinae). Arch. Insect Biochem. Physiol. 2023, 114, 1–9. [Google Scholar] [CrossRef]
  30. Karademir, G.K.; Teber, S.; Caner Kulig, C.; Toroslu, A.M.; Ibis, O.; YildirimI, A. Complete Mitochondrial Genome Analyses of Forcipomyia pulchrithorax (Diptera: Ceratopogonidae): Genome Orientation and Phylogenetic Implications. Kafkas Univ. Vet. Fak. Derg. 2023, 30, 223–231. [Google Scholar] [CrossRef]
  31. Jiang, X.; Han, X.; Liu, Q.; Hou, X. The mitochondrial genome of Forcipomyia makanensi (Insecta: Diptera: Ceratopogonidae). Mitochondrial DNA Part B 2019, 4, 344–345. [Google Scholar] [CrossRef]
  32. Capella-Gutiérrez, S.; Silla-Martínez, J.; Gabaldón, T. trimAl: A tool for automated alignment trimming in large-scale phylogenetic analyses. Bioinformatics 2009, 25, 1972–1973. [Google Scholar] [CrossRef]
  33. Kück, P.; Meid, S.A.; Groß, C.; Wägele, J.W.; Misof, B. AliGROOVE—Visualization of heterogeneous sequence divergence within multiple sequence alignments and 6 detection of inflated branch support. BMC Bioinform. 2014, 15, e294. [Google Scholar] [CrossRef]
  34. Brundin, L. Transantarctic relationships and their significance, as evidenced by chironomid midges with a monograph of the subfamilies Podonominae and Aphroteniinae and the austral Heptagyiae. K. Sven. Vetenskapsakademiens Handl. 1966, 11, 1–472. [Google Scholar]
  35. Brundin, K.; Sæther, O.A. Buchonomyia burmanica sp.n. and Buchonomyiinae, a new subfamily among the Chironomidae (Diptera). Zool. Scr. 1978, 7, 269–275. [Google Scholar] [CrossRef]
  36. Murray, D.A.; Ashe, P. A description of the adult female of Buchonomyia thienemanni Fittkau and a reassessment of the phylogenetic position of the subfamily Buchonomyiinae. Spix. Suppl. 1985, 11, 149–160. [Google Scholar]
  37. Sæther, O.A. Female genitalia in Chironomidae and other Nematocera: Morphology, phylogenies, keys. Bull. Fish. Res. Bd. Can. 1977, 1–209. [Google Scholar]
  38. Sæther, O.A. Phylogeny of the subfamilies of Chironomidae (Diptera). Syst. Entomol. 2000, 25, 393–403. [Google Scholar] [CrossRef]
  39. Cranston, P.S.; Hardy, N.B.; Morse, G.E.; Puslednik, L.; McCluen, S.R. When morphology and molecules concur: The ‘Gondwanan’ midges (Diptera: Chironomidae). Syst. Entomol. 2010, 35, 636–648. [Google Scholar] [CrossRef]
Figure 1. The mitogenome map depicted the distinctive mitochondrial genome attributes of various representative species spanning two genera within the Tanypus. The arrow directing the viewer’s gaze shows gene transcription direction. We used standardized abbreviations for PCGs and rRNAs and concise notations for tRNAs for clarity. The second circle highlighted GC content, revealing nucleotide composition. The third circle showed GC-skew, enhancing the understanding of structural asymmetry. The innermost circle summarized mitogenome length, offering a holistic view of its characteristics.
Genes 15 01281 g001
Figure 2. The evolution rate of 13 PCGs of the Tanypus mitogenomes. Ka refers to non-synonymous nucleotide substitutions, Ks refers to synonymous nucleotide substitutions, and Ka/Ks refers to the selection pressure of each PCG. The abscissa represented 13 PCGs, and the ordinate represented Ka/Ks values.
Genes 15 01281 g002
Figure 3. The assessment of the heterogeneity among the mitogenomes of 27 species belonging to the Chironomidae and Ceratopogonidae. Emphasizing Protein-Coding Genes (PCGs), amino acid sequences, and ribosomal RNAs (rRNAs), we visually represented sequence similarity through colored blocks. AliGROOVE scores ranging from −1 (red, for significant heterogeneity) to +1 (blue, for minimal heterogeneity) were applied. Lighter hues indicate higher heterogeneity, while darker tones signify less.
Genes 15 01281 g003
Figure 4. Phylogenetic tree of Chironomidae, ML tree based on analysis cds_rRNA in Partition.
Genes 15 01281 g004
Table 2. Nucleotide composition and skewness of mitogenomes of T. chinensis (PCG: Protein-Coding Gene, CR: Control Region).
Gene TypeLength (bp)Base Composition (%)Skew
ATCGA + TG + CAT-SkewGC-Skew
Whole genome16,26639.6136.2714.559.5775.8824.120.044−0.206
PCG11,21631.2842.7313.4512.5474.0026.00−0.155−0.035
PCG 1st codon position374031.9636.4712.2219.3568.4331.57−0.0660.226
PCG 2nd codon position373820.9945.5719.9313.5166.5633.44−0.369−0.192
PCG 3rd codon position373840.8746.158.214.7787.0312.98−0.061−0.265
ATP667832.4541.0015.6310.9173.4526.54−0.116−0.178
ATP816842.8639.8812.504.7682.7417.260.036−0.448
COX1153428.6837.8717.6715.7866.5533.45−0.138−0.057
COX268835.0337.7915.1212.0672.8227.18−0.038−0.113
COX378930.5436.8817.7414.8367.4232.57−0.094−0.089
CYTB113732.6337.0317.7712.5869.6630.35−0.063−0.171
ND194824.5849.059.0717.3073.6326.37−0.3320.312
ND2102632.4645.4212.879.2677.8822.13−0.166−0.163
ND335431.0741.8116.3810.7372.8827.11−0.147−0.208
ND4134128.3447.358.5815.7375.6924.31−0.2510.294
ND4L29427.5552.046.8013.6179.5920.41−0.3080.334
ND5173428.4345.509.6916.3873.9326.07−0.2310.257
ND652534.4846.4812.196.8680.9619.05−0.148−0.280
All rRNA220237.3042.916.7313.0780.2119.79−0.0700.320
12S80736.6842.387.4313.5179.0620.94−0.0720.290
16S139537.9243.446.0212.6281.3618.64−0.0680.354
CR95247.1643.597.142.1090.759.240.039−0.545
tRNA150338.5937.599.9813.8476.1823.820.0130.162
Table 3. Nucleotide composition and skewness of mitogenomes of T. kraatzi (PCG: Protein-Coding Gene, CR: Control Region).
Gene TypeLength (bp)Base Composition (%)Skew
ATCGA + TG + CAT-SkewGC-Skew
Whole genome16,180 39.10 36.51 14.33 10.06 75.61 24.39 0.034 −0.175
PCG11,216 31.13 43.19 12.98 12.70 74.32 25.68 −0.162 −0.011
PCG 1st codon position3740 32.55 37.08 11.56 18.82 69.62 30.38 −0.065 0.239
PCG 2nd codon position3738 20.63 45.64 19.78 13.95 66.27 33.73 −0.377 −0.173
PCG 3rd codon position3738 40.20 46.87 7.60 5.33 87.07 12.93 −0.077 −0.176
ATP6678 29.94 40.27 16.67 13.13 70.21 29.80 −0.147 −0.119
ATP8168 41.67 38.69 12.50 7.14 80.36 19.64 0.037 −0.273
COX11534 29.01 37.09 17.99 15.91 66.10 33.90 −0.122 −0.061
COX2688 34.74 36.63 15.84 12.79 71.37 28.63 −0.026 −0.107
COX3789 29.66 37.90 16.86 15.59 67.56 32.45 −0.122 −0.039
CYTB1137 31.75 37.99 17.24 13.02 69.74 30.26 −0.089 −0.139
ND1948 24.58 49.05 8.97 17.41 73.63 26.38 −0.332 0.320
ND21026 32.46 45.22 12.48 9.84 77.68 22.32 −0.164 −0.118
ND3354 31.64 41.81 15.25 11.30 73.45 26.55 −0.138 −0.149
ND41341 28.11 47.20 9.40 15.29 75.31 24.69 −0.253 0.239
ND4L294 25.85 52.38 8.16 13.61 78.23 21.77 −0.339 0.250
ND51734 29.01 45.67 9.57 15.74 74.68 25.31 −0.223 0.244
ND6525 33.71 48.95 10.67 6.67 82.66 17.34 −0.184 −0.231
All rRNA2193 38.06 42.08 7.17 12.70 80.13 19.87 −0.050 0.279
12S811 37.98 40.81 7.89 13.32 78.79 21.21 −0.036 0.256
16S1382 38.13 43.34 6.44 12.08 81.47 18.52 −0.064 0.305
CR781 44.81 46.73 6.40 2.05 91.54 8.45 −0.021 −0.515
tRNA1508 37.86 38.46 10.21 13.46 76.32 23.67 −0.008 0.137
Disclaimer/Publisher’s Note: The statements, opinions and data contained in all publications are solely those of the individual author(s) and contributor(s) and not of MDPI and/or the editor(s). MDPI and/or the editor(s) disclaim responsibility for any injury to people or property resulting from any ideas, methods, instructions or products referred to in the content.

