Article

Genome-Wide Association Studies and Runs of Homozygosity Reveals Genetic Markers Associated with Reproductive Performance in Korean Duroc, Landrace, and Yorkshire Breeds

1
Department of Animal Science and Technology, Sunchon National University, Suncheon 57922, Republic of Korea
2
Department of Animal Science, College of Agriculture and Environmental Science, Arsi University, Asella 193, Ethiopia
*
Author to whom correspondence should be addressed.
Genes 2024, 15(11), 1422; https://doi.org/10.3390/genes15111422
Submission received: 20 September 2024 / Revised: 22 October 2024 / Accepted: 30 October 2024 / Published: 31 October 2024
(This article belongs to the Section Animal Genetics and Genomics)

Simple Summary

Genome-wide association studies (GWAS) and run of homozygosity (ROH) analyses based on single nucleotide polymorphism (SNP) data were powerful tools for uncovering genetic factors associated with reproductive performance efficiency in various livestock breeds. The effectiveness of these studies may differ based on breed-specific characteristics, population genetics, and targeted production traits. In the present study, comparative analyses of the genetic profiles of pigs that exhibit diverse reproductive performance were conducted. This empowered us to identify genomic regions associated with the number of piglets born alive (NBA) and the total number of piglets born (TNB). The present finding greatly enhance its contributions to revisit breeding strategies in pigs by identifying significant genetic markers associated with reproductive performance traits.

Abstract

Background: Reproductive performance is critical in the pig industry, and improved sow performance could lead to increased economic benefits. GWAS and ROH analyses based on SNP array data were conducted to identify the breed-specific genetic architecture underlying the variation in NBA and TNB. Methods: A total of 7488 breeding pigs with phenotypic data from 1586 Duroc, 2256 Landrace, and 3646 Yorkshire breeds, along with 76,756 SNP markers from Korean grand-grand-parent (GGP) breeding farms, were used. Results: In the Duroc breeds, SNPs on SSC 9 and 17 were found to be associated with the SIDT2 and TGM2 genes, respectively. In the Landrace breed, PPP1R9A, LMTK2, and GTF2H3 on SSCs 9, 3, and 14, respectively, were associated with both TNB and NBA. With the Yorkshire breed genome, GRID1, DLGAP2, ZZEF1, PARG, RNF17, and NDUFAF5 in SSCs 14, 15, 12, 14, 11, and 17, respectively, were associated with NBA and TNB traits. These genes have distinct functions, ranging from synaptic transmission and cytoskeletal organization to DNA repair and cellular energy production. In the Duroc breed, six genes identified in the ROH islands were associated with various biological pathways, molecular functions, and cellular components. NT5DC1 was associated with metaphyseal chondrodysplasia, CRTAC1 with ion binding, CFAP43 with spermatogenic failure, CASC3 with intracellular mRNA localization, ERC2 with cellular component organization, and FOCAD with Focadhesin. In the Landrace and Yorkshire breeds, PDE6D was associated with GTPase inhibitor activity. Conclusions: Through GWAS and ROH analyses, we identified breed-specific SNP markers associated with NBA and TNB in three breed genotypes, providing insights for improving reproductive performance efficiency and contributing to future breeding strategies.

1. Introduction

Improving pig reproductive capabilities has been a consistently fascinating subject in the swine breeding and farming industry [1]. Molecular breeding, a method that involves the identification of single nucleotide polymorphism (SNPs) and prospective genes linked to reproduction, has been demonstrated as an effective approach to enhancing reproductive performance [2]. Reproductive traits, such as total number born (TNB) and number born alive (NBA), are crucial factors used in pig breeding programs to assess sow productivity [3]. So far, the use of classical breeding methods with the best linear unbiased prediction has been effective in enhancing maternal reproductive attributes [4]. However, factors such as low heritability, minor genes, maternal effects, and environmental factors primarily influence the intricate genetic structure of reproductive traits [5]. Consequently, unraveling the genetic architecture of reproductive performance traits poses significant challenges. GWAS and ROH analyses are the major genomic tools applicable to identify genes related to reproductive performance in livestock breeds in which pigs are not exceptional. However, it varies depending on the breed, population, and production traits. Moreover, there is a belief that GWAS signals have been replicated across populations from various regions [6], which has been substantiated by several reported studies [7,8,9].
Reproductive performance is a crucial production trait in the swine business [10]. TNB and NBA are essential markers for assessing reproductive performance, which in turn has a considerable impact on the overall performance of the pig industry and sow evaluation programs [3]. Improving the reproductive performance of sows can result in higher economic benefits for the swine industry [11]. To date, traditional breeding strategies that use the best linear unbiased prediction have been effective in enhancing maternal reproductive attributes [4]. However, because of their low heritability, minor genes, maternal effects, and environmental influences, their genetic architecture is substantially more complex [5], making it difficult to decipher the genetic architecture of reproductive traits [12]. Hence, typical breeding strategies are ineffective for rapidly improving these features [11,13]. With the advancement of molecular breeding technology, marker-assisted selection (MAS) and genomic selection (GS) have emerged as viable strategies for increasing swine breeding efficiency [14].
ROH are cutting-edge methods for analyzing inbreeding in livestock populations [15]. ROH are contiguous regions on chromosomes in which an individual inherits identical haplotypes from both parents [16,17,18,19,20]. These long, unbroken, homozygous areas in the genome are likely to have evolved from a common ancestor [21]. They are useful for predicting inbreeding rates and analyzing genetic linkages across the entire genome of livestock species [22,23,24]. When both parents pass down substantial chromosomal segment portions, the offspring’s genome contains homozygous segments. Factors such as inbreeding, genetic drift, consanguineous mating, population bottlenecks, and natural and artificial selection influence these segments among both inbred and non-inbred populations [17,25,26,27,28,29,30,31]. Recent advances in high-throughput genomic analysis tools, including next-generation sequencing and genotype-based microarrays (SNP arrays), have made it easier to identify these homozygous portions with higher resolution [17,32].
Therefore, identifying breed-specific genes related to reproductive performance is crucial. This could be achieved by conducting GWAS and analyzing ROH in three pig populations with distinct genetic backgrounds based on SNP array data. Our study had two main objectives: first, to conduct GWAS and identify genes associated with TNB and NBA in the Korean Duroc, Landrace, and Yorkshire pig breeds and, second, to explore genes and their functions in genomic regions associated with ROH islands and pathways contributing to sow reproductive performance in these breeds. Our GWAS and ROH analyses revealed valuable candidate genes that influence pig reproductive performance traits directly or indirectly, especially TNB and NBA. We inform breeders that this study contributes to the improvement of productivity and the development of effective breeding programs, thereby enhancing overall productivity.

2. Materials and Methods

2.1. Animals and Phenotype

In this study, we performed GWAS on the key economic traits of reproductive performance, using genomic markers (single nucleotide polymorphisms, SNP) and phenotypic data gathered from Korean Duroc, Landrace, and Yorkshire breeds at GGP domestic breeding farms. The analysis included information on reproductive performance, specifically NBA and TNB. The reproductive performance data from a total of 7488 breeding pigs, comprising 1586 Duroc, 2256 Landrace, and 3646 Yorkshire breeds, was collected. Additionally, a dataset containing 76,756 SNP markers was utilized. Table 1 presents the descriptive statistics of NBA and TNB for the Korean Duroc, Landrace, and Yorkshire breeds.

2.2. Genotyping and Quality Control

Genotyping was performed using SNP markers, and blood samples were used for DNA collection. The porcine 70K SNP chips (Illumina, San Diego, CA, USA) were used. Processed genotypic data were obtained following the internal guidelines specified by the data provider. In total, 7488 breeding pigs (1586 Duroc, 2256 Landrace, and 3646 Yorkshire pigs) and 76,756 SNP markers were included in the collected basic data. For quality control, PLINK software (v1.90) was used to keep SNPs with MAF > 0.05, mind 0.1, SNP call rate > 95%, individual call rate > 5%, and HWE > 1 × 10⁻⁶ [33]. A total of 57,775 SNPs and 7413 animals were retained for further GWAS analysis.

2.3. Phenotypic Correlation Analysis

The reproductive performance traits of the Duroc, Landrace, and Yorkshire pig breeds were compared using Spearman’s correlation analysis to ensure the robustness of the correlation results. R version 4.3.3 (2024-02-29 ucrt) “Angel Food Cake” was used for analysis and visualization. Phenotypic correlation analysis and visualization were performed using the "ggscatmat" function from the “GGally” package. In addition to the default function, additional formatting and customization options were applied to enhance visualization. Notably, the results of the correlation analysis were reported in two significant digits, ensuring clarity and precision in the presentation of the findings.

2.4. Principal Component Analysis (PCA)

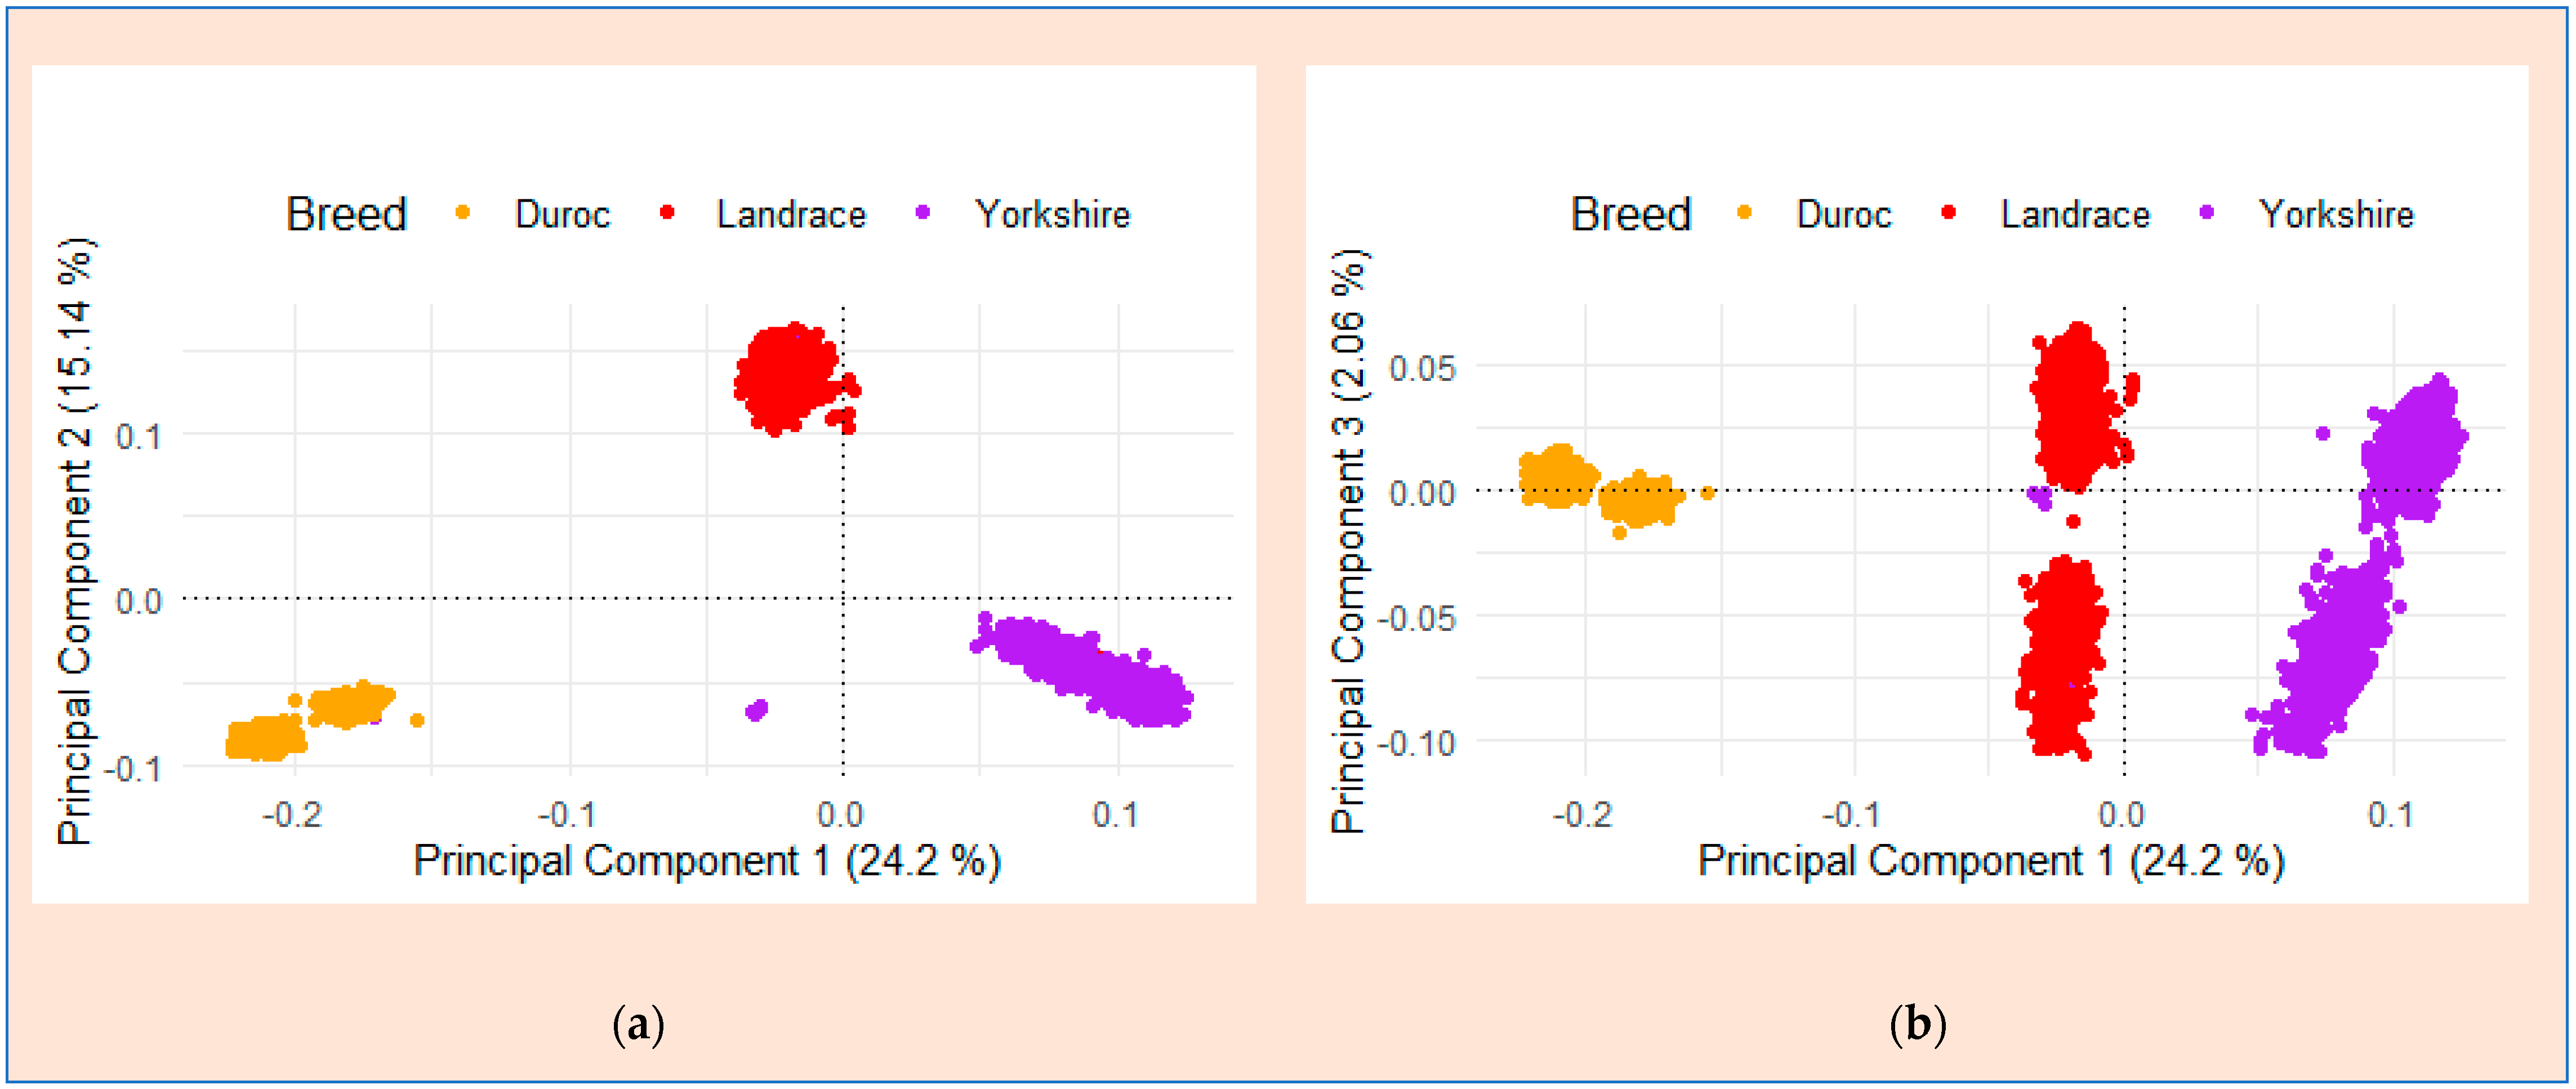
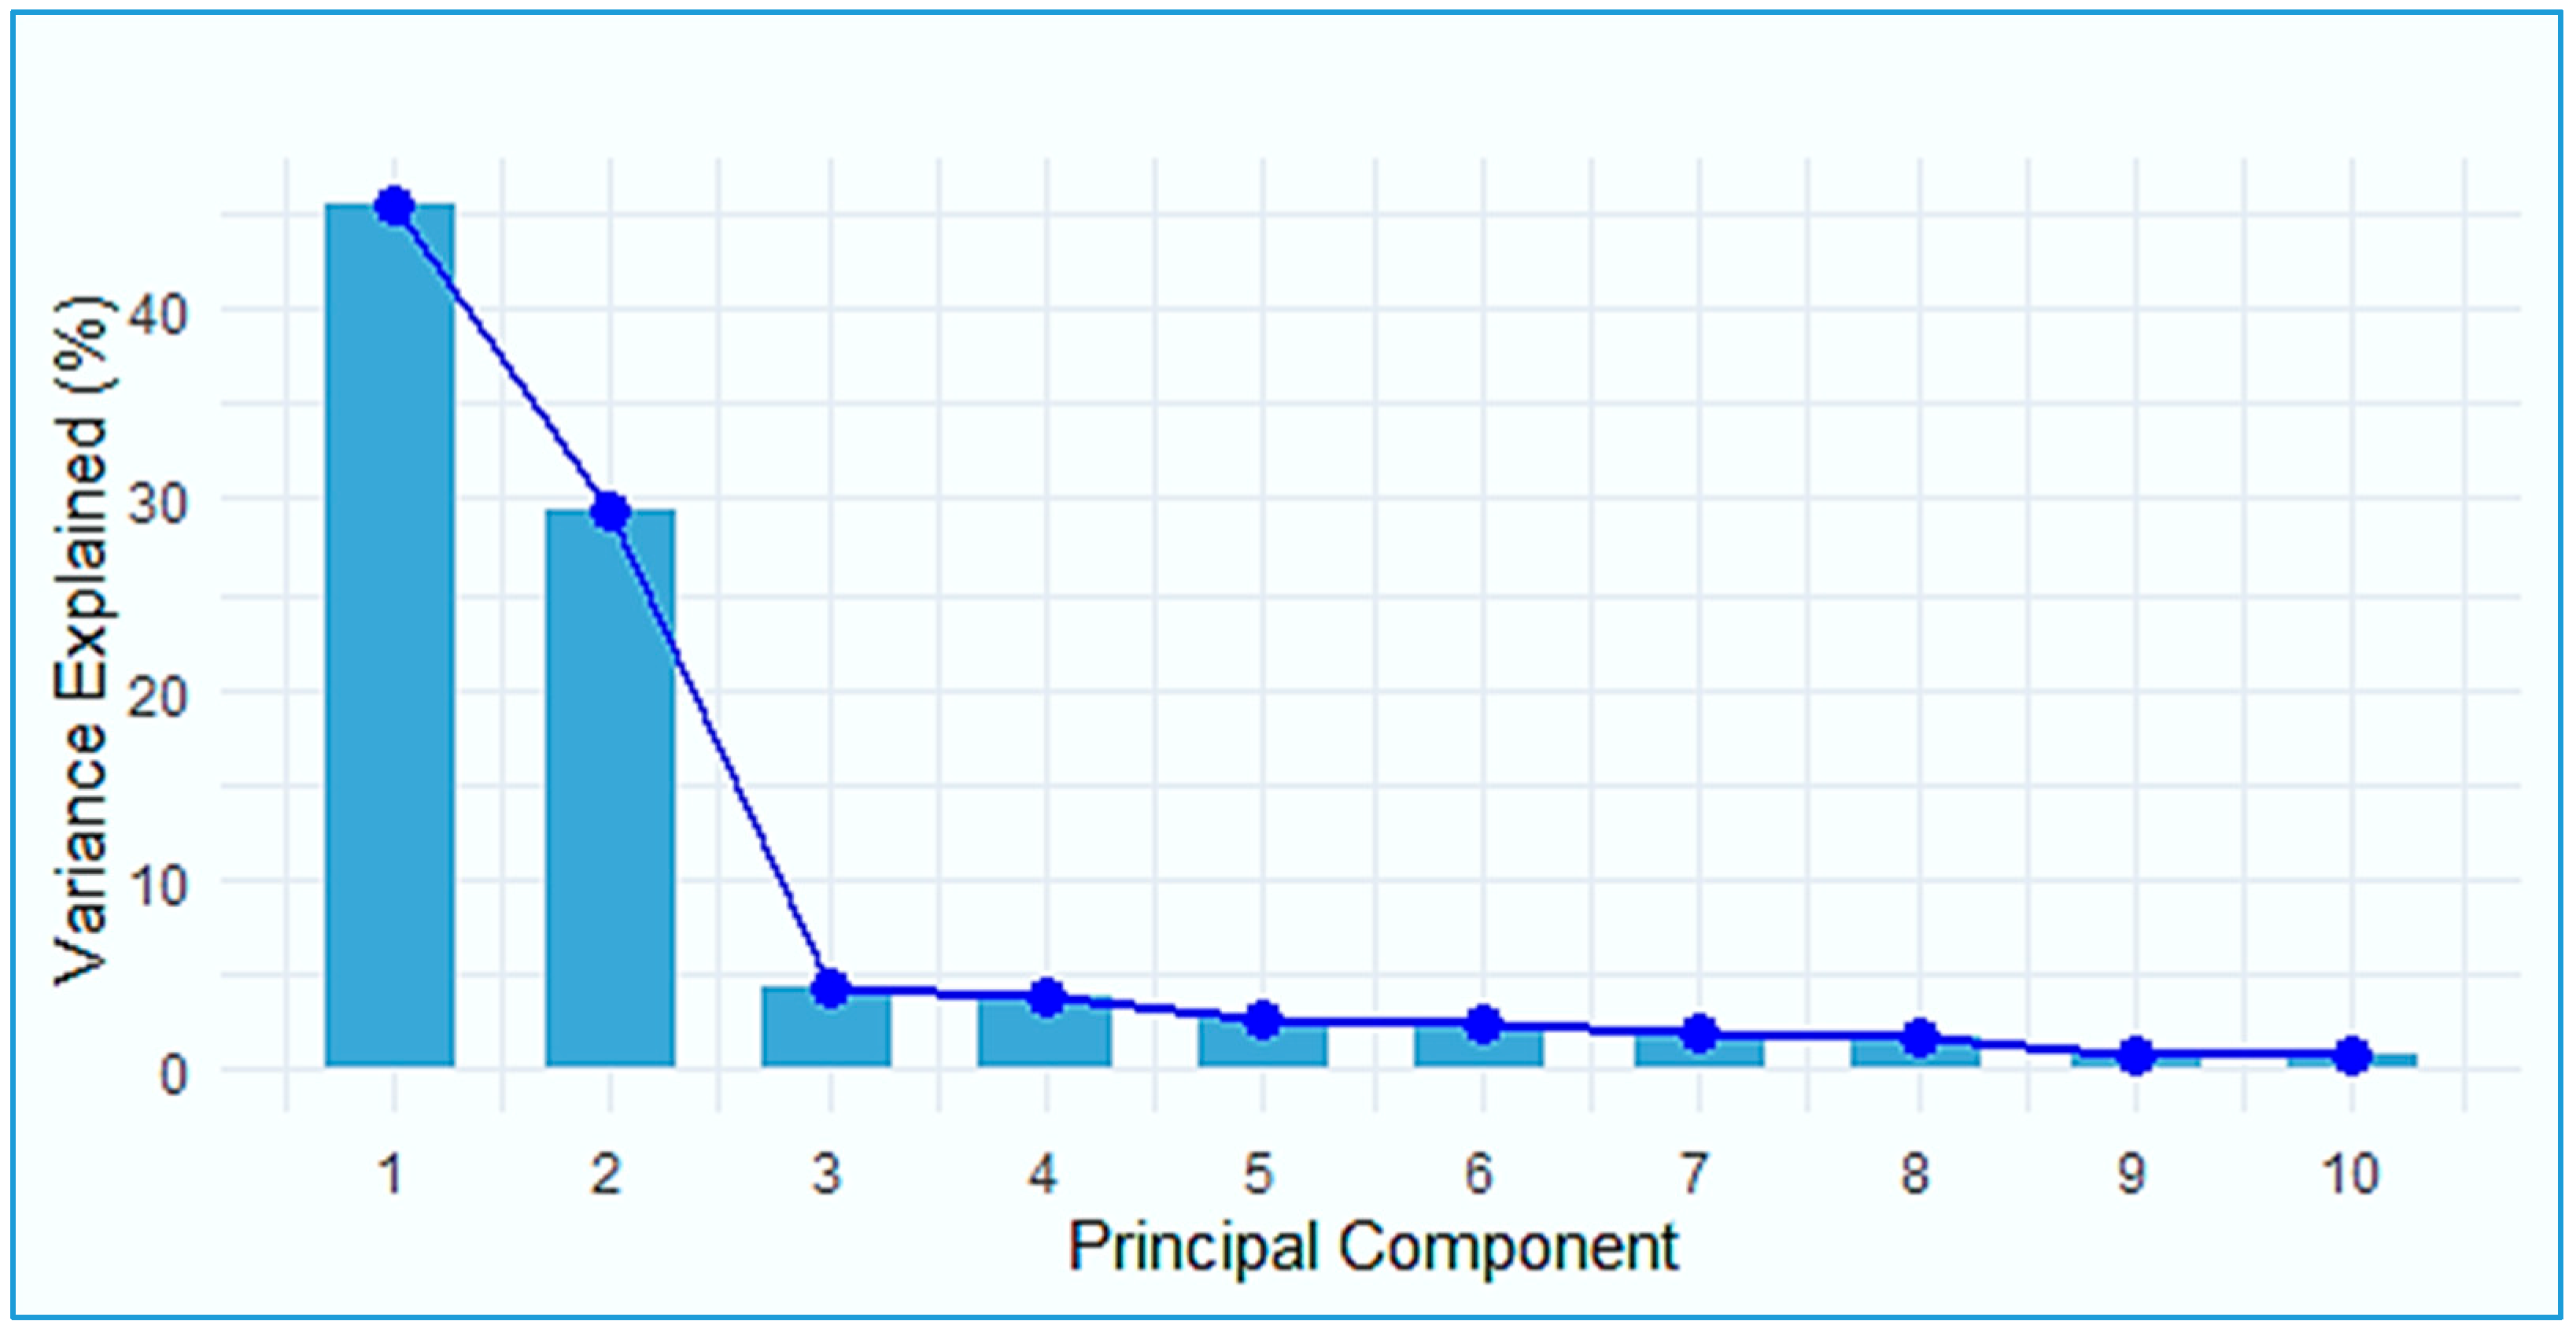
The three distinct breed populations examined in this study had different genetic backgrounds, and we used GCTA software v1.94.1 developed by Yang, Lee [34] to conduct PCA to differentiate the population stratification. We performed principal components to assess genetic differentiation between the three breeds. Accordingly, we calculated the proportion of variance accounted for by the first principal component by dividing the variance explained by the total variance. Based on the variance explained by the PCA results (principal component 1 vs. principal component 2 and principal component 1 vs. principal component 3), we determined the number of principal components to include as covariates. Therefore, we included the first two principal components (principal component 1 and principal component 2) as covariates in the GWA studies.

2.5. Genome-Wide Association Study

We examined the association between reproductive performance traits and reliable SNP markers using the linear regression module of PLINK1.9 software v1.94.1 [33]. As discussed in Section 2.2, the SNP datasets for each breed yielded 7941, 8409, and 8394 SNPs for the Duroc, Landrace, and Yorkshire breeds, respectively. We used the first two PCs as covariates in the GWAS. We used the Bonferroni correction to identify significant SNPs at a 0.05 significance level. The p-values for the 5% genome-wide significance thresholds in the three populations were calculated as 0.05/SNPs. We used a Bonferroni correction to adjust the p-values for multiple tests. The genome-wide significance threshold was set at p < 0.05 and divided by the number of SNPs for each breed: p < 6.29 × 10⁻⁶ for the Duroc breed, p < 5.94 × 10⁻⁶ for the Landrace breed, and p < 5.95 × 10⁻⁶ for the Yorkshire breed. Also, chromosome-wide significance thresholds were set at p < 6.29 × 10⁻⁷ for the Duroc breed, p < 5.94 × 10⁻⁷ for the Landrace breed, and p < 5.95 × 10⁻⁷ for the Yorkshire breed. These levels have suggestive significance. Manhattan and quantile–quantile (Q–Q) plots were generated using the R package “qqman” to visualize the significance of the p-values of the GWAS for candidate genes and to detect the population stratification [35], respectively.

2.6. Identification and Annotation of Candidate Genes from GWAS

Pertinent information on potential genes was accessed from the Ensembl Sscrofa11.1 database (www.ensembl.org accessed on 25 April 2024) at http://www.ensembl.org. The Ensembl database provides comprehensive genomic information on various species, including pigs (Sscrofa). The candidate genes underwent gene ontology (GO) annotation analysis (http://geneontology.org accessed on 25 April 2024). GO annotation involves assigning functional annotations to genes based on their biological processes, molecular functions, and cellular components. To validate gene function, we conducted a comprehensive search of the additional literature from PubMed to obtain more detailed information on gene function.

2.7. Gene Exploration of Shared ROH Regions

We selected homozygous segments shared by >70% of the samples as potential indications of ROH islands across the genome. We used the ENSEMBL database, based on the pig reference genome version 11.1, to annotate functional genes within the ROH islands. This approach allowed for the identification and analysis of the most common genomic regions associated with ROHs. To identify significant candidate genes, GO and KEGG pathways with a significance level of p ≤ 0.05 were used [36,37]. To gain insight into the functional implications of the identified ROH islands, we utilized a list of genes from the ROH islands and the Sus scrofa annotation file as the reference background.

3. Results

3.1. Phenotype Correlation of Reproductive Traits

Figure 1 displays the phenotypic correlation for NBA and TNB traits in the three pig populations (Duroc, Landrace, and Yorkshire). For all breeds, Spearman’s correlation coefficient among the traits showed a strong positive correlation, indicating that they were highly correlated. The Landrace breed had the relatively highest correlation (0.88) for the trait under study, followed by Yorkshire (0.86) and Duroc (0.77). This observation highlights the strong correlation between NBA and TNB, reinforcing our understanding that maximizing improvements in NBA can lead to an increase in TNB. Furthermore, it is worth noting that genes influencing NBA and TNB in all three breeds may exhibit similar effects. Therefore, this potential interconnectedness suggests that a gene that affects one trait may also affect other traits and may have a shared genetic factor.

3.2. Principal Component Analysis (PCA) and Population Structure

Population stratification is a key consideration in genome-wide association studies because it might induce consistent ancestry disparities, conceivably resulting in spurious associations [38]. To identify the population structure of the three breeds from Korean GGP breeding farms, we performed PCA using SNP data. Using a PCA plot, we differentiated population stratification based on the genetic similarities among three commercial pig breeds from Korean GGP breeding farms (Duroc, Landrace, and Yorkshire) using principal component analysis (PCA) of the SNP data (Figure 2a,b). PCA revealed clear genetic clustering, with the first two principal components (PCs) delineating three distinct clusters corresponding to each breed (Figure 2a), explaining 24.2% of the genetic variation in the dataset. The second PC accounted for 15.14% of the variation, whereas the third PC accounted for 2.06% (Figure 2b). These results show a well-structured genetic landscape among the breeds, addressing potential false-positive signals from the stratification. The data were adjusted accordingly to assess evidence for population stratification and were used as covariates for the GWAS analysis. Therefore, we retained a minimum of the first two PCs as covariates for GWAS.
The scree plot presented in Figure 3 indicates the percentage of variance explained by each principal component (PC) in the three Korean commercial pig breeds based on SNP data. This enabled us to determine the most important number of principal components that should be retained for consideration as covariates, using the elbow turning point of the bar plot indicated by the blue line, which turns at PC3. Consequently, the first two principal components (PC1 and PC2) were retained as covariates in the genome-wide association studies (GWAS).

3.3. The Significant SNPs and Associated Genes from GWAS

The result of the GWAS analysis for NBA and TNB in three genetically distinct background breeds is presented in Table 2, Table 3, Table 4 and Table 5. A GWAS was done on the NBA and TNB traits in the Duroc, Landrace, and Yorkshire breeds. The results show the important SNPs that were found, along with their locations, p-values, alleles, β values, distances, and the candidate genes that are linked to them. Each SNP was associated with a potential gene on a particular chromosome at a certain base pair (bp) location. The adjusted p-value showed how statistically significant the link was between a certain SNP and a trait that was being studied. Alleles denote different variants at each SNP locus, whereas the β value indicates the effect size of the SNP on the trait. The values presented in the distance column indicate the genomic distance between the SNP and the candidate genes.
A GWA study conducted on the Duroc breed genome identified potential SNPs associated with NBA and TNB, as presented in Table 2. Two SNPs of particular interest are located on Sus Scrofa chromosomes (SSC) 13 and 8. The SNP on SSC 13 (Affx-115053386) showed an association with TNB and NBA, with suggestive threshold p-values of 1.52 × 10⁻⁶ and genome-wide threshold p-values of 9.56 × 10⁻⁷, respectively, and it was located within an unknown gene named ENSSSCG00000063239. Similarly, the SNP on SSC 8 (WU_10.2_8_18342200) was associated with both traits, with a suggestive threshold line with p-values of 2.01 × 10⁻⁶ for TNB and within a genome-wide threshold line of p-value 8.68 × 10⁻⁷ for NBA; however, there was an unknown gene named ENSSSCG00000056996. Additionally, SNPs associated with NBA were detected on SSC 9 and 17, with SIDT2 and TGM2 identified as potential candidate genes, respectively.
In Landrace breeds, SNPs on SSCs 1, 9, 3, and 14 show significant associations with TNB and NBA as presented in Table 3. The SNP on SSC 9 (ALGA0053627) was associated with the PPP1R9A gene and found within the suggestive threshold p-value of 2.33 × 10⁻⁶ for TNB and 1.55 × 10⁻⁶ for NBA. The SNP on SSC 3 (ALGA0017853) was associated with LMTK2, and the SNP on SSC 14 (ALGA0076573) was associated with GTF2H3. Across the three chromosomes of Sus scrofa (SSCs 9, 3, and 14), three candidate genes were associated with both TNB and NBA. These genes are Protein Phosphatase 1 Regulatory Subunit 9A (PPP1R9A), Lemur Tyrosine Kinase 2 (LMTK2), and General Transcription Factor IIH Subunit 3 (GTF2H3).
In the Yorkshire breed genome, GWAS identified several potential candidate genes associated with NBA (Table 4) and TNB (Table 5). These include GRID1 (Glutamate Ionotropic Receptor Delta Type Subunit 1), DLGAP2 (Disc Large Associated Protein 2), and ZZEF1 (Zinc Finger ZZ-Type and EF-Hand Domain Containing 1). Although candidate genes such as Poly (ADP-Ribose) Glycohydrolase (PARG), Ring Finger Protein 17 (RNF17), and NADH Oxidoreductase Complex Assembly Factor 5 (NDUFAF5) were identified by the GWAS on specific autosomal SSCs, they had strong associations with TNB. However, the identified candidate genes were found at different p-values (suggestive and genome-wide significant thresholds) and on different autosomal SSCs. Notable SNPs included were DRGA0014176 on SSC 14 within the GRID1 gene and WU_10.2_15_32958696 on SSC 15 within the DLGAP2 gene, with p-values of 6.43 × 10⁻⁷ and 6.68 × 10⁻⁷, respectively, which were potential candidate genes found within genome-wide significance thresholds for NBA. Additionally, the SNP H3GA0034587 on SSC 12 within the ZZEF1 gene also shows a significant association with NBA. On the other hand, SNPs like ASGA0064844 on SSC 14 within the PARG gene and MARC0024643 on SSC 11 within the RNF17 gene, with p-values of 6.20 × 10⁻⁷ and 7.57 × 10⁻⁷, respectively, indicated potential candidate genes associated with TNB found within genome-wide significant thresholds. Another SNP, H3GA0048059 on SSC 17 near the NDUFAF5 gene, with a p-value of 2.47 × 10⁻⁶, was also identified as another candidate gene associated with TNB found within suggestive thresholds.

3.4. Manhattan and Quantile–Quantile Plot

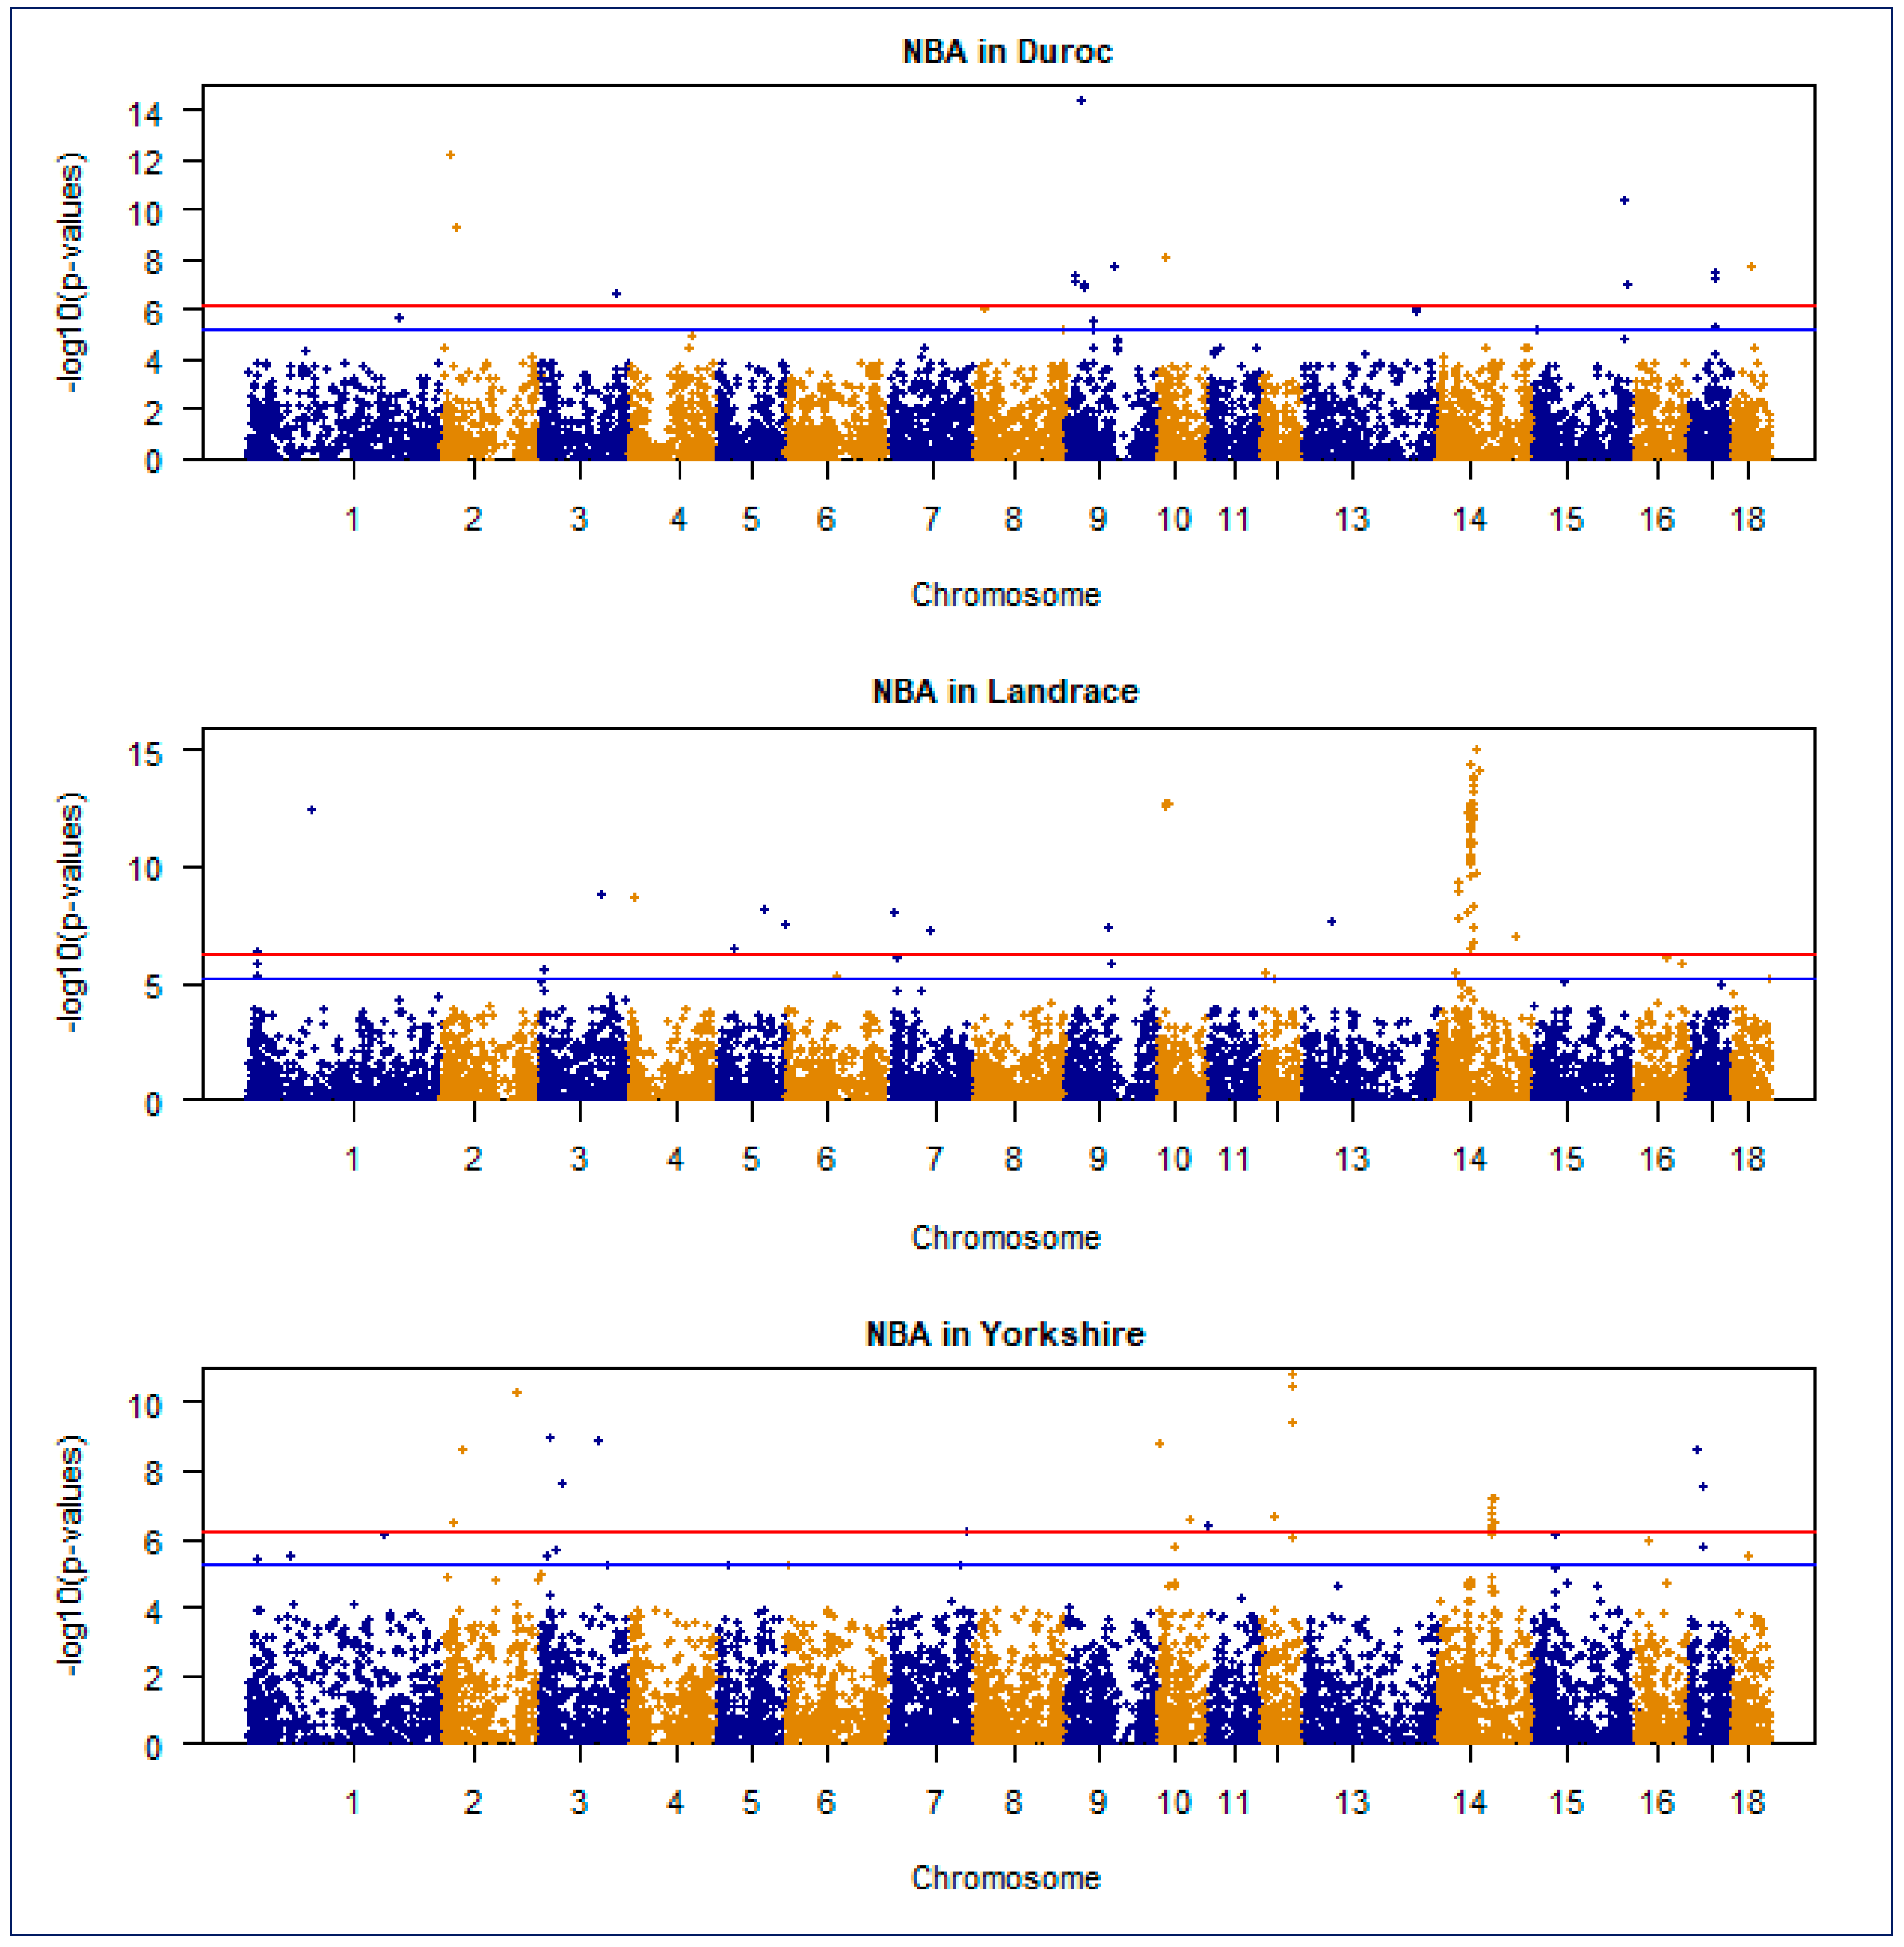
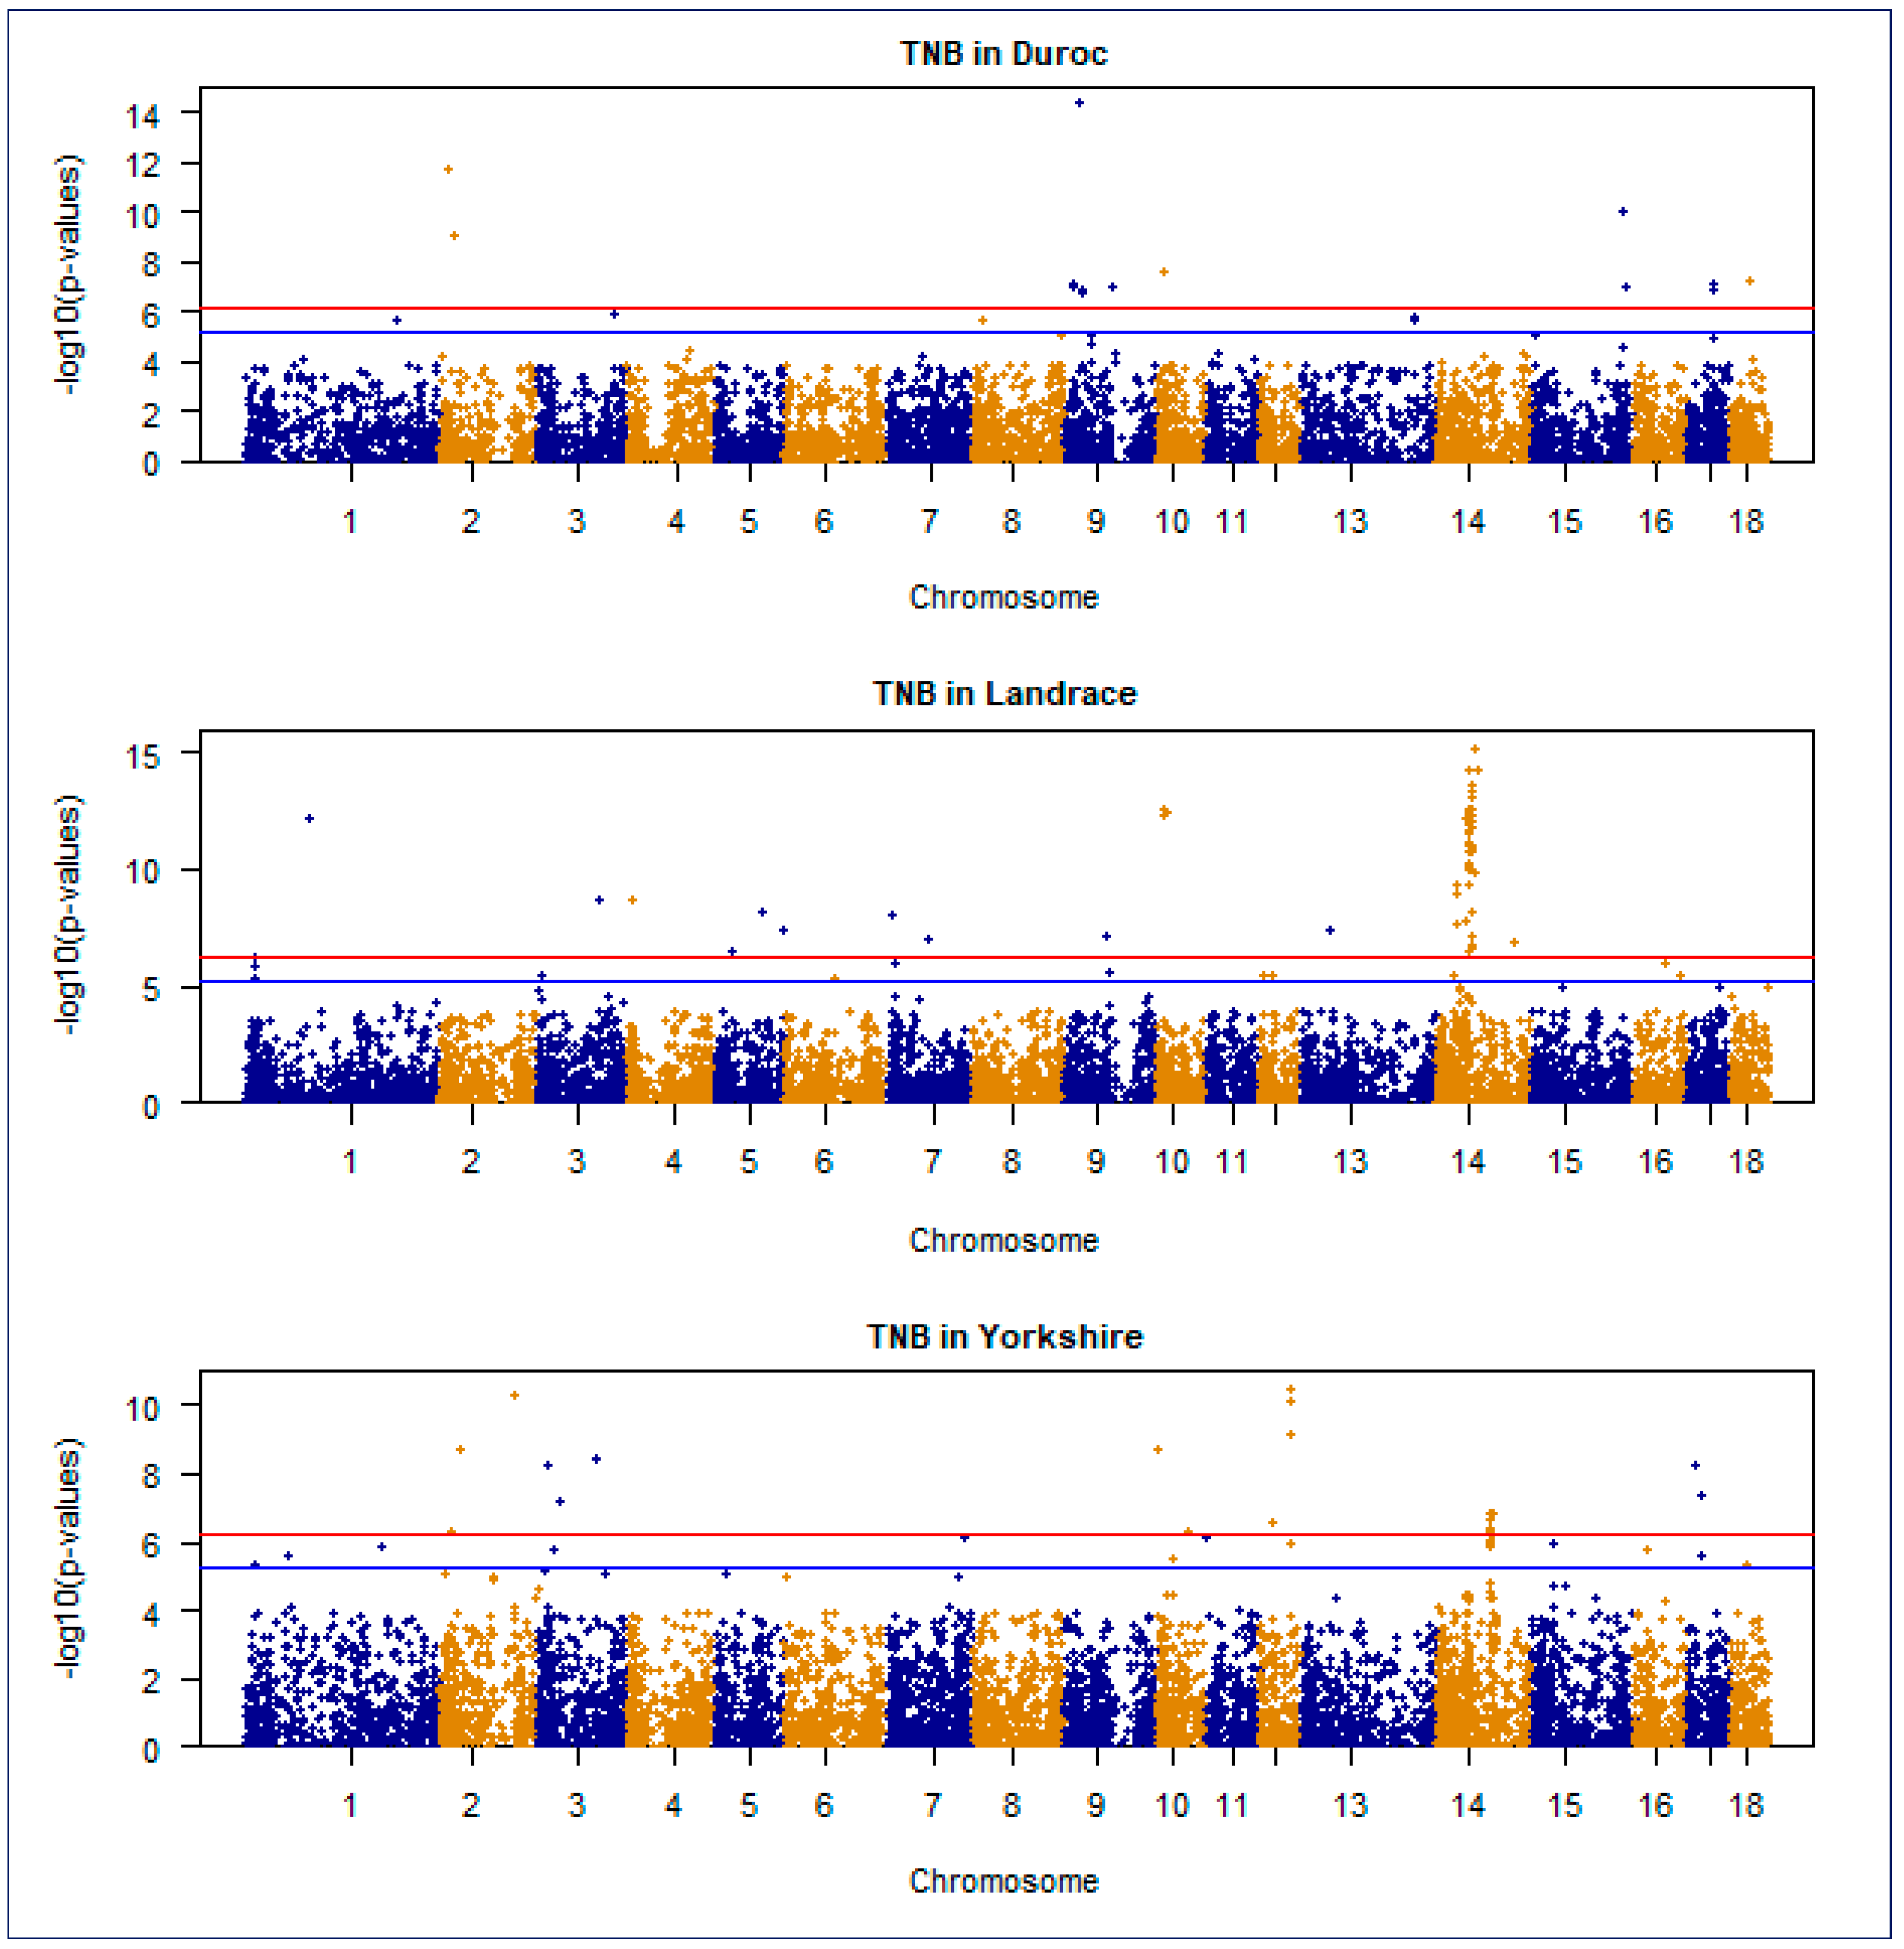
The Manhattan plot is a crucial visualization tool in GWAS that uses the inverse logarithm of p-values to identify statistically significant genetic variants linked to traits or diseases. A Manhattan plot of GWAS for NBA and TNB traits in Duroc, Landrace, and Yorkshire Korean breed populations were presented in Figure 4 and Figure 5, respectively.
On the other hand, the quantile–quantile (Q–Q) plot evaluated the observed associations between genotypic SNPs and the trait under study in contrast to the null hypothesis of no association. In our study, Figure 6A–F presents the Q–Q plot of GWAS results for NBA and TNB in the Duroc, Landrace, and Yorkshire Korean breeds. For the TNB trait, the Q–Q plot for the Duroc breed (Figure 6A) demonstrated significant deviations from the expected p-values, indicating the presence of several SNPs with strong statistical significance. This suggests true genetic associations for the NBA trait in the Duroc breed. Similarly, the Landrace breed (Figure 6B) showed deviations from the expected line, albeit to a lesser extent than the Duroc, indicating significant but fewer associations. The Yorkshire breed (Figure 6C) also showed notable deviations, suggesting strong genetic associations, similar to the Duroc. For the TNB trait, the Q–Q plot for the Duroc breed (Figure 6D) showed substantial deviations from the expected line, indicating many significant SNPs and strong genetic associations. The Landrace breed (Figure 6E) showed a moderate number of deviations, indicating significant associations but fewer extreme p-values compared to the Duroc, whereas the Yorkshire breed (Figure 6F) showed deviations, indicating significant associations similar to those observed for NBA.

3.5. GO Annotation of Candidate Genes

The result of GO annotations showed that GRID1 was involved in synaptic transmission and plasticity in the central nervous system, whereas DLGAP2 was associated with the organization of postsynaptic density and synaptic function. ZZEF1 mainly plays a role in cell proliferation and cytoskeletal organization. PARG were mainly involved in DNA repair and genomic stability; RNF17 were mostly associated with protein ubiquitination and degradation; and NDUFAF5 participates in the assembly of mitochondrial complex I, which is crucial for cellular energy production.

3.6. Genes and Their Function Within Run of Homozygosity Islands

Breed-specific genes and their functions within the ROH island regions identified in our study for the Duroc, Landrace, and Yorkshire breeds are presented in Table 6. These genes reside on chromosomes 1, 12, 13, 14, and 15 of the Sus Scrofa chromosomes (SSC) and exhibit diverse biological functions. The genomic distribution of ROH segments revealed significant differences in the number and length of ROH segments among breeds. In the Duroc breed, we identified several genes within the ROH islands, including NT5DC1, CRTAC1, CFAP43, CASC3, ERC2, and GOLGA7B. NT5DC1, which is involved in nucleotide metabolism, and CRTAC1, which is associated with cartilage structure, occupy chromosomes 1 and 14, respectively. Additionally, we identified CFAP43, a gene related to cilia and flagella structure, and CASC3, a subunit of the exon junction complex. ERC2, which contributes to neuronal transmission, and GOLGA7B, a member of the golgin family involved in Golgi structure, have been identified on chromosomes 13 and 14, respectively. In the Landrace breed, we located the FOCAD gene, known as Focadhesin, within the ROH islands on chromosome 1, which is implicated in cell adhesion. Similarly, in the Yorkshire breed, we discovered PDE6D, encoding phosphodiesterase 6D, within the ROH islands on chromosome 15, and this enzyme participates in signal transduction processes within photoreceptor cells.

4. Discussion

GWAS is a powerful method to identify the mutations or genes underlying complex traits in domestic animals [39]. In the pig, GWAS has been performed to identify candidate genes for traits related to production [40], body composition [41], reproduction [1], and immunity [42]. In the present study, GWAS was conducted on the genomes of the Duroc, Landrace, and Yorkshire breeds and has identified potential SNPs associated with NBA and TNB. Population stratification is widely recognized to have an impact on the accuracy of GWAS [43]. However, unlike humans, domestic animals have a straightforward genetic makeup that facilitates the identification of specific genetic regions responsible for certain traits [39].
In the Duroc breed, SNPs associated with NBA were detected on SSC 9 and 17, with SIDT2 and TGM2 identified as candidate genes, respectively. SIDT2 is a key protein in the autophagy-lysosomal degradation pathway and is essential for maintaining the kidney structure and function of mice [44]. However, specific research elucidating its direct involvement in pig reproductive traits (NBA) is limited. TGM2 is known for its role in cell adhesion, migration, and differentiation, particularly in bone marrow mesenchymal stem cells (BMSCs), where it activates Wnt/β-catenin signaling, promoting cell migration and differentiation [45]. However, TGM2’s involvement in tumorigenesis and inflammatory processes suggests that it may also affect reproductive traits by influencing the uterine environment and embryonic development [46]. Moreover, TGM2 encodes transglutaminase 2, an enzyme involved in protein crosslinking, apoptosis, and the pathogenesis of celiac disease [47]. It is also implicated in the inflammation-induced progression of breast cancer and may play a role in epithelial-to-mesenchymal transition (EMT) and cancer stem cell traits in women [48].
For Landrace breeds, the candidate genes identified were involved in a range of cellular processes, including synaptic function, cell proliferation, and DNA repair. PPP1R9A is involved in regulating protein phosphatase 1 activity, affecting synaptic plasticity and dendritic spine morphogenesis, and its role in synaptic plasticity could influence the neuroendocrine control of reproduction [47,48]. Recent evidence suggests that LMTK2 is involved in neurodegeneration [49]. GTF2H3 is a component of the transcription factor IIH complex, and it is crucial for transcription initiation and DNA repair. Whole-exome sequencing identified a single nucleotide variant (c.664T>C) in the GTF2H3 gene, which appears to be the probable cause of infertility in a Turkish family [50].
In Yorkshire breeds, candidate genes associated with both NBA and TNB have been implicated in synaptic function, cell proliferation, and energy production. The roles of GRID1 and DLGAP2 in synaptic transmission may influence neuroendocrine regulation of reproductive processes. GRID1 may affect the onset of puberty in female rats by regulating the levels of GnRH and RFRP-3 in the hypothalamus, as well as the concentrations of P4, but it does not affect reproductive performance in female rats [51]. Additionally, ZZEF1’s involvement in cell proliferation is crucial for embryonic development. However, Yu, Tencer [52] suggested that ZZEF1 binds to the histone H3 tail and promotes KLF9/6-mediated gene regulation. Furthermore, PARG, RNF17, and NDUFAF5 are linked to DNA repair, protein degradation, and energy production, respectively, which are vital to maintaining cellular integrity and supporting the high-energy demands of pregnancy. However, RNF17 blocks the promiscuous activity of PIWI proteins in the mouse testes [53]. RNF17, a regulator of adult meiotic piRNA content, intricately modulates Piwi-interacting RNAs (piRNAs), which are crucial for gene expression regulation, especially in germline cells, by suppressing the production of secondary piRNAs [53].
In our previous studies [54], we delineated the genomic distribution of the run of homozygosity across three Korean breeds. In the present study, we identified and discussed the gene function in the regions of homozygosity (ROH) islands within the genomes of three pig breeds. Eight genes were identified within the ROH island, six of which are specific to the Duroc, one to the Landrace, and one to the Yorkshire breed, each of which has a specific function and is crucial for diverse biological processes and genetic disorders. Among these, NT5DC1, in the Duroc breed, was found to be linked to metaphyseal chondrodysplasia, highlighting its role in skeletal development. Similarly, we identified CFAP43, situated within another ROH island, which has been implicated in spermatogenic failure 19, emphasizing its importance in male fertility. CFAP43 is involved in the regulation of the beating frequency of tracheal cilia, and the loss of CFAP43 causes severe mucus accumulation in the nasal cavity in mouse and Xenopus [55]. Likewise, morphant and crispant frog embryos revealed impaired function of motile cilia in the larval epidermis, a model for airway mucociliary epithelia [55]. CFAP43 participates in the formation of flagellar axonemes during spermatogenesis as mice mutant for Cfap43 display male infertility consistent with observations in male sterile patients [55]. Mutations in CFAP43 lead to severe asthenozoospermia and multiple morphological abnormalities of the sperm flagellum (MMAF) in both humans and mice [56]. Moreover, we identified genes such as CRTAC1, CASC3, and ERC2 within the ROH islands, indicating their involvement in ion binding, intracellular mRNA localization, and cellular component organization, respectively, in the Duroc breed. However, overexpression of CRTAC1 increased the sensitivity to cisplatin in vitro, whereas CRTAC1 knockdown decreased the chemosensitivity of NSCLC cells [57]. In vivo mouse experiments showed that CRTAC1 overexpression increased the anti-tumor effects of cisplatin [57]. CASC3 forms cytoplasmic condensates, and deletion of the conserved SELOR domain reduces condensate size 7-fold and significantly decreases antiviral activity towards TCV [58]. CASC3 is a peripheral EJC protein that tailors the transcriptome by promoting degradation of EJC-dependent NMD substrates [59]. Moreover, GOLGA7B, FOCAD, and PDE6D, identified in ROH islands, are associated with golgin A7 family member B, focal adhesion processes, and GTPase inhibitor activity, respectively, shedding light on their roles in cellular transport, adhesion, and signaling regulation. Palmitoylation of Golga7b prevents clathrin-mediated endocytosis of DHHC5 and stabilizes it in the plasma membrane [60]. It is critical to acknowledge that further biological experiments in large swine populations will improve the reliability and understanding of candidate genes’ association with NBA and TNB traits.

5. Conclusions

GWAS conducted on the genomes of three Korean commercial pig breeds identified with significant SNPs associated with NBA and TNB traits, each linked to specific candidate genes on chromosomes at defined positions. Breed-specific candidate genes were identified with the NBA and TNB traits of each breed. In the Duroc breed, SNPs associated with NBA were found on SSC 9 and 17, with SIDT2 and TGM2 as candidate genes, respectively. In the Landrace breed, PPP1R9A, LMTK2, and GTF2H3 have been identified across SSCs 9, 3, and 14. Similarly, candidate genes were identified in the Yorkshire breed genome for both NBA and TNB traits. Furthermore, six genes (NT5DC1, CRTAC1, CFAP43, CASC3, ERC2, and GOLGA7B) within the ROH islands of the Duroc breed were associated with metaphyseal chondrodysplasia, ion binding, spermatogenic failure, intracellular mRNA localization, and cellular component organization. Additionally, FOCAD was associated with Focadhesin in the Landrace breed, whereas PDE6D to GTPase inhibitor activity was found in the Yorkshire breed. These findings offer insights into the genetic basis of reproductive traits (NBA and TNB) in pig breeds, thereby aiding future breeding strategies to enhance sow productivity and herd performance.

Author Contributions

Conceptualization, K.T.M. and K.-S.S.; methodology, K.T.M. and D.-H.L.; software, K.T.M. and D.-H.L.; validation, K.T.M., K.-S.S., Y.-G.C. and A.-Y.S.; formal analysis, K.T.M., D.-H.L. and Y.-G.C.; investigation, K.T.M.; data curation, K.T.M. and A.-Y.S.; writing—original draft preparation, K.T.M.; writing—review and editing, K.T.M. and K.-S.S.; visualization, K.T.M.; supervision, K.-S.S. All authors have read and agreed to the published version of the manuscript.

Funding

This research received no external funding and was supported by the Animal Molecular Biology Laboratory (Animal Breeding and Genetics), Department of Animal Science and Technology, Sunchon National University.

Institutional Review Board Statement

This study waived ethical review and approval due to its nature, which involved analyzing existing genomic data instead of directly experimenting on live animals.

Informed Consent Statement

Not applicable.

Data Availability Statement

The data presented in this study are available on request from the corresponding author due to the privacy of the breeding farm.

Acknowledgments

The authors would like to thank the Korean GGP breeding farm. We are also grateful to the Animal Molecular Biology Laboratory (Animal Breeding and Genetics) of Sunchon National University for all their support during the study. The laboratory was instrumental in facilitating this study, and the authors are grateful for the resources and support provided.

Conflicts of Interest

The authors declare no conflicts of interest.

References

  1. Onteru, S.; Fan, B.; Du, Z.Q.; Garrick, D.; Stalder, K.; Rothschild, M. A whole-genome association study for pig reproductive traits. Anim. Genet. 2012, 43, 18–26. [Google Scholar] [CrossRef] [PubMed]
  2. Melo, T.P.; Fortes, M.R.; Bresolin, T.; Mota, L.F.; Albuquerque, L.G.; Carvalheiro, R. Multitrait meta-analysis identified genomic regions associated with sexual precocity in tropical beef cattle. J. Anim. Sci. 2018, 96, 4087–4099. [Google Scholar] [CrossRef] [PubMed]
  3. Rothschild, M.; Jacobson, C.; Vaske, D.; Tuggle, C.; Wang, L.; Short, T.; Eckardt, G.; Sasaki, S.; Vincent, A.; McLaren, D. The estrogen receptor locus is associated with a major gene influencing litter size in pigs. Proc. Natl. Acad. Sci. USA 1996, 93, 201–205. [Google Scholar] [CrossRef]
  4. Fangmann, A.; Sharifi, R.; Heinkel, J.; Danowski, K.; Schrade, H.; Erbe, M.; Simianer, H. Empirical comparison between different methods for genomic prediction of number of piglets born alive in moderate sized breeding populations. J. Anim. Sci. 2017, 95, 1434–1443. [Google Scholar] [CrossRef] [PubMed]
  5. Wu, P.; Wang, K.; Yang, Q.; Zhou, J.; Chen, D.; Ma, J.; Tang, Q.; Jin, L.; Xiao, W.; Jiang, A. Identifying SNPs and candidate genes for three litter traits using single-step GWAS across six parities in Landrace and Large White pigs. Physiol. Genom. 2018, 50, 1026–1035. [Google Scholar] [CrossRef]
  6. Stranger, B.E.; Stahl, E.A.; Raj, T. Progress and promise of genome-wide association studies for human complex trait genetics. Genetics 2011, 187, 367–383. [Google Scholar] [CrossRef] [PubMed]
  7. Waters, K.M.; Stram, D.O.; Hassanein, M.T.; Le Marchand, L.; Wilkens, L.R.; Maskarinec, G.; Monroe, K.R.; Kolonel, L.N.; Altshuler, D.; Henderson, B.E. Consistent association of type 2 diabetes risk variants found in europeans in diverse racial and ethnic groups. PLoS Genet. 2010, 6, e1001078. [Google Scholar] [CrossRef]
  8. Waters, K.M.; Le Marchand, L.; Kolonel, L.N.; Monroe, K.R.; Stram, D.O.; Henderson, B.E.; Haiman, C.A. Generalizability of associations from prostate cancer genome-wide association studies in multiple populations. Cancer Epidemiol. Biomark. Prev. 2009, 18, 1285–1289. [Google Scholar] [CrossRef]
  9. Teslovich, T.M.; Musunuru, K.; Smith, A.V.; Edmondson, A.C.; Stylianou, I.M.; Koseki, M.; Pirruccello, J.P.; Ripatti, S.; Chasman, D.I.; Willer, C.J. Biological, clinical and population relevance of 95 loci for blood lipids. Nature 2010, 466, 707–713. [Google Scholar] [CrossRef]
  10. Wu, P.; Wang, K.; Zhou, J.; Yang, Q.; Yang, X.; Jiang, A.; Jiang, Y.; Li, M.; Zhu, L.; Bai, L. A genome wide association study for the number of animals born dead in domestic pigs. BMC Genet. 2019, 20, 4. [Google Scholar] [CrossRef]
  11. Sun, J.; Xiao, J.; Jiang, Y.; Wang, Y.; Cao, M.; Wei, J.; Yu, T.; Ding, X.; Yang, G. Genome-wide association study on reproductive traits using imputation-based whole-genome sequence data in Yorkshire pigs. Genes 2023, 14, 861. [Google Scholar] [CrossRef] [PubMed]
  12. Sell-Kubiak, E.; Knol, E.F.; Lopes, M. Evaluation of the phenotypic and genomic background of variability based on litter size of Large White pigs. Genet. Sel. Evol. 2022, 54, 1. [Google Scholar] [CrossRef] [PubMed]
  13. Jiang, Y.; Tang, S.; Xiao, W.; Yun, P.; Ding, X. A genome-wide association study of reproduction traits in four pig populations with different genetic backgrounds. Asian-Australas. J. Anim. Sci. 2020, 33, 1400. [Google Scholar] [CrossRef]
  14. Akanno, E.; Schenkel, F.; Sargolzaei, M.; Friendship, R.; Robinson, J. Opportunities for genome-wide selection for pig breeding in developing countries. J. Anim. Sci. 2013, 91, 4617–4627. [Google Scholar] [CrossRef]
  15. He, S.; Di, J.; Han, B.; Chen, L.; Liu, M.; Li, W. Genome-wide scan for runs of homozygosity identifies candidate genes related to economically important traits in Chinese Merino. Animals 2020, 10, 524. [Google Scholar] [CrossRef]
  16. Gibson, J.; Morton, N.E.; Collins, A. Extended tracts of homozygosity in outbred human populations. Hum. Mol. Genet. 2006, 15, 789–795. [Google Scholar] [CrossRef] [PubMed]
  17. Ceballos, F.C.; Joshi, P.K.; Clark, D.W.; Ramsay, M.; Wilson, J.F. Runs of homozygosity: Windows into population history and trait architecture. Nat. Rev. Genet. 2018, 19, 220–234. [Google Scholar] [CrossRef]
  18. Szpiech, Z.A.; Xu, J.; Pemberton, T.J.; Peng, W.; Zöllner, S.; Rosenberg, N.A.; Li, J.Z. Long runs of homozygosity are enriched for deleterious variation. Am. J. Hum. Genet. 2013, 93, 90–102. [Google Scholar] [CrossRef] [PubMed]
  19. Ringbauer, H.; Novembre, J.; Steinrücken, M. Detecting runs of homozygosity from low-coverage ancient DNA. bioRxiv 2020. [Google Scholar]
  20. Ringbauer, H.; Novembre, J.; Steinrücken, M. Parental relatedness through time revealed by runs of homozygosity in ancient DNA. Nat. Commun. 2021, 12, 5425. [Google Scholar] [CrossRef]
  21. Ojeda-Marín, C.; Gutiérrez, J.P.; Formoso-Rafferty, N.; Goyache, F.; Cervantes, I. Differential patterns in runs of homozygosity in two mice lines under divergent selection for environmental variability for birth weight. J. Anim. Breed. Genet. 2024, 141, 193–206. [Google Scholar] [CrossRef] [PubMed]
  22. Mastrangelo, S.; Ciani, E.; Sardina, M.; Sottile, G.; Pilla, F.; Portolano, B.; Consortium, B.O.I. Runs of homozygosity reveal genome-wide autozygosity in Italian sheep breeds. Anim. Genet. 2018, 49, 71–81. [Google Scholar] [CrossRef]
  23. Xie, R.; Shi, L.; Liu, J.; Deng, T.; Wang, L.; Liu, Y.; Zhao, F. Genome-wide scan for runs of homozygosity identifies candidate genes in three pig breeds. Animals 2019, 9, 518. [Google Scholar] [CrossRef]
  24. Zhao, G.; Zhang, T.; Liu, Y.; Wang, Z.; Xu, L.; Zhu, B.; Gao, X.; Zhang, L.; Gao, H.; Liu, G.E. Genome-wide assessment of runs of homozygosity in Chinese wagyu beef cattle. Animals 2020, 10, 1425. [Google Scholar] [CrossRef]
  25. Curik, I.; Ferenčaković, M.; Sölkner, J. Inbreeding and runs of homozygosity: A possible solution to an old problem. Livest. Sci. 2014, 166, 26–34. [Google Scholar] [CrossRef]
  26. Dixit, S.; Singh, S.; Ganguly, I.; Bhatia, A.K.; Sharma, A.; Kumar, N.A.; Dang, A.K.; Jayakumar, S. Genome-wide runs of homozygosity revealed selection signatures in Bos indicus. Front. Genet. 2020, 11, 92. [Google Scholar] [CrossRef]
  27. Onzima, R.B.; Upadhyay, M.R.; Doekes, H.P.; Brito, L.F.; Bosse, M.; Kanis, E.; Groenen, M.A.; Crooijmans, R.P. Genome-wide characterization of selection signatures and runs of homozygosity in Ugandan goat breeds. Front. Genet. 2018, 9, 318. [Google Scholar] [CrossRef] [PubMed]
  28. Peripolli, E.; Munari, D.; Silva, M.; Lima, A.; Irgang, R.; Baldi, F. Runs of homozygosity: Current knowledge and applications in livestock. Anim. Genet. 2017, 48, 255–271. [Google Scholar] [CrossRef]
  29. Colpitts, J.; McLoughlin, P.D.; Poissant, J. Runs of homozygosity in Sable Island feral horses reveal the genomic consequences of inbreeding and divergence from domestic breeds. BMC Genom. 2022, 23, 501. [Google Scholar] [CrossRef]
  30. Islam, R.; Li, Y.; Liu, X.; Berihulay, H.; Abied, A.; Gebreselassie, G.; Ma, Q.; Ma, Y. Genome-wide runs of homozygosity, effective population size, and detection of positive selection signatures in six Chinese goat breeds. Genes 2019, 10, 938. [Google Scholar] [CrossRef]
  31. Brüniche-Olsen, A.; Kellner, K.F.; Anderson, C.J.; DeWoody, J.A. Runs of homozygosity have utility in mammalian conservation and evolutionary studies. Conserv. Genet. 2018, 19, 1295–1307. [Google Scholar] [CrossRef]
  32. Zavarez, L.B.; Utsunomiya, Y.T.; Carmo, A.S.; Neves, H.H.; Carvalheiro, R.; Ferenčaković, M.; Pérez O’Brien, A.M.; Curik, I.; Cole, J.B.; Van Tassell, C.P. Assessment of autozygosity in Nellore cows (Bos indicus) through high-density SNP genotypes. Front. Genet. 2015, 6, 5. [Google Scholar] [CrossRef] [PubMed]
  33. Purcell, S.; Neale, B.; Todd-Brown, K.; Thomas, L.; Ferreira, M.A.; Bender, D.; Maller, J.; Sklar, P.; De Bakker, P.I.; Daly, M.J. PLINK: A tool set for whole-genome association and population-based linkage analyses. Am. J. Hum. Genet. 2007, 81, 559–575. [Google Scholar] [CrossRef] [PubMed]
  34. Yang, J.; Lee, S.H.; Goddard, M.E.; Visscher, P.M. GCTA: A tool for genome-wide complex trait analysis. Am. J. Hum. Genet. 2011, 88, 76–82. [Google Scholar] [CrossRef]
  35. Pearson, T.A.; Manolio, T.A. How to interpret a genome-wide association study. Jama 2008, 299, 1335–1344. [Google Scholar] [CrossRef]
  36. Huang, D.W.; Sherman, B.T.; Lempicki, R.A. Systematic and integrative analysis of large gene lists using DAVID bioinformatics resources. Nat. Protoc. 2009, 4, 44–57. [Google Scholar] [CrossRef]
  37. Huang, D.W.; Sherman, B.T.; Lempicki, R.A. Bioinformatics enrichment tools: Paths toward the comprehensive functional analysis of large gene lists. Nucleic Acids Res. 2009, 37, 1–13. [Google Scholar] [CrossRef]
  38. Liu, L.; Zhou, J.; Chen, C.J.; Zhang, J.; Wen, W.; Tian, J.; Zhang, Z.; Gu, Y. GWAS-based identification of new loci for milk yield, fat, and protein in Holstein cattle. Animals 2020, 10, 2048. [Google Scholar] [CrossRef]
  39. Andersson, L. Genome-wide association analysis in domestic animals: A powerful approach for genetic dissection of trait loci. Genetica 2009, 136, 341–349. [Google Scholar] [CrossRef]
  40. Wang, K.; Liu, D.; Hernandez-Sanchez, J.; Chen, J.; Liu, C.; Wu, Z.; Fang, M.; Li, N. Genome wide association analysis reveals new production trait genes in a male Duroc population. PLoS ONE 2015, 10, e0139207. [Google Scholar] [CrossRef]
  41. Fan, B.; Onteru, S.K.; Du, Z.-Q.; Garrick, D.J.; Stalder, K.J.; Rothschild, M.F. Genome-wide association study identifies loci for body composition and structural soundness traits in pigs. PLoS ONE 2011, 6, e14726. [Google Scholar] [CrossRef] [PubMed]
  42. Wang, J.; Luo, Y.; Fu, W.; Lu, X.; Zhou, J.; Ding, X.; Liu, J.; Zhang, Q. Genome-wide association studies for hematological traits in swine. Anim. Genet. 2013, 44, 34–43. [Google Scholar] [CrossRef] [PubMed]
  43. Bouaziz, M.; Ambroise, C.; Guedj, M. Accounting for population stratification in practice: A comparison of the main strategies dedicated to genome-wide association studies. PLoS ONE 2011, 6, e28845. [Google Scholar] [CrossRef]
  44. Geng, M.-y.; Wang, L.; Song, Y.-y.; Gu, J.; Hu, X.; Yuan, C.; Yang, M.; Pei, W.-j.; Zhang, Y.; Gao, J.-l. Sidt2 is a key protein in the autophagy-lysosomal degradation pathway and is essential for the maintenance of kidney structure and filtration function. Cell Death Dis. 2021, 13, 7. [Google Scholar] [CrossRef] [PubMed]
  45. Liu, F.; Wu, M.; Wu, X.; Chen, D.; Xie, M.; Pan, H. TGM2 accelerates migration and differentiation of BMSCs by activating Wnt/β-catenin signaling. J. Orthop. Surg. Res. 2023, 18, 168. [Google Scholar] [CrossRef]
  46. Chang, W.; Gao, W.; Liu, D.; Luo, B.; Li, H.; Zhong, L.; Chen, Y. The upregulation of TGM2 is associated with poor prognosis and the shaping of the inflammatory tumor microenvironment in lung squamous cell carcinoma. Am. J. Cancer Res. 2024, 14, 2823. [Google Scholar] [CrossRef] [PubMed]
  47. Mchta, K. Mammalian transglutaminases: A family portrait. Prog. Exp. Tumor Res. 2005, 38, 5–7. [Google Scholar]
  48. Agnihotri, N.; Kumar, S.; Mehta, K. Tissue transglutaminase as a central mediator in inflammation-induced progression of breast cancer. Breast Cancer Res. 2013, 15, 202. [Google Scholar] [CrossRef]
  49. Bencze, J.; Mórotz, G.M.; Seo, W.; Bencs, V.; Kálmán, J.; Miller, C.C.J.; Hortobágyi, T. Biological function of Lemur tyrosine kinase 2 (LMTK2): Implications in neurodegeneration. Mol. Brain 2018, 11, 20. [Google Scholar] [CrossRef]
  50. Clavijo, R.I.; Arora, H.; Gibbs, E.; Cohen, S.; Griswold, A.; Bakircioglu, E.; Bademci, G.; Tekin, M.; Ramasamy, R. Whole exome sequencing of a consanguineous Turkish family identifies a mutation in GTF2H3 in brothers with spermatogenic failure. Urology 2018, 120, 86–89. [Google Scholar] [CrossRef]
  51. Ye, J.; Li, X.; Pan, Z.; Wu, Z.; Zhu, Y.; Zhang, W.; Lu, J.; Xu, S.; Qin, P.; Liu, Y. Grid1 regulates the onset of puberty in female rats. J. Vet. Med. Sci. 2024, 86, 497–506. [Google Scholar] [CrossRef] [PubMed]
  52. Yu, Y.; Tencer, A.; Xuan, H.; Kutateladze, T.G.; Shi, X. ZZEF1 is a histone reader and transcriptional coregulator of Krüppel-like factors. J. Mol. Biol. 2021, 433, 166722. [Google Scholar] [CrossRef]
  53. Wasik, K.A.; Tam, O.H.; Knott, S.R.; Falciatori, I.; Hammell, M.; Vagin, V.V.; Hannon, G.J. RNF17 blocks promiscuous activity of PIWI proteins in mouse testes. Genes Dev. 2015, 29, 1403–1415. [Google Scholar] [CrossRef] [PubMed]
  54. Mekonnen, K.T.; Lee, D.-H.; Cho, Y.-G.; Son, A.-Y.; Seo, K.-S. Genomic and Conventional Inbreeding Coefficient Estimation Using Different Estimator Models in Korean Duroc, Landrace, and Yorkshire Breeds Using 70K Porcine SNP BeadChip. Animals 2024, 14, 2621. [Google Scholar] [CrossRef] [PubMed]
  55. Rachev, E.; Schuster-Gossler, K.; Fuhl, F.; Ott, T.; Tveriakhina, L.; Beckers, A.; Hegermann, J.; Boldt, K.; Mai, M.; Kremmer, E. CFAP43 modulates ciliary beating in mouse and Xenopus. Dev. Biol. 2020, 459, 109–125. [Google Scholar] [CrossRef]
  56. Yu, Y.; Wang, J.; Zhou, L.; Li, H.; Zheng, B.; Yang, S. CFAP43-mediated intra-manchette transport is required for sperm head shaping and flagella formation. Zygote 2021, 29, 75–81. [Google Scholar] [CrossRef]
  57. Jin, Z.; Zhao, L.; Chang, Y.; Jin, R.; Hu, F.; Wu, S.; Xue, Z.; Ma, Y.; Chen, C.; Zheng, M. CRTAC1 enhances the chemosensitivity of non-small cell lung cancer to cisplatin by eliciting RyR-mediated calcium release and inhibiting Akt1 expression. Cell Death Dis. 2023, 14, 563. [Google Scholar] [CrossRef]
  58. Rademacher, D.J.; Bello, A.I.; May, J.P. CASC3 Biomolecular Condensates Restrict Turnip Crinkle Virus by Limiting Host Factor Availability. J. Mol. Biol. 2023, 435, 167956. [Google Scholar] [CrossRef] [PubMed]
  59. Gerbracht, J.V.; Boehm, V.; Britto-Borges, T.; Kallabis, S.; Wiederstein, J.L.; Ciriello, S.; Aschemeier, D.U.; Krüger, M.; Frese, C.K.; Altmüller, J. CASC3 promotes transcriptome-wide activation of nonsense-mediated decay by the exon junction complex. Nucleic Acids Res. 2020, 48, 8626–8644. [Google Scholar] [CrossRef]
  60. Woodley, K.T.; Collins, M.O. S-acylated Golga7b stabilises DHHC 5 at the plasma membrane to regulate cell adhesion. EMBO Rep. 2019, 20, e47472. [Google Scholar] [CrossRef]
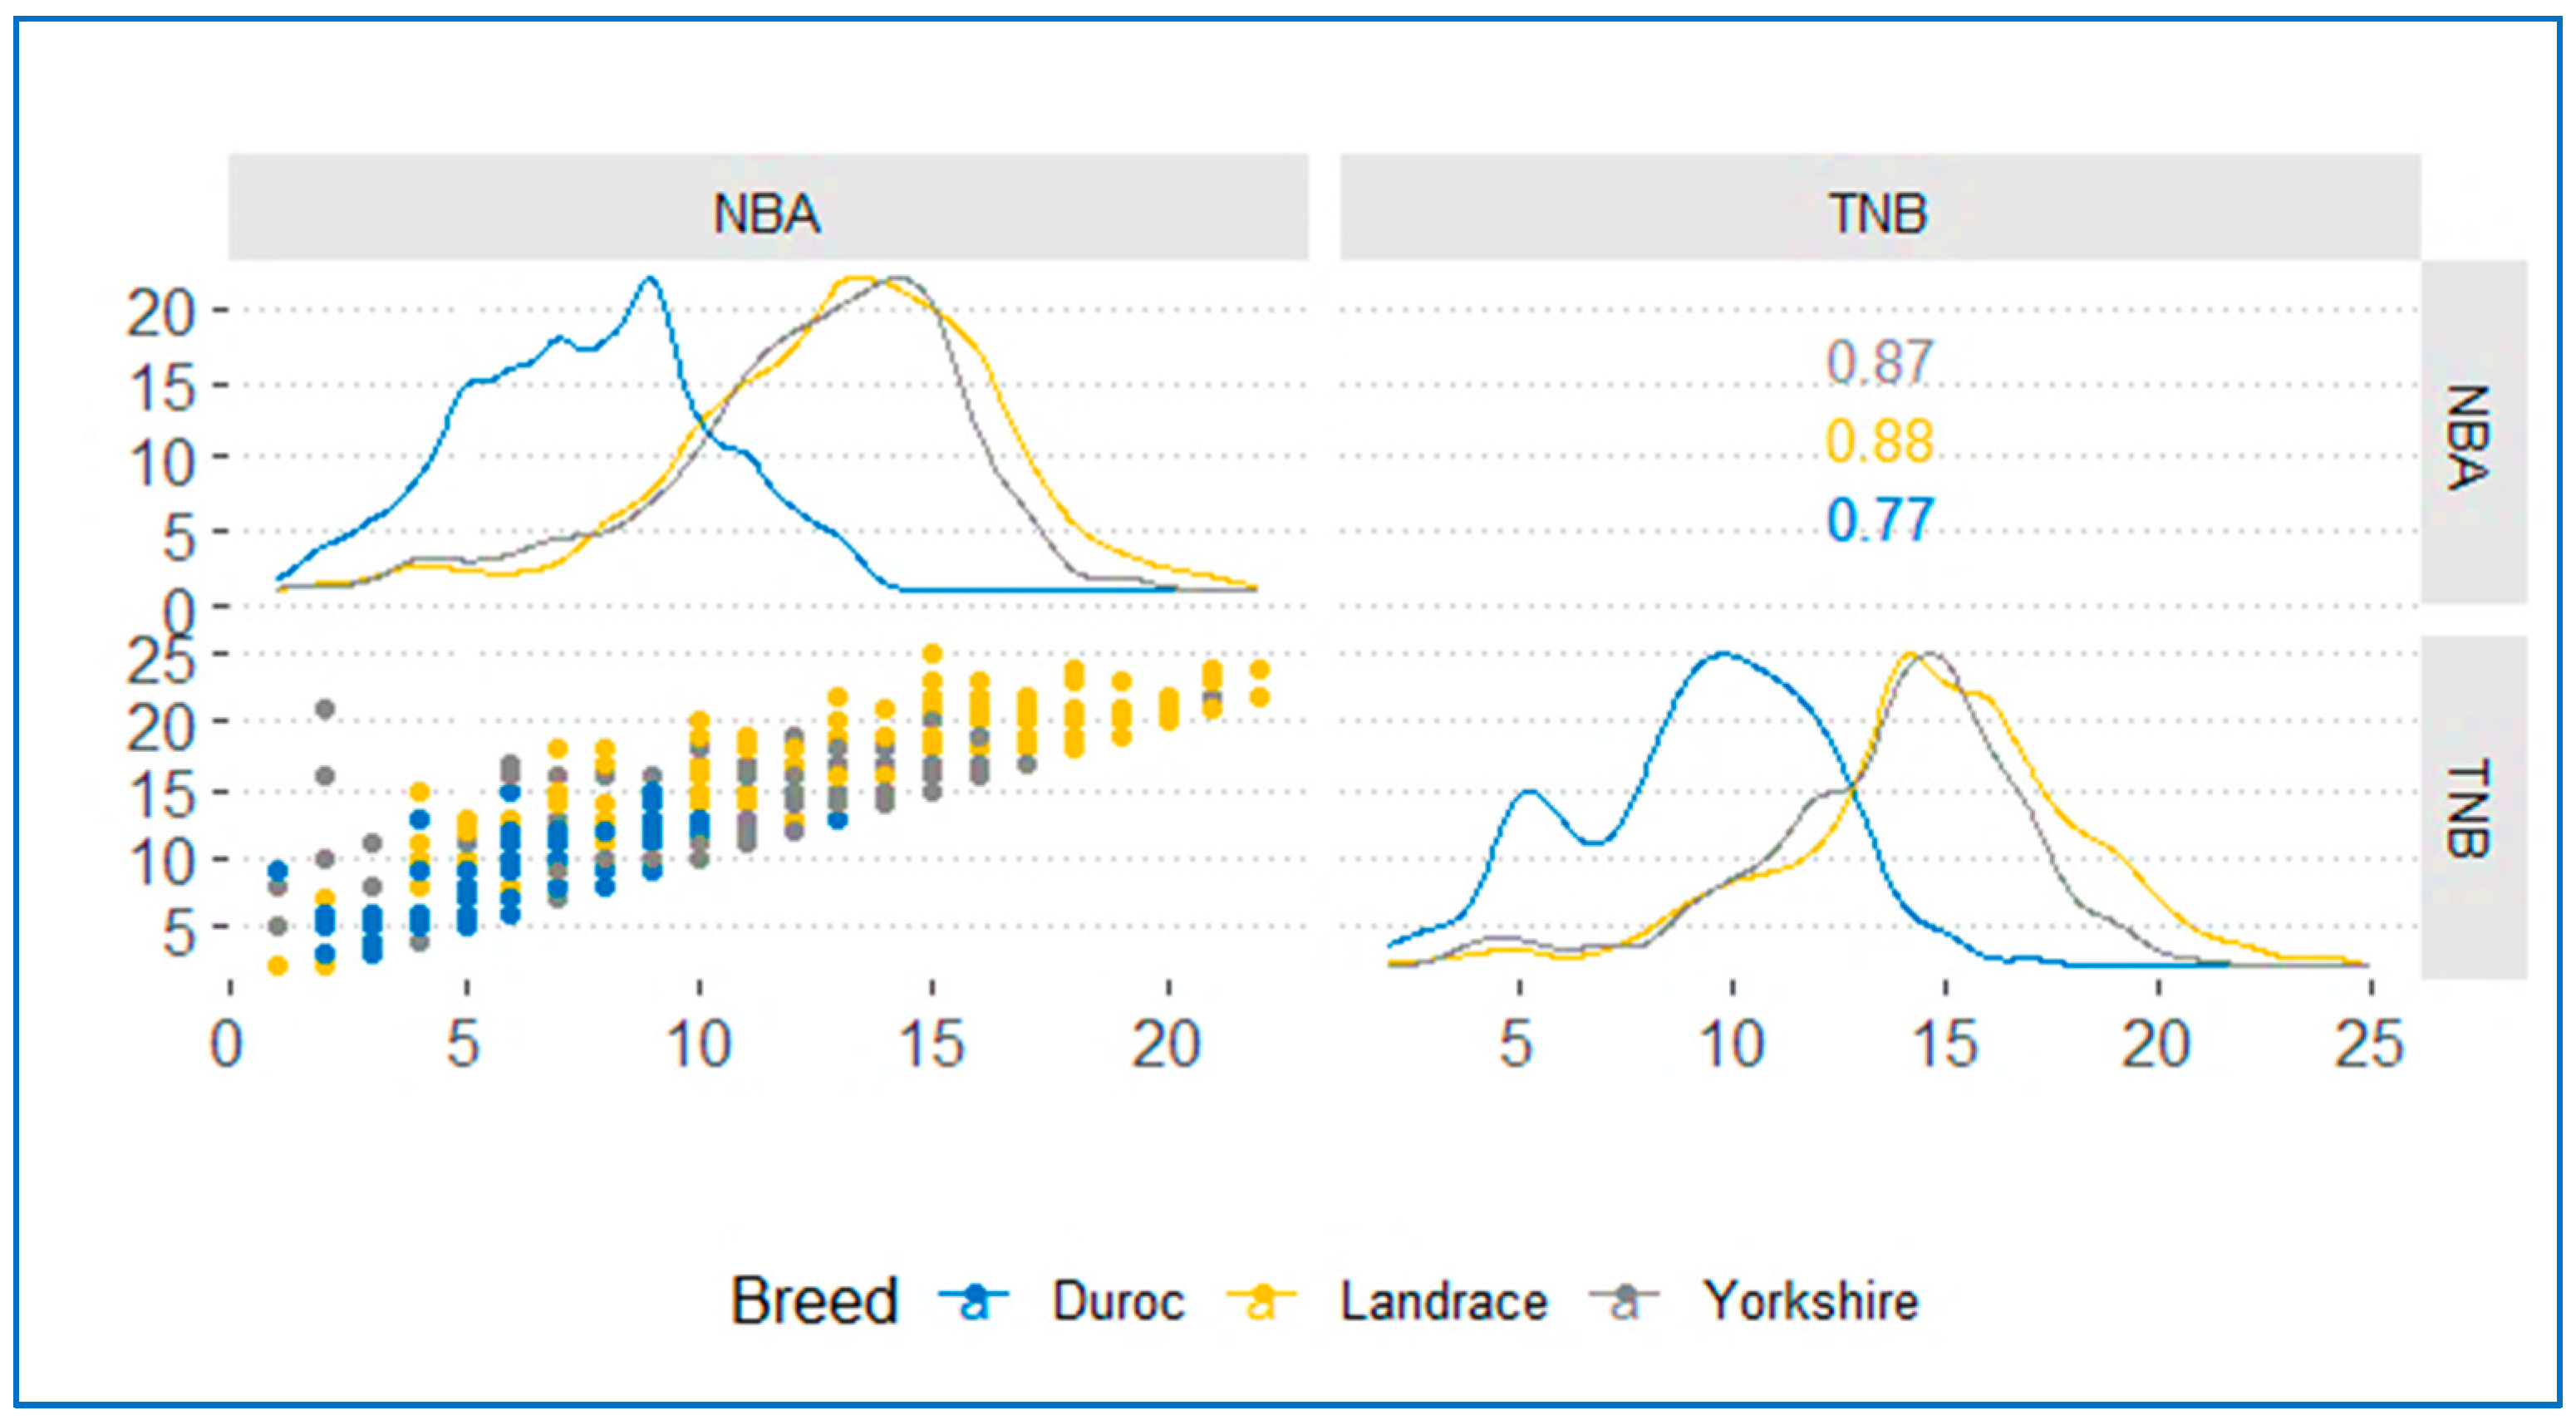
Figure 1. Spearman’s correlation coefficient between NBA and TNB traits in the three breeds. The three distinct colors represent traits from three different breeds.
Genes 15 01422 g001
Figure 2. Visualization of the dataset of the first three principal components of the PCA plot illustrating genotype clustering in the three Korean commercial pig breeds using SNPs. The PCA plot displayed individuals clustered based on their genetic similarities: in (a), the variance is explained by principal component 1 (24.2%) and principal component 2 (15.14%), and in (b), the variance is explained by principal component 1 (24.2%) and principal component 3 (2.06%).
Genes 15 01422 g002
Figure 3. Scree plot illustrating the percentage of variance explained by each component in the three Korean commercial pig breeds based on SNP data.
Genes 15 01422 g003
Figure 4. A Manhattan plot of genome−wide association studies for NBA traits in Duroc, Landrace, and Yorkshire commercial pig populations. The negative log10 p-values of the quantified SNPs are plotted against their genomic positions on the vertical axis. Different colors indicate different chromosomes. The horizontal red and blue lines represent genome−wide significance and chromosome−wide (suggestive) Bonferroni−corrected thresholds, respectively.
Genes 15 01422 g004
Figure 5. A Manhattan plot of genome−wide association studies for TNB traits in Duroc, Landrace, and Yorkshire commercial pig populations. The negative log10 p-values of the quantified SNPs were plotted against their genomic positions on the vertical axis. Different colors indicate various chromosomes. The horizontal red and blue lines represent genome−wide significant and chromosome−wide (suggestive) Bonferroni−corrected thresholds, respectively.
Genes 15 01422 g005
Figure 6. Quantile–quantile (Q–Q) plot of genome-wide association studies for NBA and TNB in Duroc, Landrace, and Yorkshire Korean commercial breeds. The Q-Q plots show the observed versus expected log p-values of the traits.
Genes 15 01422 g006
Table 1. Descriptive statistics of NBA and TNB in three Korean breeds.
TraitsDurocLandraceYorkshire
nMean ± SDnMean ± SDnMean ± SD
NBA11627.60 ± 2.65178212.42 ± 3.11236313.06 ± 3.27
TNB11629.26 ± 2.92178313.61 ± 3.20236414.61 ± 3.52
Table 2. Potential SNPs and candidate genes identified by the genome-wide association study of NBA and TNB in Duroc breeds. None of the displayed SNPs exceeded the genome-wide threshold or were unmarked, indicating that they met the suggestive threshold.
TraitSSCSNPPositionp-ValueAlleleβDistanceGeneGene ID
TNB13Affx-115053386181,341,2641.52 × 10−6G/A12.11withinUnknownENSSSCG00000063239
TNB8WU_10.2_8_1834220018,342,2002.01 × 10−6A/C−10.84withinUnknownENSSSCG00000056996
NBA8WU_10.2_8_1834220018,342,2008.68 × 10−7A/C−6.498withinUnknownENSSSCG00000056996
NBA13Affx-115053386181,341,2649.56 × 10−7G/A6.483131UnknownENSSSCG00000063239
NBA9DRGA000952144,552,3603.23 × 10−6G/A−6.292withinSIDT2ENSSSCG00000015074
NBA17ASGA007673241,226,4485.07 × 10−6G/A6.224811TGM2ENSSSCG00000023522
TNB: total number born; NBA—number born alive; SSC—Sus Scrofa chromosomes, SNP—single-nucleotide polymorphisms; ’Distance’ columns are base pairs; ‘within’ means within the gene given in the next column on the right side.
Table 3. Potential SNPs and candidate genes identified by the genome-wide association study of NBA and TNB in Landrace breeds. None of the displayed SNPs exceeded the genome-wide threshold or were unmarked, indicating that they met the suggestive threshold.
TraitsSSCSNPPositionp-ValueAlleleβDistanceGenesGene ID
TNB1WU_10.2_1_1378858813,788,5881.35 × 10−6G/A8.778withinUnknownENSSSCG00000004081
TNB9ALGA005362774,677,6002.33 × 10−6A/G−8.525withinPPP1R9AENSSSCG00000015329
TNB3ALGA00178535,346,8403.32 × 10−6A/G−12.24withinLMTK2ENSSSCG00000007599
TNB14ALGA007657329,354,7683.38 × 10−6A/C−8.139withinGTF2H3ENSSSCG00000009769
NBA1WU_10.2_1_1378858813,788,5881.34 × 10−6G/A8.65withinUnknownENSSSCG00000004081
NBA9ALGA005362774,677,6001.55 × 10−6A/G−8.483withinPPP1R9AENSSSCG00000015329
NBA3ALGA00178535,346,8402.37 × 10−6A/G−12.17withinLMTK2ENSSSCG00000007599
NBA14ALGA007657329,354,7683.06 × 10−6A/C−8.039withinGTF2H3ENSSSCG00000009769
TNB—total number born; NBA—number born alive; SSC—Sus Scrofa chromosomes, SNP—single-nucleotide polymorphisms; ‘Distance’ columns are base pairs; ‘within’ means within the gene given in the next column on the right side.
Table 4. Potential SNPs and candidate genes identified by the genome-wide association study of NBA in Yorkshire breeds. SNPs that surpass the genome-wide threshold are displayed in black and bold, whereas the remaining unmarked SNPs meet the suggestive threshold.
TraitSSCSNPPositionp-ValueAlleleβDistanceGenesGene ID
NBA14DRGA001417686,922,8166.43 × 10−7A/G9.944withinGRID1ENSSSCG00000010352
NBA15WU_10.2_15_3295869632,958,6966.68 × 10−7G/A8.485withinDLGAP2ENSSSCG00000015746
NBA14DRGA001417786,969,0086.68 × 10−7A/C9.935withinGRID1ENSSSCG00000010352
NBA1MARC0036130218,896,1927.39 × 10−7A/G−15.73withinUnknownENSSSCG00000039823
NBA12H3GA003458750,146,8968.41 × 10−7G/A−18.33withinZZEF1ENSSSCG00000032049
NBA10WU_10.2_10_2363240823,632,4081.58 × 10−6G/A−9.205withinUnknownENSSSCG00000036948
NBA17H3GA004805922,512,7201.80 × 10−6A/G−9.6053838SEL1L2ENSSSCG00000007078
NBA1ASGA000315967,590,0482.86 × 10−6G/A−8.503withinASCC3ENSSSCG00000004358
NBA18WU_10.2_18_2622673126,226,7323.21 × 10−6A/G−12.03withinKCND2ENSSSCG00000016621
NBA3ASGA001425311,933,5353.36 × 10−6A/G9.992withinRCC1LENSSSCG00000007723
NBA1WU_10.2_1_1494680714,946,8073.56 × 10−6A/G−9.535withinAKAP12ENSSSCG00000031733
NBA3ASGA0097775107,125,9925.56 × 10−6A/G−8.23withinBIRC6ENSSSCG00000008513
NBA5ASGA002470715,346,4375.66 × 10−6A/G8.8111196SPATS2ENSSSCG00000000199
NBA—number born alive; SSC—Sus Scrofa chromosomes, SNP—single-nucleotide polymorphisms; ‘Distance’ columns are base pairs; ‘within’ means within the gene given in the next column on the right side.
Table 5. Potential SNPs and candidate genes identified by the genome-wide association study of TNB in Yorkshire breeds. SNPs that surpass the genome-wide threshold are displayed in black and bold, whereas the remaining unmarked SNPs meet the suggestive threshold.
TraitSSCSNPPositionp-ValueAlleleβDistanceGenesGene ID
TNB14ASGA006484490,362,7686.20× 107A/C10.05withinPARGENSSSCG00000010396
TNB11MARC0024643173,4947.57× 107A/G−19.93withinRNF17ENSSSCG00000009572
TNB14MARC008830386,898,0649.56× 107A/G10.01withinGRID1ENSSSCG00000010352
TNB15WU_10.2_15_3295869632,958,6961.03 × 10−-6G/A8.489withinDLGAP2ENSSSCG00000015746
TNB12H3GA003458750,146,8961.11 × 10−6G/A−18.4withinZZEF1ENSSSCG00000032049
TNB14DRGA001417686,922,8161.22 × 10−6A/G9.901withinGRID1ENSSSCG00000010352
TNB14DRGA001417786,969,0081.27 × 10−6A/C9.892withinGRID1ENSSSCG00000010352
TNB1MARC0036130218,896,1921.33 × 10−6A/G−15.68withinUnknownENSSSCG00000039823
TNB17H3GA004805922,512,7202.47 × 10−6A/G−9.6323939NDUFAF5ENSSSCG00000007076
TNB1ASGA000315967,590,0482.67 × 10−6G/A−8.608withinASCC3ENSSSCG00000004358
TNB10WU_10.2_10_2363240823,632,4082.77 × 10−6G/A−9.178withinUnknownENSSSCG00000036948
TNB18WU_10.2_18_2622673126,226,7324.17 × 10−6A/G−12.07withinKCND2ENSSSCG00000016621
TNB1WU_10.2_1_1494680714,946,8075.08 × 10−6A/G−9.55withinAKAP12ENSSSCG00000031733
NBA—number born alive; SSC—Sus Scrofa chromosomes, SNP—single-nucleotide polymorphisms; ‘Distance’ columns are base pairs; ‘within’ means within the gene given in the next column on the right side.
Table 6. Breed specific genes and their function within ROH island regions in three breeds.
BreedGene IDGenesSSCStart (bp)End (bp)Pos (Mbp)Function
DDENSSSCG00000004435NT5DC1181,746,02281,881,11381.75Metaphyseal Chondrodysplasia
DDENSSSCG00000010530CRTAC114109,223,293109,390,691109.22Ion binding
DDENSSSCG00000010609CFAP4314115,073,366115,174,043115.07Spermatogenic failure 19
DDENSSSCG00000017477CASC31222,199,22822,221,49922.20Intracellular mRNA localization
DDENSSSCG00000024417ERC21337,388,51738,367,50437.39Cellular component organization
DDENSSSCG00000040359GOLGA7B14109,210,866109,225,153109.21Golgin A7 family member B
LLENSSSCG00000028406FOCAD1201,942,463202,258,794201.88Focadhesin
YYENSSSCG00000016279PDE6D15132,375,743132,426,683132.38GTPase inhibitor activity
DD—Duroc; LL—Landrace; YY—Yorkshire; SSC—Sus Scrofa chromosomes, ROH—run of homozygosity; Pos—position.
Disclaimer/Publisher’s Note: The statements, opinions and data contained in all publications are solely those of the individual author(s) and contributor(s) and not of MDPI and/or the editor(s). MDPI and/or the editor(s) disclaim responsibility for any injury to people or property resulting from any ideas, methods, instructions or products referred to in the content.