Article

Characterization of the Mitochondrial Genome of Cambaroides schrenckii (Astacidea: Cambaridae) and Its Phylogenetic Implications

1
Key Laboratory of Prevention and Control of Zoonotic Diseases of Daqing, College of Animal Science and Veterinary Medicine, Heilongjiang Bayi Agricultural University, Daqing 163319, China
2
Animal Disease Prevention and Control Center in Huanan County, Jiamusi 154400, China
3
Branch of Animal Husbandry and Veterinary of Heilongjiang Academy of Agricultural Sciences, Qiqihar 161005, China
4
Longsha Zoological and Botanical Gardens, Qiqihar 161006, China
*
Author to whom correspondence should be addressed.
These authors contributed equally to this work.
Genes 2024, 15(12), 1578; https://doi.org/10.3390/genes15121578
Submission received: 23 October 2024 / Revised: 22 November 2024 / Accepted: 6 December 2024 / Published: 8 December 2024
(This article belongs to the Section Animal Genetics and Genomics)

Abstract

:
Background: Cambaroides schrenckii is an endangered freshwater crayfish in China, belonging to the genus Cambaroides, that can act as a complementary host for paragonimus. The objective of this study was to examine the complete mitochondrial genome characteristics and their evolutionary relationships within the Astacidea. Methods: The analysis of gene rearrangements and evolutionary relationships was conducted through the sequencing of the mitochondrial genome of C. schrenckii. Results: C. schrenckii mitochondrial genome length was 15,572, comprising thirteen PCGs, two rRNAs, 22 tRNAs, and one d-loop region of C. schrenckii. The mitochondrial genome of C. schrenckii exhibits an A + T content of 69.61% and a G + C content of 30.39%. Among the thirteen PCGs, cytb, nad3, and nad6 have a start codon of ATT, while the other ten PCGs have ATC, ATA, and ATG start codons. All 22 tRNA genes displayed a typical cloverleaf secondary structure. Gene rearrangement analysis showed that seven gene arrangements were identified based on PCGs in the infraorder Astacidea, with type I being the most common. Conclusions: The relationship between the American Cambaridae is closer to Astacidae than the Asian Cambaridae. The present study provides a theoretical basis for further discussions of developmental relationships in the infraorder Astacidea.

Graphical Abstract

1. Introduction

Astacidea is classified within the Arthropoda, Malacostraca, and Decapoda orders. The most salient distinction between members of Astacidea and other Decapoda species is the existence of chelae on the first three pairs of thoracic limbs, with the first pair of chelae being larger than the others. Additionally, the thoracic limbs of the last two pairs are simple, except for the fifth step in Thaumastocheles japonicus, which may be equipped with tiny pincers [1]. Morphological characteristics were used to identify five principal families within the infraorder Astacidea. These include two families of freshwater crustaceans (Astacoidea and Parastacoidea), Nephropoidea, Enoplometopoidea, and other families with only fossilised species. As of 2022, the families Cambaridae and Astacidae were included in Astacoidea, which contains 677 species; however, the majority are from the family Cambaridae, with about 600 species [2]. Crayfish are not only a source of culinary delight but also a significant contributor to economic well-being.
C. schrenckii (Kessler, 1874) (Decapoda: Astacidea: Cambaridae) constitutes an ecologically and economically important species native to Cambaridae and endemic to the Yalu, Heilongjiang, Ussuri rivers, and Khanka Lake in China [3]. C. schrenckii prefers to live in water with lower temperatures due to its high tolerance for water quality. Nevertheless, the population of C. schrenckii has experienced a notable decline in recent years, largely attributed to the detrimental effects of water pollution. In 2004, C. schrenckii was listed as endangered on the China Species Red List (http://protection.especies.cn/chineseredlist/list (accessed on 21 April 2024)) [4]. Furthermore, C. schrenckii represents a significant role as an important complementary host of paragonimus, transmitting the disease to infects dogs, cats, and mice in addition to humans. Furthermore, it is present in 22 provinces and cities in China [5,6]. It is believed that approximately one million people are infected globally each year, making it a significant threat to public health security [7,8].
The identification and classification of substances represents the foundation of all research endeavours. The accurate classification and identification of substances can provide fundamental data for the genetic evolution of corresponding diseases, quantitative genetics, and scientific prevention and control. The mitochondrial genome is a relatively simple, short DNA molecule that evolves rapidly [9,10]. It contains a wealth of genetic information in short sequence fragments, rendering it an optimal molecular marker [11,12]. In the past few years, developments in high-throughput sequencing have provided a more convenient method for studying the complete mitochondrial genome. This method is commonly utilised in the areas of phylogeny, population genetics, and systematics in freshwater crustaceans [13,14]. The phylogenetic and phylogeographic relationships of Austropotamobius (European freshwater crayfish) have been revealed based on mitochondrial cox1 sequences [15,16,17]. Using geological proof, phylogeographic studies, and sequences from five genetic regions to investigate the species limits and phylogeographic framework of the freshwater crayfish subgenus Aviticambarus (Cambaridae: Cambarus) revealed patterns of cave colonisation. Furthermore, alongside the three currently recognised taxa, two well-supported cryptic species were identified. Four taxa displayed low levels of current and historical genetic diversity, possibly indicating that local extinction events in crayfish are associated with geological and watershed changes [18]. A study of the molecular phylogeny and species classification analysis of all known lobster species in the Pánuco River basin based on the mitochondrial genes 16S rDNA, 12S rDNA, and cox1 was conducted [19,20].
Despite the importance of crayfish in the field of zoology, the mitochondrial genome of the Cambaridae family has been the focus of less research than other crustaceans. To date, only the mitochondrial genome sequences of 18 species within this family have been entered into the GenBank database. This lack of research has significantly impeded the development of molecular systematics of crayfish. Therefore, the mitochondrial genome of C. schrenckii was first determined. Comparisons and analyses of genome sequences of other crayfish species belonging to different families of the infraorder Astacidea have been published. Gene rearrangements were conducted, and phylogenetic trees were constructed for the infraorder Astacidea to provide a reference for the taxonomic status of C. schrenckii. The findings of this study not only enhance the mitochondrial genome data, but also offer novel insights into the classification and phylogeny of Astacidea. Furthermore, they provide an efficient approach to utilising resources for the phylogenetic study of crayfish.

2. Materials and Methods

2.1. Collection Sample, Extraction of Genomic DNA, and PCR Amplifications

C. schrenckii was gathered from Shuangyashan City (46°19′ N, 132°11′ E), Heilongjiang Province. The study protocol was reviewed and approved by the Heilongjiang Bayi Agricultural University Animal Ethics Committee on 11 March 2024 (Approval No. DWKJXY2024027). The sample was carefully cleaned in physiological saline solution, morphologically recognised in accordance with the available description, fixed with 75% ethanol, kept at −20℃, and observed within 48 h. As per the guidelines provided by the manufacturer, the DNA was extracted from a sample muscle tissue using TIANamp genomic DNA kit (TIANGEN Biotech, Beijing, China). Subsequently, the concentration and purity of the proposed DNA were determined using a NanoDrop spectrophotometer 2000 (NanoDrop Technologies, Wilmington, DC, USA). Then, C. schrenckii genomic DNA was enhanced by means of PCR reaction. The total volume was 25 μL, and the DNA sample included 1 μL and 2× Tks Gflex PCR buffer (Mg2+, dNTP plus) (Takara, Dalian, China) at 12.5 μL. Each primer (10 pmol/μL) was synthesised by Qingke Biotech (Harbin, China) at 0.5 μL, ddH2O 10 μL, and Tks Gflex DNA Polymerase (1.25 U/μL) (Takara, Dalian, China) at 0.5 μL. The amplification reaction system was as follows: 95 °C for 1 min; 98 °C for 10 s; 50–64 °C for 30 s; 68 °C for 1 min for 35 cycles; and 72 °C for 7 min. PCR products were measured in 1.0% agarose gel and were ethidium bromide-stained. Molecular identification was conducted by increasing the cox1 sequence. The primers were F (5′- GAG CCT CCG TTG ACC T -3′) and R (5′- TGT GAT AAA CAC CGA CCA -3′).

2.2. Mitochondrial Genome Sequencing and Assembly, Gene Annotation, and Sequence Analysis

C. schrenckii mitochondrial genome high-throughput sequencing was performed using the Illumina NovaSeq platform, and 3.2 GB of NGS data were collected with a read length of 150 bp. Quality control was carried out on the data after sequencing, and linker sequences were filtered. Data pruning mainly included the following points: (1) AdapterRemoval (Version2) was adopted for joint pollution removal at the 3′ end [21]. (2) Mass filtering was carried out by sliding window method with the window size set to 5 bp. Slide the window from the 3′ end to the 5′ and calculate the average Q value of the base in the window; if the Q < 20, delete the base in the window. (3) For length filtering, if the length of any reads in the double end is S 50 bp, the double-end reads are removed. (4) For fuzzy base N filtering, if the number of N bases in the double end is greater than or equal to s, the double-end reads are removed. After quality control, C. dauricus (GenBank OL542521) from the same genus served as the reference genome for sequence comparison, and the double-ended data were input into SPAdes v3.15.4 and GetOrganelle v1.7.7.0 for assembly [22,23]. Once the boundaries of the protein-coding genes were determined, they were used in an online analysis through ORF finder (https://www.ncbi.nlm.nih.gov/orffinder/ (accessed on 21 April 2024) ). Then, the 13 PCGs started, the termination codons in the mitochondrial genome of C. schrenckii were identified using ORF Finder, and the position and secondary structure of tRNA were predicted using tRNAscan (http://lowelab.ucsc.edu/tRNAscan-SE/ (accessed on 21 April 2024)) [24]. The structure and function were annotated using the MITOS online service (http://mitos2.bioinf.uni-leipzig.de/index.py (accessed on 21 April 2024)) [25]. The annotation results were manually corrected in Geneious R11. CGView [26] server software was used to generate and manually modify the mitochondrial map of C. schrenckii. We obtained relative synonymous codon usage (RSCU) for PCGs using MEGA X under the trematode mitochondrial genetic code pattern [27].

2.3. Mitochondrial Genome Characteristics and Comparative Analyses

Besides the mitochondrial genome sequence of C. schrenckii, the mitochondrial genomes of 42 species (22 Astacoidea species, 2 Enoplometopoidea species, 4 Nephropoidea species, and 14 Parastacoidea species) were obtained from GenBank (Table S1). The nucleotide compositions of ten crustaceans belonging to seven genera of the same superfamily were analysed using Editseq software. Composition skews were calculated according to the formulae AT-skew = [A − T]/[A + T] and GC-skew = [G − C]/[G + C] [28].
By comparing the ratio ω nonsensical substitution rate (dN) and the synonymous substitution rate (dS) of the cox1 gene in ten crustaceans of Astacoidea, we evaluated what kind of natural selection the gene experienced: dN/dS (ω) < 1 represented a negative/purified choice; dN/dS (ω) = 1 represented neutral evolution; and dN/dS (ω) > 1 represented a positive/diversified choice. The selection pressure of mitochondrial genes was measured by the average value of the ratio ω between the dN and dS between pairs of sequences, and the ω value between pairs of sequences was computed in DnaSP version 6.12.1 [29]. The selection pressure (dN/dS) of ten species of Astacoidea superfamily crustaceans was calculated using DnaSP version 5.0. The 13 PCGs in the mitochondrial genome of 5 species of Astacoidea crustaceans were serially connected and analysed using DnaSP version 5.0. They were compared to 6 Cambaroides species of the 13 PCGs nucleotide and amino acid sequences.

2.4. Phylogenetic Analysis

A phylogenetic tree was reconstructed for Astacidea, including 43 species. Chiromantes haematocheir (GenBank accession No. NC_042142.1) served as an outgroup. In phylogenetic analysis, we used MAFFT version 7.471 to align the amino acids of 13 PCGs, as indicated in PhyloSuite [30]. A phylogenetic relationship was reconstructed using maximum likelihood (ML) and Bayesian inference (BI) methods. We used phyML version 3.0 to rebuild the ML tree by performing 100 bootstrap duplicates [31]. Bayesian inference phylogenies were inferred using MrBayes version 3.2.6 [32]. The phylograms were drawn using iTOL version 5.0 (https://itol.embl.de (accessed on 21 April 2024)).

3. Results

3.1. C. schrenckii Mitochondrial Genome Size and Organisation

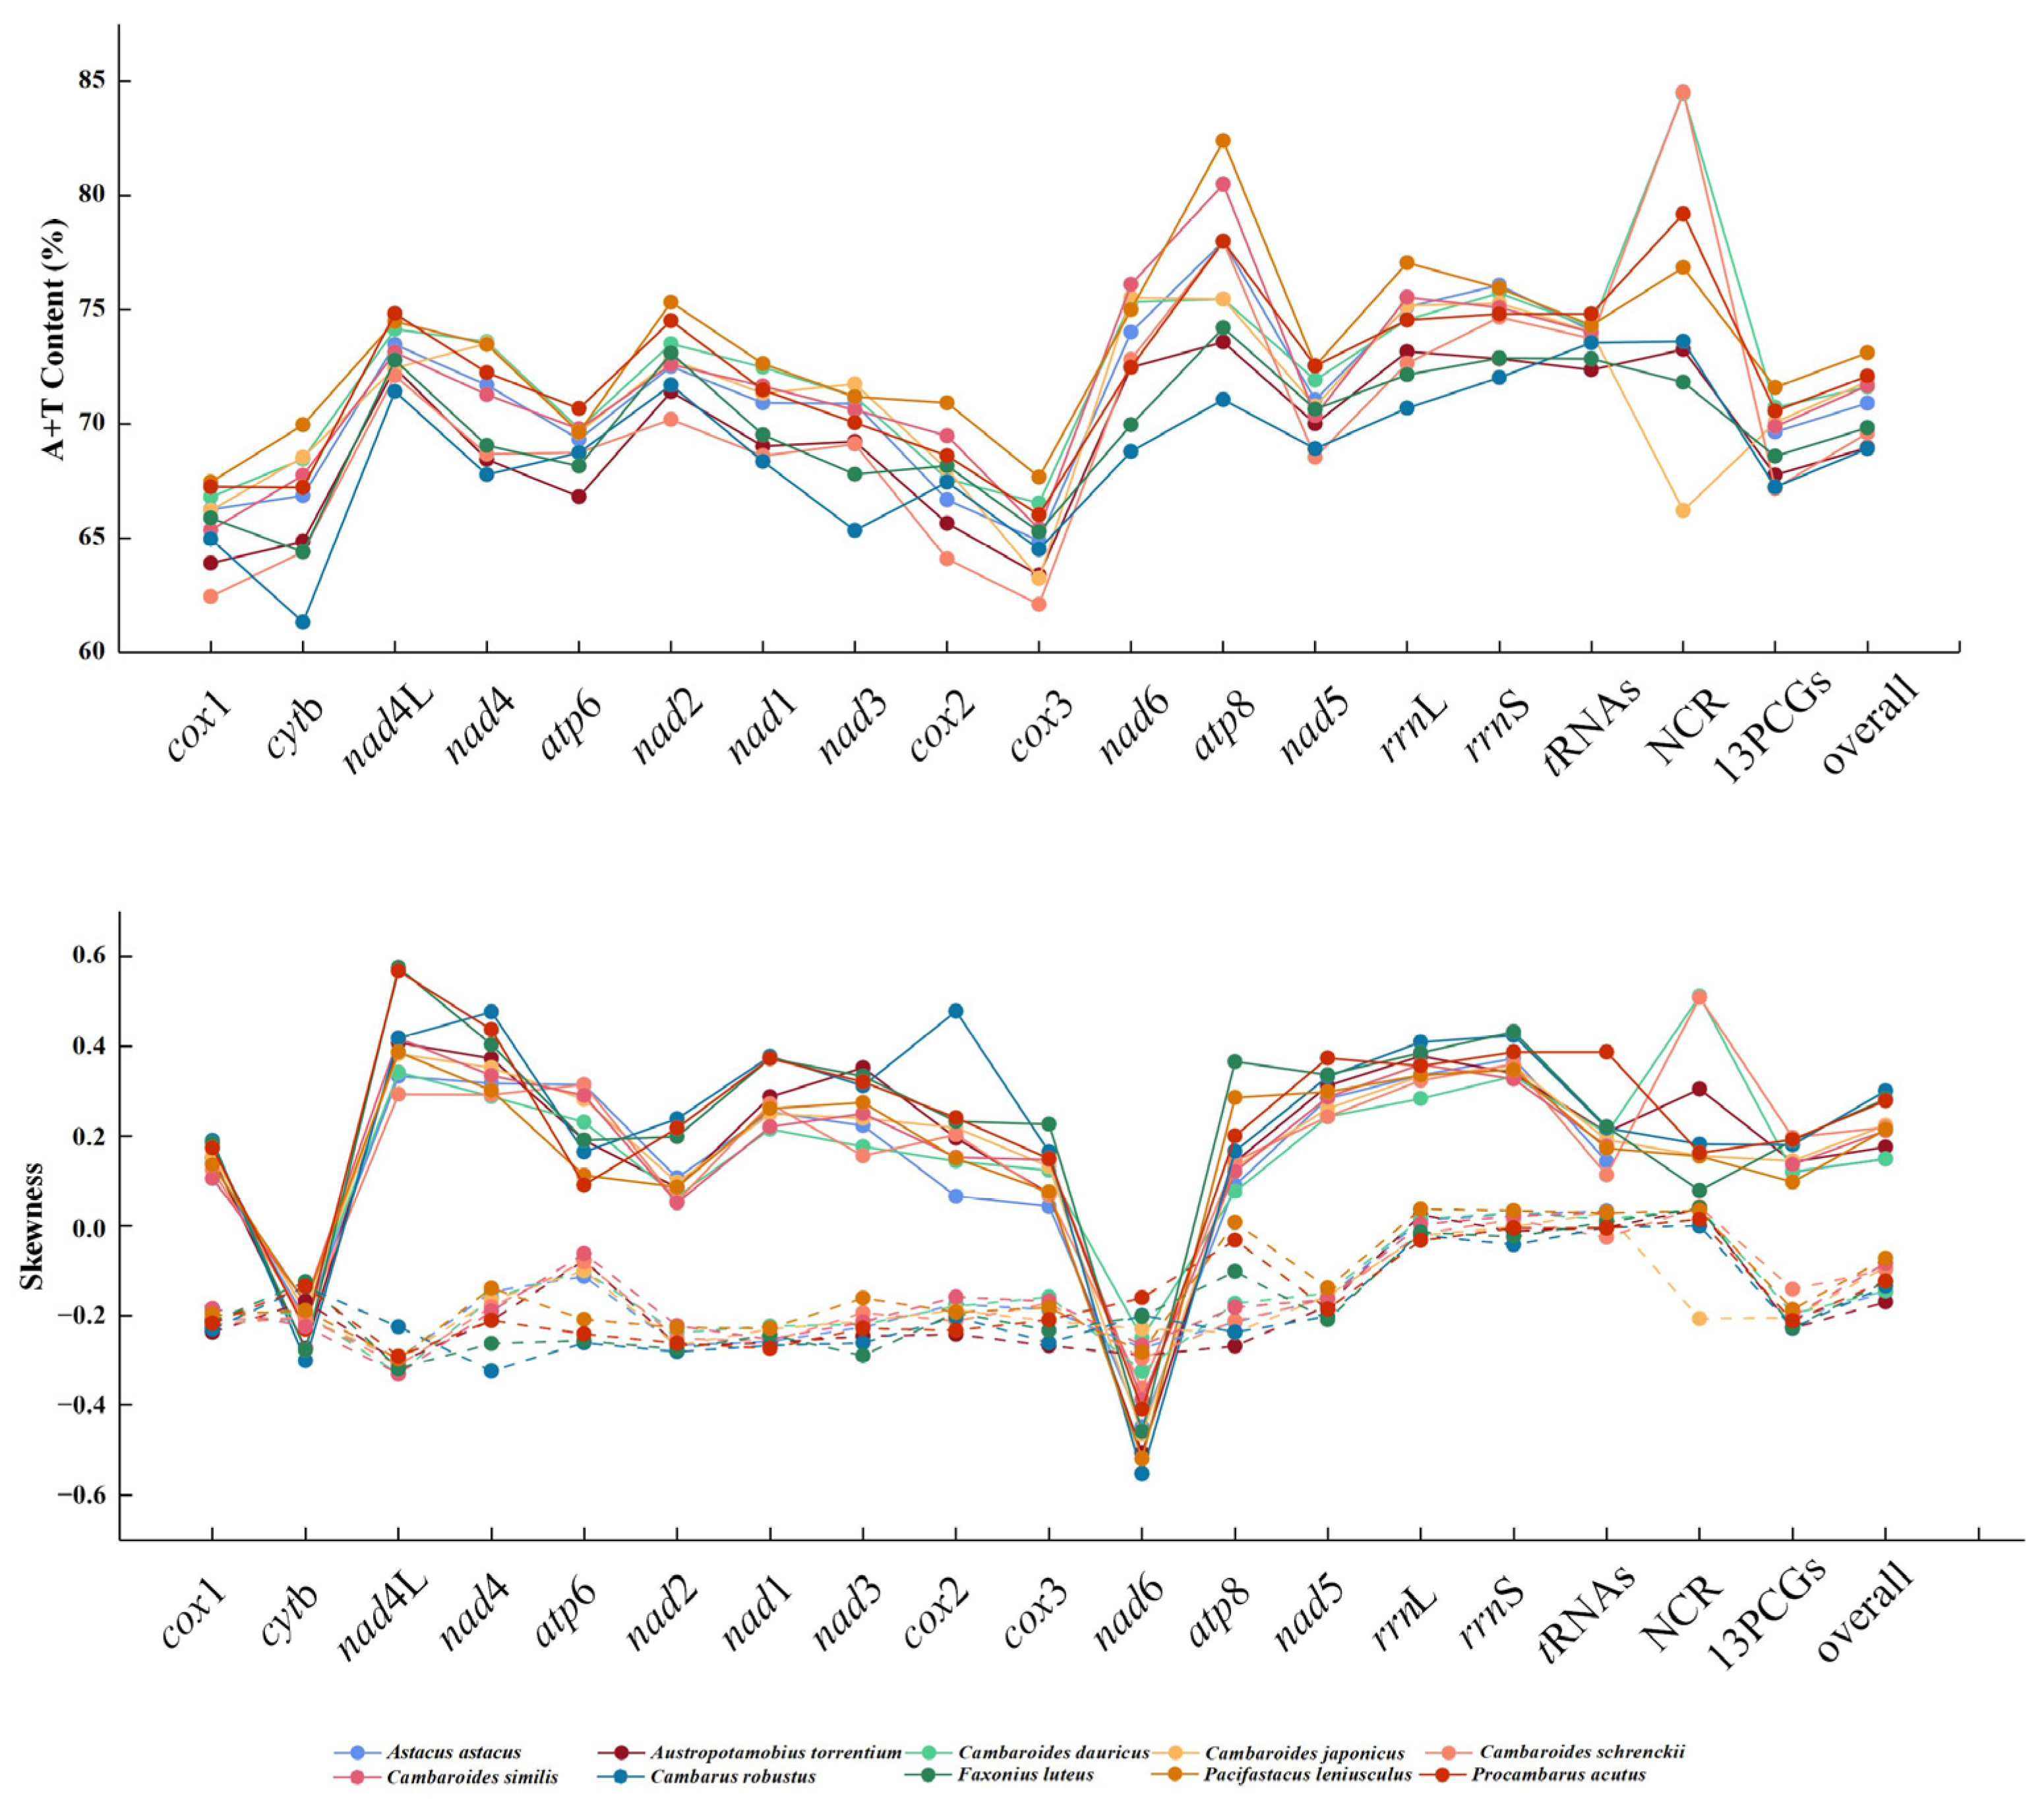
The cox1 sequencing of C. schrenckii from Heilongjiang province showed 100% nucleotide identity when compared to C. schrenckii from Russia (GenBank accession No. KX268737). Therefore, the species obtained in this study was identified as C. schrenckii. The C. schrenckii (GenBank accession No. PP497825) mitochondrial genome was 15,572 bp in length, which is below average compared to other species in the infraorder Astacidea (Figure 1). The C. schrenckii complete mitochondrial genome had typical circular molecules featuring 13 PCGs, 2 rRNAs (12S rRNA and 16S rRNA), 22 tRNAs, and a d-loop (764 bp) located between trnE and trnQ. Nine genes (nad2, cytb, trnQ, trnS1, trnN, trnS2, trnT, trnC, and trnY) were encoded on the negative strand, with twenty-eight genes encoded on the positive strand (Table 1). The C. schrenckii genome nucleotide composition was biassed towards A + T, with A + T bases comprising 67.18% of PCGs, 72.66% of rrnL, 74.68% of rrnS, and 73.75% of tRNAs, with the overall genome A + T content being 69.61% (Figure 2). The A + T content of the d-loop was 84.53%, and the C + G content was 15.47%.

3.2. Protein-Coding Gene

The overall length of the 13 concatenated PCGs for every C. schrenckii mitochondrial genome was 11,174 bp, accounting for 71.76% of the entire mitochondrial genome sequence. The length of the 13 PCGs ranged from 159 bp (atp8) to 1730 bp (nad5). In this standard arrangement of 13 PCGs, all genes related to proteins, except for cytb and nad6, were in the positive direction. To identify ten well-conserved and variable mitochondrial genes from the Astacoidea species, the concatenated nucleotide thirteen PCG sequences were analysed using a sliding window (Figure 3). By calculating the quantity of variable positions per unit length of gene, the analysis revealed that cox1 was the least variable gene, whereas cytb, nad5, and nad6 exhibited significant sequence divergence (Figure 3). The evolution rate of the cox1 gene for ten species of Astacoidea crustaceans is shown in Table 2; the ω values of the cox1 gene for ten species of the Astacoidea superfamily crustaceans are all less than one. C. schrenckii is under the greatest selection pressure (ω = 0.02) and does not easily have non-synonymous mutations. In terms of the nucleotide variations in sequence between the mitochondrial genes of the six species of Cambaroides, the range was from 0.3 to 22.0%. The total amino acid sequence differences for the 13 PCGs ranged from 0 to 10.3%. The nucleotide sequence variation in the 13 PCGs ranged from 0 to 11.4%, and the amino acid sequence differences ranged from 0 to 15.2% (Table 3).
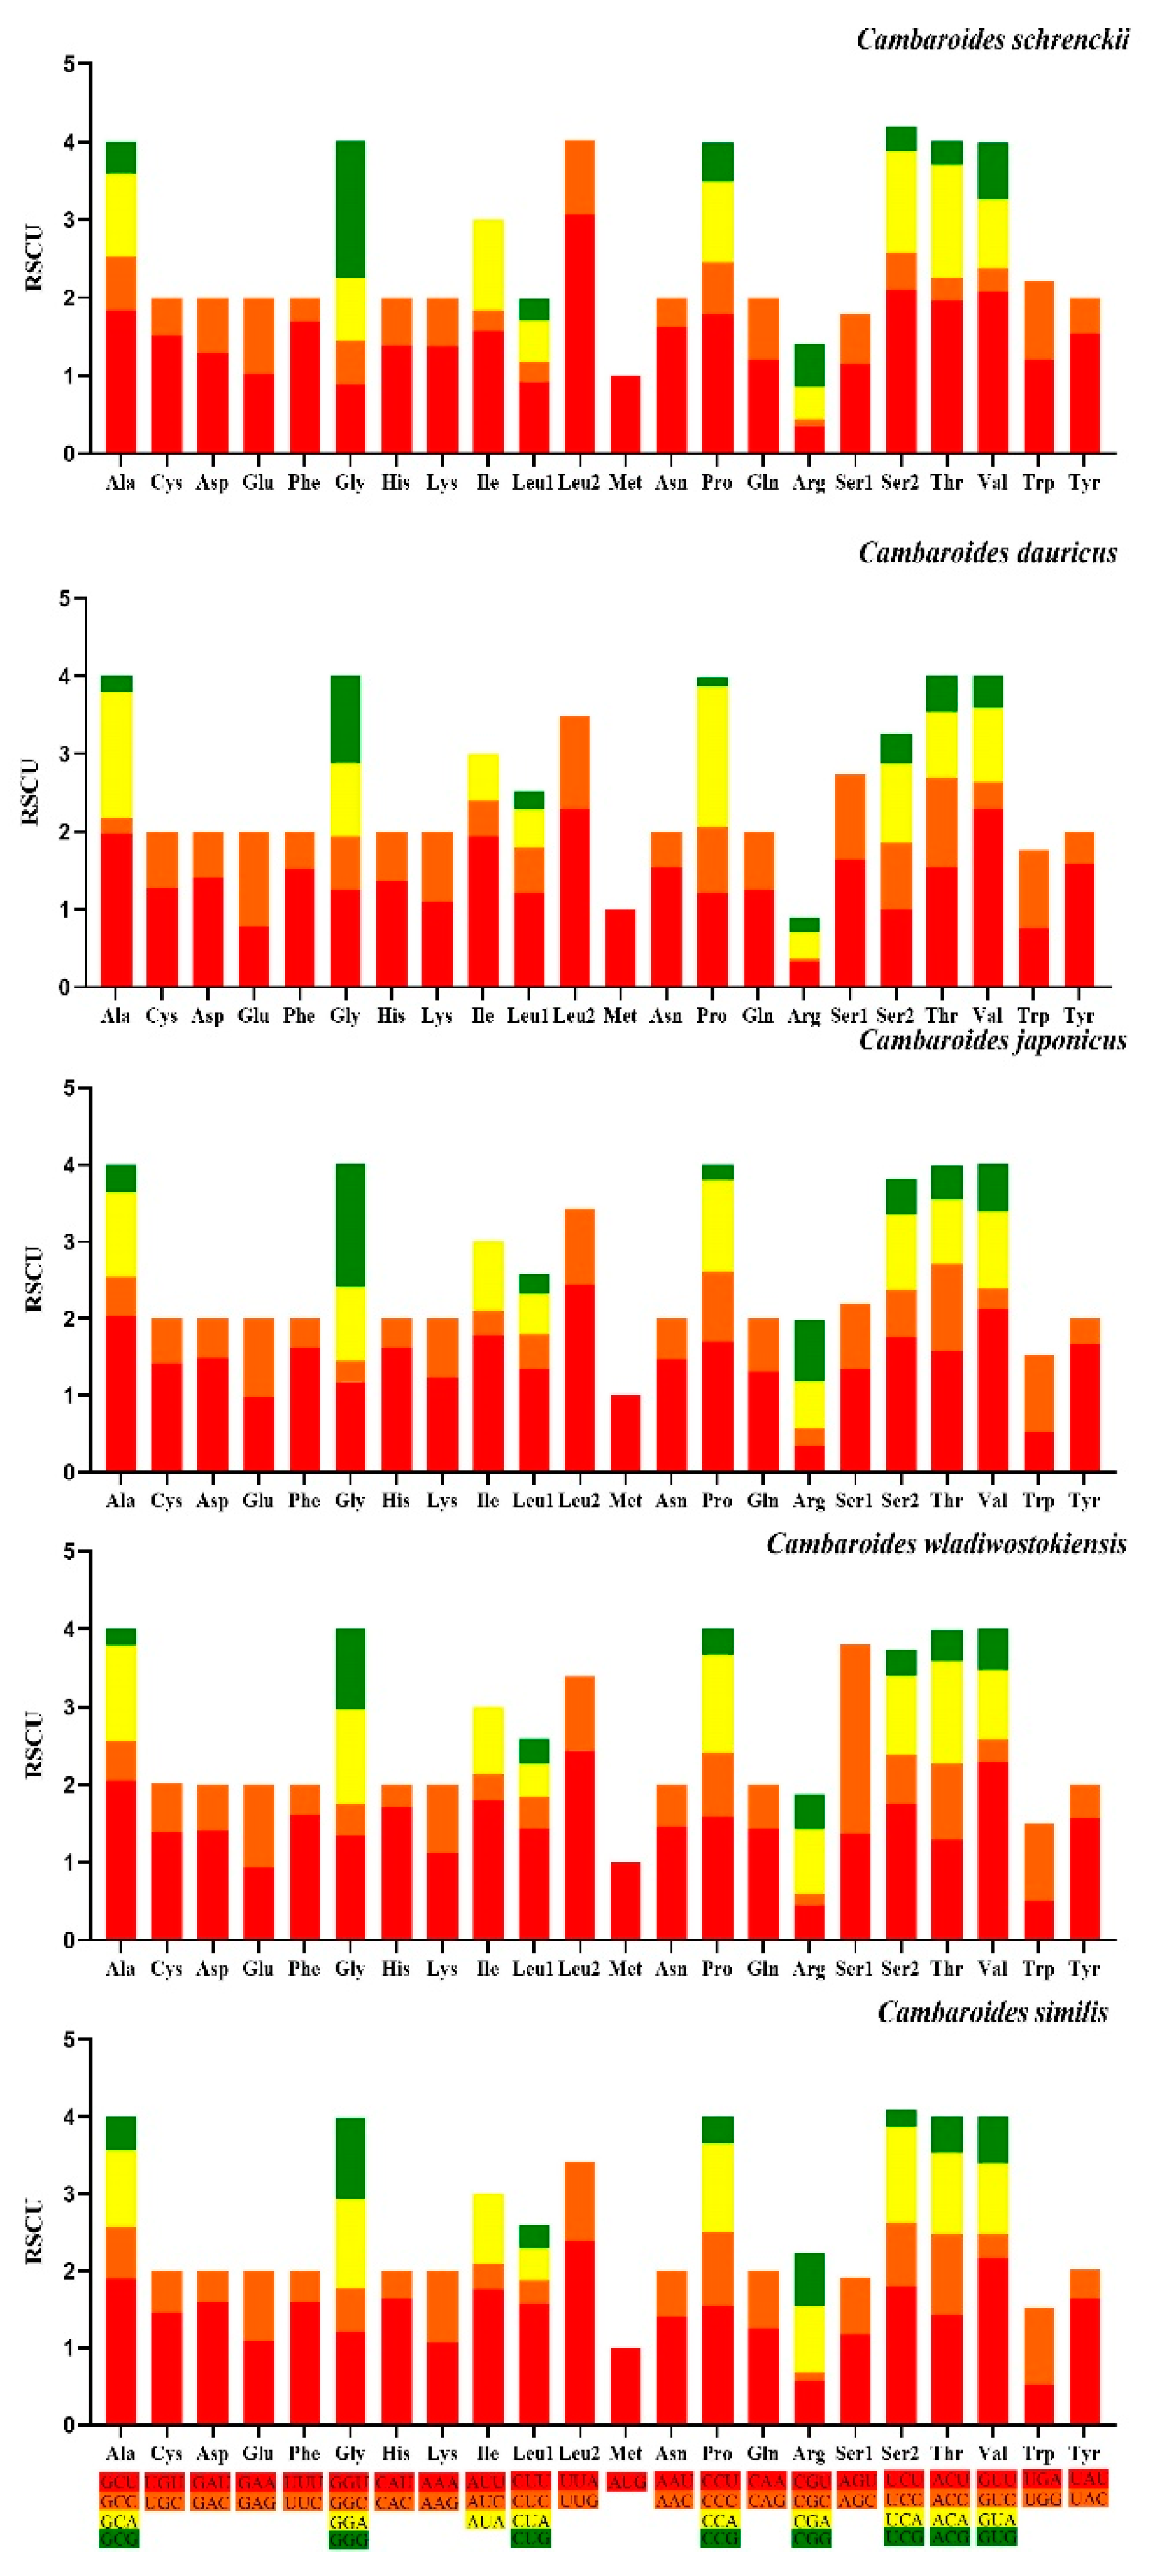
The RSCU values for the 13 PCGs are displayed in Figure 4. The mitochondrial genome consists of 3724 codons except for start and termination codons. Among the 13 PCGs, Ser2 was the most commonly used amino acid followed by Leu2, Ala, and Gly, while Met was used the least. The total AT-skew and GC-skew of the 13 PCGs were −0.1411 and 0.1966, respectively. Among the 13 PCGs, ATG (8/13) was the most common start codon and TAA (9/13) was the main termination codon (Table 1). The most frequently used codons in the 13 PCGs were ACU (trnS2) followed by UUG (trnL2) and GGG (trnG). The codons CUC (trnR), CUG (trnL1), and AUC (trnI) were used less frequently.

3.3. Transfer RNA and Ribosomal RNA

The complete mitochondrial genome of C. schrenckii includes 22 tRNAs, the size of which is 61–70 bp. The overall length of the tRNA was 1417 bp, considering 9.11% of the mitochondrial genome. The A + T content in the tRNA region (73.75%) was 2.81 times the G + C content (26.25%). The AT-skew value was −0.026, and the GC-skew value was 0.113. All tRNA sequences can be arranged in the standard cloverleaf structure (Figure S1). Besides the composition of normal base pairs, the clover secondary structure’s stem also includes many non-Watson–Crick base pairs. The most frequent wobble mismatches are G-U wobble base pairs (31 in total). Additionally, 12S rRNA and 16S rRNA were appraised in the heavy chain. rrnS was positioned between trnN and trnV, and rrnL was positioned between trnV and trnL1. These two genes were separated by trnV. The 16S rRNA measured 1017 bp, while the 12S rRNA was 790 bp in length. The A + T contents of rrnS and rrnL were 74.68% and 72.66%, respectively, and the AT-Skew was 0.0136 and −0.0176, respectively.

3.4. Gene Rearrangements

Gene rearrangements occur frequently in the crayfish mitochondrial genome and were used to examine phylogenetic relationships. C. schrenckii rearrangements were investigated by comparing the complete mitochondrial genome of forty-two species from four superfamilies in the infraorder Astacidea. The comparison was based on thirteen PCGs and two rRNAs, resulting in the identification of seven types (Figure 5). The sequenced mitochondrial genomes of 22 crayfish species including C. schrenckii in the present study were type I, and the 13 PCGs and 2 rRNA genes had the same arrangement. For the type II gene arrangement, Enoplometopus debelius, Homarus americanus, Nephropsis grandis, and Enoplometopus occidentalis had the same arrangement, while the type I inversion occurred in a sizable section enclosed by rrnS and trnF. For the type III gene arrangement, 12 species had the same gene arrangement. In contrast to type II, large-scale gene rearrangements occurred from nad5 onwards in type III, as evidenced by the displacement of nad6, rrnL, and nad2 downstream of nad5, nad4, nad4L, and cytb, which formed a cluster of genes displaced downstream of nad2. Additionally, nad1 and rrnS were displaced downstream of cytb. For type IV, the genotype was compared to type III, with nad4, nad4L, and cytb forming a cluster of genes that shifted upstream of nad3, while nad1 shifted upstream of rrnL and nad2 shifted downstream of rrnS. Compared to type III, type V demonstrated a genotype that alternated between nad5 and nad6. Compared to type V, type VI exhibited a gene cluster comprising nad4, nad4L, and nad2, which was shifted downstream of rrnL. In contrast, cytb was relocated between trnW and trnF, while nad5 was relocated between trnF and trnM. These findings contrasted with the gene arrangement observed in type V. Types VII, VII, and II had the same gene arrangement, except for a large number of repetitive regions.

3.5. Phylogenetic Analyses

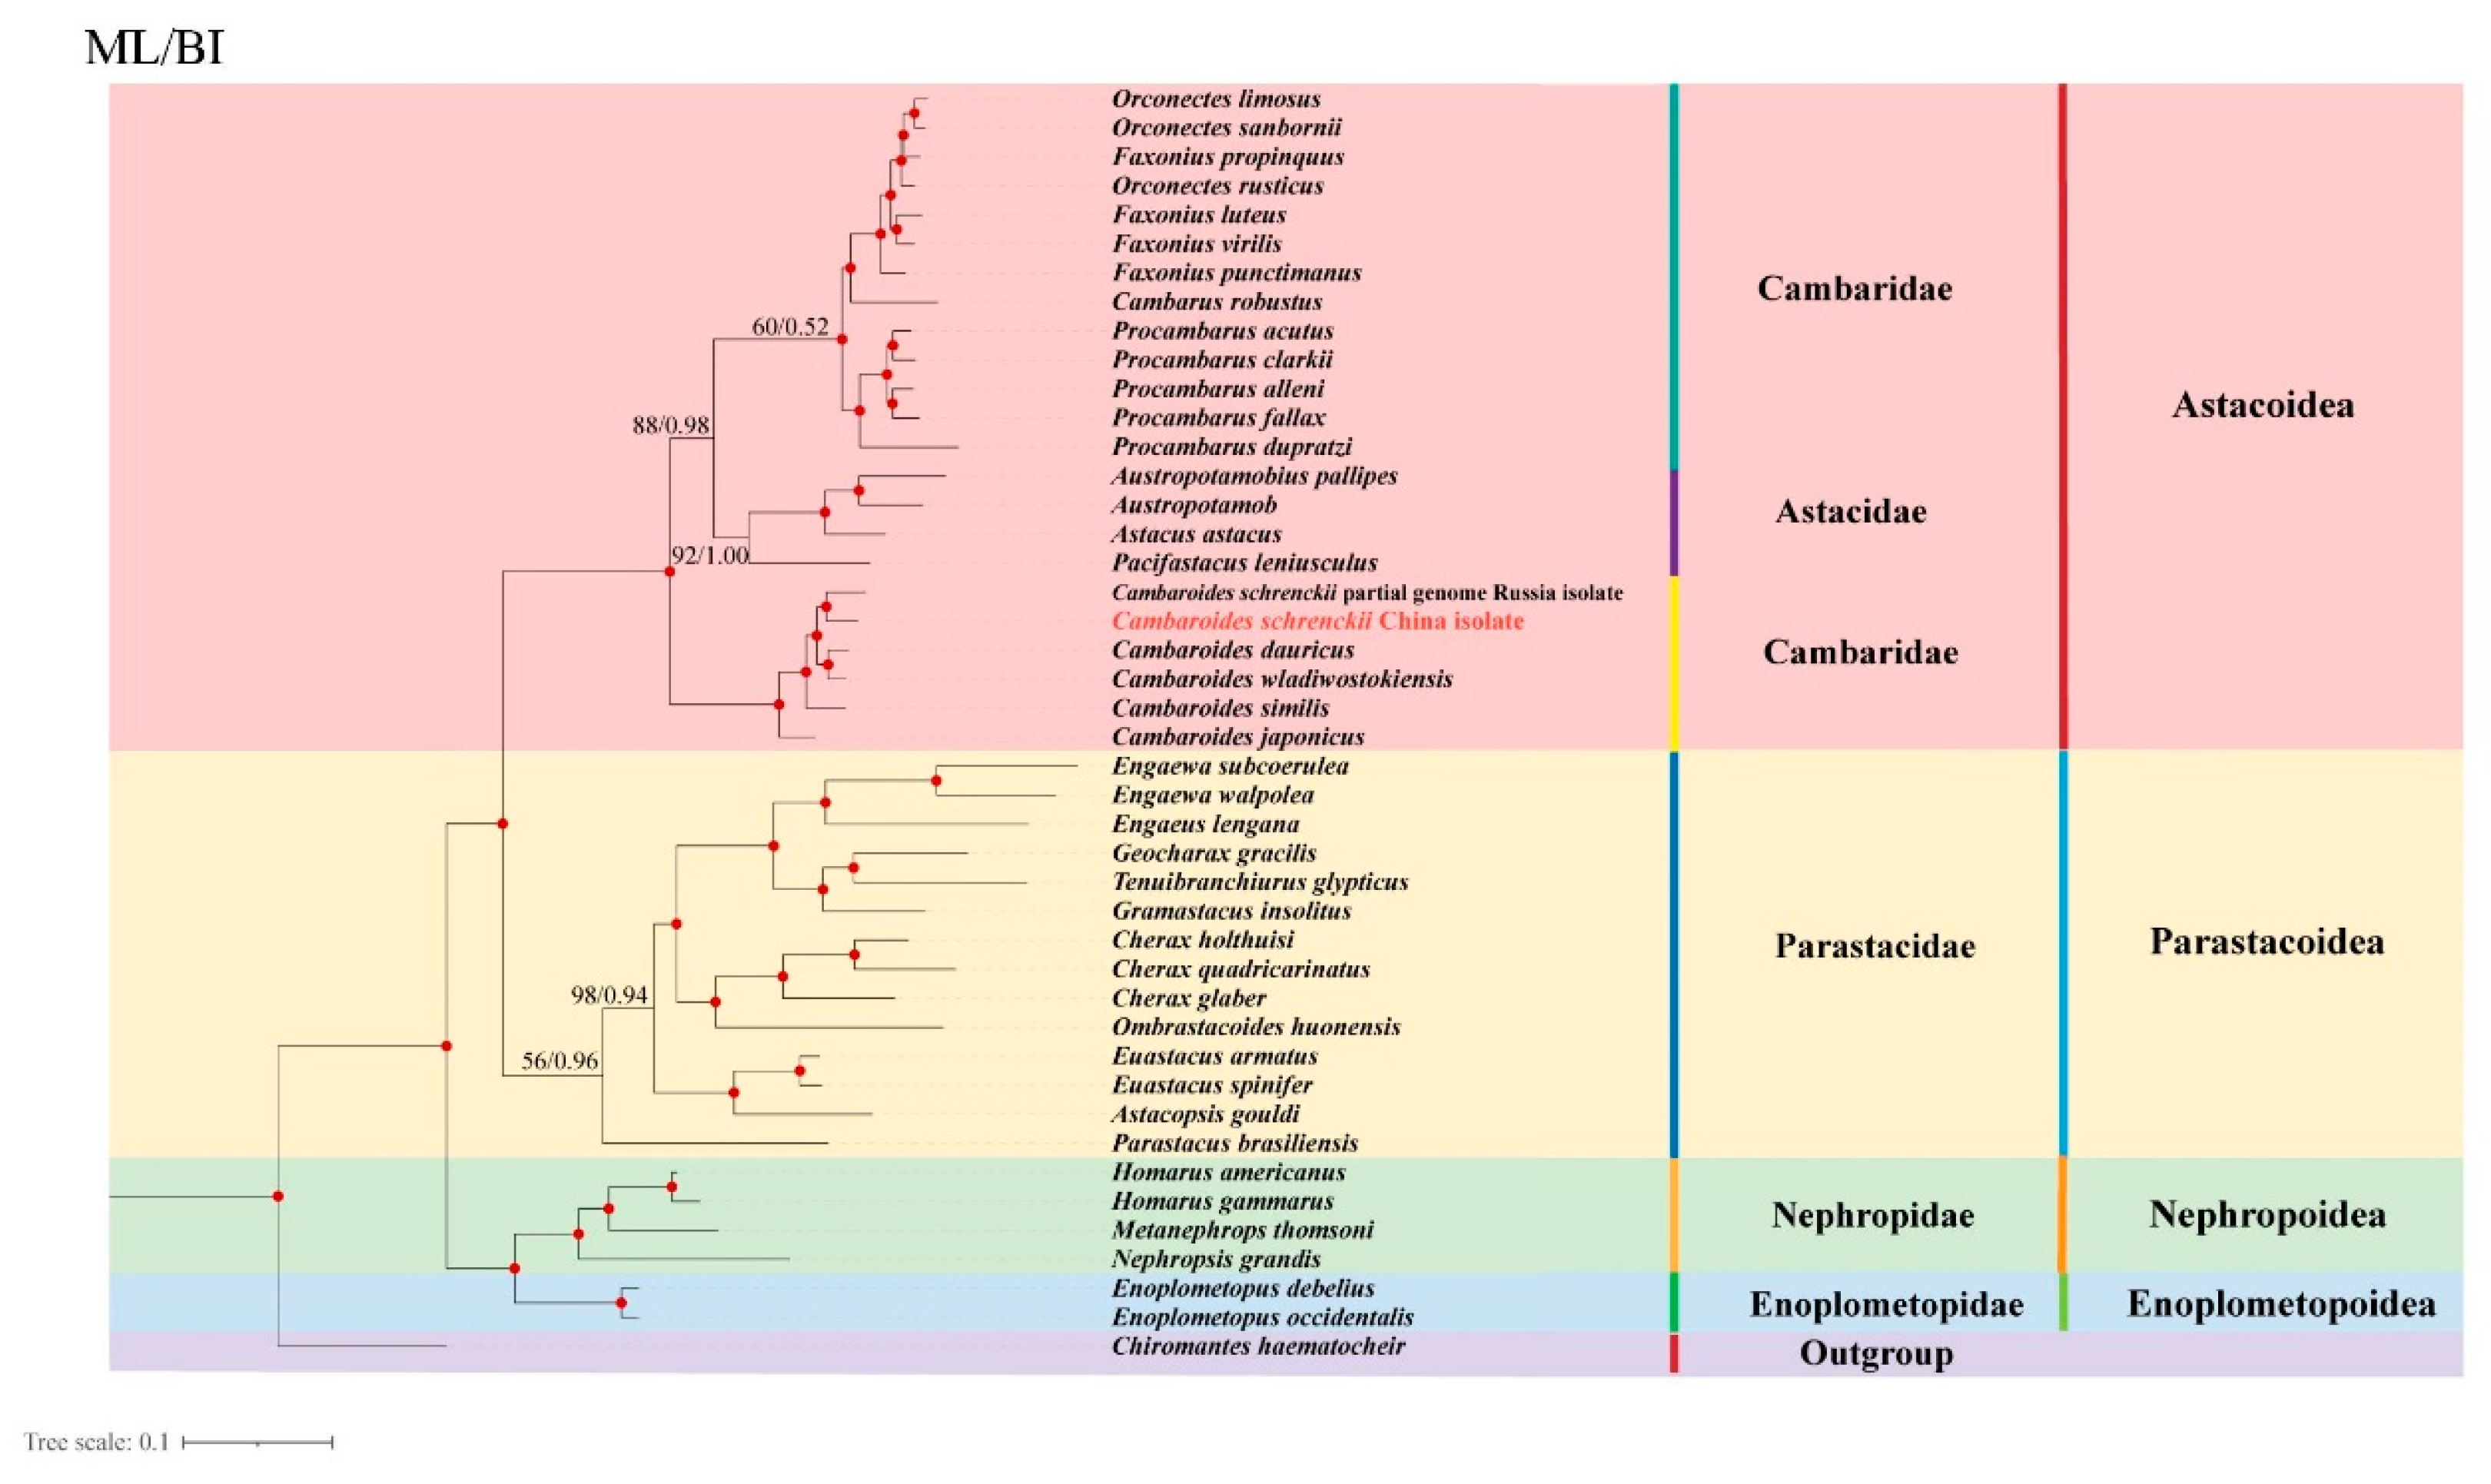
Based on the 13 PCGs, we constructed a phylogenetic tree by selecting species of the four superfamilies Astacoidea, Enoplometopoidea, Nephropoidea, and Parastacoidea as the ingroup, and C. haematocheir as the outgroup. A phylogenetic tree was built using the 13 PCGs (Figure 6). The phylogenetic analysis revealed that the ML and BI trees have a largely consistent topology. The four superfamilies (Enoplometopoidea, Nephropoidea, Astacoidea, and Parastacoidea) were divided into four large clades. Notably, Enoplometopoidea and Nephropoidea cluster together and survive in marine environments, while Astacoidea and Parastacoidea cluster together and survive in freshwater environments. In Astacoidea, Cambaridae and Astacidae cluster together, but Cambaroides form a separate branch. The relationship between the American Cambaridae is closer to Astacidae than the Asian Cambaridae. Cambaroides are classified as a single group, while C. schrenckii and C. dauricus form separate branches. C. dauricus is closer to C. wladiwostokiensis than C. schrenckii.

4. Discussion

The length of the mitochondrial genome of C. schrenckii was 15,572 bp. Compared to other Astacidea species, the mitochondrial genome of C. schrenckii was smaller than average (Table S1). The d-loop’s overall length determined primary variations between the species, which contained transcription and replication initiation and control signals for the mitochondrial genome [33,34]. The length of different short tandem repeat sequences within the NCR exhibits variability [35]. The A + T content of the d-loop was 84.53% and the C + G content was 15.47%, indicating a strong preference and antisense adenosine phenomenon. These results are consistent with the gene arrangement pattern of the mitochondrial genome of crustaceans in general [36]. This study comprehensively examined the structural features, nucleotide composition, codon preference, and PCG content of the C. schrenckii mitochondrial genome. The results indicate a significant antisense cytosine bias in C. schrenckii. The total length of all 13 PCGs in C. schrenckii was 11,174 bp, constituting 71.76% of the overall mitochondrial genome length. The length of the PCGs ranged from 159 bp (atp8) to 1730 bp (nad5). In this typical arrangement of the 13 PCGs, all other PCGs were oriented in a positive direction, except for cytb and nad6. Comparing PCGs across multiple species can provide insights into their molecular evolutionary patterns and mechanisms [37].
The rate of evolution and nucleotide diversity of genes are often used to gauge the degree of conservation in biological studies [38,39]. A sliding window analysis of conserved and variable mitochondrial gene sequences of thirteen PCGs from five species of Astacoidea revealed significant differences in the thirteen PCGs across ten species of Astacoidea. The variable sites curve indicated that cox1 exhibited the lowest variation, whereas cytb, nad5, and nad6 displayed higher sequence differences. The substitution rate of mitochondrial genes was calculated for all ten species of Astacoidea. The cox1 gene was observed to exhibit a ω value less than 1 in all instances, indicating a high degree of interspecific conservation. C. schrenckii was found to be most subject to selection pressure (ω = 0.02), indicating that it is unlikely to undergo non-synonymous mutations. The results indicate that the cox1 gene may be a useful genetic marker for studies in population genetics and species identification within Astacoidea.
The RSCU values indicated that, with the exclusion of the start and termination codons, the C. schrenckii mitochondrial genome has 13 PCGs comprising 3724 codons. The most commonly used amino acids in these PCGs were Ser2, Leu2, Ala, and Gly, while Met was used less frequently. Priority codons were typically associated with crucial functional gene regions, as they were found to favour those with silent sites, which were believed to be associated with maximising translation efficiency [40]. The A + T content was found to be the highest in the third codon position. The PCG findings indicated that the mitochondrial genome of C. schrenckii tends to use codons encoding T-rich amino acids. Nevertheless, the codon usage bias for the mitochondrial genome of freshwater crayfish remains uncertain [41].
The C. schrenckii mitochondrial genome of the species comprises 22 tRNAs and is folded into the standard cloverleaf secondary structure, with base substitutions or mismatches occurring during the folding process. The base variations in the stem area are fewer than those in the loop area, indicating high conservation. A common belief is that G-U/U-G non-Watson–Crick pairs are less regular and consistent than Watson–Crick base pairs but greater than all other atypical 16 base pairs. Compensatory mutations are essential for functional RNAs as they preserve the RNA structure, thereby contributing to its function. It is traditionally believed that compensatory mutations are achieved through a two-step replacement of G-U (or A-C) base pairs, which are intermediates [42,43].
The gene arrangement indicated that forty-three Astacidea species belonged to four superfamilies, which were divided into seven types in the present study. This study found type I to be the most common arrangement observed in most species of crayfish including C. schrenckii, which is consistent with the majority of pan-crustacean arrangements when inversion was disregarded [44]. Some aquatic organisms have been shown to have a faster evolutionary rate in their mitochondrial genomes than terrestrial organisms. Some crustacean species in particular may display elevated rates of mitochondrial genome evolution due to their specific ecological habits [45,46,47]. Recent studies have shown that gene cluster duplication is not only evidence of accelerated evolution, but also a key factor in enhancing biological diversity and complexity [48]. In a mitochondrial genome-wide analysis of decapod crustaceans, Hong et al. identified a deletion of the gene nad2 in the Homarus gammarus specimen belonging to the family Nephropidae [49]. However, to create a whole mitochondrial genome assembly for H. gammarus, Han et al. re-sequenced the genome on an Oxford Nanopore Minion flowcell and carried out a long-read-only assembly [50]. The absence of nad2 was detected, and a gene cluster duplication was found in H. gammarus. Accordingly, we analysed the mitochondrial genome sequences of H. gammarus utilising resequenced H. gammarus mitochondrial genome sequences, which have been attributed to type VII. Although gene cluster duplication was only present in type VII, complex gene remakes also occurred in other rows, possibly due to the various evolutionary speeds in different species in specific environments. In total, complex types of gene rearrangements can be observed in the infraorder Astacidea.
Based on an independent partitioned phylogenetic analysis of 43 mitochondrial genomes in the infraorder Astacidea, the results showed that the family Cambaridae is not monophyletic. Nevertheless, the Astacidae family monophyly is a challenging issue in contemporary morphological and molecular analyses. In relation to the families Astacidae and Cambaridae, DNA data could not provide a firm location for the genus Cambaroides [51]. However, some distinct physical traits that Cambaroides and the American Cambaridae representatives Cambarinae and Cambarellinae share suggest a tight phylogenetic link. Moreover, C. japonicus postembryonic development is more similar to Astacidae than American Cambaridae [52]. The similarities between Cambaroides and Astacidae postembryonic development appear to confirm Ortmann’s (1897) theory that both taxa are closely related [53]. Therefore, the postembryonic development of C. schrenckii is more similar to Astacidae than to American Cambaridae. Furthermore, with the ongoing development of maternal care techniques, the same research identifies the Astacidae + Asian Cambaridae as being more closely related to each other than to the more derived North American Cambaridae + Parastacidae [54]. Recent nuclear mitochondrial DNA sequence investigations of freshwater crayfish throughout the world, including all representatives of Cambaroides [54,55], support Cambaroides distinct position in relation to the North American cambarids and European astacids. Given the body of data, it seems likely that the Asian genus Cambaroides will eventually have a distinct family status. Bracken Grissom et al. discovered that the Asian cambarids and astacids form a monophyletic group despite the majority of research supporting the Asian cambarid lineage as being the most foundational within the Astacoidea [56]. They proposed expanding the idea that Cambaroides belong to the Astacidae. The data from Frederic et al. strongly support the basal status of the Cambaroides lineage, as indicated by the analysis of five Astacide species, two Procambarus, two Orconectes, one Cambarus, and four Cambaroides, utilising both nuclear and mitochondrial genes [57]. A taxonomic classification of Northern Hemisphere crayfish at the family level may consider classifying Asian cambarid crayfish as a new family. Northern Hemisphere crayfish should be grouped into a single family, similar to how crayfish from the Southern Hemisphere are treated as Parastacidae members. Our results also indicate that Cambaroides constitute a distinct branch, with other species of the family Cambaridae exhibiting a closer relationship to the family Astacidae than to the genus Cambaroides.

5. Conclusions

The present study sequenced and annotated the mitochondrial genome of C. schrenckii for the first time. Gene rearrangement analysis in the infraorder Astacidea identified seven distinct gene arrangements based on mitochondrial PCGs, with type I being the most common. Evolutionary analyses indicated that the relationship between the American Cambaridae is closer to Astacidae than the Asian Cambaridae. The present study provides a theoretical basis for further discussion of developmental relationships in the infraorder Astacidea.

Supplementary Materials

The following supporting information can be downloaded at https://www.mdpi.com/article/10.3390/genes15121578/s1, Figure S1. Twenty-two tRNA cloverleaf secondary structures of C. schrenckii. Table S1. List of species used in the phylogenetic analysis.

Author Contributions

Writing—Original Draft Preparation, X.L. and B.L.; Software Development, B.L.; Validation, Y.Y.; Investigation, J.Z. (Jun Zhang). and C.H.; Resources, Y.Z.; Data Curation, J.Z. (Jiawang Zhou); Writing—Review and Editing Y.L. and H.Q.; Project Administration, C.W.; Funding Acquisition, J.G. All authors have read and agreed to the published version of the manuscript.

Funding

This study was supported by the National Natural Science Foundation of China (32172886; 31972703), Heilongjiang Provincial Natural Science Foundation of China (ZD2022C006), National Parasitic Resource Center of China and Ministry of Science and Technology (NPRC-2019-194-30), Heilongjiang Bayi Agricultural University support Program for San Heng San Zong (ZRCQC202204), and Personnel Foundation of Heilongjiang Bayi Agricultural University (XYB202108).

Institutional Review Board Statement

The study was approved by the Animal Ethics Committee of Heilongjiang Bayi Agricultural University (No. DWKJXY2024027; 11 March 2024).

Informed Consent Statement

Not applicable.

Data Availability Statement

The mt genome sequence of C. schrenckii generated in this study was deposited in the NCBI GenBank under accession no. No. PP497825. Raw reads of newly sequenced crayfish of C. schrenckii were deposited in the public repository BioProject under accession No. PRJNA1163325.

Conflicts of Interest

The authors declare no conflicts of interest.

References

  1. Su, C.C.; Tin, Y.C.; Ahyong, S.T. Two New Species of the Rare Lobster Genus Thaumastocheles Wood-Mason, 1874 (Reptantia: Nephropidae) Discovered from Recent Deep-Sea Expeditions in the Indo-West Pacific. J. Crustac. Biol. 2014, 34, 107–122. [Google Scholar]
  2. Mantelatto, F.L.; Tamburus, A.F.; Carvalho-Batista, A. Checklist of decapod crustaceans from the coast of the So Paulo state (Brazil) supported by integrative molecular and morphological data: V. Dendrobranchiata and Pleocyemata [Achelata, Astacidea, Axiidea, Caridea (Alpheoidea and Processoidea excluded), Gebiidea, Stenopodidea]. Zootaxa 2022, 5121, 1–74. [Google Scholar] [PubMed]
  3. Richman, N.I.; Böhm, M.; Adams, S.B.; Alvarez, F.; Bergey, E.A.; Bunn, J.J.; Burnham, Q.; Cordeiro, J.; Coughran, J.; Crandall, K.A.; et al. Multiple drivers of decline in the global status of freshwater crayfish (Decapoda: Astacidea). Philos. Trans. R. Soc. Lond. B Biol. Sci. 2015, 370, 20140060. [Google Scholar] [CrossRef] [PubMed]
  4. Luedtke, J.A.; Chanson, J.; Neam, K.; Hobin, L.; Maciel, A.O.; Catenazzi, A.; Borzée, A.; Hamidy, A.; Aowphol, A.; Jean, A.; et al. Ongoing declines for the world’s amphibians in the face of emerging threats. Nature 2023, 622, 308–314. [Google Scholar] [CrossRef]
  5. Chai, J.Y.; Jung, B.K. Epidemiology of trematode infections: An update. Adv. Exp. Med. Biol. 2019, 1154, 359–409. [Google Scholar]
  6. Zhou, X.J.; Yang, Q.; Tan, Q.H.; Zhang, L.Y.; Shi, L.B.; Zou, J.X. Paragonimus and its hosts in China: An update. Acta Trop. 2021, 223, 106094. [Google Scholar] [CrossRef]
  7. Blair, D. Paragonimiasis. Adv. Exp. Med. Biol. 2019, 1154, 105–138. [Google Scholar]
  8. Blair, D. Lung flukes of the genus Paragonimus: Ancient and re-emerging pathogens. Parasitology 2022, 149, 1286–1295. [Google Scholar] [CrossRef]
  9. Gan, H.M.; Tan, M.H.; Gan, H.Y.; Lee, Y.P.; Schultz, M.B.; Austin, C.M. The complete mitogenome of the Australian crayfish Geocharax gracilis Clark 1936 (Crustacea: Decapoda: Parastacidae). Mitochondrial DNA Part A DNA Mapp. Seq. Anal. 2016, 27, 826–827. [Google Scholar] [CrossRef]
  10. Lee, Y.P.; Gan, H.M.; Tan, M.H.; Lys, I.; Page, R.; Dias Wanigasekera, B.; Austin, C.M. The complete mitogenome of the New Zealand freshwater crayfish Paranephrops planifrons White 1842 (Crustacea: Decapoda: Parastacidae). Mitochondrial DNA Part A DNA Mapp. Seq. Anal. 2016, 27, 3333–3334. [Google Scholar] [CrossRef]
  11. Biswal, D.K.; Chatterjee, A.; Bhattacharya, A.; Tandon, V. The mitochondrial genome of Paragonimus westermani (Kerbert, 1878), the Indian isolate of the lung fluke representative of the family Paragonimidae (Trematoda). PeerJ 2014, 2, e484. [Google Scholar] [CrossRef] [PubMed]
  12. Wang, G.; Sun, C.; Hu, H.; Zhang, D.; Li, M. Complete Mitochondrial Genome of the Backswimmer: Notonecta triguttata Motschulsky, 1861 (Hemiptera: Notonectidae): Sequence, Structure, and Phylogenetic Analysis. Diversity 2024, 16, 16. [Google Scholar] [CrossRef]
  13. Gan, H.M.; Tan, M.H.; Lee, Y.P.; Schultz, M.B.; Horwitz, P.; Burnham, Q.; Austin, C.M. More evolution underground: Accelerated mitochondrial substitution rate in Australian burrowing freshwater crayfishes (Decapoda: Parastacidae). Mol. Phylogenet. Evol. 2018, 118, 88–98. [Google Scholar] [CrossRef] [PubMed]
  14. Gan, H.M.; Tan, M.H.; Austin, C.M. The complete mitogenome of the red claw crayfish Cherax quadricarinatus (Von Martens, 1868) (Crustacea: Decapoda: Parastacidae). Mitochondrial DNA Part A DNA Mapp. Seq. Anal. 2016, 27, 385–386. [Google Scholar] [CrossRef]
  15. Trontelj, P.; Machino, Y.; Sket, B. Phylogenetic and phylogeographic relationships in the crayfish genus Austropotamobius inferred from mitochondrial COI gene sequences. Mol. Phylogenet. Evol. 2005, 34, 212–226. [Google Scholar] [CrossRef]
  16. Jennifer, E.B.; Keith, A.C. Subterranean phylogeography of freshwater crayfishes shows extensive gene flow and surprisingly large population sizes. Mol. Ecol. 2006, 14, 4259–4273. [Google Scholar]
  17. Sinclair, E.A.; Fetzner, J.F., Jr.; Buhay, J.E.; Crandall, K.A. Proposal to complete a phylogenetic, taxonomy, and systematic revision for freshwater crayfish (Astacidae). Freshw. Crayfish 2004, 14, 21–29. [Google Scholar]
  18. Buhay, J.E.; Moni, G.; Mann, N.; Crandall, K.A. Molecular taxonomy in the dark: Evolutionary history, phylogeography, and diversity of cave crayfish in the subgenus Aviticambarus, genus Cambarus. Mol. Phylogenet. Evol. 2007, 42, 435–448. [Google Scholar] [CrossRef]
  19. Pedraza-Lara, C.; Gutiérrez-Yurrita, P.J.; Jesus-Bonilla, V.S. A new species of Procambarus (Decapoda, Cambaridae) from the State of Querétaro, Mexico. ZooKeys 2021, 1048, 1–21. [Google Scholar] [CrossRef]
  20. Fetzner, J.W., Jr. Biochemical systematics and evolution of the crayfish genus Orconectes (Decapoda: Cambaridae). J. Crustac. Biol. 1996, 16, 111–141. [Google Scholar] [CrossRef]
  21. Schubert, M.; Lindgreen, S.; Orlando, L. AdapterRemoval v2: Rapid adapter trimming, identification, and read merging. BMC Res. Notes 2016, 9, 88. [Google Scholar] [CrossRef] [PubMed]
  22. Bankevich, A.; Nurk, S.; Antipov, D.; Gurevich, A.A.; Dvorkin, M.; Kulikov, A.S.; Lesin, V.M.; Nikolenko, S.I.; Pham, S.; Prjibelski, A.D.; et al. SPAdes: A new genome assembly algorithm and its applications to single-cell sequencing. J. Comput. Biol. 2012, 19, 455–477. [Google Scholar] [CrossRef] [PubMed]
  23. Jin, J.J.; Yu, W.B.; Yang, J.B.; Song, Y.; dePamphilis, C.W.; Yi, T.S.; Li, D.Z. GetOrganelle: A fast and versatile toolkit for accurate de novo assembly of organelle genomes. Genome Biol. 2020, 21, 241. [Google Scholar] [CrossRef] [PubMed]
  24. Lowe, T.M.; Chan, P.P. tRNA scan-SE On-line: Integrating search and context for analysis of transfer RNA genes. Nucleic Acids Res. 2016, 44, 54–57. [Google Scholar] [CrossRef]
  25. Bernt, M.; Donath, A.; Jühling, F.; Externbrink, F.; Florentz, C.; Fritzsch, G.; Pütz, J.; Middendorf, M.; Stadler, P.F. MITOS: Improved de novo metazoan mitochondrial genome annotation. Mol. Phylogenet. Evol. 2013, 69, 313–319. [Google Scholar] [CrossRef]
  26. Grant, J.R.; Stothard, P. The CGView Server: A comparative genomics tool for circular genomes. Nucleic Acids Res. 2008, 36, 181–184. [Google Scholar] [CrossRef]
  27. Kumar, S.; Stecher, G.; Li, M.; Knyaz, C.; Tamura, K. MEGA X: Molecular Evolutionary Genetics Analysis across Computing Platforms. Mol. Biol. Evol. 2018, 35, 1547–1549. [Google Scholar] [CrossRef]
  28. Perna, N.T.; Kocher, T.D. Patterns of nucleotide composition at fourfold degenerate sites of animal mitochondrial genomes. J. Mol. Evol. 1995, 41, 353–358. [Google Scholar] [CrossRef]
  29. Librado, P.; Rozas, J. DnaSP v5: A software for comprehensive analysis of DNA polymorphism data. Bioinformatics 2009, 25, 1451–1452. [Google Scholar] [CrossRef]
  30. Katoh, K.; Standley, D.M. MAFFT multiple sequence alignment software version 7: Improvements in performance and usability. Mol. Biol. Evol. 2013, 30, 772–780. [Google Scholar] [CrossRef]
  31. Guindon, S.; Gascuel, O. A simple, fast, and accurate algorithm to estimate large phylogenies by maximum likelihood. Syst. Biol. 2003, 52, 696–704. [Google Scholar] [CrossRef] [PubMed]
  32. Ronquist, F.; Huelsenbeck, J.P. MrBayes 3: Bayesian phylogenetic inference under mixed models. Bioinformatics 2003, 19, 1572–1574. [Google Scholar] [CrossRef] [PubMed]
  33. Kurabayashi, A.; Ueshima, R. Complete sequence of the mitochondrial DNA of the primitive opisthobranch gastropod Pupa strigosa: Systematic implication of the genome organization. Mol. Biol. Evol. 2000, 17, 266–277. [Google Scholar] [CrossRef] [PubMed]
  34. Wolstenholme, D.R. Animal mitochondrial DNA: Structure and evolution. Int. Rev. Cytol. 1992, 141, 173–216. [Google Scholar]
  35. Pereira, S.L. Mitochondrial genome organization and vertebrate phylogenetics. Genet. Mol. Biol. 2000, 23, 745–752. [Google Scholar] [CrossRef]
  36. Sun, Y.; Kurisaki, M.; Hashiguchi, Y.; Kumazawa, Y. Variation and evolution of polyadenylation profiles in sauropsid mitochondrial mRNAs as deduced from the high-throughput RNA sequencing. BMC Genom. 2017, 18, 665. [Google Scholar] [CrossRef]
  37. Chen, L.; Lin, Y.; Xiao, Q.; Lin, Y.; Du, Y.; Lin, C.; Ward-Fear, G.; Hu, C.; Qu, Y.; Li, H. Characterization of the complete mitochondrial genome of the many-lined sun skink (Eutropis multifasciata) and comparison with other Scincomorpha species. Genomics 2021, 113, 2526–2536. [Google Scholar] [CrossRef]
  38. Suleman; Ma, J.; Khan, M.S.; Tkach, V.V.; Muhammad, N.; Zhang, D.; Zhu, X.Q. Characterization of the complete mitochondrial genome of Plagiorchis maculosus (Digenea, Plagiorchiidae), Representative of a taxonomically complex digenean family. Parasitol. Int. 2019, 71, 99–105. [Google Scholar] [CrossRef]
  39. Zhang, D.; Zou, H.; Wu, S.G.; Li, M.; Jakovlić, I.; Zhang, J.; Chen, R.; Li, W.X.; Wang, G.T. Three new Diplozoidae mitogenomes expose unusual compositional biases within the Monogenea class: Implications for phylogenetic studies. BMC Evol. Biol. 2018, 18, 133. [Google Scholar] [CrossRef]
  40. Romero, H.; Zavala, A.; Musto, H. Codon usage in Chlamydia trachomatis is the result of strand-specific mutational biases and a complex pattern of selective forces. Nucleic Acids Res. 2000, 28, 2084–2090. [Google Scholar] [CrossRef]
  41. Barbhuiya, R.I.; Uddin, A.; Chakraborty, S. Compositional properties and codon usage pattern of mitochondrial ATP gene in different classes of Arthropoda. Genetica 2019, 147, 231–248. [Google Scholar] [CrossRef] [PubMed]
  42. Ananth, P.; Goldsmith, G.; Yathindra, N. An innate twist between Crick’s wobble and Watson-Crick base pairs. RNA 2013, 19, 1038–1053. [Google Scholar] [CrossRef] [PubMed]
  43. Zhang, X.; Cao, Y.; Zhang, W.; Simmons, M.P. Adenine·cytosine substitutions are an alternative pathway of compensatory mutation in angiosperm ITS2. RNA 2020, 26, 209–217. [Google Scholar] [CrossRef]
  44. Kim, S.; Park, M.; Jung, J.; Ahn, D.; Sultana, T.; Kim, S.J.; Park, J.; Choi, H.; Min, G. The mitochondrial genomes of Cambaroides similis and Procambarus clarkii (Decapoda: Astacidea: Cambaridae): The phylogenetic implications for Reptantia. Zool. Scr. 2012, 41, 281–292. [Google Scholar] [CrossRef]
  45. Xiao, W.H.; Zhang, Y.P. Genetics and evolution of mitochondrial dna in fish. Acta Hydrobiologica Sinica. 2000, 24, 384–391. (In Chinese) [Google Scholar] [CrossRef]
  46. Wang, X.B.; Shang, Y.Q.; Wu, X.Y.; Wei, Q.G.; Zhou, S.Y.; Sun, G.L.; Mei, X.S.; Dong, Y.H.; Sha, W.L.; Zhang, H.H. Divergent evolution of mitogenomics in Cetartiodactyla niche adaptation. Org. Divers Evol. 2023, 23, 243–259. [Google Scholar] [CrossRef]
  47. Jakovlić, I.; Zou, H.; Zhao, X.M.; Zhang, J.; Wang, G.T.; Zhang, D. Evolutionary history of inversions in directional mutational pressures in crustacean mitochondrial genomes: Implications for evolutionary studies. Mol. Phylogenet. Evol. 2021, 164, 107288. [Google Scholar] [CrossRef]
  48. Tao, M.; Chen, J.; Cui, C.; Xu, Y.; Xu, J.; Shi, Z.; Yun, J.; Zhang, J.; Ou, G.Z.; Liu, C.; et al. Identification of a longevity gene through evolutionary rate covariation of insect mito-nuclear genomes. Nat. Aging. 2024, 4, 1076–1088. [Google Scholar] [CrossRef]
  49. Shen, H.; Braband, A.; Scholtz, G. Mitogenomic analysis of decapod crustacean phylogeny corroborates traditional views on their relationships. Mol. Phylogenet. Evol. 2013, 66, 776–789. [Google Scholar] [CrossRef]
  50. Gan, H.M.; Grandjean, F.; Jenkins, T.L.; Austin, C.M. Absence of evidence is not evidence of absence: Nanopore sequencing and complete assembly of the European lobster (Homarus gammarus) mitogenome uncovers the missing nad2 and a new major gene cluster duplication. BMC Genom. 2019, 20, 335. [Google Scholar] [CrossRef]
  51. Crandall, K.A.; Harris, D.J.; Fetzner, J.W., Jr. The monophyletic origin of freshwater crayfish estimated from nuclear and mitochondrial DNA sequences. Proc. Biol. Sci. 2000, 267, 1679–1686. [Google Scholar] [CrossRef] [PubMed]
  52. Hobbs, H.H., Jr. Synopsis of the families and genera of crayfish (Crustacea, Decapoda). Smithson. Contrib. Zool. 1974, 164, 1–32. [Google Scholar]
  53. Scholtz, G.; Kawai, T. Aspects of embryonic and postembryonic development of the Japanese freshwater crayfish Cambaroides japonicus (Crustacea, Decapoda) including a hypothesis on the evolution of maternal care in the Astacida. Acta Zool. 2002, 83, 203–212. [Google Scholar] [CrossRef]
  54. Kawai, T.; Tudge, C.C. Re-examination of the type material of Cambaroides schrenckii (Kessler, 1874) (Decapoda: Cambaridae) with a lectotype designation, re-description, and discussion on its phylogenetic position. Proc. Biol. Soc. Wash. 2008, 121, 158–176. [Google Scholar] [CrossRef]
  55. Braband, A.; Kawai, T.; Scholtz, G. The phylogenetic position of the East Asian freshwater crayfish Cambaroides within the Northern Hemisphere Astacoidea (Crustacea, Decapoda, Astacida) based on molecular data. J. Zool. Syst. Evol. Res. 2008, 44, 17–24. [Google Scholar] [CrossRef]
  56. Bracken-Grissom, H.D.; Ahyong, S.T.; Wilkinson, R.D.; Feldmann, R.M.; Schweitzer, C.E.; Breinholt, J.W.; Bendall, M.; Palero, F.; Chan, T.Y.; Felder, D.L.; et al. The emergence of lobsters: Phylogenetic relationships, morphological evolution and divergence time comparisons of an ancient group (decapoda: Achelata, astacidea, glypheidea, polychelida). Syst. Biol. 2014, 63, 457–479. [Google Scholar] [CrossRef]
  57. Grandjean, F.; Tan, M.H.; Gan, H.M.; Lee, Y.; Kawai, T.; DiStefano, R.J.; Bláha, M.; Roles, A.J.; Austin, C.M. Rapid recovery of nuclear and mitochondrial genes by genome skimming from Northern Hemisphere freshwater crayfish. Zool. Scr. 2017, 46, 718–728. [Google Scholar] [CrossRef]
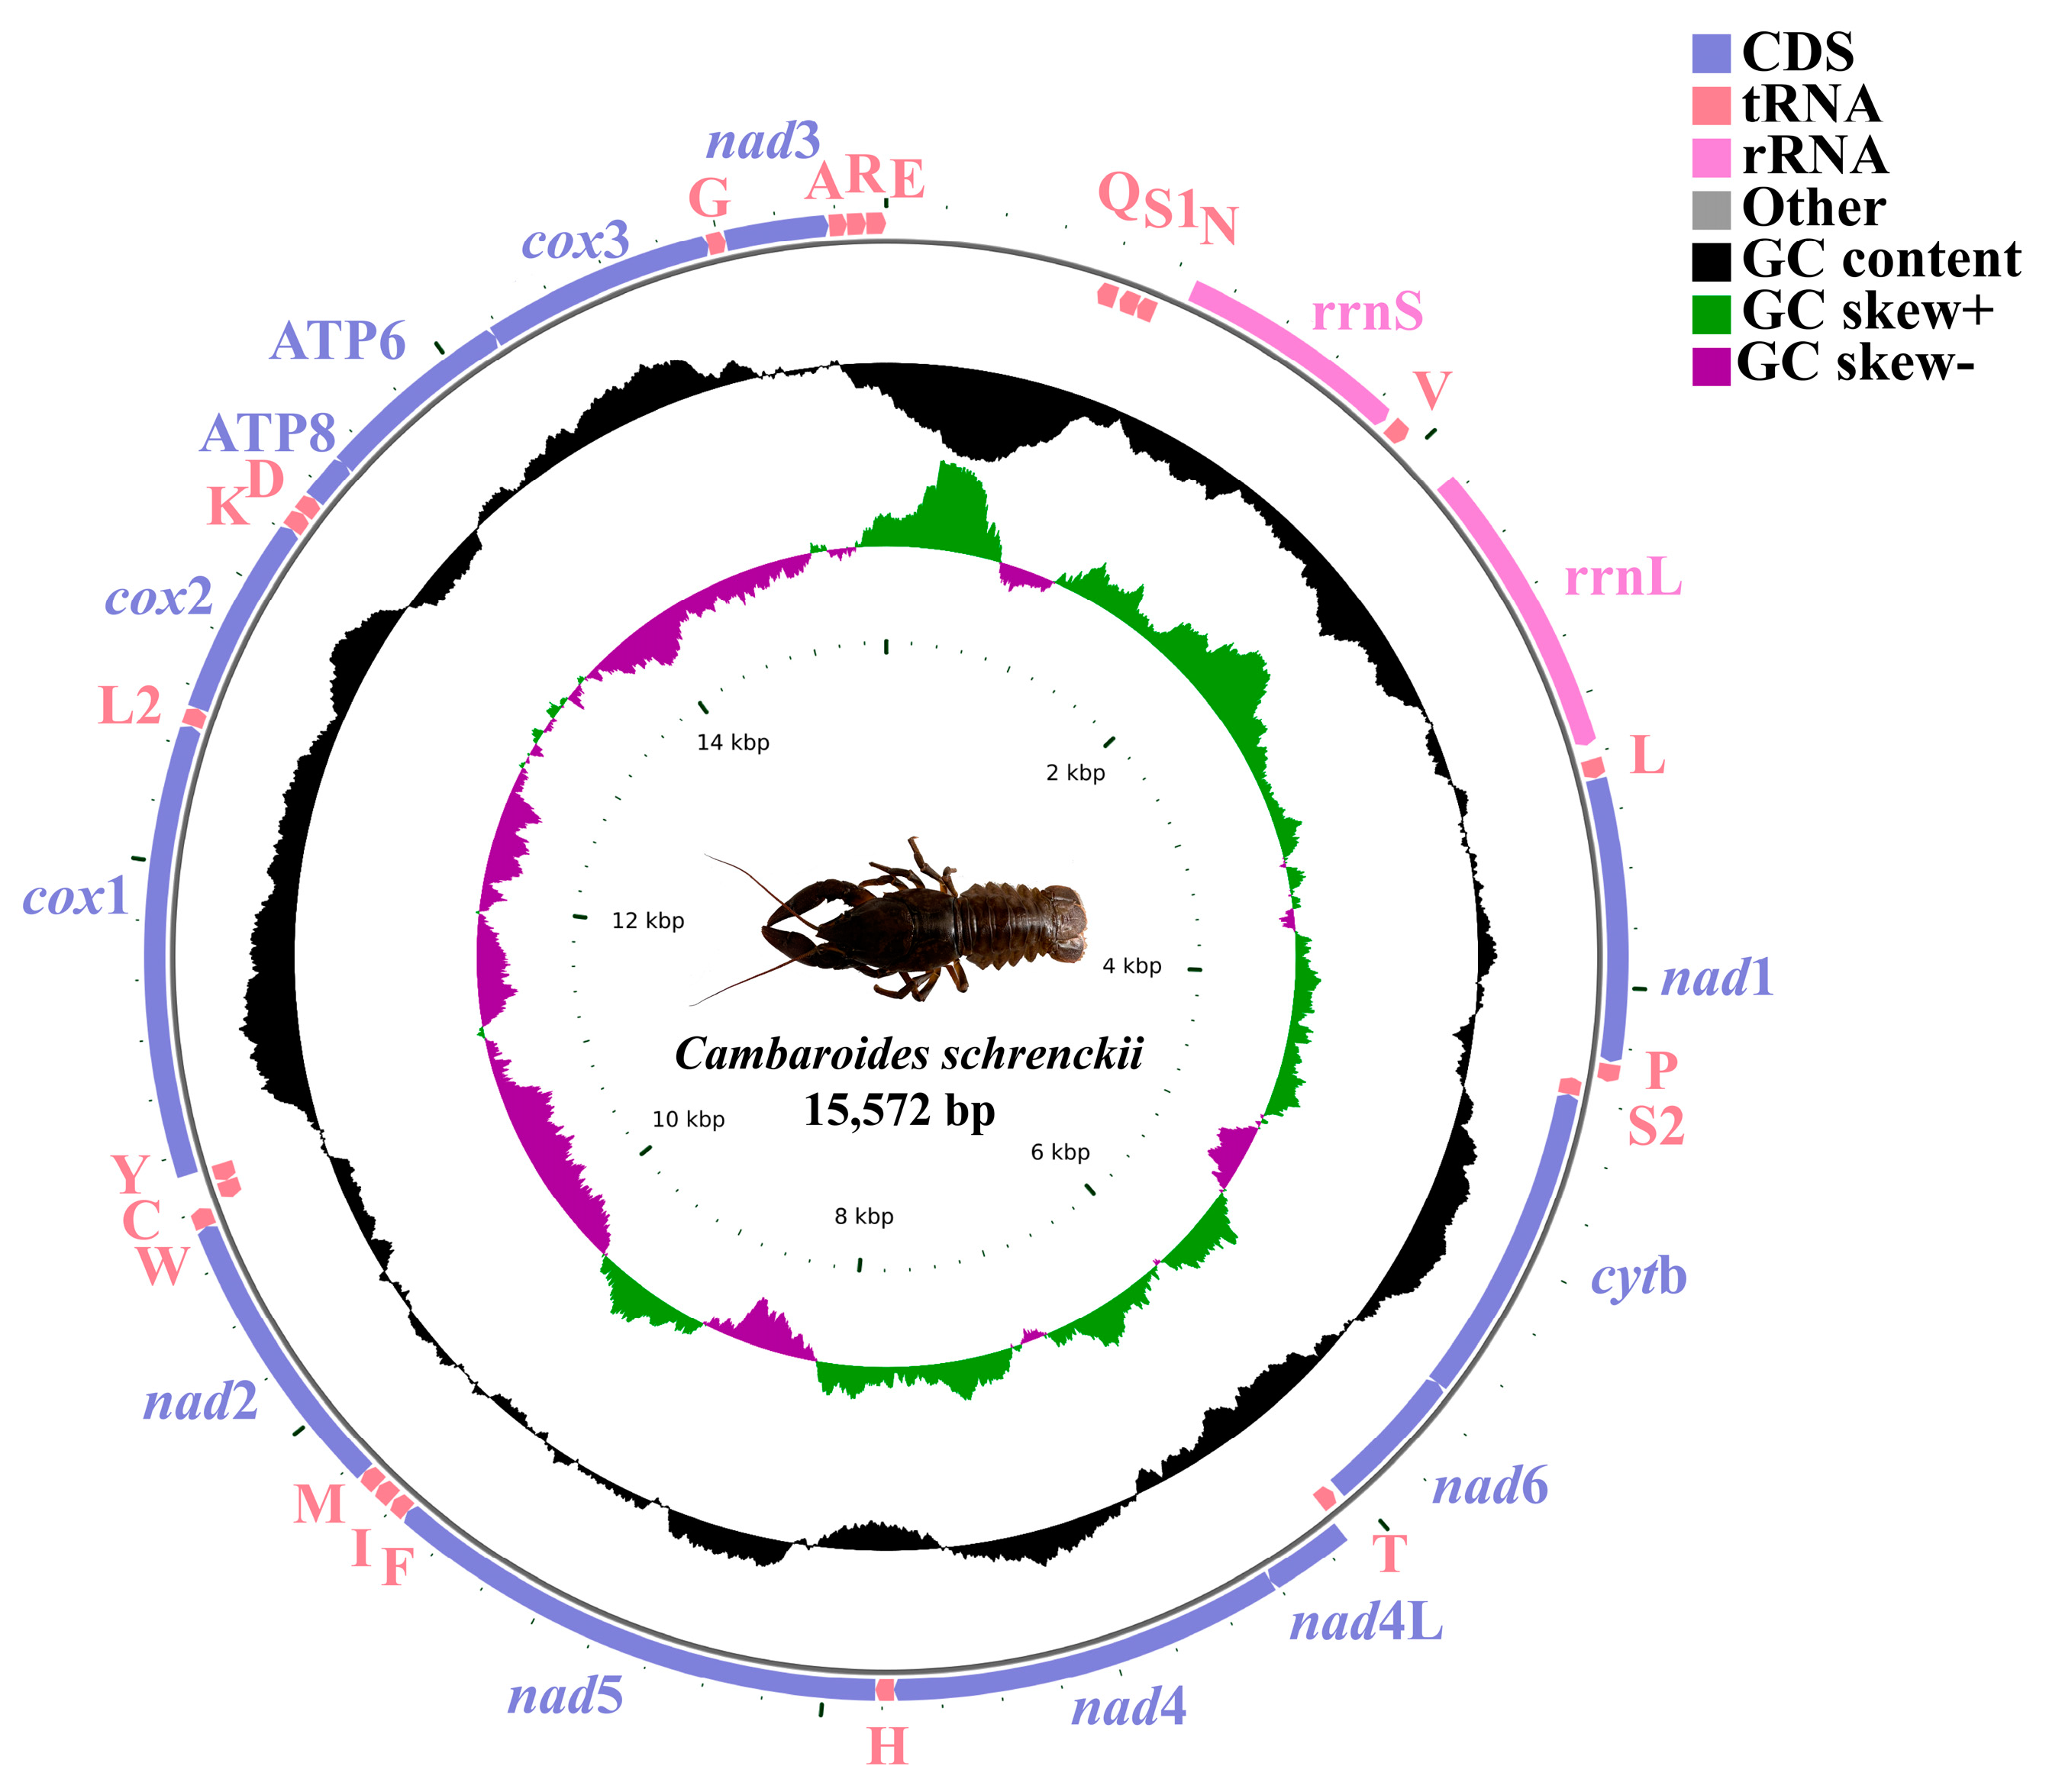
Figure 1. C. schrenckii mitochondrial genome arrangement. PCGs are shown as blue arrows, rRNA genes as purple arrows, tRNA genes as red arrows, and control region as grey arrows. Ticks in the inner cycle indicate the sequence length. The black ring indicates the GC content (outward and inward peaks showing above or below average GC content, respectively). The purple-green ring indicates the GC skew [(G − C)/(G + C)], purple (between 0 and 1), green (between −1 and 0)].
Genes 15 01578 g001
Figure 2. A + T content and nucleotide skew of genes, individual elements, and the complete mitochondrial genome of ten Astacoidea.
Genes 15 01578 g002
Figure 3. Sliding window analysis of the complete mitochondrial genome sequences of five Astacoidea. A sliding window of 300 bp (in 10 bp overlapping steps) was used to estimate nucleotide diversity Pi (π) across the alignments. Nucleotide diversity was plotted against the mid-point positions of each window. Each gene boundary is identified.
Genes 15 01578 g003
Figure 4. Relative synonymous codon usage (RSCU) of 13 protein coding genes of C. schrenckii, C. dauricus, C. japonicus, Cambaroides wladiwostokiensis, and C. similis. The termination codon is not given.
Genes 15 01578 g004
Figure 5. Comparison of the mitochondrial genome organisation of infraorder Astacidea. The circular mitochondrial genome was linearized at the 5′ end of cox1 gene for illustration purpose. Non-coding regions were not shown. Red triangular represent gene or gene fragments positional change. Red rhombus represent the duplicated gene fragments. Positions of the inverted blocks are shown with thick grey solid lines. Inversion is specified by the rotating arrow with red lines. The transposition route is indicated by a dashed line.
Genes 15 01578 g005
Figure 6. Phylogenetic relationships of C. schrenckii with other 42 representative Astacidea based on concatenated amino acid sequences of 13 protein coding genes analysed by maximum likelihood (ML) and Bayesian inference (BI) using C. haematocheir as the outgroup. Red dots on nodes indicate BPP = 100/1.00.
Genes 15 01578 g006
Table 1. Mitochondrial genome structure of C. schrenckii.
GeneStartStopSize (bp)DirectionIntergenic NucleotidesStart CodonsStop CodonsA + T%
D-loop1763763 ---84.53
trnQ76483370----71.43
trnS184891467-14--67.16
trnN91597864-0--70.31
rrnS10711860790+92--74.68
trnV1885195268+24--69.12
rrnL215431701017+201--72.66
trnL13220328465+49--72.31
nad132884249962+3ATGTAG68.61
trnP4257432064+7--71.88
trnS24323438664-2--78.12
cytb438755211135-0ATTTAA64.41
nad655216039519-−1ATTTAA72.83
trnT6060612263-20--79.37
nad4L61256418294+2ATGTAA72.11
nad4641877611344+−1ATGTAA68.68
trnH7761782464+−1--84.38
nad5782595541730+0ATGT68.55
trnF9555961561+0--67.21
trnI9621968464+5--73.44
trnM9688975265+3--70.77
nad2975310,745993+0ATGTAA70.19
trnW10,74510,81066+−1--68.18
trnC10,81010,87263-−1--77.78
trnY10,87310,93462-0--70.97
cox110,93212,4701539+−3ATCTAG62.44
trnL212,47312,53664+2--67.19
cox212,53713,221685+0ATGT64.09
trnK13,22213,28564+0--71.88
trnD13,28713,34963+1--85.71
atp813,35013,508159+0ATGTAA77.99
atp613,50514,176672+−4ATATAA68.75
cox314,17614,964789+−1ATGTAA62.10
trnG14,96315,02462+−2--77.42
nad315,02515,377353+0ATTTAA69.12
trnA15,37915,43961+1--73.77
trnR15,44015,50465+0--73.85
trnE15,50515,57268+0--80.88
Table 2. Cox1 gene selection pressure in Astacoidea conformaceae.
ABCDEFGHI
B0.04
C0.06 0.08
D0.07 0.06 0.07
E0.06 0.05 0.07 0.06
F0.05 0.05 0.05 0.06 0.05
G0.05 0.07 0.04 0.04 0.02 0.07
H0.06 0.04 0.07 0.04 0.03 0.08 0.08
I0.06 0.09 0.03 0.06 0.07 0.04 0.07 0.05
J0.060.040.070.050.060.050.050.050.07
Note: A: Astacus astacus; B: Austropotamobius torrentium; C: Cambaroides dauricus; D: Cambaroides japonicus; E: C. schrenckii in present study; F: Cambaroides similis; G: Cambarus robustus; H: Faxonius luteus; I: Pacifastacus leniusculus; J: Procambarus acutus.
Table 3. Identity of nucleotides and predicted amino acids for protein-coding genes in Cambaroides.
GenesIdentity of Nucleotides/Amino Acids (%)
CSC/CSRCSC/CDCSC/CJCSC/CSCSC/CW
cox1100.0/100.095.8/96.195.8/96.195.2/95.195.8/96.1
cox299.7/100.098.7/98.299.1/99.196.5/94.398.8/98.7
atp8100.0/100.091.7/88.590.4/88.591.0/86.590.4/88.5
atp699.7/100.092.5/90.092.3/90.591.3/88.792.4/90.5
cox3100.0/100.098.2/97.398.7/98.198.2/97.797.8/97.3
nad3100.0/100.092.6/86.394.0/88.993.7/88.994.6/89.7
nad1100.0/100.095.5/93.095.6/93.695.0/92.096.1/93.6
cytb100.0/100.096.6/95.098.1/97.195.9/94.297.9/96.8
nad6100.0/100.093.4/89.595.0/91.989.9/85.593.2/88.4
nad4L100.0/100.096.6/94.895.2/92.895.2/91.895.9/93.8
nad4100.0/100.094.2/91.588.6/84.893.6/90.194.5/91.9
nad5100.0/100.095.5/92.596.6/95.194.8/91.896.1/94.1
nad2100.0/100.093.8/90.394.5/91.891.5/87.093.8/91.2
Total99.7/100.095.3/93.078.0/89.780.6/90.281.4/92.1
Disclaimer/Publisher’s Note: The statements, opinions and data contained in all publications are solely those of the individual author(s) and contributor(s) and not of MDPI and/or the editor(s). MDPI and/or the editor(s) disclaim responsibility for any injury to people or property resulting from any ideas, methods, instructions or products referred to in the content.