Abstract
In the Suidae family, warthogs show significant survival adaptability and trait specificity. This study offers a comparative genomic analysis between the warthog and other Suidae species, including the Luchuan pig, Duroc pig, and Red River hog. By integrating the four genomes with sequences from the other four species, we identified 8868 single-copy orthologous genes. Based on 8868 orthologous protein sequences, phylogenetic assessments highlighted divergence timelines and unique evolutionary branches within suid species. Warthogs exist on different evolutionary branches compared to DRCs and LCs, with a divergence time preceding that of DRC and LC. Contraction and expansion analyses of warthog gene families have been conducted to elucidate the mechanisms of their evolutionary adaptations. Using GO, KEGG, and MGI databases, warthogs showed a preference for expansion in sensory genes and contraction in metabolic genes, underscoring phenotypic diversity and adaptive evolution direction. Associating genes with the QTLdb-pigSS11 database revealed links between gene families and immunity traits. The overlap of olfactory genes in immune-related QTL regions highlighted their importance in evolutionary adaptations. This work highlights the unique evolutionary strategies and adaptive mechanisms of warthogs, guiding future research into the distinct adaptability and disease resistance in pigs, particularly focusing on traits such as resistance to African Swine Fever Virus.
1. Introduction
Suidae are widely distributed around the world [1]. The warthog, a member of the Suidae, is native to the African continent, and its natural habitat has always been in the wild [2]. The African landscape, characterized by its varied topographical and climatic regions, has resulted in the emergence of distinct ecological niches, each fostering the evolution of unique species and subspecies [3]. Such ecological specialization can be evidenced by how species respond to and interact with their habitats [4,5,6]. These interactions catalyze biodiversity variations and spur adaptive evolutionary shifts, molding the evolutionary lineage and phenotypic characteristics of organisms through the ages [7]. A notable example of such evolutionary differentiation can be observed between the river buffalo and the swamp buffalo [8]. Both, despite sharing a common ancestry, have manifested distinct genotypic and phenotypic adaptations to their specific environments [9,10]. Among the Suidae family, a particularly notable distinction is that the warthog can carry the African swine fever virus (ASFV) without displaying any clinical symptoms. In stark contrast, ASFV proves fatal to Sus scrofa [11,12,13,14]. This distinction potentially underscores the notable evolutionary and adaptive variations within the Suidae family.
Biological evolution is underpinned by a nuanced interrelationship between genotypes (an organism’s complete set of genetic material) and phenotypes (its observable traits). Genotypic variations arise from factors like mutations, genetic recombination, and gene flow [15,16,17,18]. Over time, these genetic alterations can accumulate, resulting in notable differences even among individuals of the same population [19,20]. Taking the Suidae family as an example, the warthog and the Eurasian pig, despite their shared lineage, display marked differences. They have distinct chromosomal counts and show reproductive isolation [21]. In terms of physical characteristics, variations in body size, skin tissue, and other traits are evident between the two. Yet, intriguingly, they maintain a substantial genomic homology [22,23]. There are various reasons behind this phenomenon, with the expansion and contraction of gene families being one of the primary contributors.
A gene family refers to a group of genes derived from a common ancestral gene, typically similar in structure and function [24]. Gene family expansion, facilitated by mechanisms like tandem duplications or transposable element-mediated duplications, leads to an increase in gene count, potentially introducing new gene functions [25]. For instance, the expansion of HOX gene families in vertebrates has contributed to the complexity of their body plans and allowed for greater diversification of structures [26,27]. Conversely, gene family contraction can be achieved through gene loss or the formation of pseudogenes. Gene loss may result from gene non-functionalization or complete deletion. Pseudogenes are a specific type of gene that loses its original function but remains in the genome [28,29]. A classic example of this is the olfactory receptor (OR) gene family in humans, where a significant portion have become pseudogenes, reflecting our reduced reliance on smell as compared to other mammals [30,31,32,33]. While expansion provides the raw material for adapting to environmental changes or developing new biological functions, contraction can help eliminate non-essential or detrimental genes, thereby enhancing an organism’s adaptability and survival. In essence, these factors collectively drive the intricate process of biological evolution.
In most of these studies, the primary focus has been on whether the nature of gene family contraction and expansion is driven by strong artificial or natural selection. However, there has been limited attention to the implications of such findings on quantitative and qualitative phenotypic traits of the species itself. Consequently, our study integrates the impact of the expansion and contraction of gene families on the phenotypic traits of the species, offering a comprehensive insight into the adaptive evolution of warthogs. Importantly, this integrative research approach may enrich and benefit future perspectives and angles in studying the pathogenicity of warthogs.
2. Materials and Methods
2.1. Identification of Single-Copy Orthologous Genes and Gene Families
We extracted protein sequences from the genomes of four Suidae species (Duroc pig, Red River hog [22], Luchuan pig [34], and Common warthog) and four non-Suidae animals (cow, sheep, sperm whale, and horse) based on the longest transcript of each gene and removed sequences shorter than 30 amino acids in length. Whales, cows, and pigs belong to the same evolutionary lineage within the Artiodactyla order [35,36]. Horses, as Perissodactyla animals, serve as an appropriate outgroup for constructing evolutionary relationships [37]. Selecting these animals ensures the accuracy of our phylogenetic relationship analysis. OrthoFinder (v.2.5.4) [38,39,40] was utilized to identify orthologous genes and gene families among the input datasets. From the OrthoFinder analysis, 8868 single-copy orthologous genes were identified across all 8 species, ensuring that each gene is represented only once in each genome.
2.2. Phylogenetic Analysis with RaxML
The protein sequences of the 8868 single-copy orthologous genes were aligned using MUSCLE (v.3.8.1) [41]. And we used the default parameters of trimAl (v.1.2.1) [42] to trim away the non-conservative portions. The RAxML [43] was used for phylogenetic tree construction employing the amino acid model (PROTGAMMAJTT). The JTT (Jones–Taylor–Thornton) matrix is a well-established amino acid substitution model that has been widely used due to its suitability for a broad range of datasets [44,45,46]. RAxML is optimized to work efficiently with the PROTGAMMAJTT model, ensuring fast and reliable tree inference, which was particularly important given the large size of our dataset.
2.3. Divergence Time
The protein sequences initially aligned with MUSCLE were translated back to concatenated coding sequences (CDSs) using ParaAT [47]. This ensures that the resulting nucleotide alignments are in-frame and reflect the amino acid homology accurately. The accurate back-translation of aligned protein sequences is critical for subsequent phylogenetic analyses, as it preserves the codon integrity and evolutionary signals contained within the coding sequences. We used the CDSs of 8868 single-copy orthologous genes to estimate the divergence times for the eight species in our analysis based on the species tree. This estimation was carried out using MCMCTree, part of the PAML (v.4.9j) [48]. For calibration, we used fossil evidence described in previous studies. The analysis included two fossil constraints: (i) 47–58 Ma is the divergence time between sperm whales and cattle based on previous studies, and (ii) less than 15 Ma is the divergence time between cattle and sheep according to prior research [22,36].
2.4. Expansion and Contraction of Gene Families
We compared the cluster sizes of gene families from each of the eight sequenced genomes with their corresponding ancestral gene families using the Café [49] program, which operates on a probabilistic graphical modeling approach. Utilizing CAFE (v5.0), gene family size transition rates from parent to child nodes can be calculated, aiding in ancestral species gene family size inference. Concurrently, conditional likelihoods serve as the statistical metric for deriving p-values for each distinct lineage [50]. Gene families with a p-value < 0.05 were identified as having undergone significant expansion and contraction within the Suidae clade.
2.5. GO and KEGG Analysis
We utilized the g:Profiler. https://biit.cs.ut.ee/gprofiler/ (accessed on 12 October 2023) [51]. We adopted the mouse genome as a reference due to its well-annotated genomic resources. First, our target genes were mapped to their mouse orthologs using g:Profiler-g:Convert. With this set of mouse orthologous genes, we conducted the GO and KEGG enrichment analyses. Enriched GO terms and KEGG pathways were identified based on a significance threshold of p-value (p < 0.05).
2.6. Phenotype and QTL Analysis
We mapped the target genes to annotation file (Sus scrofa 11.1) to obtain gene positions. The corresponding genes were then converted to mouse orthologous genes and phenotype analysis was conducted in the MGI database. https://www.informatics.jax.org/ (accessed on 18 October 2023) [52]. Using the regions of all genes as the background set, we conducted enrichment analysis with the QTLdb-pigSS11 (Animal QTL Database). https://www.animalgenome.org/cgi-bin/QTLdb/ (accessed on 3 November 2022) [53].
3. Results
3.1. Identification and Comparison of Homologous Genes and Gene Family
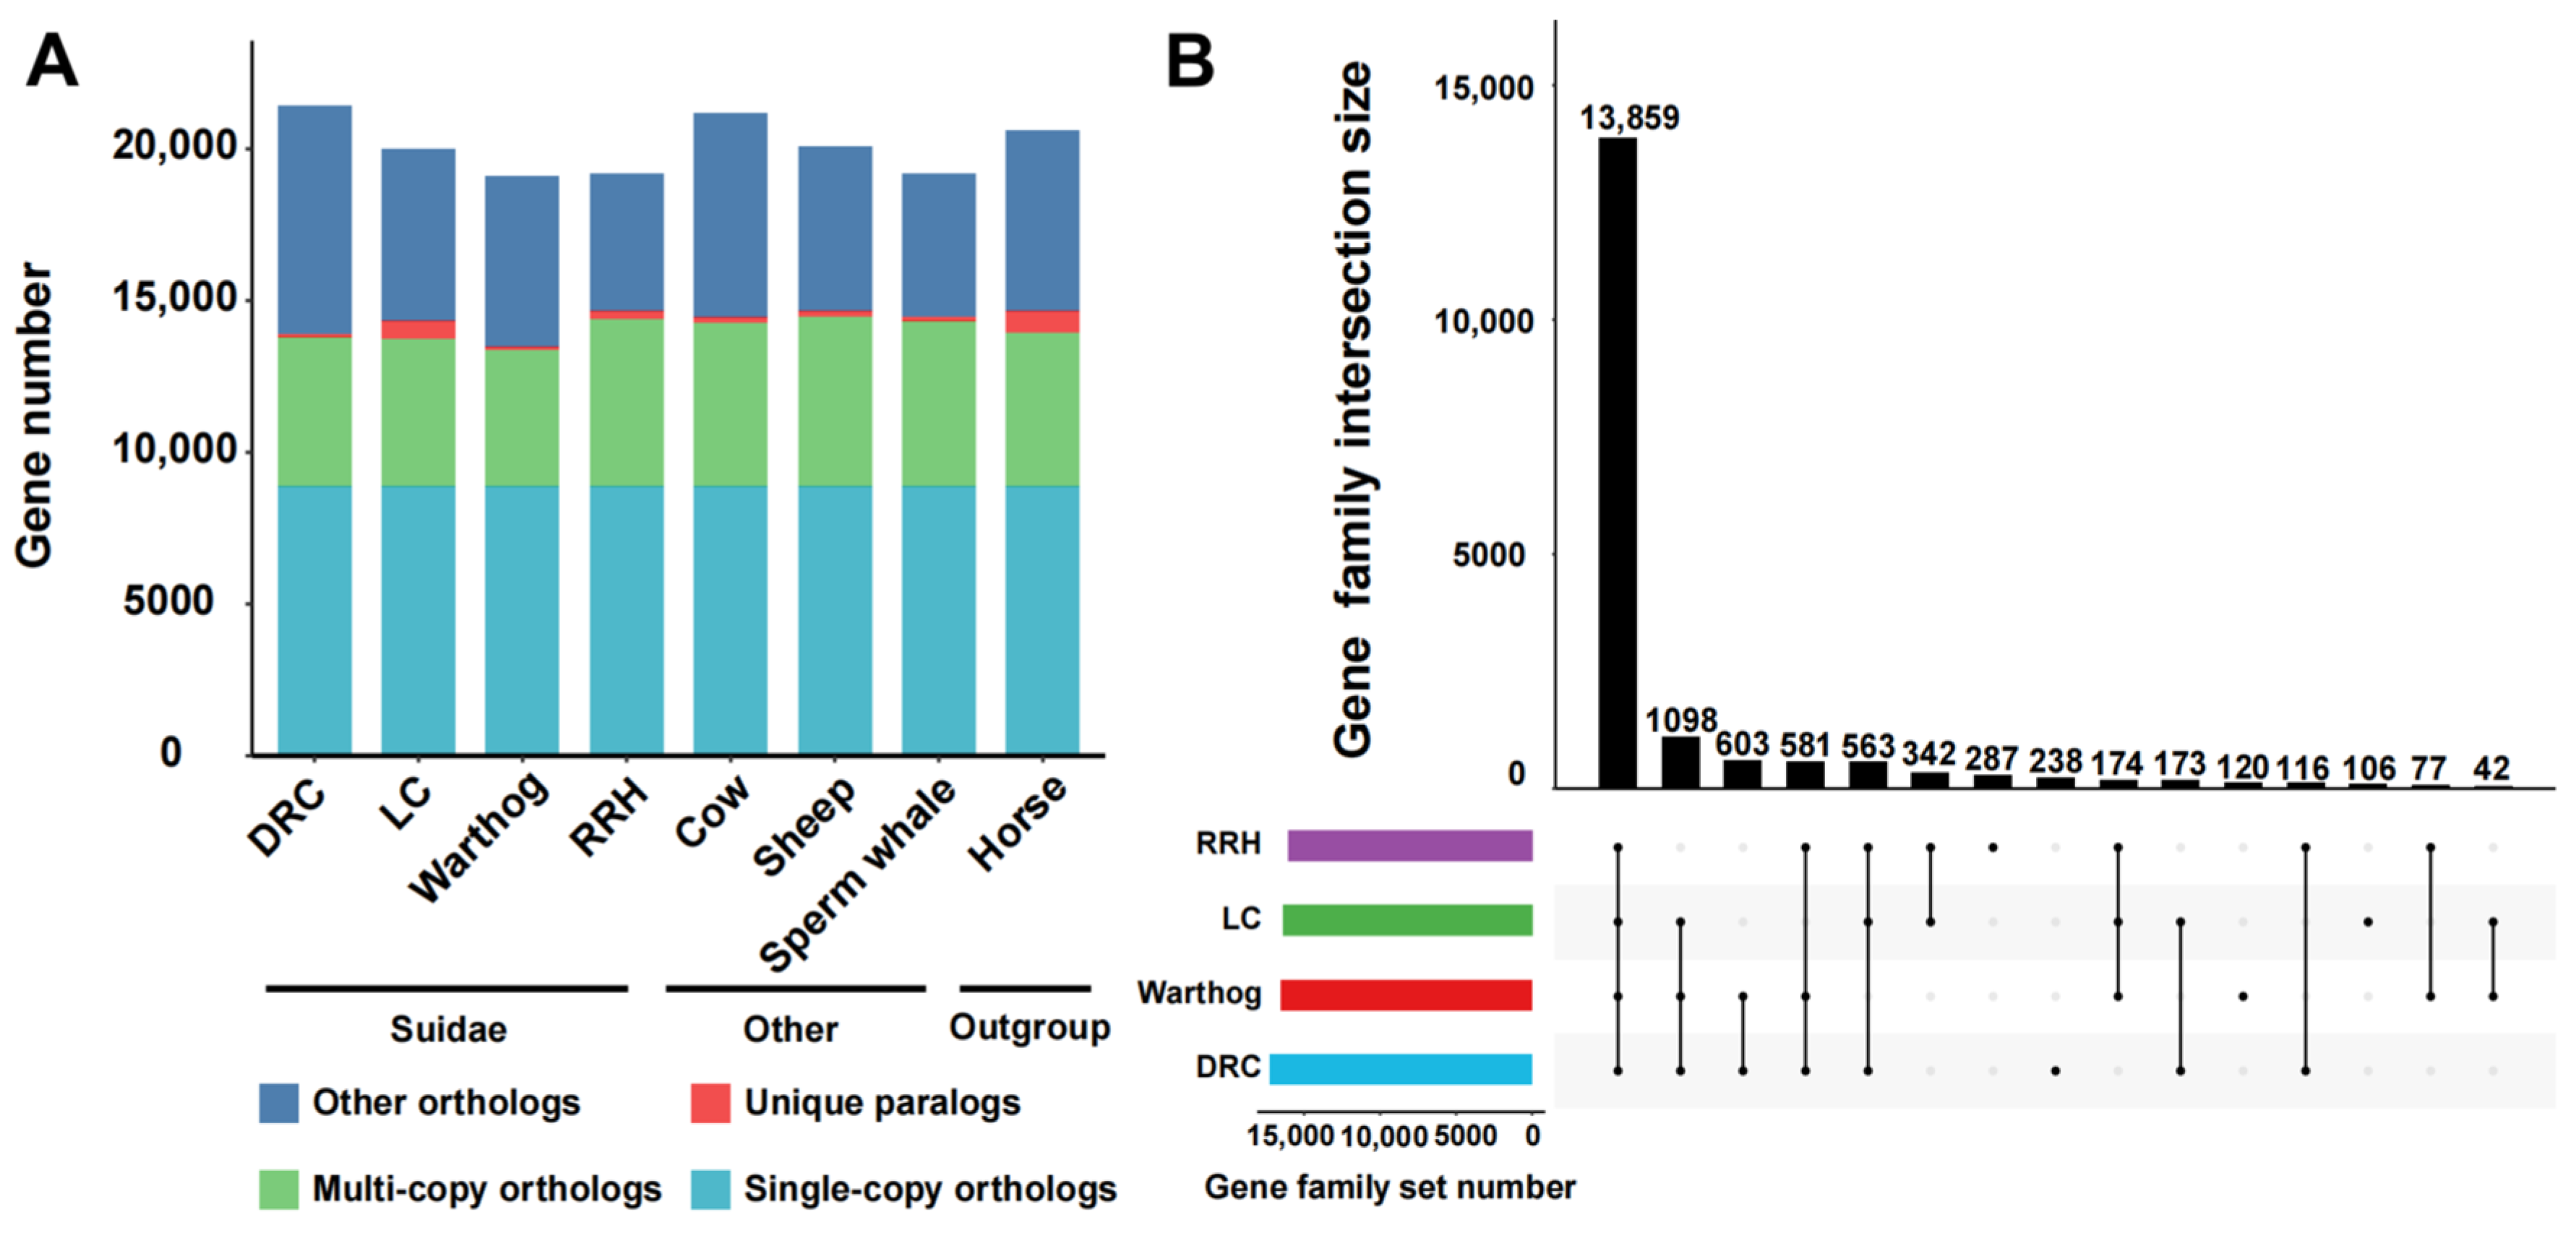
We selected the Luchuan pig [34] and Duroc pig, representative pig breeds from China and the West, for comparison with the warthog. Additionally, we incorporated the Red River hog. Geographically, the warthog’s distribution is proximate to that of the Red River hog [22,54]. For a robust evolutionary analysis, we included non-swine species with well-established evolutionary relationships (Table 1). From these eight genomes, we pinpointed 8868 single-copy orthologous genes (Figure 1A). Subsequently, we compared the number of different types of orthologous genes. The unique gene count in warthogs does not significantly differ from other suid species, but the quantity of multi-copy orthologous genes is lower than in other suid species. The RRH has more unique genes and multi-copy orthologous genes than the warthog (Figure 1A). For Suidae animals, we assigned genes into gene families, classifying them as common (shared across all species), partially shared, or species-specific. During the statistical process, we do not exclude the presence of single copies in one or several breeds. The RRH has more unique gene family’s numbers than the warthog, but there are also gene family’s numbers shared only by the warthog and RRH (Figure 1B). Multi-copy forms are instrumental in organismal evolution and adaptability, serving as a foundational mechanism for gene family creation. These findings highlight that despite the close geographical proximity and shared African wild species status of both the warthogs and RRHs, they exhibit distinct genomic evolutionary patterns.

Table 1.
Selected species and genomic sources.
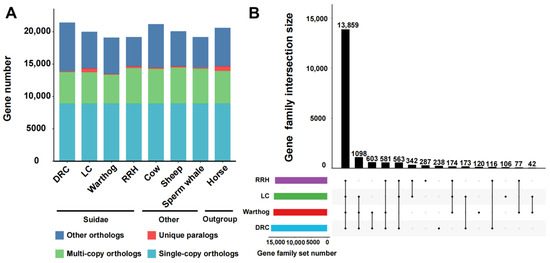
Figure 1.
Comparative analysis of homologous genes and gene families. (A) Homologous gene quantity and types between Suidae species (Duroc pig (DRC), Luchuan pig (LC), Common warthog (warthog), and Red river hog (RRH)) and other species (cow, sheep, sperm whale, and horse). (B) Shared and unique gene families in Suidae species. Lines with black dots signify shared relationships. Black dots without lines indicate uniqueness.
3.2. Phylogenetic Relationships and Divergence Time
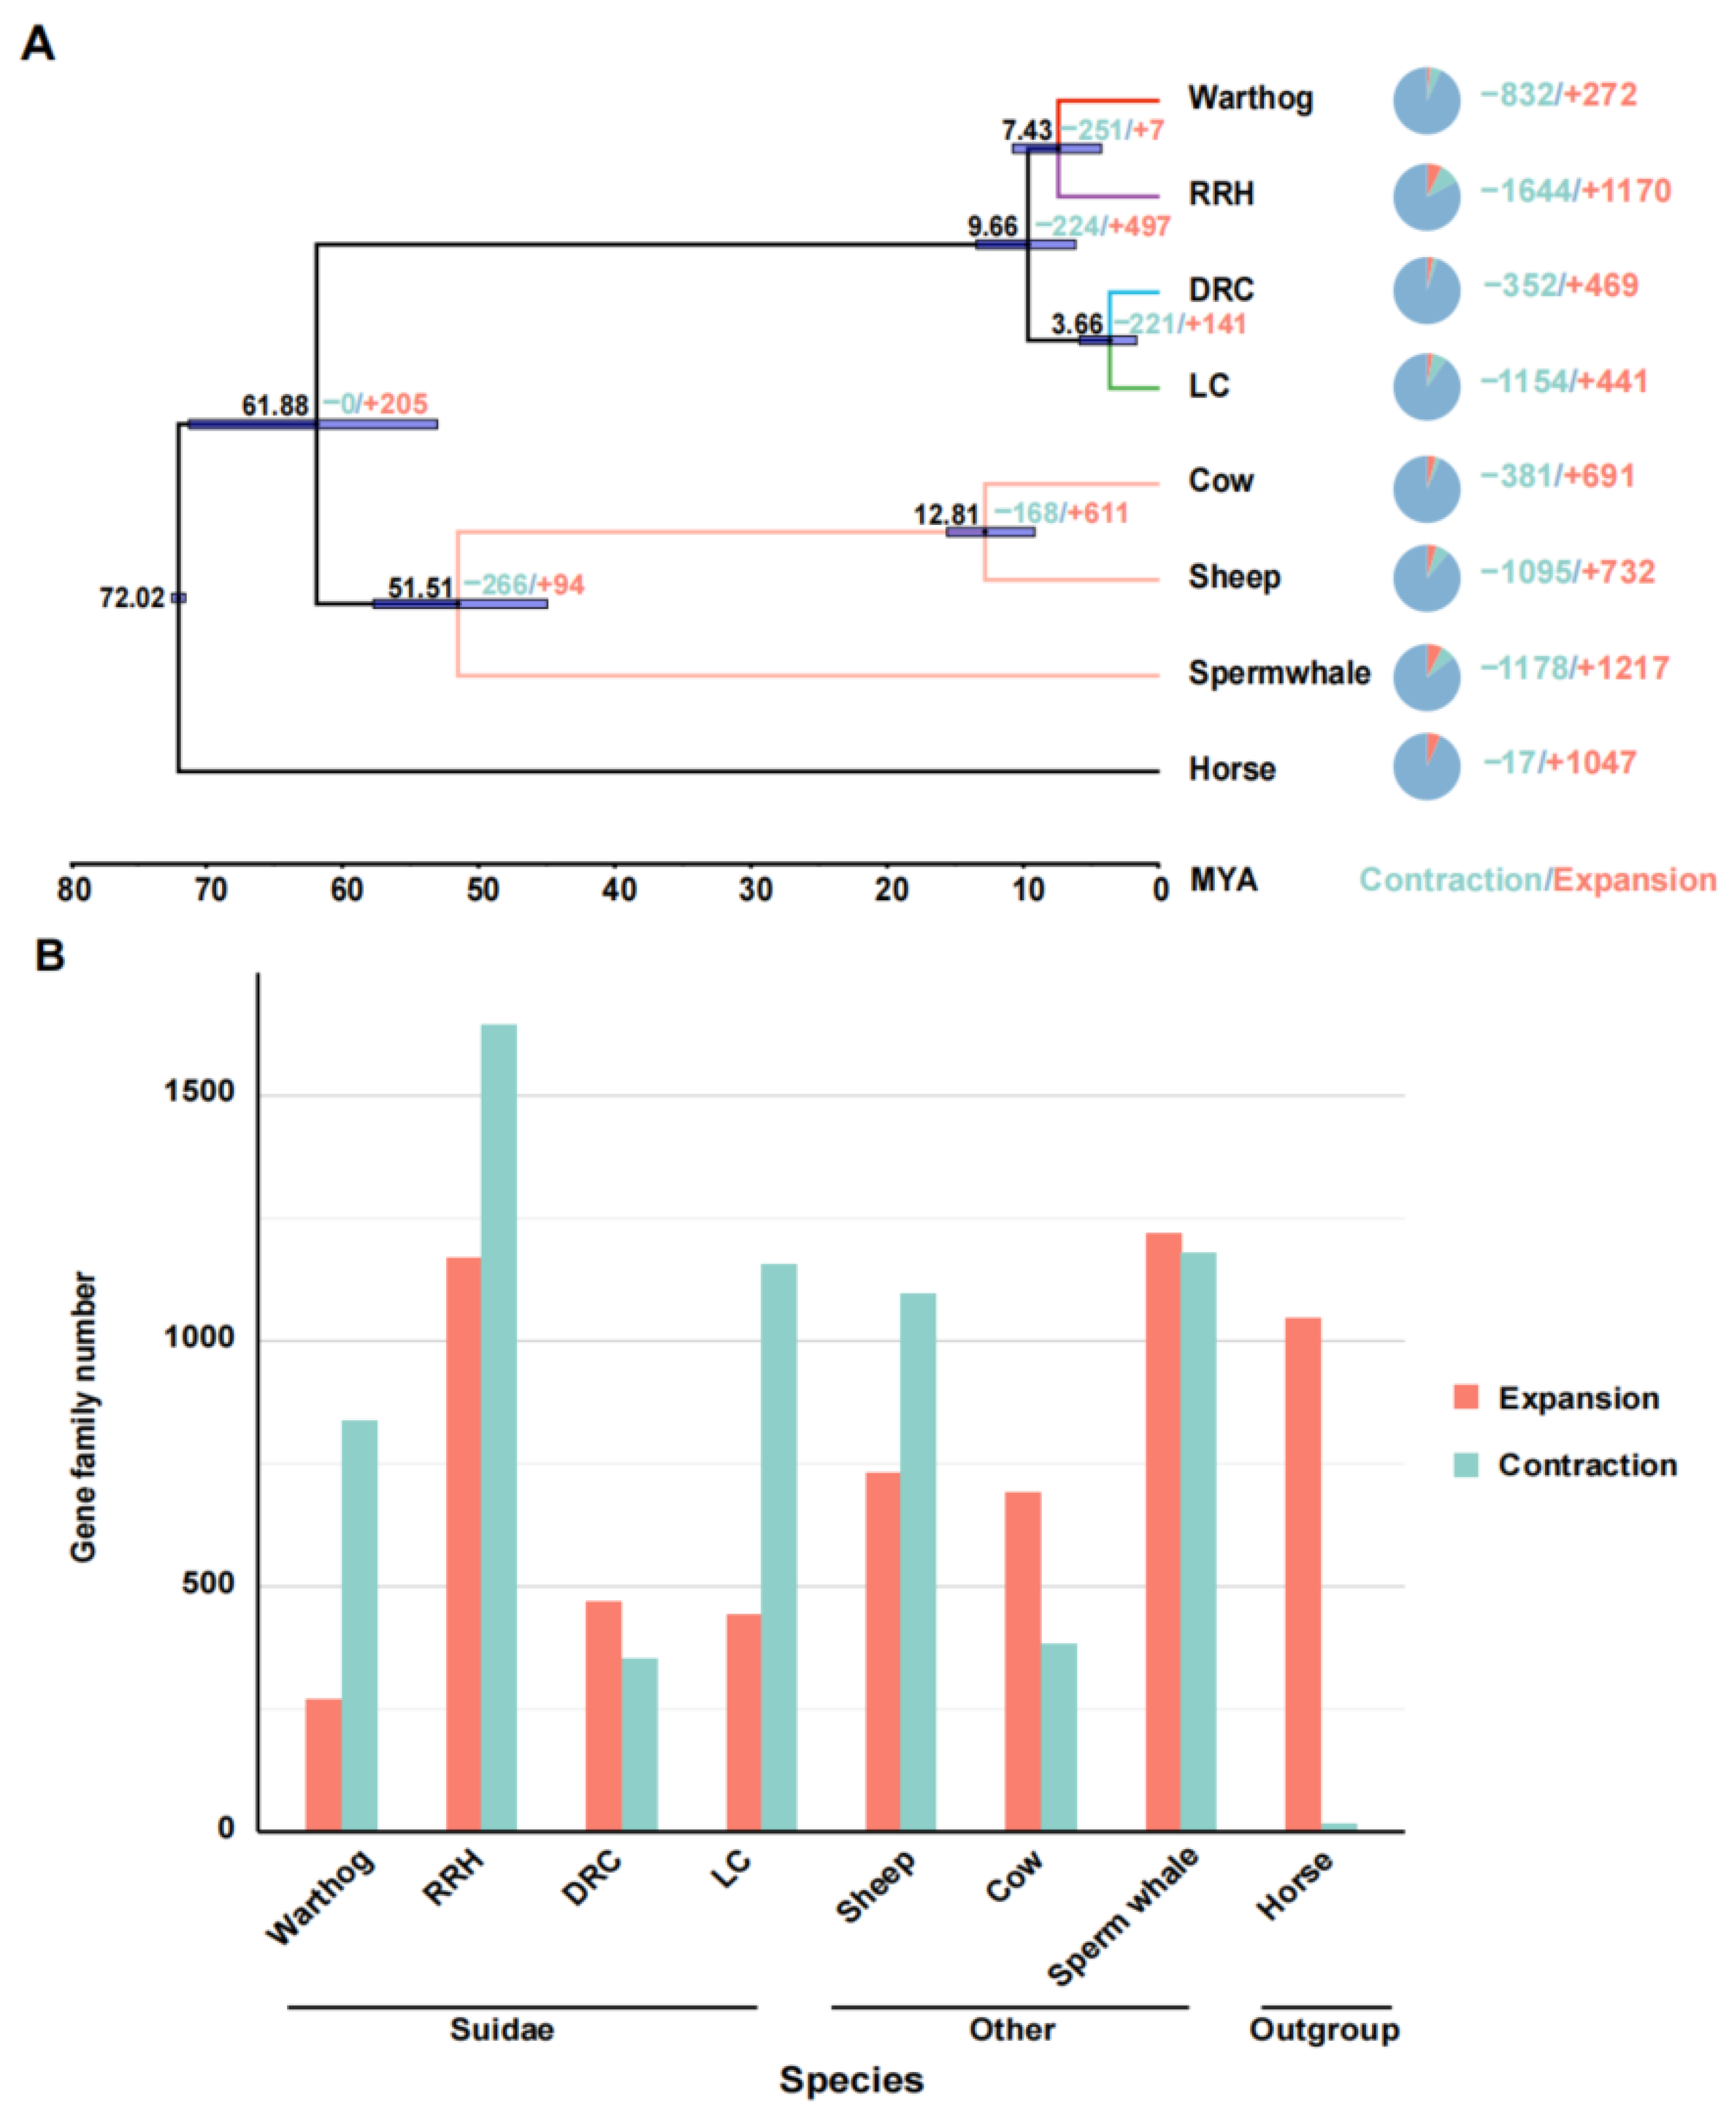
To clarify the phylogenetic relationships and divergence times among Suidae species, we analyzed 8868 single-copy orthologous protein sequences, using the horse as the outgroup [55]. The phylogenetic tree was constructed using protein sequences with an amino acid model. The phylogenetic tree indicates a distinct common ancestral branch for the warthogs and Red River hogs, while the Duroc and Luchuan pigs belong to another branch, consistent with previous research [22,56]. Subsequently, we translated the protein sequences of single-copy orthologous genes into their corresponding concatenated coding sequences (CDSs). Additionally, we utilized the fossil records of non-Suidae animals with well-established evolutionary relationships as calibration points (sperm whale; cow; sheep) [36,57]. The results indicate that there was a divergence time of approximately 9.7 million years ago (95% highest posterior density, HPD = 13.9–6.2) between African suids and Eurasian pigs, and the divergence between warthogs and RRHs occurred approximately 7.43 million years ago, (95% highest posterior density, HPD = 10.8–4.3) with the Eurasian species diverging late (Figure 2A). Warthog and RRH began to diverge earlier than the Eurasian species, suggesting they possess unique evolutionary factors and patterns compared to Eurasian pigs.
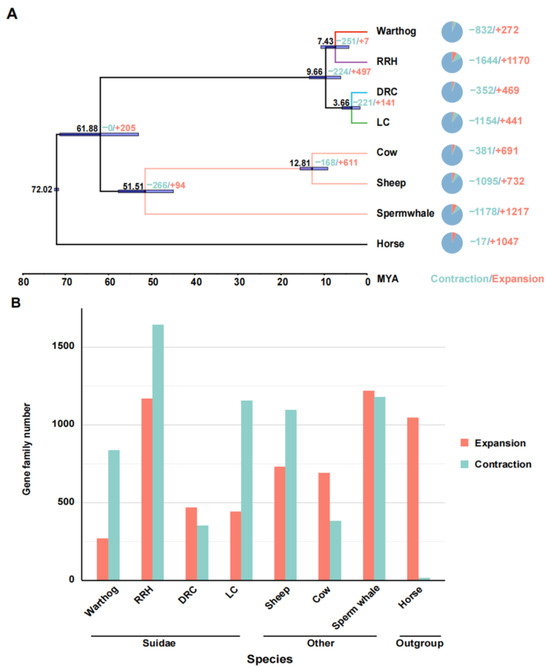
Figure 2.
Phylogenetic relationships, divergence time analysis, and expansion and contraction of gene families. (A) Estimation of species phylogeny, divergence time, and changes in gene family sizes (contraction and expansion). Horses are not assigned a distinct branch color. Species with a well-established evolutionary relationship share consistent branch colors. The four distinct Suidae species are differentiated by unique colors. Horizontal bars at the nodes represent the 95% HPD confidence intervals. The left node side shows divergence time; the right side details gene family changes. The pie chart on the far right illustrates the proportional representation of gene families that have contracted or expanded. The unit for divergence time is million years. (B) Trends in gene family contraction and expansion.
3.3. Expansion and Contraction of Gene Families
To investigate the adaptive evolution of warthogs during their evolutionary history, we analyzed the contraction and expansion of gene families across all animals in the phylogenetic tree, utilizing data derived from the allocation of genes to their respective families and insights from multicopy genes. In light of the inherent preferences of our analysis tools, we deemed it appropriate to redefine gene families based on the output results. One potential advantage of this approach is it considers genes that may have undergone sequence modifications throughout evolution, potentially influencing their homology [40]. The results indicate that throughout the evolutionary process, all species exhibit varying degrees of contraction and expansion in gene families, including those within the Suidae family (Figure 2A). However, the trends in gene family contraction and expansion are inconsistent within the Suidae family. In their evolutionary progression, Duroc pigs have more gene families that have expanded than contracted, while Warthogs, Red River Hogs, and Luchuan pigs have the opposite trend (Figure 2B). This may be due to the DRC being subjected to more intense artificial selection. In previous studies, a similar trend was also observed [56]. Subsequently, we converted the genes from the prominently expanded and contracted warthog gene families into their human homologues and performed Gene Ontology and Kyoto Encyclopedia of Genes and Genomes (GO and KEGG) analyses on these gene families (Figure 3). Significantly expanded gene families in warthogs are primarily associated with sensory stimuli, including taste, smell, and vision. (e.g., GO:0004984~ olfactory receptor activity, GO:0007608~ sensory perception of smell, KEGG:00830~ retinol metabolism.) Among them, the olfactory function is notably enriched in the classic olfactory receptor (OR) gene family [58,59]. Originating from the UGT gene family, the UGT2A3 and UGT2A1 genes are notably associated with retinol metabolism. In human studies, the UGT gene family is vital for maintaining homeostasis by facilitating the elimination of potentially harmful compounds [60]. On the other hand, genes like TAS2R16, TAS2R7, TAS2R42, TAS2R9, and TAS2R10 are significantly associated with taste. In various species, the TAS2R bitter taste receptor gene activates selectively based on specific environmental conditions [61,62] The prominently contracted gene families in warthogs are chiefly associated with metabolic processes. We infer that warthogs, as wild species, exhibit pronounced sensitivity to environmental stimuli. This heightened sensitivity may have driven the evolution of their acute sensory perceptions, enhancing their capabilities in foraging and predator evasion. This further substantiates the adaptive evolution of warthog pig.
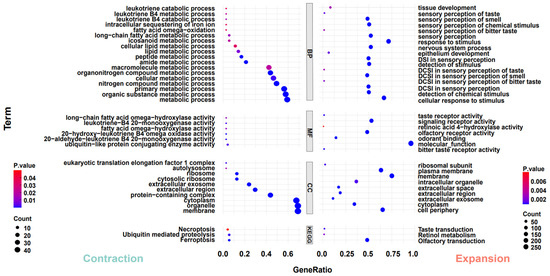
Figure 3.
Analysis of GO and KEGG pathways. The left side analyzes genes in significantly contracted (p < 0.05) gene families in warthog, while the right side focuses on those in significantly expanded (p < 0.05) gene families in warthog. Functional enrichment classification: biological process (BP), molecular function (MF), cellular component (CC).
3.4. Gene Family Contraction and Adaptive Avoidance
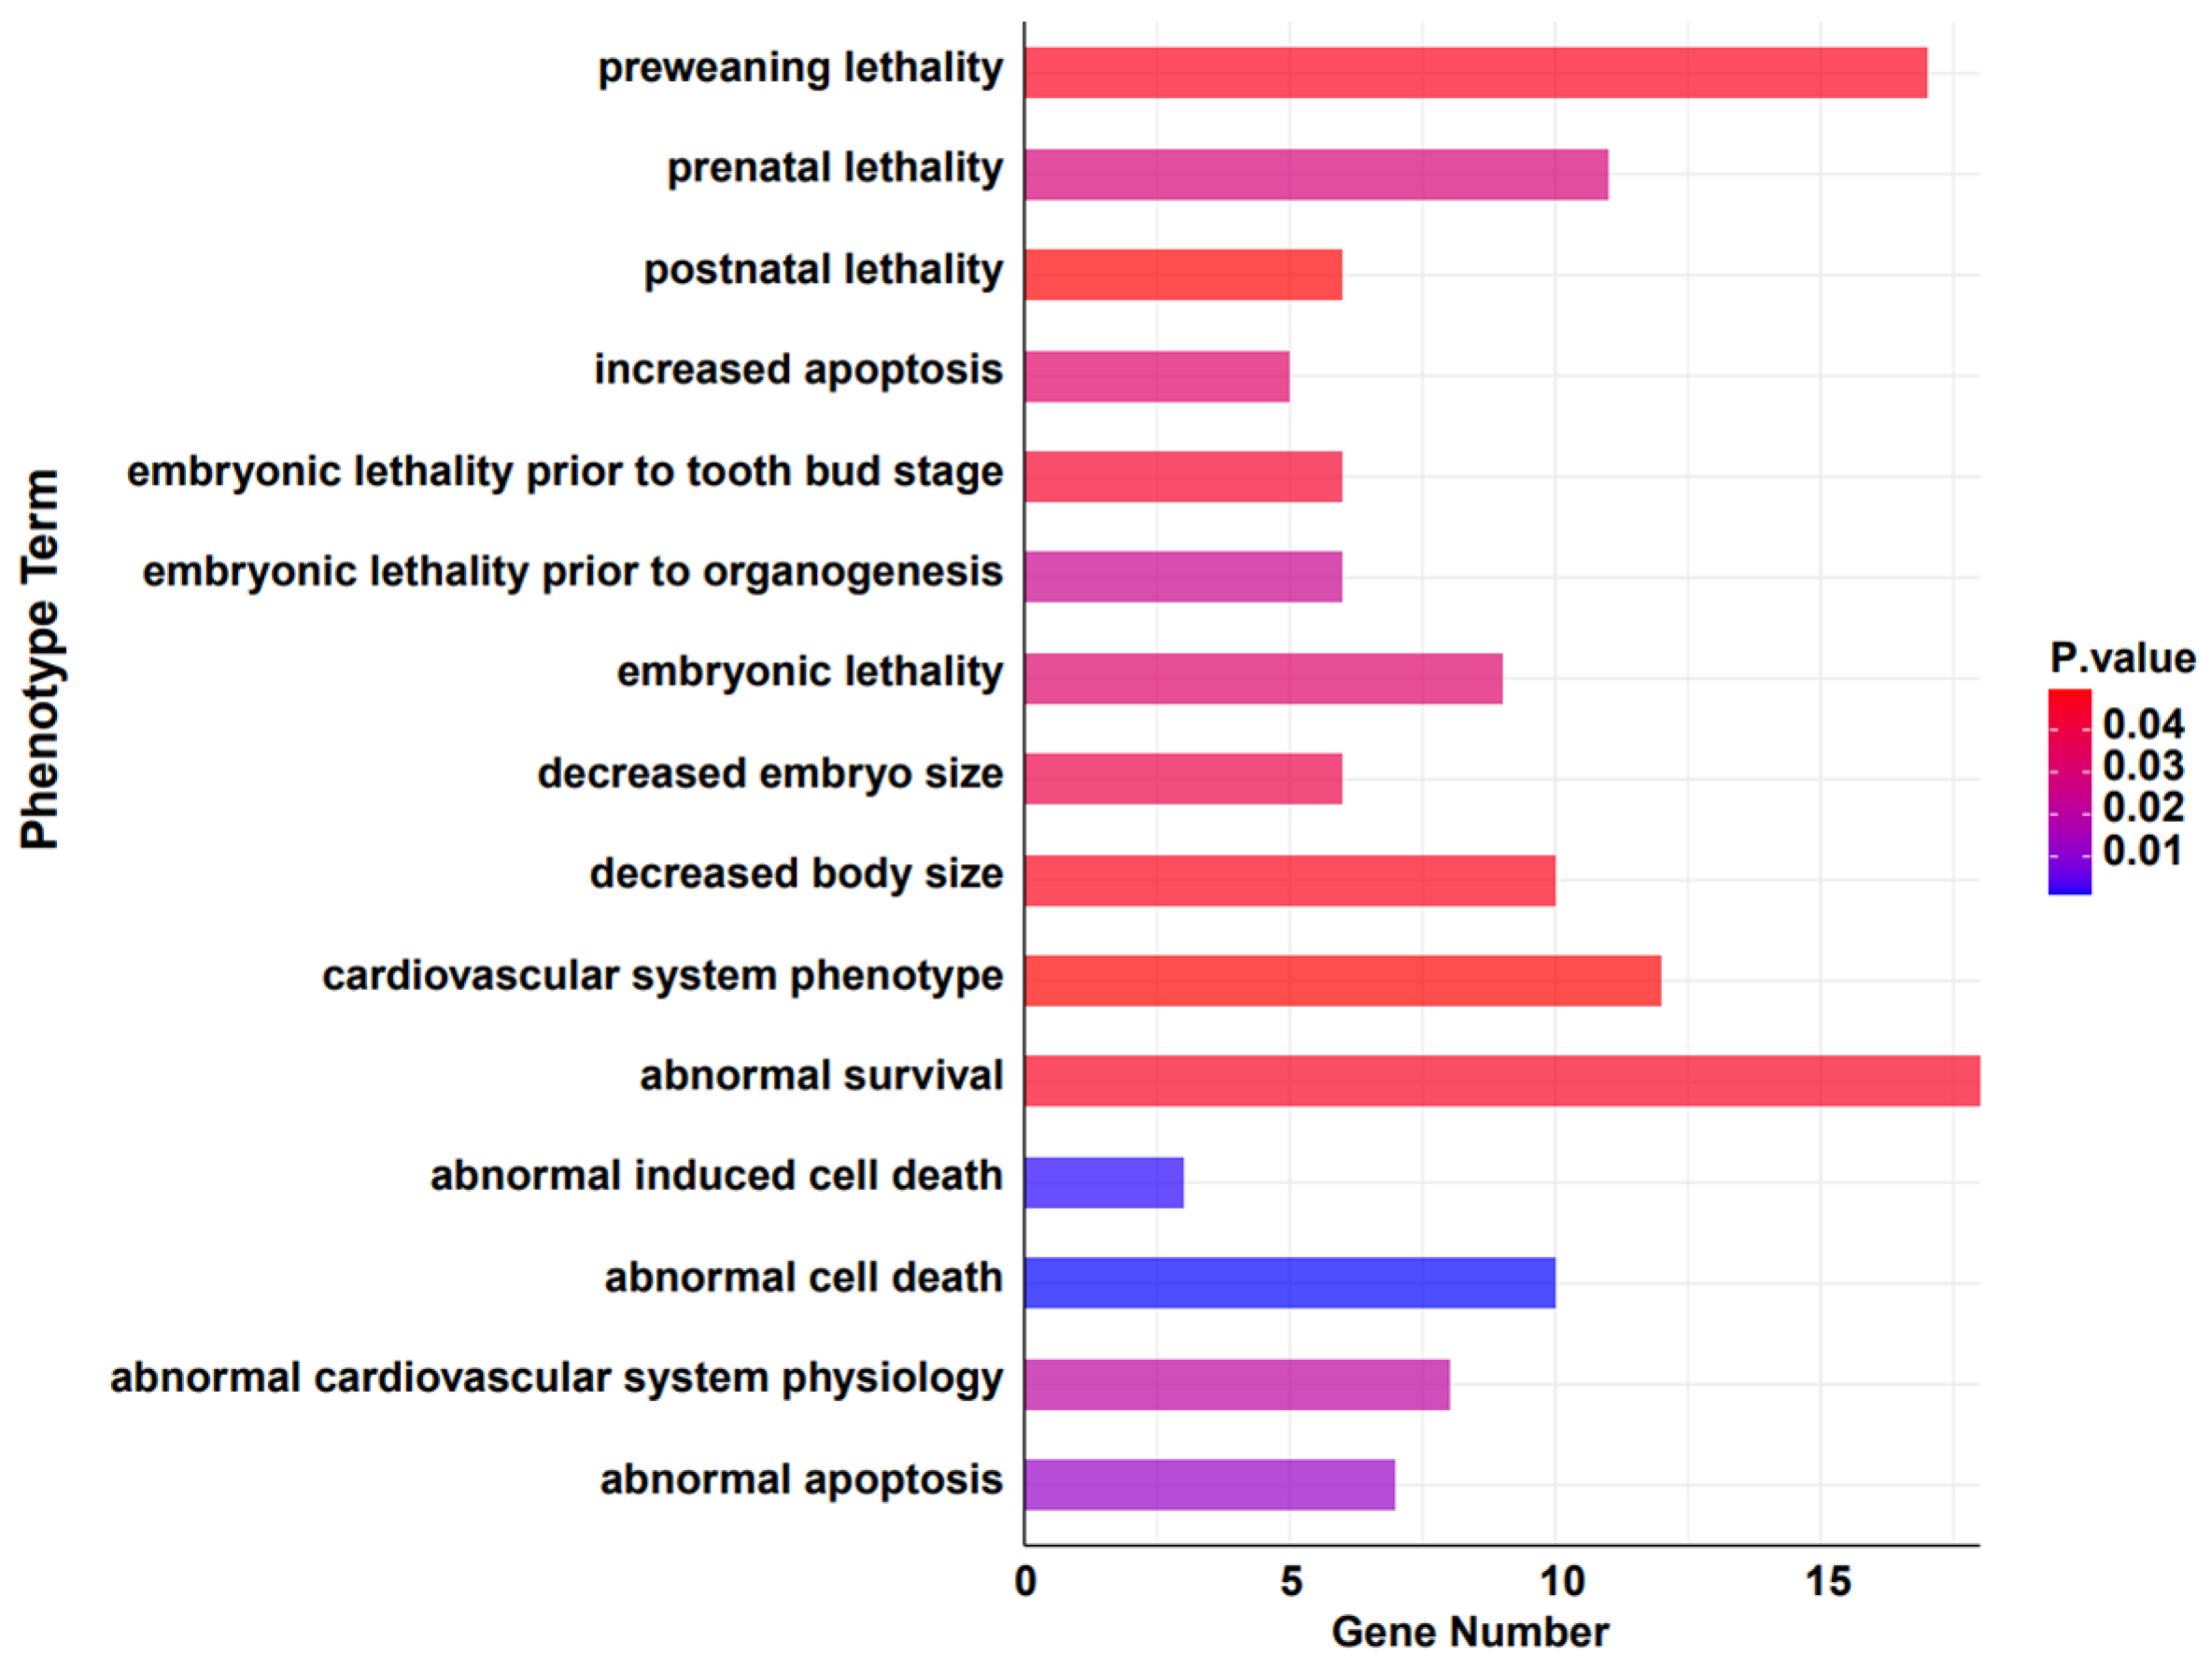
To further investigate if the contraction of gene families is associated with avoiding detrimental evolutionary effects, we converted the remaining genes from these families to their murine orthologs and examined their phenotypic associations using the MGI database [52]. The results suggest that the significantly contracted genes are notably correlated with survival rates under varying conditions (Gene Count number top 20, p < 0.05) (Figure 4 and Table 2). Cul3 and Cycs are associated with several conditions including abnormal survival, preweaning lethality, prenatal lethality, embryonic lethality prior to organogenesis, and decreased embryo size. This indicates a crucial role in embryonic development and survival. Other studies have shown that it significantly affects tumors and cellular apoptosis [63,64,65]. Genes such as Eef1a1 [66], Eef1a2 [67], and Fth1 consistently appear in contexts related to survival, cell death, and cardiovascular system phenotypes, highlighting their potential roles in key physiological processes [68]. Krt1 [69] and Lama2 [70] show a breadth of associations, from abnormal survival to cardiovascular system phenotype and decreased body size, emphasizing their diverse functional implications. Myh3, Myh7, and Nrxn2 are tied to various survival and developmental phenotypes, suggesting a pivotal role in early life stages. Moreover, earlier studies have indicated that the Myh3 gene exhibits a strong pathogenicity in Suidae (pig-related) animals, and it is associated with abnormalities in skeletal and muscular development [71]. Ntrk3, Nup153, and Pom121 [72,73,74] present themselves across several survival-associated categories, emphasizing their potential importance in life preservation. These results correspond to the functional enrichment analysis of the contracted gene families. This suggests that, over the course of long-term evolution in the wild, the warthog has, through certain patterns, attenuated and reduced gene families unfavorable for its survival. It hints at a unique adaptive evolutionary strategy that the warthog may have developed to circumvent unfavorable factors, though this warrants further investigation and discussion.

Figure 4.
Phenotypic analysis of significantly contracted (p < 0.05) gene families in warthog.
Table 2.
Phenotype term and genes.
3.5. Association between Expanded and Contracted Gene Families with QTLs
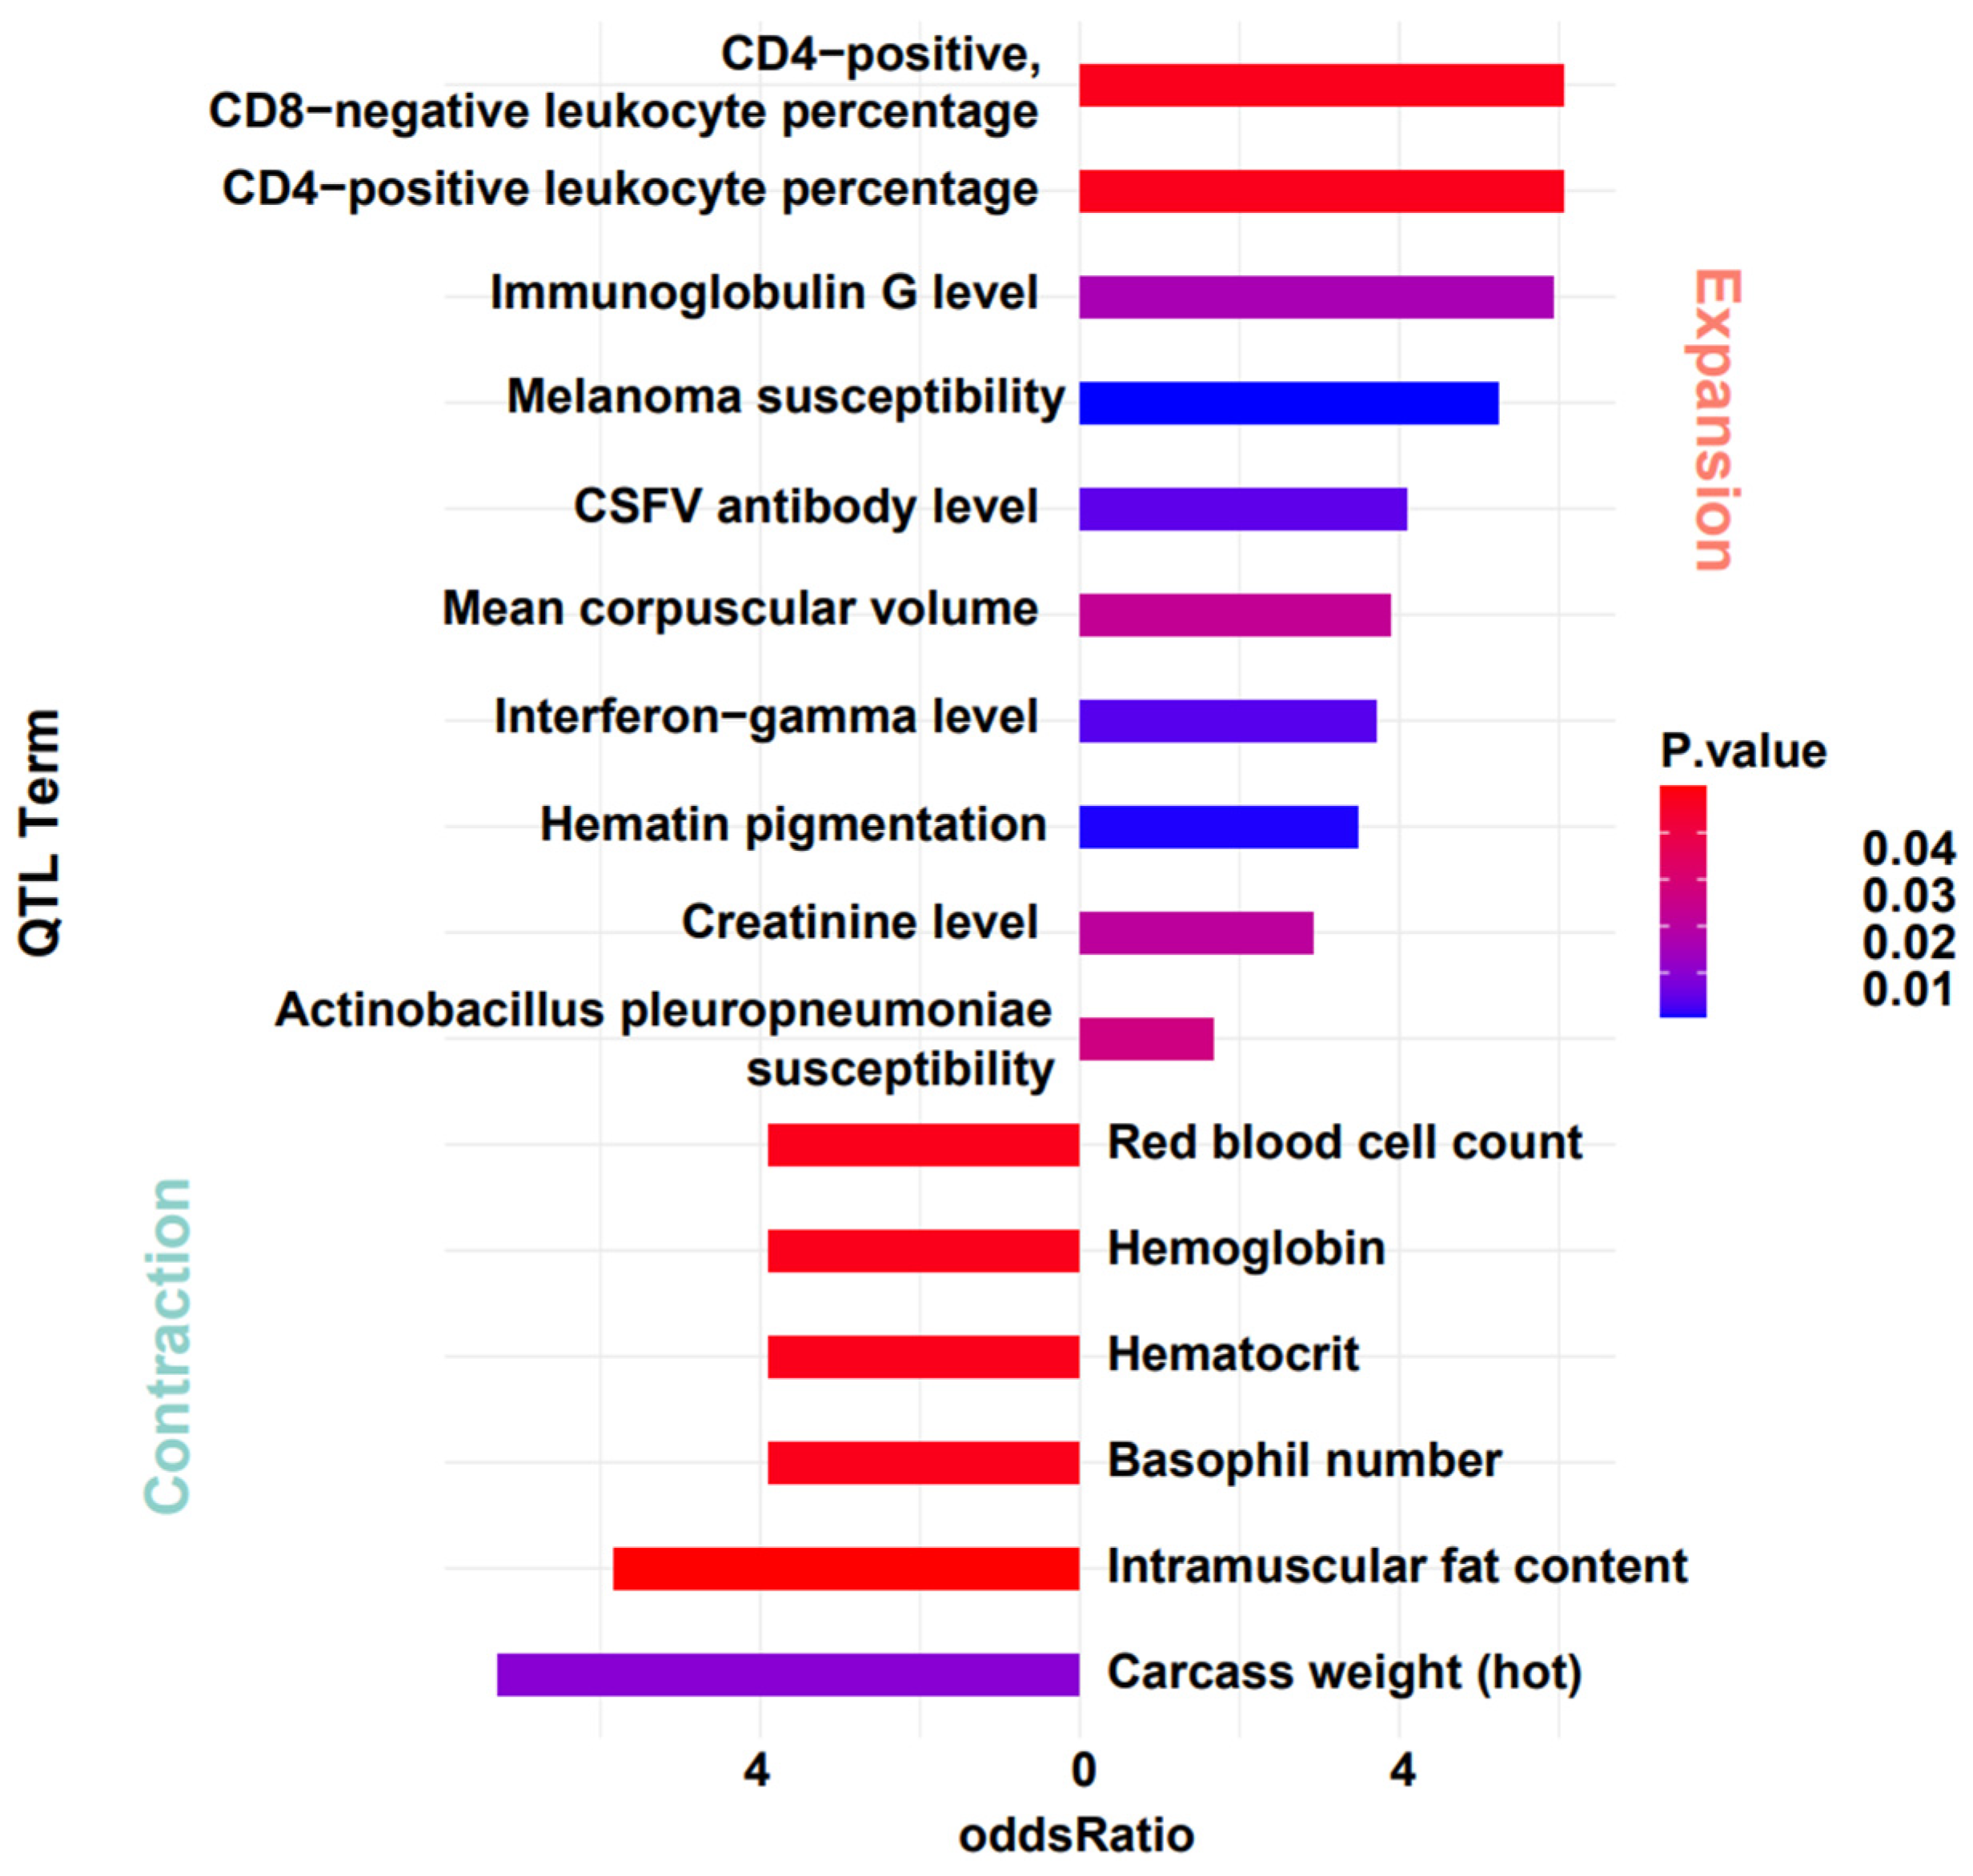
For the notably contracted and expanded gene families, we further investigated their association with quantitative trait loci (QTL). Given the conservation of gene function, we mapped genes from the warthog’s significant expanded and contracted gene families onto DRC annotation files. After obtaining the gene localization data, we designated the contracted and expanded gene regions as the target sets. Using the regions of all genes as the background set, we conducted enrichment analysis with the QTLdb-pigSS11 database [53]. The results show that these gene locations are significantly enriched in QTL entries related to cell levels and Classical Swine Fever Virus (CSFV). Genes from the contracted gene family are enriched in entries related to blood cells (e.g., red blood cell count, hematocrit, hemoglobin). Genes from the expanded gene family are enriched in entries related to immunity (e.g., CSFV antibody level, immunoglobulin G level, creatinine level, CD4-positive, CD8-negative leukocyte percentage, CD4-positive leukocyte percentage). After mapping these entries back to their specific gene names, we obtained an intriguing result. Genes related to olfaction that expanded significantly during evolution are located in immune-related QTL regions, and some genes exhibit pleiotropic effects (Figure 5 and Table 3). Although these findings may be influenced by the extended regions of some QTLs and the regulatory effects of numerous genes, it prompted new reflections on evolutionary changes. The impact mechanism of evolutionary changes on organisms may not be solely focused on functionality. There is a potential for a domino effect, and future research aims to delve deeper into the specific causes of this phenomenon.

Figure 5.
QTL Analysis of gene families with significant expansion and contraction in warthog.
Table 3.
Positions of olfactory-related genes and QTLs in the expanded gene family in warthog.
4. Discussion
In this work, we utilized the genomic data from species including the Common warthog, Red River hog, Duroc pig, Luchuan pig, cow, sheep, sperm whale, and horse as a foundation for our comparative genomic analysis. From these data, we discerned 8868 single-copy orthologous genes. Subsequently, we examined the shared and unique gene families prevalent among the Suidae species. At the core of our findings is the intricate balance of gene expansion and contraction, which seems to be intertwined with a species’ survival and adaptation mechanisms. A salient observation from our analyses is the distinct evolutionary trajectories of warthogs and RRHs, despite their geographical proximities. This suggests that even in analogous environments, species might adopt disparate genomic strategies to ensure survival and reproductive success [75]. The phylogenetic analysis further emphasizes the unique evolutionary dynamics, as evidenced by the estimated divergence times between the species. The use of protein sequences in delineating the common ancestral lineage offers robust insights into the genomic history of these species [76,77]. The role of gene family expansion and contraction in adaptation becomes evident [29]. For instance, sensory genes related to olfaction and taste, including the OR and TASR2 gene families, have experienced notable expansion [58,59,61,62]. This suggests an evolutionary emphasis on heightened environmental sensitivity, likely facilitating efficient foraging and predator evasion in wild settings [78]. Conversely, the contraction observed in certain gene families highlights another aspect of the adaptive strategy. Genes such as Myh3, Cul3, Cycs, Eef1a1, and Eef1a2 play direct roles in survival and developmental processes [63,64,65,66,67,71]. Their contraction in warthogs could be a strategic move, minimizing or eliminating certain genetic elements that might be unfavorable for survival in their specific environment [79]. Furthermore, the association between these contracted gene families and phenotypic outcomes, particularly survival rates, reveals a deeper layer of genomic regulation. The involvement of genes such as Krt1, Lama2, Ntrk3, and Nup153 in various survival and developmental phenotypes indicates a broad genetic framework governing these processes [69,70,72,73,74]. These findings, when combined with the functional enrichment analysis, elucidate an evolutionary narrative where gene families might be selectively downsized to streamline the warthog’s survival mechanisms.
Our study also delves into the nexus between the changed gene families and QTLs. The potential overlap between genes and QTLs, especially those related to olfaction, and immune-related QTL regions, highlights the possibility of pleiotropic effects. Such effects suggest an evolutionary ‘domino effect’, where alterations in one genetic pathway might influence others, emphasizing the interwoven nature of genomic evolution [80,81,82].
5. Conclusions
In summary, our study underscores the complex interplay of gene family dynamics in adaptive evolution, spotlighting genes that potentially play pivotal roles in survival and environmental adaptation. Expansion provides the raw material for adapting to environmental changes or developing new biological functions. In contrast, contraction helps eliminate non-essential or detrimental genes, enhancing an organism’s adaptability and survival capabilities. Fundamentally, these factors collectively propel the intricate evolutionary journey of the warthog. Although we have clarified that warthogs have shown positive effects in aspects such as olfaction, hearing, immunity, and resistance to African Swine Fever during their adaptive evolutionary process, it is evident that the expansive field of evolutionary genetics still harbors many unresolved mysteries, inviting deeper investigations. In subsequent studies, to decipher genetic mechanisms driving the evolution of Suidae animals and traits of economic importance in domestic pigs, particularly disease resistance for the African Swine Fever virus, more extensive datasets and bioinformatics analyses, like case-control GWAS, selective sweep scanning, gene expression analysis, and single-cell omics, should be included. Additionally, employing CRISPR experiments for functional validation will be essential in advancing our understanding in this critical area.
Author Contributions
Conceptualization, G.Y. and X.L.; methodology, Q.B., Z.W. and S.H.; data curation, X.Q. and J.H.; writing—original draft preparation, X.Y.; writing—review and editing, X.Y. and G.Y.; visualization, X.Y.; formal analysis, X.Y., B.S. and Y.T. All authors have read and agreed to the published version of the manuscript.
Funding
This work was supported by the National Natural Science Foundation of China (32002150), the Basic and Applied Basic Research Foundation of Guangdong Province (2020B1515120053), the Shenzhen Science and Technology Innovation Commission (JCYJ20190813114401691), and the Central Government Guiding Funds for Local Science and Technology Development of China (He-Ke ZY220603).
Institutional Review Board Statement
Not applicable for studies not involving animals.
Informed Consent Statement
Not applicable.
Data Availability Statement
The genomic datasets analyzed for this study are sourced from recognized public repositories. Specifically, sequence data and related genomic information were retrieved from the National Center for Biotechnology Information (NCBI), Ensembl Genome Browser, China National Center for Bioinformation (CNCB), and China National GeneBank DataBase (CNSA). These datasets were accessed in compliance with the respective database guidelines and regulations for the use of public genomic data.
Conflicts of Interest
The authors declare that there are no conflicts of interest concerning the authorship or publication of this article.
References
- Ai, H.; Fang, X.; Yang, B.; Huang, Z.; Chen, H.; Mao, L.; Zhang, F.; Zhang, L.; Cui, L.; He, W.; et al. Adaptation and possible ancient interspecies introgression in pigs identified by whole-genome sequencing. Nat. Genet. 2015, 47, 217–225. [Google Scholar] [CrossRef]
- Wilson, D.E.; Reeder, D.M. Mammal Species of the World: A Taxonomic and Geographic Reference; JHU Press: Baltimore, MD, USA, 2005; Volume 1. [Google Scholar]
- McNaughton, S.A.; Georgiadis, N.J. Ecology of African grazing and browsing mammals. Annu. Rev. Ecol. Syst. 1986, 17, 39–66. [Google Scholar] [CrossRef]
- Wu, G.-S.; Pang, J.-F.; Zhang, Y.-P. Molecular phylogeny and phylogeography of Suidae. Zool. Res. 2006, 27, 197–201. [Google Scholar]
- Demuth, J.P.; Bie, T.D.; Stajich, J.E.; Cristianini, N.; Hahn, M.W. The evolution of mammalian gene families. PLoS ONE 2006, 1, e85. [Google Scholar] [CrossRef] [PubMed]
- de Jong, Y.A.; Butynski, T.M. Distribution, abundance, ecology, and conservation status of the desert warthog (Phacochoerus aethiopicus) in northern Kenya. Suiform Sound. 2014, 13, 48. [Google Scholar]
- Fine, P.V. Ecological and evolutionary drivers of geographic variation in species diversity. Annu. Rev. Ecol. Evol. Syst. 2015, 46, 369–392. [Google Scholar] [CrossRef]
- Macciotta, N.P.; Colli, L.; Cesarani, A.; Ajmone-Marsan, P.; Low, W.Y.; Tearle, R.; Williams, J.L. The distribution of runs of homozygosity in the genome of river and swamp buffaloes reveals a history of adaptation, migration and crossbred events. Genet. Sel. Evol. 2021, 53, 1–21. [Google Scholar] [CrossRef]
- Dutta, P.; Talenti, A.; Young, R.; Jayaraman, S.; Callaby, R.; Jadhav, S.K.; Dhanikachalam, V.; Manikandan, M.; Biswa, B.B.; Low, W.Y. Whole genome analysis of water buffalo and global cattle breeds highlights convergent signatures of domestication. Nat. Commun. 2020, 11, 4739. [Google Scholar] [CrossRef]
- Luo, X.; Zhou, Y.; Zhang, B.; Zhang, Y.; Wang, X.; Feng, T.; Li, Z.; Cui, K.; Wang, Z.; Luo, C. Understanding divergent domestication traits from the whole-genome sequencing of swamp-and river-buffalo populations. Natl. Sci. Rev. 2020, 7, 686–701. [Google Scholar] [CrossRef]
- Podgórski, T.; Borowik, T.; Łyjak, M.; Woźniakowski, G. Spatial epidemiology of African swine fever: Host, landscape and anthropogenic drivers of disease occurrence in wild boar. Prev. Vet. Med. 2020, 177, 104691. [Google Scholar] [CrossRef]
- Zheng, X.; Nie, S.; Feng, W.-H. Regulation of antiviral immune response by African swine fever virus (ASFV). Virol. Sin. 2022, 37, 157–167. [Google Scholar] [CrossRef]
- Njau, E.P.; Machuka, E.M.; Cleaveland, S.; Shirima, G.M.; Kusiluka, L.J.; Okoth, E.A.; Pelle, R. African swine fever virus (ASFV): Biology, genomics and genotypes circulating in sub-Saharan Africa. Viruses 2021, 13, 2285. [Google Scholar] [CrossRef] [PubMed]
- Jori, F.; Bastos, A.D. Role of wild suids in the epidemiology of African swine fever. EcoHealth 2009, 6, 296–310. [Google Scholar] [CrossRef] [PubMed]
- Manrubia, S.; Cuesta, J.A.; Aguirre, J.; Ahnert, S.E.; Altenberg, L.; Cano, A.V.; Catalán, P.; Diaz-Uriarte, R.; Elena, S.F.; García-Martín, J.A. From genotypes to organisms: State-of-the-art and perspectives of a cornerstone in evolutionary dynamics. Phys. Life Rev. 2021, 38, 55–106. [Google Scholar] [CrossRef] [PubMed]
- Chhaya, P. Nature of Relationship Between a Genotype and Phenotype. In The Topological Model of Genome and Evolution: Understanding the Origin and Nature of Life; Springer: Berlin/Heidelberg, Germany, 2023; pp. 81–137. [Google Scholar]
- Auboeuf, D. The Physics–Biology continuum challenges darwinism: Evolution is directed by the homeostasis-dependent bidirectional relation between genome and phenotype. Prog. Biophys. Mol. Biol. 2021, 167, 121–139. [Google Scholar] [CrossRef] [PubMed]
- Hill, M.S.; Vande Zande, P.; Wittkopp, P.J. Molecular and evolutionary processes generating variation in gene expression. Nat. Rev. Genet. 2021, 22, 203–215. [Google Scholar] [CrossRef] [PubMed]
- Lande, R.; Barrowclough, G.F. Effective population size, genetic variation, and their use in population management. Viable Popul. Conserv. 1987, 87, 87–124. [Google Scholar]
- Barrett, R.D.; Schluter, D. Adaptation from standing genetic variation. Trends Ecol. Evol. 2008, 23, 38–44. [Google Scholar] [CrossRef]
- Chen, K.; Baxter, T.; Muir, W.M.; Groenen, M.A.; Schook, L.B. Genetic resources, genome mapping and evolutionary genomics of the pig (Sus scrofa). Int. J. Biol. Sci. 2007, 3, 153. [Google Scholar] [CrossRef]
- Xie, H.-B.; Yan, C.; Adeola, A.C.; Wang, K.; Huang, C.-P.; Xu, M.-M.; Qiu, Q.; Yin, X.; Fan, C.-Y.; Ma, Y.-F. African suid genomes provide insights into the local adaptation to diverse African environments. Mol. Biol. Evol. 2022, 39, msac256. [Google Scholar] [CrossRef]
- Butynski, T.M.; Jong, Y. Warthog Phacochoerus africanus. In Ecology, Conservation and Management of Wild Pigs and Peccaries; Cambridge University Press: Cambridge, UK, 2017; pp. 85–100. [Google Scholar] [CrossRef]
- Holland, P.W.; Booth, H.A.F.; Bruford, E.A. Classification and nomenclature of all human homeobox genes. BMC Biol. 2007, 5, 47. [Google Scholar] [CrossRef] [PubMed]
- Magadum, S.; Banerjee, U.; Murugan, P.; Gangapur, D.; Ravikesavan, R. Gene duplication as a major force in evolution. J. Genet. 2013, 92, 155–161. [Google Scholar] [CrossRef] [PubMed]
- Green, S.A.; Simoes-Costa, M.; Bronner, M.E. Evolution of vertebrates as viewed from the crest. Nature 2015, 520, 474–482. [Google Scholar] [CrossRef] [PubMed]
- Hrycaj, S.M.; Wellik, D.M. HOX genes and evolution. F1000Research 2016, 5, 859. [Google Scholar] [CrossRef] [PubMed]
- Prince, V.E.; Pickett, F.B. Splitting pairs: The diverging fates of duplicated genes. Nat. Rev. Genet. 2002, 3, 827–837. [Google Scholar] [CrossRef]
- Innan, H.; Kondrashov, F. The evolution of gene duplications: Classifying and distinguishing between models. Nat. Rev. Genet. 2010, 11, 97–108. [Google Scholar] [CrossRef]
- Bear, D.M.; Lassance, J.-M.; Hoekstra, H.E.; Datta, S.R. The evolving neural and genetic architecture of vertebrate olfaction. Curr. Biol. 2016, 26, R1039–R1049. [Google Scholar] [CrossRef]
- Mombaerts, P. The human repertoire of odorant receptor genes and pseudogenes. Annu. Rev. Genom. Hum. Genet. 2001, 2, 493–510. [Google Scholar] [CrossRef]
- Young, J.M.; Friedman, C.; Williams, E.M.; Ross, J.A.; Tonnes-Priddy, L.; Trask, B.J. Different evolutionary processes shaped the mouse and human olfactory receptor gene families. Hum. Mol. Genet. 2002, 11, 535–546. [Google Scholar] [CrossRef] [PubMed]
- Sharma, A.; Kumar, R.; Aier, I.; Semwal, R.; Tyagi, P.; Varadwaj, P. Sense of smell: Structural, functional, mechanistic advancements and challenges in human olfactory research. Curr. Neuropharmacol. 2019, 17, 891–911. [Google Scholar] [CrossRef]
- Liu, Y.; Fu, Y.; Yang, Y.; Yi, G.; Lian, J.; Xie, B.; Yao, Y.; Chen, M.; Niu, Y.; Liu, L. Integration of multi-omics data reveals cis-regulatory variants that are associated with phenotypic differentiation of eastern from western pigs. Genet. Sel. Evol. 2022, 54, 62. [Google Scholar] [CrossRef] [PubMed]
- Thewissen, J.G.; Cooper, L.N.; Clementz, M.T.; Bajpai, S.; Tiwari, B.N. Whales originated from aquatic artiodactyls in the Eocene epoch of India. Nature 2007, 450, 1190–1194. [Google Scholar] [CrossRef] [PubMed]
- Chen, L.; Qiu, Q.; Jiang, Y.; Wang, K.; Lin, Z.; Li, Z.; Bibi, F.; Yang, Y.; Wang, J.; Nie, W. Large-scale ruminant genome sequencing provides insights into their evolution and distinct traits. Science 2019, 364, eaav6202. [Google Scholar] [CrossRef]
- Montgelard, C.; Catzeflis, F.M.; Douzery, E. Phylogenetic relationships of artiodactyls and cetaceans as deduced from the comparison of cytochrome b and 12S rRNA mitochondrial sequences. Mol. Biol. Evol. 1997, 14, 550–559. [Google Scholar] [CrossRef] [PubMed]
- Emms, D.; Kelly, S. STAG: Species tree inference from all genes. BioRxiv 2018, 267914. [Google Scholar] [CrossRef]
- Emms, D.M.; Kelly, S. STRIDE: Species tree root inference from gene duplication events. Mol. Biol. Evol. 2017, 34, 3267–3278. [Google Scholar] [CrossRef]
- Emms, D.M.; Kelly, S. OrthoFinder: Solving fundamental biases in whole genome comparisons dramatically improves orthogroup inference accuracy. Genome Biol. 2015, 16, 157. [Google Scholar] [CrossRef] [PubMed]
- Edgar, R.C. MUSCLE: Multiple sequence alignment with high accuracy and high throughput. Nucleic Acids Res. 2004, 32, 1792–1797. [Google Scholar] [CrossRef]
- Capella-Gutiérrez, S.; Silla-Martínez, J.M.; Gabaldón, T. trimAl: A tool for automated alignment trimming in large-scale phylogenetic analyses. Bioinformatics 2009, 25, 1972–1973. [Google Scholar] [CrossRef]
- Stamatakis, A. RAxML version 8: A tool for phylogenetic analysis and post-analysis of large phylogenies. Bioinformatics 2014, 30, 1312–1313. [Google Scholar] [CrossRef]
- Whelan, S.; Goldman, N. A general empirical model of protein evolution derived from multiple protein families using a maximum-likelihood approach. Mol. Biol. Evol. 2001, 18, 691–699. [Google Scholar] [CrossRef] [PubMed]
- Zhang, J.; Nei, M. Accuracies of ancestral amino acid sequences inferred by the parsimony, likelihood, and distance methods. J. Mol. Evol. 1997, 44, S139–S146. [Google Scholar] [CrossRef]
- Jones, D.T.; Taylor, W.R.; Thornton, J.M. The rapid generation of mutation data matrices from protein sequences. Bioinformatics 1992, 8, 275–282. [Google Scholar] [CrossRef] [PubMed]
- Zhang, Z.; Xiao, J.; Wu, J.; Zhang, H.; Liu, G.; Wang, X.; Dai, L. ParaAT: A parallel tool for constructing multiple protein-coding DNA alignments. Biochem. Biophys. Res. Commun. 2012, 419, 779–781. [Google Scholar] [CrossRef] [PubMed]
- Yang, Z. PAML 4: Phylogenetic analysis by maximum likelihood. Mol. Biol. Evol. 2007, 24, 1586–1591. [Google Scholar] [CrossRef] [PubMed]
- De Bie, T.; Cristianini, N.; Demuth, J.P.; Hahn, M.W. CAFE: A computational tool for the study of gene family evolution. Bioinformatics 2006, 22, 1269–1271. [Google Scholar] [CrossRef]
- Mendes, F.K.; Vanderpool, D.; Fulton, B.; Hahn, M.W. CAFE 5 models variation in evolutionary rates among gene families. Bioinformatics 2020, 36, 5516–5518. [Google Scholar] [CrossRef]
- Raudvere, U.; Kolberg, L.; Kuzmin, I.; Arak, T.; Adler, P.; Peterson, H.; Vilo, J. g: Profiler: A web server for functional enrichment analysis and conversions of gene lists (2019 update). Nucleic Acids Res. 2019, 47, W191–W198. [Google Scholar] [CrossRef]
- Bult, C.J.; Blake, J.A.; Smith, C.L.; Kadin, J.A.; Richardson, J.E. Mouse genome database (MGD) 2019. Nucleic Acids Res. 2019, 47, D801–D806. [Google Scholar] [CrossRef]
- Hu, Z.-L.; Park, C.A.; Wu, X.-L.; Reecy, J.M. Animal QTLdb: An improved database tool for livestock animal QTL/association data dissemination in the post-genome era. Nucleic Acids Res. 2013, 41, D871–D879. [Google Scholar] [CrossRef]
- Leslie Jr, D.M.; Huffman, B.A. Potamochoerus porcus (Artiodactyla: Suidae). Mamm. Species 2015, 47, 15–31. [Google Scholar] [CrossRef]
- Cifelli, R. Patterns of evolution among the Artiodacyla and Perissodactyla (Mammalia). Evolution 1981, 35, 433–440. [Google Scholar] [CrossRef] [PubMed]
- Feng, W.; Zhou, L.; Zhao, P.; Du, H.; Diao, C.; Zhang, Y.; Liu, Z.; Jin, W.; Yu, J.; Han, J. Comparative genomic analysis of warthog and Sus scrofa identifies adaptive genes associated with African swine fever. Biology 2023, 12, 1001. [Google Scholar] [CrossRef]
- Shimamura, M.; Yasue, H.; Ohshima, K.; Abe, H.; Kato, H.; Kishiro, T.; Goto, M.; Munechika, I.; Okada, N. Molecular evidence from retroposons that whales form a clade within even-toed ungulates. Nature 1997, 388, 666–670. [Google Scholar] [CrossRef]
- Hughes, G.M.; Boston, E.S.; Finarelli, J.A.; Murphy, W.J.; Higgins, D.G.; Teeling, E.C. The birth and death of olfactory receptor gene families in mammalian niche adaptation. Mol. Biol. Evol. 2018, 35, 1390–1406. [Google Scholar] [CrossRef] [PubMed]
- Niimura, Y. Olfactory receptor multigene family in vertebrates: From the viewpoint of evolutionary genomics. Curr. Genom. 2012, 13, 103–114. [Google Scholar] [CrossRef] [PubMed]
- Bock, K.W. The UDP-glycosyltransferase (UGT) superfamily expressed in humans, insects and plants: Animal⿿ plant arms-race and co-evolution. Biochem. Pharmacol. 2016, 99, 11–17. [Google Scholar] [CrossRef]
- Soares, S.; Kohl, S.; Thalmann, S.; Mateus, N.; Meyerhof, W.; De Freitas, V. Different phenolic compounds activate distinct human bitter taste receptors. J. Agric. Food Chem. 2013, 61, 1525–1533. [Google Scholar] [CrossRef]
- Beckett, E.L.; Martin, C.; Yates, Z.; Veysey, M.; Duesing, K.; Lucock, M. Bitter taste genetics–the relationship to tasting, liking, consumption and health. Food Funct. 2014, 5, 3040–3054. [Google Scholar] [CrossRef]
- Li, X.; Yang, K.-B.; Chen, W.; Mai, J.; Wu, X.-Q.; Sun, T.; Wu, R.-Y.; Jiao, L.; Li, D.-D.; Ji, J. CUL3 (cullin 3)-mediated ubiquitination and degradation of BECN1 (beclin 1) inhibit autophagy and promote tumor progression. Autophagy 2021, 17, 4323–4340. [Google Scholar] [CrossRef]
- Andérica-Romero, A.C.; González-Herrera, I.G.; Santamaría, A.; Pedraza-Chaverri, J. Cullin 3 as a novel target in diverse pathologies. Redox Biol. 2013, 1, 366–372. [Google Scholar] [CrossRef] [PubMed]
- Kulikov, A.; Shilov, E.; Mufazalov, I.; Gogvadze, V.; Nedospasov, S.; Zhivotovsky, B. Cytochrome c: The Achilles’ heel in apoptosis. Cell. Mol. Life Sci. 2012, 69, 1787–1797. [Google Scholar] [CrossRef] [PubMed]
- Abbas, W.; Kumar, A.; Herbein, G. The eEF1A proteins: At the crossroads of oncogenesis, apoptosis, and viral infections. Front. Oncol. 2015, 5, 75. [Google Scholar] [CrossRef] [PubMed]
- Xu, C.; Hu, D.-m.; Zhu, Q. eEF1A2 promotes cell migration, invasion and metastasis in pancreatic cancer by upregulating MMP-9 expression through Akt activation. Clin. Exp. Metastasis 2013, 30, 933–944. [Google Scholar] [CrossRef]
- D’Alessandro, A.; Righetti, P.G.; Zolla, L. The red blood cell proteome and interactome: An update. J. Proteome Res. 2010, 9, 144–163. [Google Scholar] [CrossRef]
- Roth, W.; Kumar, V.; Beer, H.-D.; Richter, M.; Wohlenberg, C.; Reuter, U.; Thiering, S.; Staratschek-Jox, A.; Hofmann, A.; Kreusch, F. Keratin 1 maintains skin integrity and participates in an inflammatory network in skin through interleukin-18. J. Cell Sci. 2012, 125, 5269–5279. [Google Scholar] [PubMed]
- Oliveira, J.; Gruber, A.; Cardoso, M.; Taipa, R.; Fineza, I.; Gonçalves, A.; Laner, A.; Winder, T.L.; Schroeder, J.; Rath, J. LAMA2 gene mutation update: Toward a more comprehensive picture of the laminin-α2 variome and its related phenotypes. Hum. Mutat. 2018, 39, 1314–1337. [Google Scholar] [CrossRef] [PubMed]
- Cho, I.-C.; Park, H.-B.; Ahn, J.S.; Han, S.-H.; Lee, J.-B.; Lim, H.-T.; Yoo, C.-K.; Jung, E.-J.; Kim, D.-H.; Sun, W.-S. A functional regulatory variant of MYH3 influences muscle fiber-type composition and intramuscular fat content in pigs. PLoS Genet. 2019, 15, e1008279. [Google Scholar] [CrossRef]
- Roberts, K.G.; Janke, L.J.; Zhao, Y.; Seth, A.; Ma, J.; Finkelstein, D.; Smith, S.; Ebata, K.; Tuch, B.B.; Hunger, S.P. ETV6-NTRK3 induces aggressive acute lymphoblastic leukemia highly sensitive to selective TRK inhibition. Blood J. Am. Soc. Hematol. 2018, 132, 861–865. [Google Scholar] [CrossRef]
- Al-Haboubi, T.; Shumaker, D.K.; Köser, J.; Wehnert, M.; Fahrenkrog, B. Distinct association of the nuclear pore protein Nup153 with A-and B-type lamins. Nucleus 2011, 2, 500–509. [Google Scholar] [CrossRef]
- Funakoshi, T.; Clever, M.; Watanabe, A.; Imamoto, N. Localization of Pom121 to the inner nuclear membrane is required for an early step of interphase nuclear pore complex assembly. Mol. Biol. Cell 2011, 22, 1058–1069. [Google Scholar] [CrossRef] [PubMed]
- Losos, J.B. Convergence, adaptation, and constraint. Evolution 2011, 65, 1827–1840. [Google Scholar] [CrossRef]
- Yang, Z. Computational Molecular Evolution; OUP Oxford: Oxford, UK, 2006. [Google Scholar]
- Nei, M.; Kumar, S. Molecular Evolution and Phylogenetics; Oxford University Press: New York, NY, USA, 2000. [Google Scholar]
- Futuyma, D.J.; Kirkpatrick, M. Evolution; Sinauer Associates, Inc.: Sunderland, MA, USA, 2013. [Google Scholar]
- Nowak, M.A.; Boerlijst, M.C.; Cooke, J.; Smith, J.M. Evolution of genetic redundancy. Nature 1997, 388, 167–171. [Google Scholar] [CrossRef] [PubMed]
- Wagner, A. The molecular origins of evolutionary innovations. Trends Genet. 2011, 27, 397–410. [Google Scholar] [CrossRef]
- Moore, J.H.; Williams, S.M. Traversing the conceptual divide between biological and statistical epistasis: Systems biology and a more modern synthesis. Bioessays 2005, 27, 637–646. [Google Scholar] [CrossRef]
- Masel, J.; Siegal, M.L. Robustness: Mechanisms and consequences. Trends Genet. 2009, 25, 395–403. [Google Scholar] [CrossRef]

Disclaimer/Publisher’s Note: The statements, opinions and data contained in all publications are solely those of the individual author(s) and contributor(s) and not of MDPI and/or the editor(s). MDPI and/or the editor(s) disclaim responsibility for any injury to people or property resulting from any ideas, methods, instructions or products referred to in the content. |
© 2024 by the authors. Licensee MDPI, Basel, Switzerland. This article is an open access article distributed under the terms and conditions of the Creative Commons Attribution (CC BY) license (https://creativecommons.org/licenses/by/4.0/).