Article

Comparative Analysis of Chloroplast Genomes of “Tiantai Wu-Yao” (Lindera aggregata) and Taxa of the Same Genus and Different Genera

1
Zhejiang Provincial Key Laboratory of Plant Evolutionary Ecology and Conservation, College of Life Sciences, Taizhou University, Taizhou 318000, China
2
Institute of Horticulture, Taizhou Academy of Agricultural Sciences, Linhai 317000, China
3
Institute of Horticulture, Zhejiang Academy of Agricultural Sciences, Hangzhou 310021, China
*
Author to whom correspondence should be addressed.
Genes 2024, 15(3), 263; https://doi.org/10.3390/genes15030263
Submission received: 29 January 2024 / Revised: 16 February 2024 / Accepted: 18 February 2024 / Published: 20 February 2024
(This article belongs to the Section Plant Genetics and Genomics)

Abstract

:
Lindera aggregata is a species of the Lauraceae family, which has important medicinal, economic and ornamental values. In this study, we sequenced, assembled and annotated the chloroplast genome of L. aggregata and reannotated and corrected eight unverified annotations in the same genus. The chloroplast genomes taxa from Lindera and from different genera of Lauraceae were compared and analyzed, and their phylogenetic relationship and divergence time were speculated. All the 36 chloroplast genomes had typical quadripartite structures that ranged from 150,749 to 154,736 bp in total length. These genomes encoded 111–112 unique genes, including 78–79 protein-coding genes, 29–30 tRNA and 4 rRNA. Furthermore, there were 78–97 SSRs loci in these genomes, in which mononucleotide repeats were the most abundant; there were 24–49 interspersed repeats, and forward repeat types were the most frequent. The codon bias patterns of all species tended to use codons ending with A or U. Five and six highly variable regions were identified within genus and between genera, respectively, and three common regions (ycf1, ndhF-rpl32 and rpl32-trnL) were identified, which can be used as important DNA markers for phylogeny and species identification. According to the evaluation of the Ka/Ks ratio, most of the genes were under purifying selection, and only 10 genes were under positive selection. Finally, through the construction of the evolutionary tree of 39 chloroplast genomes, the phylogenetic relationship of Lauraceae was clarified and the evolutionary relationship of Lindera was revealed. The species of genus Lindera experienced rapid adaptive radiation from Miocene to Pleistocene. The results provided valuable insights for the study of chloroplast genomes in the Lauraceae family, especially in the genus Lindera.

1. Introduction

Lauraceae is one of the most important woody families in the flora, with about 50 genera and 3500 species [1,2]. The genus Lindera is one of the most core genera, with approximately 100 species distributed in tropical, subtropical and temperate regions of Asia and the Midwest of the USA [3]. In China, there are more than 40 species, accounting for 46% of the total genus [4]. Most of the plants of the genus Lindera have a special smell and can be used for cooking and medical purposes [4,5]. Among them, L. aggregata is a kind of plant with great medicinal value in this genus, which was widely used in the traditional medicine industry as early as 2000 years ago. The dry tuberous root of L. aggregata is the main part of the medicine [6], and it is also called “Wu-Yao” in Chinese because the root is black–brown. L. aggregata is mainly produced in eastern, central, southern and southwestern blocks of China, such as in Zhejiang, Jiangxi, the Hunan provinces and other places. Among them, the L. aggregata produced in Zhejiang Tiantai is of the best quality, which is also known as “Tiantai Wu-Yao”. It is the authentic origin of L. aggregata since the Song Dynasty [4]. Furthermore, L. aggregata contains a large number of isoquinoline alkaloids [7], flavonoids [8], sesquiterpene lactones [9] and polyphenols [10], with anti-cancer, anti-inflammatory, antibacterial, antioxidant and other activities [6,11,12,13], that can be used to treat chest pain, abdominal pain, inflammation, frequent urination, dysmenorrhea, rheumatic diseases and other diseases [6,14]. According to historical records, during the Tang Dynasty in China, Master Jianzhen, a monk, cured the disease of the Empress Dowager Guangming of Japan with L. aggregata and it was regarded as the “Elixir of Life”. Although its medicinal value has been fully studied and recognized, there are few studies on its genetic diversity and phylogeny.
The chloroplast is the place in which photosynthesis occurs, and it has a relatively independent genetic system [15]. The chloroplast genomes of angiosperms are usually 120–180 kb in size and have highly conserved circular quadripartite structures. Two inverted repeats (IRs) separate large single copy (LSC) and small single copy (SSC) regions [16]. The differences among chloroplast genomes of different species are mainly reflected in the length and direction of IR regions. Chloroplast genes encode 100–130 genes, which are usually divided into four categories: (1) self-replication genes, which are related to transcription and translation; (2) photosynthesis genes, which encode photosynthesis-related proteins; (3) other genes, related to the synthesis of amino acids, fatty acids and other substances and (4) unknown functional genes. Among them, photosynthesis-related genes are distributed in the LSC region and SSC region. Although the chloroplast genome structure is relatively conservative, gene transfer, recombination and transposition events may occur, and there may be hot spots of mutation [17]. At present, the chloroplast genomes of several species of the genus Lindera have been reported [18,19,20]. The length of these complete genomes ranges from 152,478 to 153,679 bp. It is reported that some gene regions show a high level of variation in the DNA markers and intra-genus studies of the Lauraceae family, such as eight gene spacers (accd-psaI, ndhC-trnV, ndhF-rp32, psbm-trnD, rp32-trnL, rp14-rps8, rps3-rps19 and rps16-trnQ), three gene fragments (rbc1, ycf1 and ycf2) and three introns (clpp, ndhA and trnG-UCC) [21,22,23,24,25,26]. These complete chloroplast genome sequences are of great value in understanding the phylogenetic relationship and species evolution among similar groups of plants [16]. The emergence of a new generation of high-throughput sequencing technology greatly reduces the sequencing prices and improves the sequencing throughput, which makes it possible for large-scale chloroplast genome sequencing. The study of phylogenetic genomics based on high-throughput sequencing has become an important tool for a comprehensive understanding of biological evolution [18] and has been widely used in molecular breeding, phylogeny, endangered species protection and other fields.
Up to now, the research on L. aggregata is mainly focused on its chemical composition and pharmacological action [4,5], but there are few studies on its genetic diversity, evolution and phylogeny. Although the chloroplast genome of L. aggregata has been reported, the samples collected are mainly from Zhejiang Hangzhou or Yunnan [20,27], and the trueborn origin region (Zhejiang Tiantai) has not been reported, and the previous research content is also only a simple characteristic description. It is not included in Lauraceae or Lindera as a whole for comparison, and the chloroplast genome information is not fully exploited. Furthermore, Laurus, Lindera and Litsea are closely related, and they all have similar morphological characteristics, such as dioecious, umbels wrapped in a large involucre, anthers all introverted and two stalked glands in the third round [28,29]. Especially in the genus Lindera, the morphological characteristics of different species are very similar, which may lead to difficulties in identification and misconstruction of phylogenetic relationships. Therefore, the phylogenetic relationship and genomic information of L. aggregata in the genus Lindera and among different genera of Lauraceae still need to be further improved.
In this study, we sequenced, assembled and annotated the chloroplast genome of L. aggregata and re-annotated to modify a large number of these taxa’s unverified chloroplast genomes in the Lauraceae family. The characteristics of their chloroplast genomes were compared and analyzed from within genus and between genera; their chloroplast genome variations were quantified and candidate molecular markers were obtained. The phylogenetic relationship of Lauraceae was discussed and the divergence time was estimated, which laid a foundation for further study of genetic diversity and the evolutionary relationship of Lauraceae, especially in the genus Lindera.

2. Materials & Methods

2.1. Sample Collection, DNA Extraction and Sequencing

The samples of L. aggregata (Wu-Yao) in this experiment were provided by the Zhejiang Hongshiliang Group Tiantaishan Wuyao Co. (Taizhou, China). Fresh leaves were collected, quick-frozen with liquid nitrogen and brought back to the laboratory for extraction of total genomic DNA using the modified CTAB technique [30]. The extracted DNA samples were preliminarily examined with a 1% agarose gel, and NanoDrop was used to test the concentration and purity of the extracted DNA. Qualified DNA samples were sent to Novogene Biotechnology Co., Ltd. (Beijing, China). for double-end sequencing via the Illumina HiSeq 6000 platform with a sequence read length of 150 bp. The raw reads obtained were preprocessed with Trimmomatic v0.39 software [31], including removing the reads with adapters, with a proportion of N greater than 10% and of low-quality. The clean reads were then evaluated for treatment using FastQC v0.11.7 software. Moreover, the chloroplast genomes of samples related to L. aggregata were downloaded from the NCBI database for subsequent comparative analyses, including 26 species of the Lindera genus and 9 species of different genera in the Lauraceae family. The detailed information was recorded in Table S1.

2.2. Assembly and Annotation of the Chloroplast Genomes

First, the complete chloroplast genome sequence of L. aggregata was assembled with Getorganelle v1.7.7 [32] software based on clean reads using the chloroplast genome of L. glauca as the reference sequence. Then, CPGAVAS2 [33] and GeSeq [34] online databases were utilized to obtain the annotation information of the assembled chloroplast genome, and the annotation results were imported into Geneious Prime v11.0.18 [35] software for manual correction to obtain accurate annotation information. Finally, CHLOROPLOT [36] online tool (https://irscope.shinyapps.io/Chloroplot/ (accessed on 20 January 2024)) was used to visualize the mapping of the chloroplast genome and submit the genome sequence to the NCBI database to obtain the accession number. Furthermore, due to the large amount of unverified information in the chloroplast genomes of the downloaded species, the chloroplast genomes were also re-annotated with the same method described above in order to carry out subsequent comparative analyses.

2.3. Characteristics Analysis of Chloroplast Genomes

The length of the total chloroplast genome sequence, LSCs, SSCs and IRs, and GC content of the chloroplast genomes of each species were obtained using the CPGView [37] online tool (http://47.96.249.172:16085/cpgview/home (accessed on 20 January 2024)), and the number of protein-coding genes (PCGs), tRNAs, and rRNAs were counted.
Relative synonymous codon usage (RSCU) values were calculated for PCGs in the chloroplast genomes using CodonW v1.4.2 software. Three stop codons (TAA, TAG and TGA) without degeneracy were deleted prior to analysis. An RSCU value > 1 represents a preference for the use of the codon, RSCU = 1 indicates that there is no usage preference for the codon and RSCU < 1 indicates that the codon is used less frequently. This codon preference is considered to be the result of a combination of natural selection, species mutation and genetic drift [38].
The simple sequence repeats (SSRs) in the chloroplast genomes were identified using the microsatellite online identification tool MISA-web [39]. The following parameter settings were used: the minimum number of repeats for the mononucleotide (Mono-) repeats, dinucleotide (Di-) repeats, trinucleotide (Tri-) repeats, tetranucleotide (Tetra-) repeats, pentanucleotide (Penta-) repeats and hexanucleotide (Hexa-) repeats were set to 10, 5, 4, 3, 3 and 3, respectively. Furthermore, to detect forward repeats (F-), reverse repeats (R-), palindromic repeats (P-) and complementary repeats (C-) in the chloroplast genome sequences, we searched the chloroplast genomes of all species using the online tool REPuter (https://bibiserv.cebitec.uni-bielefeld.de/reputer/ (accessed on 20 January 2024)) [40] with the parameters set as follows: minimum repeat length greater than 30 bp, maximum repeat length of 300 bp and Hamming distance of 3.

2.4. Comparative Genomics Analysis of the Chloroplast Genome

Diversity assessment of the chloroplast genomes of species among different genera of Lauraceae and within the genus Lindera was carried out using the mVISTA [41] online tool (https://genome.lbl.gov/vista/mvista/submit.shtml (accessed on 20 January 2024)), with the mode selection of shuffle-LAGAN. L. aggregata was used as a reference sequence to elucidate the level of sequence divergence.
PhyloSuit v1.2.3 software [42] was used to extract PCGs from the chloroplast genomes. The extracted PCGs were first compared using MAFFT v7.427 software [43]. Then, the KaKs_Calculator 2.0 tool [44] was used to calculate the ratio of nonsynonymous (Ka) to synonymous (Ks) substitutions (Ka/Ks), with the default model (MLWL).
The IRScope online program [45] was used to visualize the connectivity sites of the regions and to detect the expansion and contraction of the chloroplast genome boundary regions between IRs, SSCs and LSCs.
The Mauve v2.4.0 program in the Geneious Prime software was used for rearrangement and structural comparison of chloroplast genomes to analyze the presence of missing genes, duplicates, rearrangements or translocations, which can probe the structural variability characterizing the chloroplast genomes of Lauraceae plants. Moreover, nucleotide diversity (Pi) values were calculated using the DnaSP v6.12.03 software [46], with a sliding window length and step size of 600 bp and 200 bp, respectively.

2.5. Phylogenetic Analysis

A phylogenetic tree was constructed based on the sequenced and assembled chloroplast genomes of L. aggregata in this study, as well as all the published chloroplast genomes of the Lindera genus on NCBI (total of 26) and 12 chloroplast genomes of different genera of Lauraceae, with C. camphora, C. parthenoxylon, C. glanduliferum and C. insularimontanum as outgroups. The chloroplast genome information was detailed in Table S1.
Firstly, the chloroplast genome sequences of all species were imported into PhyloSuit v1.2.3 software to extract the common PCGs. Then the MAFFT module was used to perform multiple sequences alignment and trimmed using the trimAl v1.2 software [47]. Then, the aligned and trimmed sequences were concatenated via a concatenate module to obtain a dataset of 39 concatenated Lauraceae common PCGs. Finally, phylogenetic tree construction was performed using the maximum likelihood (ML) method and Bayesian inference (BI) method, respectively. The ML trees were constructed using IQ-TREE v2.2.0.3 software [48], 5000 ultra-fast bootstraps were set up and the optimal model was obtained via the ModelFinder program [49]. The BI tree was constructed using MrBayes v3.2.7a software [50], with the model selected as GTR+I. MCMC was run for 5 million generations, with sampling every 1000 generations, with the top 25% of the trees aged and discarded and the rest constructed as a 50% consistent tree; convergence was determined by keeping the average standard deviation of the crossover frequencies < 0.01. Finally, the topologies of the phylogenetic trees were visualized using the Chiplot online tool [51].

2.6. Divergence Time Estimated

The divergence time within the genus Lindera of Lauraceae was estimated with BEAST v2.7.6 software [52] and with reference to previous studies [53,54]; the similar species (Liriodendron chinense and Piper nigrum) of different families were taken as outgroups. The divergence time between Lauraceae and Magnoliaceae (approximately 124 Mya) and Magnoliaceae and Piperaceae (approximately 142.8 Mya) were found through the Timetree (http://www.timetree.org/ (accessed on 20 January 2024)) online database, and these were used as the time correction point of the evolutionary tree. The evolutionary tree was constructed with a GTR model and strict clock. The total operating generation was set to 10,000,000, and sampling was carried out for every 1000 generations. After operation, the stability of the results was evaluated with Tracer v1.7.2 software [55]; the ESS values were all more than 200, indicating that the results converged and the evolutionary tree was reliable. Using TreeAnnotator v2.6.7 software, after burning 50% of the total generations, a phylogenetic tree containing the time of species differentiation was generated and visualized using Chiplot online tool (https://www.chiplot.online/ (accessed on 20 January 2024)) [51].

3. Results

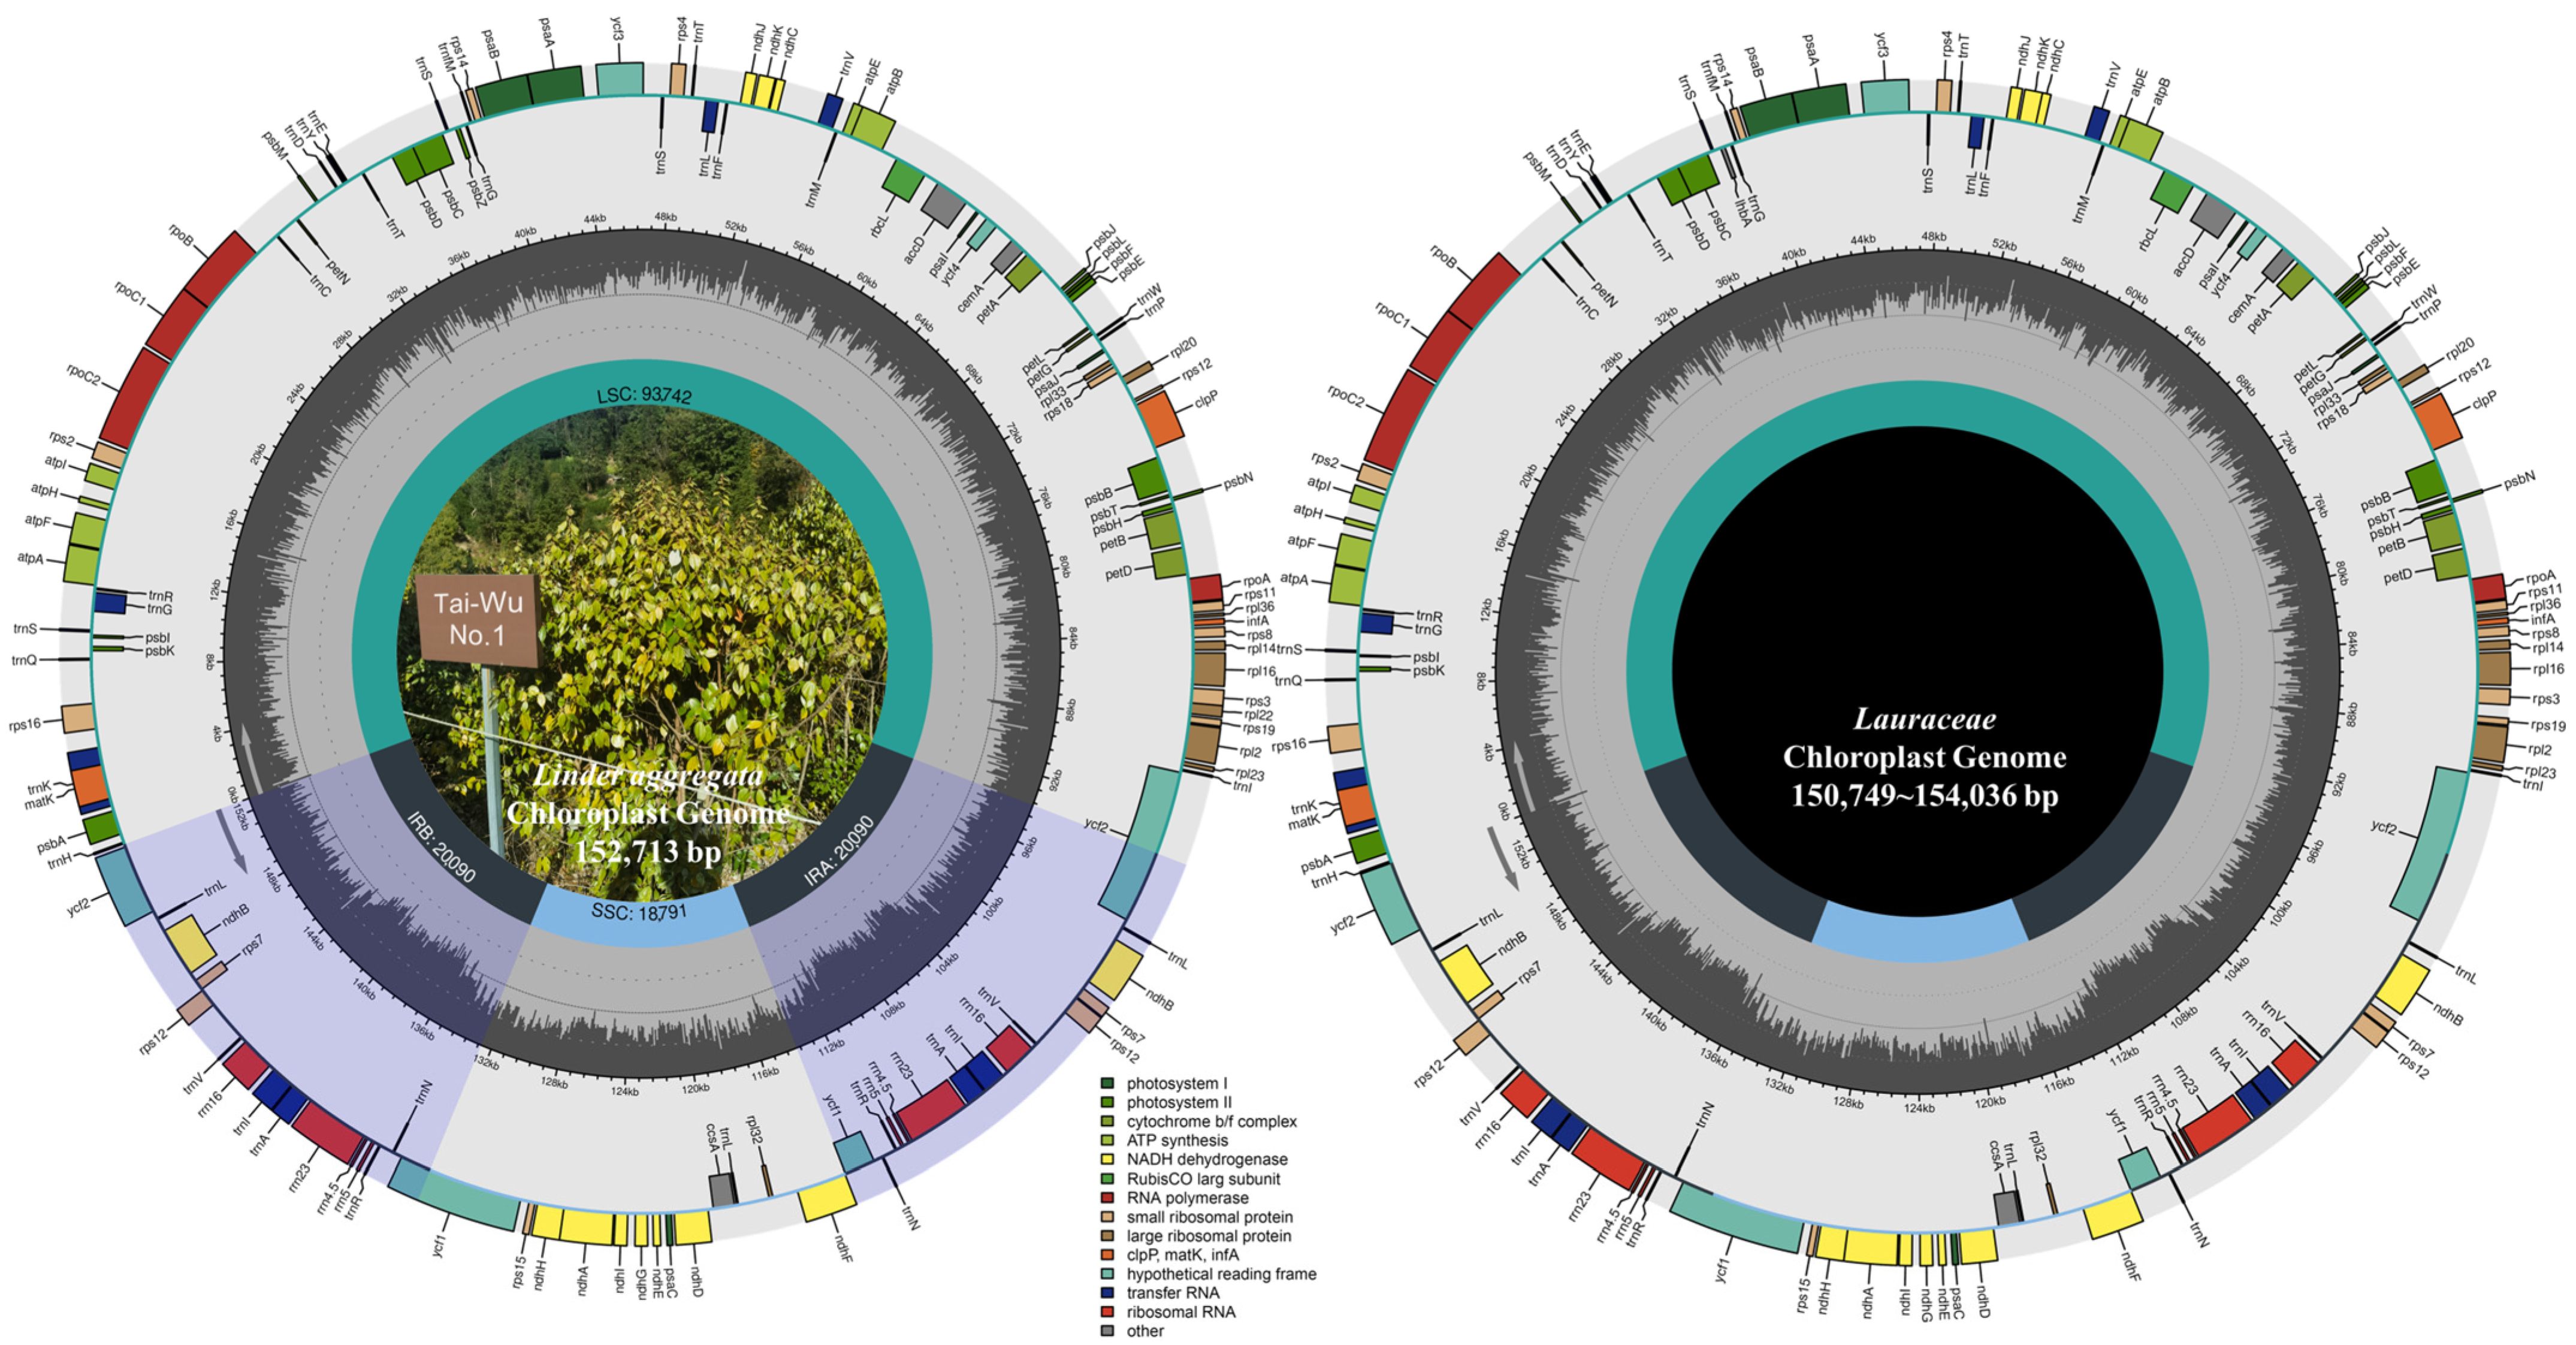
3.1. Analysis of Characteristics of Chloroplast Genomes

The chloroplast sequence of L. aggregata was preliminarily annotated after assembly, and manually corrected with the most similar sequences as references (Figure 1). At the same time, eight unverified chloroplast genomes (Table S1) in the NCBI database were re-annotated, and the remaining sequences were uniformly corrected to avoid differences in sequence annotation caused by humans. In order to compare the differences between the plants of the same genus and the plants of different genera in Lauraceae, 36 plants were divided into two groups for comparative analysis. Within the Lindera genus, the length of chloroplast genomes ranged from 152,478 bp (L. benzoin) to 153,679 bp (L. pulcherrima var. attenuata), LSC length ranged from 93,145 to 93,921 bp, the length of SSC was 18,791–19,800 bp, the length of IRs was 20,047–20,474 bp and the total GC content was 39.1–39.2%. Among the genera, the length of chloroplast genomes ranged from 150,749 bp (Nectandra angustifolia) to 154,036 bp (Neolitsea confertfolia), the length of LSC was 93,381–93,795 bp and the length of SSC was 18,382–18,969 bp; IRs length was 19,292–20,781 bp, and the total GC content was the same as above (Table S2). In general, the chloroplast genomes of all species showed typical quadripartite structures (Figure 1), with little change in overall GC content. Furthermore, whereas overall and IRs length differences were greater between genera than within genera, LSC and SSC differences were greater within genera than among genera.
The majority of Lauraceae species contained 112 unique genes, 78 protein coding genes (PCGs), 30 tRNA genes and 4 rRNA genes (Table S2). Whereas a few species (L. glauca, L. erythrocarpa, L. latifolia, etc.) lacked trnG-GCC genes (Table S3). Moreover, Cinnamomum glanduliferum and N. angustifolia had one extra ycf68 gene. All these genes were divided into four categories after functional annotation: photosynthesis, self-replication, other genes and unknown function genes. Among these genes, nine PCGs (ndhA, ndhB, petB, petD, atpF, rpl16, rpl2, rps16 and rpoC1) and six tRNA genes (trnA-UGC, trnG-UCC, trnI-GAU, trnK-UUU, trnL-UAA and trnV-UAC) had one intron, whereas clpP, rps12 and ycf3 had two introns. Moreover, 14 genes (ndhB, rps12, rps7, rrn16S, rrn23S, rrn4.5S, rrn5S, trnA-UGC, trnI-GAU, trnL-CAA, trnN-GUU, trnR-ACG, trnV-GAC, ycf1 and ycf2) had two copies, and one copy of ycf1 and ycf2 genes, as well as rpl2, were pseudogenes (Table S3).

3.2. Expansion/Contraction Analysis of the Boundary

In order to detect the differences of chloroplast genome sequences between L. aggregata and species of the same genus and different genera, we used IRscope v0.1 software to visualize their partition length and boundary information (Figure 2 and Figure S1). The results showed that the structure and size of chloroplast genomes were highly conservative between genera and within genera, but the IR boundaries were different among species due to the contraction/expansion of IRs/SCs. Within the genus, the coding region of the ycf1 gene was crossed by the boundary between IRs and the SSC. The 4175–4204 bp region of ycf1 was located in the SSC region, whereas another shorter copy of the ycf1 gene passed through the IRs, and the 4–65 bp region was located in the SSC region. The longer ycf2 copy gene was located in the boundary region between the LSC and IRb, and the 3267–3675 bp region was located in the LSC region (Figure 2a and Figure S1). Among genera, the results were similar to those within the genus. The longer ycf1 and ycf2 genes were located at the boundary of the IR/SC, and the regions of 4160–4196 bp and 3317–4431 bp were located in the SSC region and LSC region (Figure 2b), respectively. In general, the expansion/contraction of IRs led to changes in the length of the whole chloroplast genomes and changes in the boundary position between the LSC and SSC.

3.3. Comparative Chloroplast Genome Sequences Differences

Taking the chloroplast genome of L. aggregata as the reference sequence to compare the differences of chloroplast genome sequences between intra-genus (Figure S2) and inter-genera (Figure S3), within the genus, 26 chloroplast genomes can be divided into two groups of sequences with high similarity. One group includes L. praecox, L. pulcherrima var. hemsleyana and L. rubronervia; the variations of the sequences were mainly in the three regions of trrH-GUG, psbA and ccsA-ndhD, but the coding regions were still more conservative than the noncoding regions. The overall variation of the other group of sequences (Pi = 0.00365) was smaller than the above group (Pi = 0.00845), and both the coding region and the noncoding region were highly similar. Among different genera, nine chloroplast genomes were somewhat similar as a whole, but there were great differences between Actinodaphne henryi, N. angustifolia and Laurus nobilis and other species in the non-coding region (Figure S3). Furthermore, we compared 36 intra-genus and inter-genera chloroplast genomes; the results showed that there were local collinear regions between intra-genus (Figure 3a) and inter-genera (Figure 3b) chloroplast genomes, all genes were highly consistent and there was no gene rearrangement and inversion.

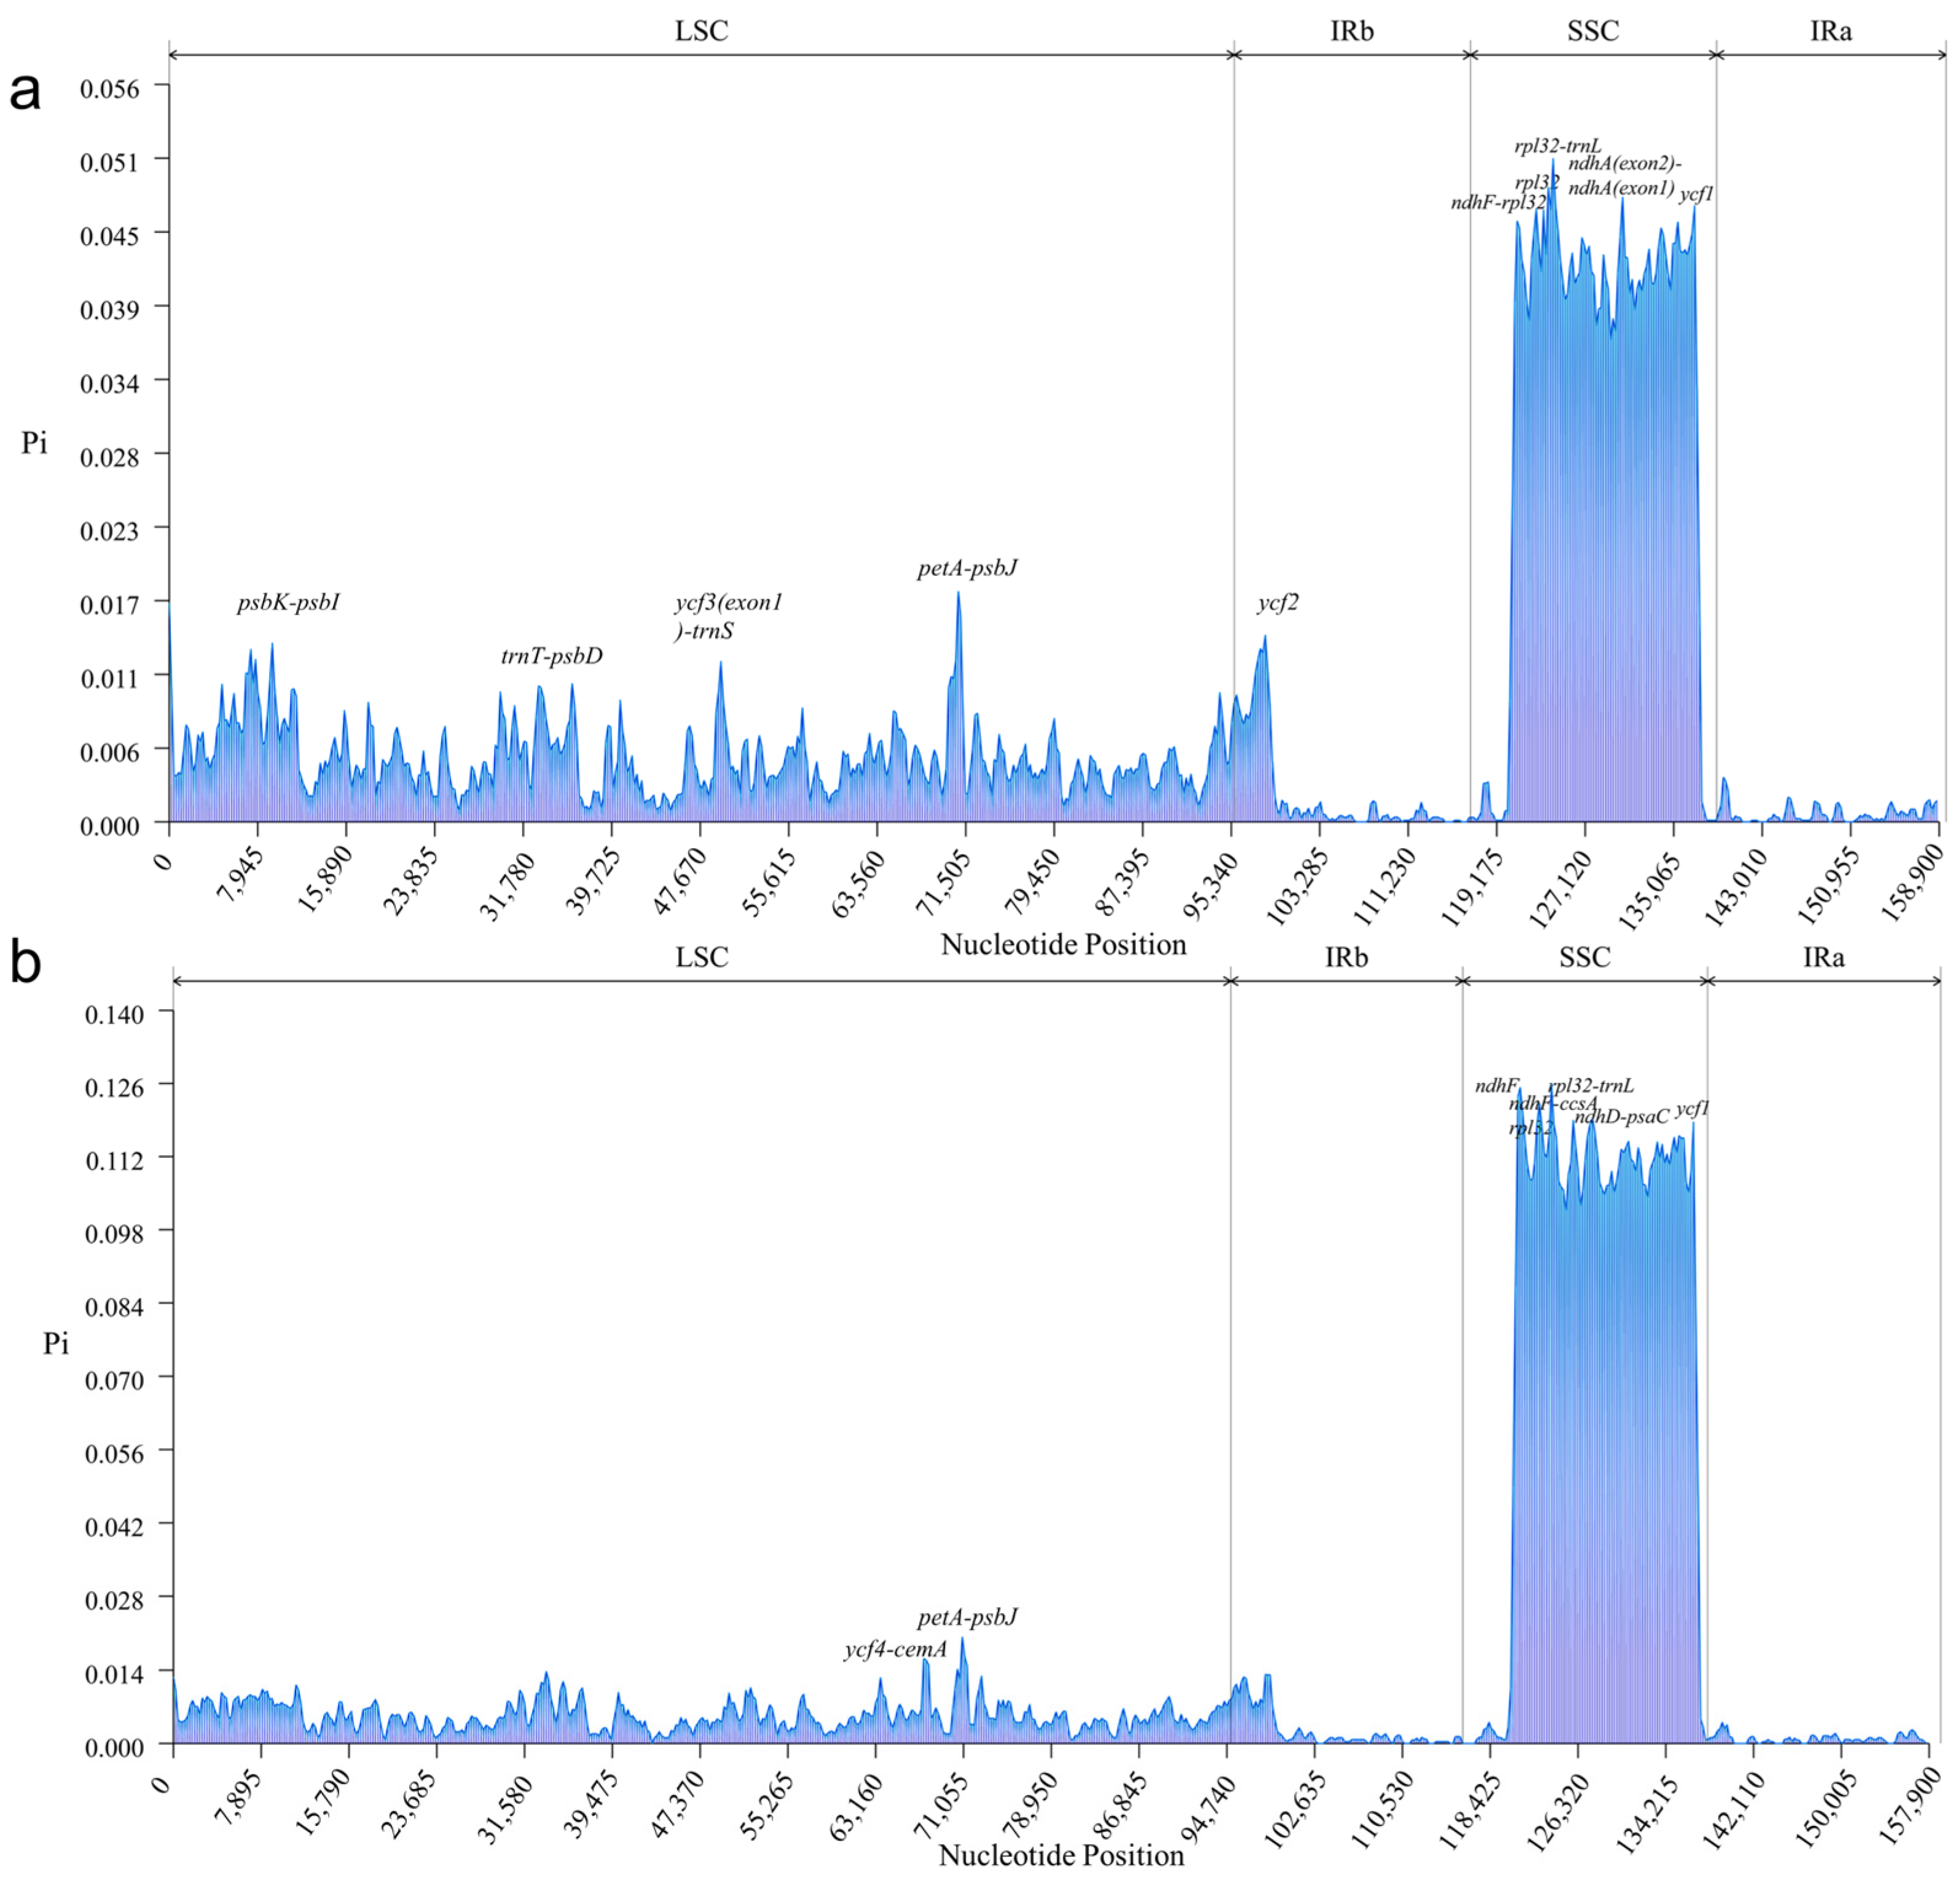
3.4. Analysis of a Highly Variable Region of Chloroplast Genomes

In order to detect the differences of chloroplast genome sequences within genus and among different genera, we calculated the nucleotide diversity (Pi) between L. aggregata and 26 plants of Lindera, L. aggregata and nine different genera of Lauraceae. The Pi values of 27 genomes within the genus ranged from 0 to 0.05068 (average = 0.00787), and the Pi values of 10 genomes among different genera ranged from 0 to 0.12565 (average = 0.01548). Moreover, five hypervariable loci were identified within genus (Figure 4a), namely ycf1 (0.04708), ndhA(exon2)-ndhA(exon1) (0.04772), rpl32-trnL (0.05068), rpl32 (0.04677) and ndhF-rpl32 (0.04684). Six hypervariable loci were identified among genera (Figure 4b), namely ycf1 (0.11833), ndhD-psaC (0.11894), rpl32-trnL (0.12565), ndhF (0.12495), ndhF-rpl32 (0.12194) and ccsA (0.1187). They were all located in the SSC region, indicating that the SSC region was much more different than the IR and LSC regions, and the IR region was highly conservative, which was consistent with the above analysis.

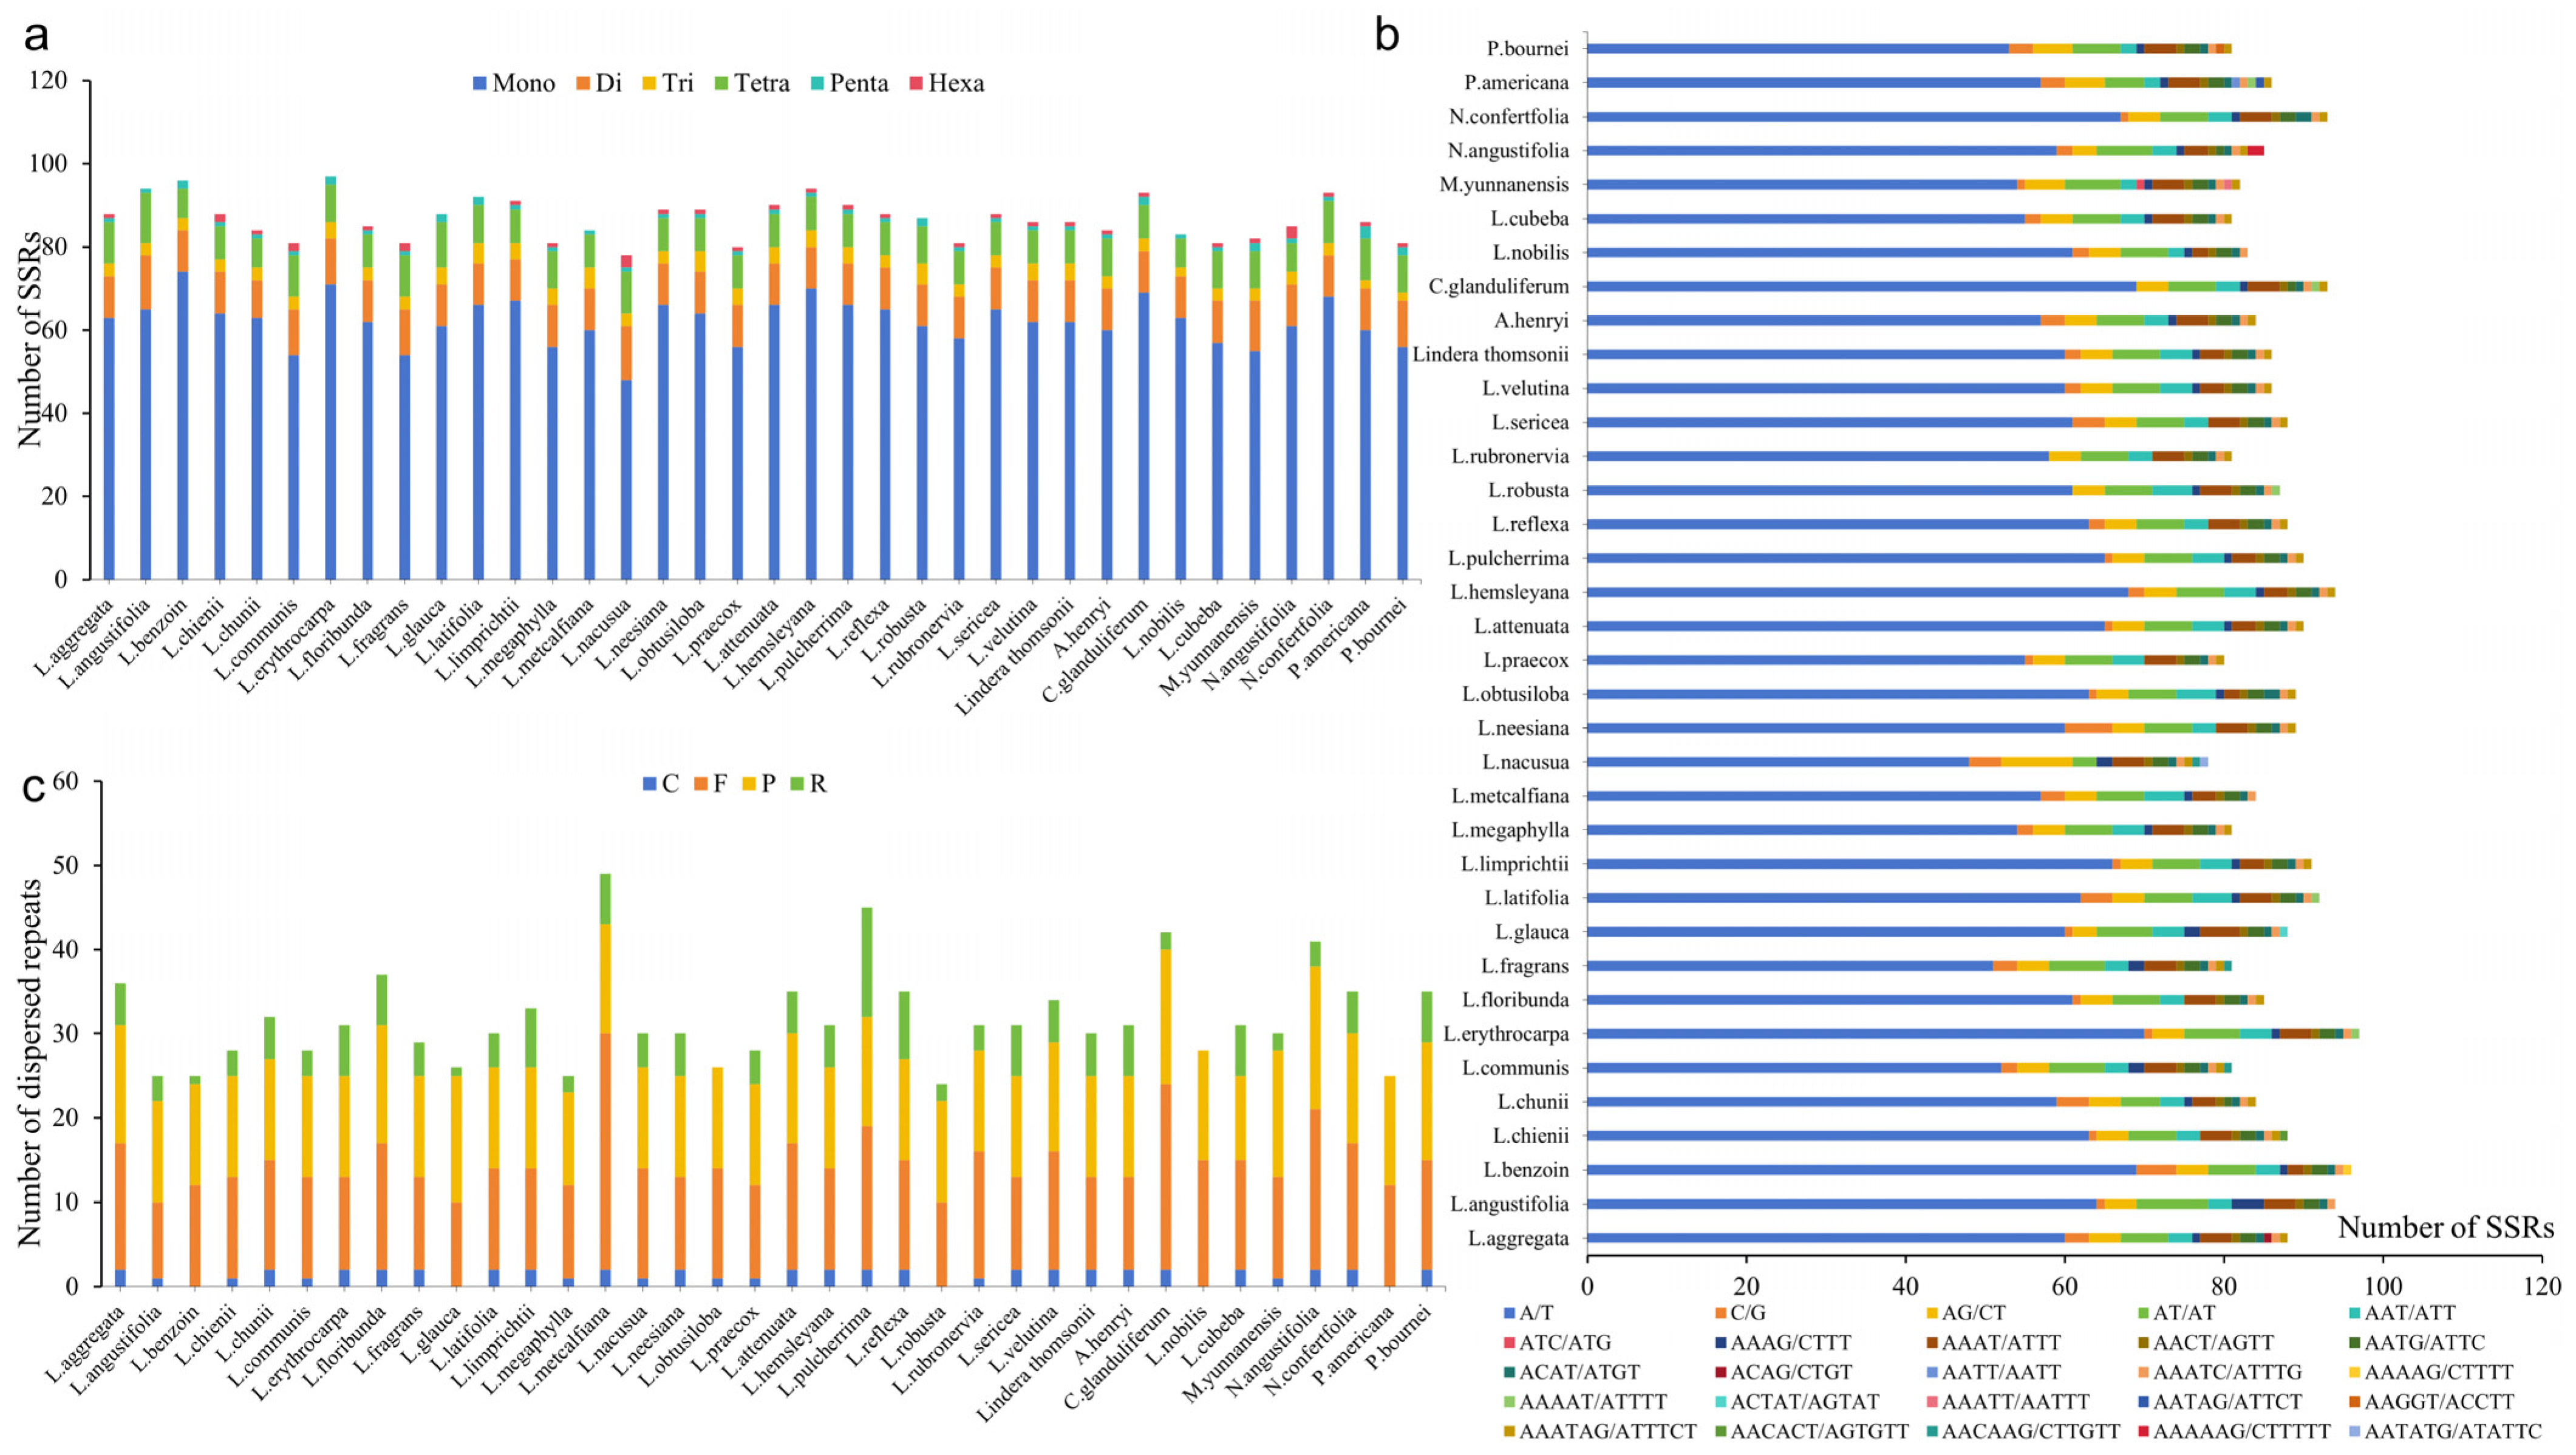
3.5. SSRs and Interspersed Repeat Sequence Analysis

Simple sequence repeats (SSRs) were widely distributed in chloroplast genomes. There were 78–97 SSRs detected across each of chloroplast genomes from 36 Lauraceae plants, for a total of 3124 SSRs. SSR types ranged from mononucleotide (Mono-) repeats to hexanucleotide (Hexa-) repeats, although not all six types of SSRs existed in each taxon (Figure 5a,b). Mono-repeat sequences were the most common (48–74 SSRs), which were mainly composed of A/T type, and there were only 0–6 G/C repeats. Dinucleotide (Di-) repeats were composed of AG/CT and AT/AT; the number of each was equal, both representing 3–9 SSRs. Except that the trinucleotide (Tri-) repeats of Machilus yunnanensis were composed of AAT/ATT and ATC/ATG types, all the other species had only AAT/ATT type with a number of 2–5. There were 7–12 tetranucleotide (Tetra-) repeats, including seven types, but ACAG/CTGT and AATT/AATT types only existed in L. aggregata and P. americana, respectively. There were 1–3 pentanucleotide (Penta-) repeats, including seven types. Except that the AAATC/ATTT repeat existed in all species, the other six types existed in different species. There were 0–3 Hexa- repeats, including five types, of which the AACACT/AGTGTT type existed only in L. chunii, the AAAAAG/CTTTTT type only existed in N. angustifolia, with two repeats, and the AATATG/ATATTC type only existed in L. nacusua.
In addition, we also detected interspersed repeat sequences (24–49) in these chloroplast genomes, for a total of 1142 interspersed repeat sequences, including four repeat types: forward repeats (F-), reverse repeats (R-), palindromic repeats (P-) and complementary repeats (C-). P-repeats and F-repeats appeared most frequently, being detected 457 and 481 times, respectively; R- repeats and C- repeats appeared less frequently, being detected 151 and 53 times, respectively. R-repeats and C-repeats were not even detected in all species; no C-repeats were detected in L. benzoin and L. glauca and L. robusta; no R-repeats were detected in L. obtusiloba, and neither of them was detected in L. nobilis and P. americana.

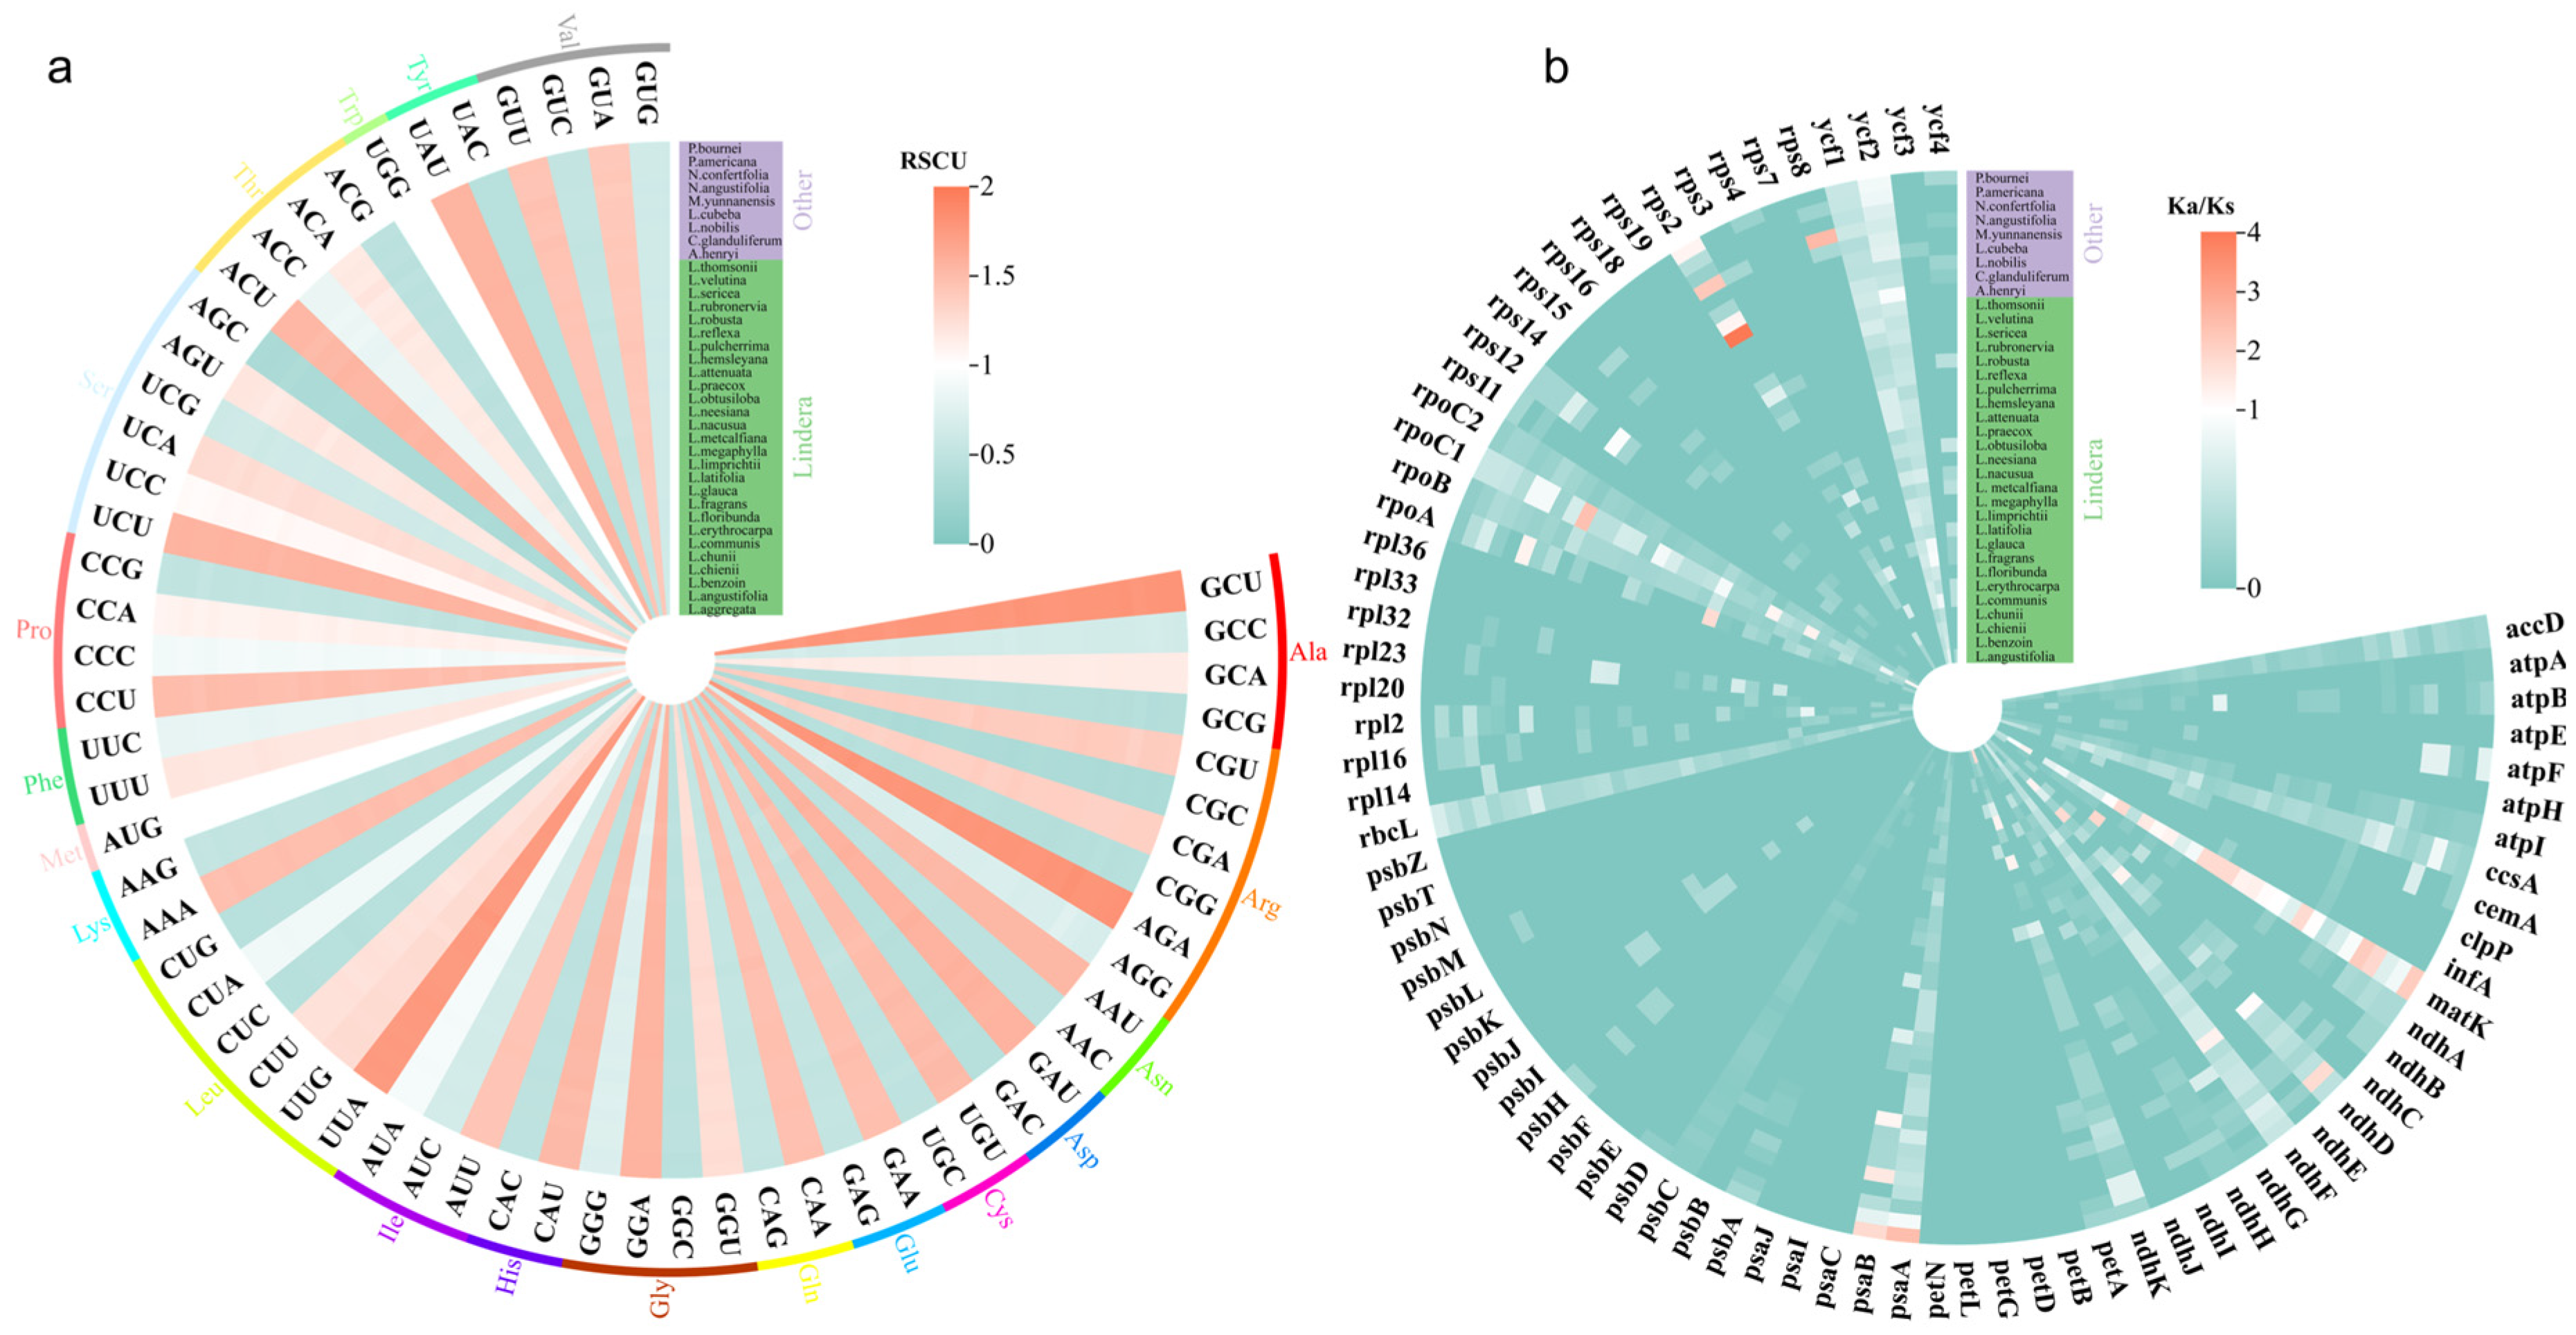
3.6. Analysis of Codon Bias and Selection Pressure in Chloroplast Genomes

Codon bias analysis of 36 chloroplast genomes of Lauraceae showed that 61 codons were detected, encoding 20 amino acids (Figure 6a). The most common ones were arginine (Arg), leucine (Leu) and serine (Ser), using six codons, then alanine (Ala), glycine (Gly), proline (Pro), threonine (Thr) and valine (Val), using four codons. The least common were tryptophan (Trp) and methionine (Met), which used one codon. Based on the computational relative synonymous codon usage (RSCU), 30 codons were greater than 1, which indicated that these codons were biased in the chloroplast genome, and most of them ended with A or U; 2 codons (AUG and UGG) were equal to 1, indicating that the two codons had no preference; 29 codons were less than 1, indicating that these codons were used less frequently, and most of them ended in G or C. In these chloroplast genomes, the AGA codon encoding Arg was the most commonly used, with RSCU values of 1.77–1.82, and the AGC codon encoding Ser exhibited the lowest frequency, with RSCU values that ranged from 0.33 to 0.37. The results showed that the majority of codons in the chloroplast genome of Lauraceae were biased.
Taking the chloroplast genome of L. aggregata as the reference sequence, the selection pressures of genes from Lauraceae were evaluated by calculating Ka/Ks values (Figure 6b). The results showed that the Ka/Ks values of most of the 79 PCGs in all species were less than 1 or could not be determined because the value of Ka or Ks was zero, which also indicated that they were conservative. Furthermore, the Ka/Ks values of some genes showed differences among different species, such as the matK and rpoC1 genes of L. glauca and L. angustifolia; the matK gene of L. chienii, L. benzoin, L. limprichtii, L. erythrocarpa, L. metcalfiana, L. neesiana, L. attenuata, L. hemsleyana, L. pulcherrima, L. reflexa, L. robusta, L. rubronervia, L. sericea and L. thomsonii; the ndhD gene of L. communis, L. fragrans and P. americana; the rpoC1 gene of L. megaphylla; the matK and ndhD genes of L. nacusua; the rpoA gene of L.obtusiloba and L. cubeba; the matK, ndhD, ndhF, psaB and rpoC1 genes of A. henryi; the rps2 gene of C. glanduliferum and L. nobilis; the matK and psaB genes of M. yunnanensis; the matK, rps2 and rps8 genes of N. angustifolia and the matK, rps2, psaA and psbB genes of P. bournei. The Ka/Ks values of these genes were greater than 1, and the values among different genera were generally greater than those within the genus. The above results showed that all genes except 10 genes (matK, rpoA, rpoC1, ndhB, ndhD, ndhF, psaA, psaB, rps2 and rps8) of individual species were purifying selections.

3.7. Phylogenetic Trees and Divergence Time Analysis of the Chloroplast Genomes

In this study, based on the PCGs of chloroplast genomes of 27 Lindera species and 12 Lauraceae species, phylogenetic trees were constructed with maximum likelihood (ML) and Bayesian inference (BI) methods, respectively. The results showed that the two phylogenetic trees had similar topological structure, but the support rate obtained with the BI method was generally higher (Figure 7b), whereas the topological relationship of some terminal branches of the ML method was difficult to distinguish (Figure 7a). From the topological structure of the phylogenetic tree, it could be seen that all the plants of Lindera and Wuyao were clustered into one big branch, but they were also mixed with other genera of Lauraceae (Actinodaphne, Laurus, Litsea and Neolitsea), whereas the remaining different genera (Cinnamomum, Nectandra, Persea, Phoebe and Machilus) were clustered into another single big branch, which was obviously different from Lindera.
Furthermore, based on the chloroplast genomes data, taking L. chinense (Magnoliaceae family) and P. nigrum (Piperaceae family) as outgroups, the divergence time of Lindera (Lauraceae family) was obtained, and the average estimated age and 95% HPD interval were mapped to the geological periods (Figure 8). The crown age of Lauraceae was estimated to be 109.01 Mya (95% HPD: 107.18–110.74 Mya) in the Lower Cretaceous epoch. From the late Miocene to the Pleistocene, the species of the genus Lindera experienced rapid diversification. L. aggregata and L. chiunii formed after differentiation in 2.01 Mya (95% HPD: 1.69–2.35 Mya). L. pulcherrima and its two varieties (L. pulcherrima var. attenuata and L. pulcherrima var. hemsleyana), L. limprichtii and L. thomsonii and one of its varieties (L. thomsonii var. velutina) were closely related to each other, and their internal differentiation was the latest to occur (0.21–0.54 Mya).

4. Discussion

We used the second generation high-throughput sequencing technique to sequence “Tiantai Wu-Yao” and obtained a complete chloroplast genome via assembly and annotation and re-annotated eight uncertified chloroplast genomes in the same genus to correct errors (Table S1). The chloroplast genome of L. aggregata was the same as that of most angiosperms, with conservative circular quadripartite structures, namely two IR regions, one LSC region and one SSC region [56,57,58]. The total length of the sequence was 152,713 bp, which occupied a middle position between the same genus (152,478–153,679 bp) and different genera (150,749–154,036 bp). The content of GC was 39.2%, which was basically no different from other plants of the genus Lindera and was similar to that of different genera of Lauraceae [18,19,23]. The total number of chloroplast genes was 125, which was basically no different from plants in the same genus. The differences from plants in different genera mainly came from PCGs and tRNA genes, whereas rRNAs genes were the most conserved, with eight genes in all species. Gene loss often occurred during the evolution of the chloroplast genome in angiosperms, especially the contraction/expansion of IR regions which lead to gene loss/increase [59]. Through comparative analysis, it was found that only three taxa (L. erythrocarpa, L. glauca and L. latifolia) of the same genus and nine taxa of different genera lacked the trnG-GCC gene, whereas C. glanduliferum and N. angustifolia had one more ycf68 gene. It was reported that there were two kinds of gene rearrangements in the ycf68 gene, which may be a pseudogene [60,61].
Chloroplast genomes of higher plants usually show boundary contraction/expansion differences in different genera or even within the same genus, which is also the main factor leading to changes in gene length and number in different species [62,63]. It was amazing that between species of the same genus or different genera, except for the fact that the trnL genes of L. sericea and L. reflexa were located in the LSC region due to the expansion of the IRb region, trnL, ndhF and trnN were consistently, respectively, located in the corresponding boundary region of IR/SC. Moreover, the expansion of the IR region also caused genes with multiple copies to produce pseudogenes (ycf1 and ycf2) in the boundary region of IRa/SSC and IRb/LSC. Similar to the results of most studies, pseudogenes were easy to be produced in the chloroplast genome of the boundary region of SC/IR in most terrestrial plants [18,63].
The whole chloroplast genome sequence of L. aggregata was compared with species of the same genus and with species of different genera. The results showed that Lauraceae plants were highly conservative as a whole and there was no gene rearrangements or inversions. The variation degree of the LSC and SSC region were higher than that of the IR region, and that of the non-coding region was higher than that of the coding region, which was similar to the majority of higher plants [24,63,64]. Furthermore, five highly variable regions (ycf1, ndhA(exon2)-ndhA(exon1), rpl32-trnL, rpl32 and ndhF-rpl32), six highly variable regions (ycf1, ndhD-psaC, rpl32-trnL, ndhF, ndhF-rpl32 and ccsA) and three common regions (ycf1, rpl32-trnL and ndhF-rpl32) were found within and between genera via sliding windows analysis of nucleotide diversity detection, which were mainly located in intergenic regions. Among them, rpl32-trnL had the highest degree of variation within genus and between genera (Pi = 0.05068 and 0.12565), and there were many variation sites. Similar results had been found in the genera Alseodaphne, Alseodaphnopsis and Dehaasia of the Lauraceae family [24,65,66,67]. Therefore, rpl32-trnL can be used as an important DNA marker within the genus Lindera or among different genera of Lauraceae.
Repetitive sequences affect gene transcriptional regulation, protein translation, chromosome formation and metabolism and reflect the differences in mutation frequency and the evolution rate of species [68]. There were 24–49 interspersed repeat sequences in the chloroplast genomes of Lauraceae, among which L. benzoin, L. robusta and L. glauca lacked the C- repeat type, L. obtusiloba lacked the R- repeat type, L. nobilis and P. americana only contained F- and P- repeat types and other species contained F-, R-, P- and C- repeat types. Moreover, the SSRs loci are widely distributed in the genome of organisms, which can lead to diversity due to the different number of repetitive units [69]. At the same time, it has the characteristics of genetic stability, high abundance and wide distribution, so it is often used for species identification and genetic diversity detection [70]. In this study, 78–97 SSR loci were found in Lauraceae, including six repetitive types. Among them, the mono- repeat sequence was the most common, accounting for 61.5–77.1% of the total SSRs, with the A/T base as the basic repeat unit.
The selection pressures of the genes are detected by calculating the Ka/Ks, in which, when Ka/Ks > 1, the genes are in the positive selection state, when Ka/Ks = 1, the genes are in the neutral evolution state and when Ka/Ks < 1, the genes are in the purified selection state [63,71]. The average Ka/Ks values of Lauraceae (0.1230–0.3282) were all less than 1, of which 79 PCGs’ Ka/Ks values were less than 1 in all species, indicating that the majority of genes were in the state of purifying selection. Only in some individuals there were 10 genes (matK, rpoA, rpoC1, ndhB, ndhD, ndhF, psaA, psaB, rps2 and rps8) associated with maturase, photosystem I, NADPH dehydrogenase, RNA polymerase and small ribosomal proteins, and their Ka/Ks were greater than 1, indicating that these genes were affected by positive selection. They were undergoing a period of rapid evolution. Furthermore, codon usage bias can reflect the evolution characteristics of the chloroplast genome and its influencing factors and plays an important role in genome expression [72]. The RSCU value reflects the codon usage patterns of different genes, and the higher the value, the higher the codon usage frequency [38]. In Lauralee, the RSCU values of 30 codons were greater than 1, and 97% of these high-frequency codons end with A/U, which was consistent with the codon usage bias of chloroplast genes in other plants [73], indicating that there was asymmetry in the third base of chloroplast codons and a bias of A/U.
The taxonomic status of Lauraceae has always been controversial in the academic community. Some traits used in morphological classification are affected by environmental and geographical factors, so it is difficult to establish an accurate phylogenetic relationship. The chloroplast genome is highly conservative and widely used in phylogenetic research. Song et al. constructed a phylogenetic tree based on the chloroplast genome of eight species from Lauraceae, which revealed that Persea, Machilus and Phoebe were closely related [25], which was consistent with the conclusion of Rohwer et al. which was based on an ITS sequence [65] and Li et al. which was based on ITS and LEAFY intron II sequences [67]. Zhao et al. constructed a systematic tree containing 32 species of Lauraceae. The results showed that the family branches of Cinnamomum-Ocotea included Sassafras, Cinnamomum, Ocotea and Nectandra, and this branch formed a sister group with the branches of Lindera (including Lindera, Laurus and Litsea) [22]. Tian et al. reconstructed the phylogenetic tree containing 49 species of Lauraceae based on the chloroplast genome, which supported the phylogeny of Laureae, Perseae and Cinnamoneae, and found that Linera, Litsea and Iteadaphne were closely related [20]. Liu et al. reconstructed the phylogeny of Lauraceae using 191 chloroplast genes (25 genera and 131 species). The results showed that Lauraceae could be divided into seven sections: sect. Cryptocaryeae, sect. Cassytheae, sect. Neocinnamomeae, sect. Caryodaphnopsideae, sect. Perseae, sect. Cinnamoneae and sect. Laureae [74]. The application of the chloroplast genome has solved a majority of the problems in the phylogenetic status of Lauraceae and has high reference value. In this study, the phylogenetic relationship within Lindera and among different genera of Lauraceae was studied with L. aggregata as the center. The results showed that most genera of Lauraceae could be distinguished from Lindera, but some species of Lindera, Litsea and Laurus formed their own subgroups, which was consistent with the above results. Moreover, it was interesting that L. aggregata and some plants of the same genus form a subgroup, which was closely related to the genera Neolitsea and Actinodaphne. Finally, through the evaluation of the divergence time, it was inferred that the crown age of Lauraceae was 109.01 Mya (95% HPD: 107.18–110.74 Mya) in the Lower Cretaceous epoch. The above divergence time was much younger than the divergence time of genome assessment (average: 119.8 Mya, HPD: 101.9–135.6 Mya) [53], which may be caused by a chloroplast capture event. Moreover, from the late Miocene to the Pleistocene, the species of the genus Lindera experienced rapid diversification. L. aggregata and L. chiunii were formed after differentiation in 2.01 Mya (95% HPD: 1.69–2.35 Mya).

5. Conclusions

In this study, we sequenced, assembled and annotated the chloroplast genome of L. aggregata (Wu-Yao) and re-annotated a large number of unverified chloroplast genomes of Lauraceae. For the first time, we compared the structure and differences of chloroplast genomes within genus and between genera in detail. These chloroplast genomes were highly conserved, with a total of 111–112 unique genes in each genome, including 78–79 PCGs, 29–30 tRNA and 4 rRNA genes. Moreover, the boundary and collinear analysis of genomes also showed that these genomes were highly conservative and there was no gene rearrangement or inversion. Among these genomes, there were six types of SSRs and four types of interspersed repeats, among which the Mono-repeat sequences had the highest frequency of SSR types, and a majority of them toke A/T as the basic repeat unit; F- and P-repeats were the main types of interspersed repeats. Codon bias analysis showed that different species had similar RSCU values, and all tended to end with A or U bases. Five highly variable regions were identified within the genus, namely ycf1, ndhA(exon2)-ndhA(exon1), rpl32-trnL, rpl32 and ndhF-rpl32; there were six highly variable regions among genera, namely ycf1, ndhD-psaC, rpl32-trnL, ndhF, ndhF-rpl32 and ccsA; and there were three highly variable regions (ycf1, rpl32-trnL and ndhF-rpl32) shared by them. These regions can be used as vital markers for classification and identification within and between genera. Selective pressure analysis showed that a majority of genes were under purifying selection, the sequences were relatively conservative and only 10 genes (matK, rpoA, rpoC1, ndhB, ndhD, ndhF, psaA, psaB, rps2 and rps8) were positively selected in some individuals. The evolutionary trees clarified the phylogenetic relationship of Lauraceae and revealed the taxonomic status of Lindera. The estimation of the divergence time revealed that the divergence time of Lindera (Lauraceae) was in the Lower Cretaceous epoch. After that, they experienced rapid adaptive radiation from Miocene to Pleistocene, and Wu-Yao was formed after differentiation in the middle of early Pleistocene.

Supplementary Materials

The following supporting information can be downloaded at: https://www.mdpi.com/article/10.3390/genes15030263/s1, Figure S1: Comparison of junction boundaries in four regions (LSC/SSC/IRa/IRb) of 13 chloroplast genomes. The number on the color gene indicates the distance between the gene and the edge of the border. JLB represents LSC/IRb boundary, JSB represents SSC/IRb boundary, JSA represents SSC/IRa boundary, and JLA represents LSC/IRa boundary; Figure S2: The sequence difference map compares 26 chloroplast genomes of Lindera, using the chloroplast genome of L. aggregata as the reference sequence via mVISTA software. The gray arrows and thick black lines above indicate the direction of the gene. Different areas were given different colors. The pink region was a conservative non-coding region (CNS), purple was the gene exon region, and the blue region was tRNA or rRNA; Figure S3: The sequence difference map compares 9 chloroplast genomes of Lauraceae, using the chloroplast genome of L. aggregata as the reference sequence via mVISTA software. The gray arrows and thick black lines above indicate the direction of the gene. Different areas were given different colors. The pink region was a conservative non-coding region (CNS), purple was the gene exon region, and the blue region was tRNA or rRNA; Table S1: Details of chloroplast genomes for 39 species; Table S2: Characteristics of 36 chloroplast genomes in Lauraceae; Table S3: Gene annotation of Lauraceae chloroplast genome.

Author Contributions

W.Z. designed and directed the study. W.Z. and Z.C. revised the paper. Y.S. analyzed the data and wrote the original draft. J.J. and X.L. participated in the guidance of the analysis. All authors have read and agreed to the published version of the manuscript.

Funding

This work was funded by Basic Public Welfare Research Project of Zhejiang Province (LGN22C020001), Startup Funding of Taizhou University for the Biomass Polysaccharide Metabolism Institute (T20231801002).

Institutional Review Board Statement

Not applicable.

Informed Consent Statement

Not applicable.

Data Availability Statement

The newly assembled complete chloroplast genomic sequences of Lindera aggregata can be obtained on GenBank, and the accession number is PP199190.

Acknowledgments

We thank Zhejiang Hongshiliang Group Tiantaishan Wuyao Co. for providing samples (Tiantai Wu-Yao, Taizhou, China).

Conflicts of Interest

The authors declare no conflicts of interest.

References

  1. Chanderbali, A.S.; van der Werff, H.; Renner, S.S. Phylogeny and Historical Biogeography of Lauraceae: Evidence from the Chloroplast and Nuclear Genomes. Ann. Mo. Bot. Gard. 2001, 88, 104–134. [Google Scholar] [CrossRef]
  2. van der Werff, H.; Richter, H.G. Toward an Improved Classification of Lauraceae. Ann. Mo. Bot. Gard. 1996, 83, 409–418. [Google Scholar] [CrossRef]
  3. Hung-Pin, T. A Study on the System of Lindera. J. Syst. Evol. 1987, 25, 161–171. [Google Scholar]
  4. Tao, Y.; Deng, Y.; Wang, P. Traditional uses, phytochemistry, pharmacology, processing methods and quality control of Lindera aggregata (Sims) Kosterm: A critical review. J. Ethnopharmacol. 2024, 318, 116954. [Google Scholar] [CrossRef]
  5. Lv, Y.; Zou, Y.; Zhang, X.; Liu, B.; Peng, X.; Chu, C. A review on the chemical constituents and pharmacological efficacies of Lindera aggregata (Sims) Kosterm. Front. Nutr. 2023, 9, 1071276. [Google Scholar] [CrossRef]
  6. Wang, C.; Dai, Y.; Yang, J.; Chou, G.; Wang, C.; Wang, Z. Treatment with total alkaloids from Radix Linderae reduces inflammation and joint destruction in type II collagen-induced model for rheumatoid arthritis. J. Ethnopharmacol. 2007, 111, 322–328. [Google Scholar] [CrossRef]
  7. Gan, L.-S.; Yao, W.; Mo, J.-X.; Zhou, C.-X. Alkaloids from Lindera aggregata. Nat. Prod. Commun. 2009, 4, 1934578X0900400111. [Google Scholar] [CrossRef]
  8. Han, H.; Xu, B.; Amin, A.; Li, H.; Yu, X.; Gong, M.; Zhang, L. Quercetin-3-O-α-L-rhamnopyranoside derived from the leaves of Lindera aggregata (Sims) Kosterm. evokes the autophagy-induced nuclear factor erythroid 2-related factor 2 antioxidant pathway in human umbilical vein endothelial cells. Int. J. Mol. Med. 2019, 43, 461–474. [Google Scholar] [CrossRef]
  9. Wu, Y.; Zheng, Y.; Liu, X.; Han, Z.; Ren, Y.; Gan, L.; Zhou, C.; Luan, L. Separation and quantitative determination of sesquiterpene lactones in Lindera aggregata (Wu-yao) by ultra-performance LC-MS/MS. J. Sep. Sci. 2010, 33, 1072–1078. [Google Scholar] [CrossRef]
  10. Xu, C.; Yang, B.; Zhu, W.; Li, X.; Tian, J.; Zhang, L. Characterisation of polyphenol constituents of Linderae aggregata leaves using HPLC fingerprint analysis and their antioxidant activities. Food Chem. 2015, 186, 83–89. [Google Scholar] [CrossRef]
  11. Duan, C.; Guo, J.-M.; Dai, Y.; Xia, Y.-F. The absorption enhancement of norisoboldine in the duodenum of adjuvant-induced arthritis rats involves the impairment of P-glycoprotein. Biopharm. Drug Dispos. 2017, 38, 75–83. [Google Scholar] [CrossRef]
  12. Weng, M.; You, S.; Luo, J.; Lin, Z.; Chen, T.; Peng, X.; Qiu, B. Antibacterial mechanism of polysaccharides from the leaves of Lindera aggregata (Sims) Kosterm. by metabolomics based on HPLC/MS. Int. J. Biol. Macromol. 2022, 221, 303–313. [Google Scholar] [CrossRef]
  13. Salleh, W.; Hakimi, W.M. Lindera aggregata (Sims) Kosterm: Review on phytochemistry and biological activities. Bol. Latinoam. Y Del Caribe De Plantas Med. Y Aromat. 2020, 19, 527–541. [Google Scholar] [CrossRef]
  14. Wei, Z.-F.; Tong, B.; Xia, Y.-F.; Lu, Q.; Chou, G.-X.; Wang, Z.-T.; Dai, Y. Norisoboldine Suppresses Osteoclast Differentiation through Preventing the Accumulation of TRAF6-TAK1 Complexes and Activation of MAPKs/NF-κB/c-Fos/NFATc1 Pathways. PLoS ONE 2013, 8, e59171. [Google Scholar] [CrossRef] [PubMed]
  15. Xu, C.; Cai, X.; Chen, Q.; Zhou, H.; Cai, Y.; Ben, A. Factors Affecting Synonymous Codon Usage Bias in Chloroplast Genome of Oncidium Gower Ramsey. Evol. Bioinform. 2011, 7, EBO.S8092. [Google Scholar] [CrossRef] [PubMed]
  16. Daniell, H.; Lin, C.-S.; Yu, M.; Chang, W.-J. Chloroplast genomes: Diversity, evolution, and applications in genetic engineering. Genome Biol. 2016, 17, 134. [Google Scholar] [CrossRef]
  17. Bock, R.; Knoop, V. Genomics of Chloroplasts and Mitochondria; Springer Science & Business Media: Berlin/Heidelberg, Germany, 2012; Volume 35. [Google Scholar]
  18. Song, Y.; Yu, W.B.; Tan, Y.H.; Jin, J.J.; Wang, B.; Yang, J.B.; Liu, B.; Corlett, R.T. Plastid phylogenomics improve phylogenetic resolution in the Lauraceae. J. Syst. Evol. 2020, 58, 423–439. [Google Scholar] [CrossRef]
  19. Zhang, Y.; Tian, Y.; Tng, D.Y.; Zhou, J.; Zhang, Y.; Wang, Z.; Li, P.; Wang, Z. Comparative chloroplast genomics of Litsea Lam. (Lauraceae) and its phylogenetic implications. Forests 2021, 12, 744. [Google Scholar] [CrossRef]
  20. Tian, X.; Ye, J.; Song, Y. Plastome sequences help to improve the systematic position of trinerved Lindera species in the family Lauraceae. PeerJ 2019, 7, e7662. [Google Scholar] [CrossRef]
  21. Hinsinger, D.D.; Strijk, J.S. Toward phylogenomics of Lauraceae: The complete chloroplast genome sequence of Litsea glutinosa (Lauraceae), an invasive tree species on Indian and Pacific Ocean islands. Plant Gene 2017, 9, 71–79. [Google Scholar] [CrossRef]
  22. Zhao, M.-L.; Song, Y.; Ni, J.; Yao, X.; Tan, Y.-H.; Xu, Z.-F. Comparative chloroplast genomics and phylogenetics of nine Lindera species (Lauraceae). Sci. Rep. 2018, 8, 8844. [Google Scholar] [CrossRef]
  23. Song, Y.; Dong, W.; Liu, B.; Xu, C.; Yao, X.; Gao, J.; Corlett, R.T. Comparative analysis of complete chloroplast genome sequences of two tropical trees Machilus yunnanensis and Machilus balansae in the family Lauraceae. Front. Plant Sci. 2015, 6, 662. [Google Scholar] [CrossRef]
  24. Song, Y.; Yao, X.; Liu, B.; Tan, Y.; Corlett, R.T. Complete plastid genome sequences of three tropical Alseodaphne trees in the family Lauraceae. Holzforschung 2018, 72, 337–345. [Google Scholar] [CrossRef]
  25. Song, Y.; Yao, X.; Tan, Y.; Gan, Y.; Corlett, R.T. Complete chloroplast genome sequence of the avocado: Gene organization, comparative analysis, and phylogenetic relationships with other Lauraceae. Can. J. For. Res. 2016, 46, 1293–1301. [Google Scholar] [CrossRef]
  26. Song, Y.; Yu, W.-B.; Tan, Y.; Liu, B.; Yao, X.; Jin, J.; Padmanaba, M.; Yang, J.-B.; Corlett, R.T. Evolutionary comparisons of the chloroplast genome in Lauraceae and insights into loss events in the Magnoliids. Genome Biol. Evol. 2017, 9, 2354–2364. [Google Scholar] [CrossRef]
  27. Yuan, L.; Sun, Y.; Zhou, S.; Wang, F.; Sun, C. Characterization of the complete chloroplast genome of Lindera aggregata. Mitochondrial DNA Part B 2021, 6, 3055–3056. [Google Scholar] [CrossRef] [PubMed]
  28. Li, J.; Christophel, D.C.; Conran, J.G.; Li, H.-W. Phylogenetic relationships within the ‘core’ Laureae (Litsea complex, Lauraceae) inferred from sequences of the chloroplast gene matK and nuclear ribosomal DNA ITS regions. Plant Syst. Evol. 2004, 246, 19–34. [Google Scholar] [CrossRef]
  29. Li, J.; Christophel, D.C. Systematic relationships within the Litsea complex (Lauraceae): A cladistic analysis on the basis of morphological and leaf cuticle data. Aust. Syst. Bot. 2000, 13, 1–13. [Google Scholar] [CrossRef]
  30. Doyle, J.J.; Doyle, J.L. A rapid DNA isolation procedure for small quantities of fresh leaf tissue. Phytochem. Bull. 1987, 19, 11–15. [Google Scholar]
  31. Bolger, A.M.; Lohse, M.; Usadel, B. Trimmomatic: A flexible trimmer for Illumina sequence data. Bioinformatics 2014, 30, 2114–2120. [Google Scholar] [CrossRef] [PubMed]
  32. Jin, J.-J.; Yu, W.-B.; Yang, J.-B.; Song, Y.; DePamphilis, C.W.; Yi, T.-S.; Li, D.-Z. GetOrganelle: A fast and versatile toolkit for accurate de novo assembly of organelle genomes. Genome Biol. 2020, 21, 241. [Google Scholar] [CrossRef]
  33. Shi, L.; Chen, H.; Jiang, M.; Wang, L.; Wu, X.; Huang, L.; Liu, C. CPGAVAS2, an integrated plastome sequence annotator and analyzer. Nucleic Acids Res. 2019, 47, W65–W73. [Google Scholar] [CrossRef]
  34. Tillich, M.; Lehwark, P.; Pellizzer, T.; Ulbricht-Jones, E.S.; Fischer, A.; Bock, R.; Greiner, S. GeSeq–versatile and accurate annotation of organelle genomes. Nucleic Acids Res. 2017, 45, W6–W11. [Google Scholar] [CrossRef]
  35. Kearse, M.; Moir, R.; Wilson, A.; Stones-Havas, S.; Cheung, M.; Sturrock, S.; Buxton, S.; Cooper, A.; Markowitz, S.; Duran, C. Geneious Basic: An integrated and extendable desktop software platform for the organization and analysis of sequence data. Bioinformatics 2012, 28, 1647–1649. [Google Scholar] [CrossRef]
  36. Zheng, S.; Poczai, P.; Hyvönen, J.; Tang, J.; Amiryousefi, A. Chloroplot: An online program for the versatile plotting of organelle genomes. Front. Genet. 2020, 11, 576124. [Google Scholar] [CrossRef]
  37. Liu, S.; Ni, Y.; Li, J.; Zhang, X.; Yang, H.; Chen, H.; Liu, C. CPGView: A package for visualizing detailed chloroplast genome structures. Mol. Ecol. Resour. 2023, 23, 694–704. [Google Scholar] [CrossRef] [PubMed]
  38. Sharp, P.M.; Li, W.-H. The codon adaptation index-a measure of directional synonymous codon usage bias, and its potential applications. Nucleic Acids Res. 1987, 15, 1281–1295. [Google Scholar] [CrossRef]
  39. Beier, S.; Thiel, T.; Münch, T.; Scholz, U.; Mascher, M. MISA-web: A web server for microsatellite prediction. Bioinformatics 2017, 33, 2583–2585. [Google Scholar] [CrossRef]
  40. Kurtz, S.; Choudhuri, J.V.; Ohlebusch, E.; Schleiermacher, C.; Stoye, J.; Giegerich, R. REPuter: The manifold applications of repeat analysis on a genomic scale. Nucleic Acids Res. 2001, 29, 4633–4642. [Google Scholar] [CrossRef] [PubMed]
  41. Frazer, K.A.; Pachter, L.; Poliakov, A.; Rubin, E.M.; Dubchak, I. VISTA: Computational tools for comparative genomics. Nucleic Acids Res. 2004, 32 (Suppl. S2), W273–W279. [Google Scholar] [CrossRef] [PubMed]
  42. Zhang, D.; Gao, F.; Jakovlić, I.; Zou, H.; Zhang, J.; Li, W.X.; Wang, G.T. PhyloSuite: An integrated and scalable desktop platform for streamlined molecular sequence data management and evolutionary phylogenetics studies. Mol. Ecol. Resour. 2020, 20, 348–355. [Google Scholar] [CrossRef]
  43. Katoh, K.; Standley, D.M. MAFFT multiple sequence alignment software version 7: Improvements in performance and usability. Mol. Biol. Evol. 2013, 30, 772–780. [Google Scholar] [CrossRef] [PubMed]
  44. Wang, D.; Zhang, Y.; Zhang, Z.; Zhu, J.; Yu, J. KaKs_Calculator 2.0: A toolkit incorporating gamma-series methods and sliding window strategies. Genom. Proteom. Bioinform. 2010, 8, 77–80. [Google Scholar] [CrossRef] [PubMed]
  45. Amiryousefi, A.; Hyvönen, J.; Poczai, P. IRscope: An online program to visualize the junction sites of chloroplast genomes. Bioinformatics 2018, 34, 3030–3031. [Google Scholar] [CrossRef] [PubMed]
  46. Rozas, J.; Sánchez-DelBarrio, J.C.; Messeguer, X.; Rozas, R. DnaSP, DNA polymorphism analyses by the coalescent and other methods. Bioinformatics 2003, 19, 2496–2497. [Google Scholar] [CrossRef] [PubMed]
  47. Capella-Gutiérrez, S.; Silla-Martínez, J.M.; Gabaldón, T. trimAl: A tool for automated alignment trimming in large-scale phylogenetic analyses. Bioinformatics 2009, 25, 1972–1973. [Google Scholar] [CrossRef]
  48. Minh, B.Q.; Schmidt, H.A.; Chernomor, O.; Schrempf, D.; Woodhams, M.D.; von Haeseler, A.; Lanfear, R. IQ-TREE 2: New models and efficient methods for phylogenetic inference in the genomic era. Mol. Biol. Evol. 2020, 37, 1530–1534. [Google Scholar] [CrossRef]
  49. Kalyaanamoorthy, S.; Minh, B.Q.; Wong, T.K.; Von Haeseler, A.; Jermiin, L.S. ModelFinder: Fast model selection for accurate phylogenetic estimates. Nat. Methods 2017, 14, 587–589. [Google Scholar] [CrossRef] [PubMed]
  50. Ronquist, F.; Teslenko, M.; Van Der Mark, P.; Ayres, D.L.; Darling, A.; Höhna, S.; Larget, B.; Liu, L.; Suchard, M.A.; Huelsenbeck, J.P. MrBayes 3.2: Efficient Bayesian phylogenetic inference and model choice across a large model space. Syst. Biol. 2012, 61, 539–542. [Google Scholar] [CrossRef]
  51. Xie, J.; Chen, Y.; Cai, G.; Cai, R.; Hu, Z.; Wang, H. Tree Visualization by One Table (tvBOT): A web application for visualizing, modifying and annotating phylogenetic trees. Nucleic Acids Res. 2023, 51, gkad359. [Google Scholar] [CrossRef]
  52. Bouckaert, R.; Heled, J.; Kühnert, D.; Vaughan, T.; Wu, C.-H.; Xie, D.; Suchard, M.A.; Rambaut, A.; Drummond, A.J. BEAST 2: A software platform for Bayesian evolutionary analysis. PLoS Comput. Biol. 2014, 10, e1003537. [Google Scholar] [CrossRef]
  53. Xiong, B.; Zhang, L.; Xie, L.; Li, L.; He, X.; Niu, Y.; Zhang, T.; Liao, S.; Dong, S.; Zhang, Z. Genome of Lindera glauca provides insights into the evolution of biosynthesis genes for aromatic compounds. iScience 2022, 25, 104761. [Google Scholar] [CrossRef]
  54. Jiang, R.; Chen, X.; Liao, X.; Peng, D.; Han, X.; Zhu, C.; Wang, P.; Hufnagel, D.E.; Wang, L.; Li, K.; et al. A Chromosome-Level Genome of the Camphor Tree and the Underlying Genetic and Climatic Factors for Its Top-Geoherbalism. Front. Plant Sci. 2022, 13, 827890. [Google Scholar] [CrossRef]
  55. Rambaut, A.; Drummond, A.J.; Xie, D.; Baele, G.; Suchard, M.A. Posterior summarization in Bayesian phylogenetics using Tracer 1.7. Syst. Biol. 2018, 67, 901–904. [Google Scholar] [CrossRef]
  56. Tao, L.; Duan, H.; Tao, K.; Luo, Y.; Li, Q.; Li, L. Complete chloroplast genome structural characterization of two Phalaenopsis (Orchidaceae) species and comparative analysis with their alliance. BMC Genom. 2023, 24, 359. [Google Scholar] [CrossRef]
  57. Koch, M.A.; Haubold, B.; Mitchell-Olds, T. Comparative evolutionary analysis of chalcone synthase and alcohol dehydrogenase loci in Arabidopsis, Arabis, and related genera (Brassicaceae). Mol. Biol. Evol. 2000, 17, 1483–1498. [Google Scholar] [CrossRef]
  58. Funk, H.T.; Berg, S.; Krupinska, K.; Maier, U.G.; Krause, K. Complete DNA sequences of the plastid genomes of two parasitic flowering plant species, Cuscuta reflexa and Cuscuta gronovii. BMC Plant Biol. 2007, 7, 45. [Google Scholar] [CrossRef] [PubMed]
  59. Wang, R.-J.; Cheng, C.-L.; Chang, C.-C.; Wu, C.-L.; Su, T.-M.; Chaw, S.-M. Dynamics and evolution of the inverted repeat-large single copy junctions in the chloroplast genomes of monocots. BMC Evol. Biol. 2008, 8, 36. [Google Scholar] [CrossRef] [PubMed]
  60. Huang, Y.-Y.; Cho, S.-T.; Haryono, M.; Kuo, C.-H. Complete chloroplast genome sequence of common bermudagrass (Cynodon dactylon (L.) Pers.) and comparative analysis within the family Poaceae. PLoS ONE 2017, 12, e0179055. [Google Scholar]
  61. Ren, J.; Tian, J.; Jiang, H.; Zhu, X.-X.; Mutie, F.M.; Wanga, V.O.; Ding, S.-X.; Yang, J.-X.; Dong, X.; Chen, L.-L. Comparative and phylogenetic analysis based on the chloroplast genome of Coleanthus subtilis (Tratt.) Seidel, a protected rare species of monotypic genus. Front. Plant Sci. 2022, 13, 828467. [Google Scholar] [CrossRef] [PubMed]
  62. Gu, X.; Zhu, M.; Su, Y.; Wang, T. A Large Intergenic Spacer Leads to the Increase in Genome Size and Sequential Gene Movement around IR/SC Boundaries in the Chloroplast Genome of Adiantum malesianum (Pteridaceae). Int. J. Mol. Sci. 2022, 23, 15616. [Google Scholar] [CrossRef]
  63. Cai, H.; Xu, R.; Tian, P.; Zhang, M.; Zhu, L.; Yin, T.; Zhang, H.; Liu, X. Complete Chloroplast Genomes and the Phylogenetic Analysis of Three Native Species of Paeoniaceae from the Sino-Himalayan Flora Subkingdom. Int. J. Mol. Sci. 2023, 25, 257. [Google Scholar] [CrossRef]
  64. Liu, X.; Bai, Y.; Wang, Y.; Chen, Y.; Dong, W.; Zhang, Z. Complete chloroplast genome of Hypericum perforatum and dynamic evolution in Hypericum (Hypericaceae). Int. J. Mol. Sci. 2023, 24, 16130. [Google Scholar] [CrossRef]
  65. Rohwer, J.G.; Li, J.; Rudolph, B.; Schmidt, S.A.; van der Werff, H.; Li, H.-W. Is Persea (Lauraceae) monophyletic? Evidence from nuclear ribosomal ITS sequences. Taxon 2009, 58, 1153–1167. [Google Scholar] [CrossRef]
  66. Mo, Y.-Q.; Li, L.; Li, J.-W.; Rohwer, J.G.; Li, H.-W.; Li, J. Alseodaphnopsis: A new genus of Lauraceae based on molecular and morphological evidence. PLoS ONE 2017, 12, e0186545. [Google Scholar] [CrossRef]
  67. Li, L.; Li, J.; Rohwer, J.G.; van der Werff, H.; Wang, Z.-H.; Li, H.-W. Molecular phylogenetic analysis of the Persea group (Lauraceae) and its biogeographic implications on the evolution of tropical and subtropical Amphi-Pacific disjunctions. Am. J. Bot. 2011, 98, 1520–1536. [Google Scholar] [CrossRef]
  68. Hu, J.; Gui, S.; Zhu, Z.; Wang, X.; Ke, W.; Ding, Y. Genome-wide identification of SSR and SNP markers based on whole-genome re-sequencing of a Thailand wild sacred lotus (Nelumbo nucifera). PLoS ONE 2015, 10, e0143765. [Google Scholar] [CrossRef] [PubMed]
  69. Kaur, S.; Panesar, P.S.; Bera, M.B.; Kaur, V. Simple sequence repeat markers in genetic divergence and marker-assisted selection of rice cultivars: A review. Crit. Rev. Food Sci. Nutr. 2015, 55, 41–49. [Google Scholar] [CrossRef] [PubMed]
  70. Gao, X.; Zhang, X.; Meng, H.; Li, J.; Zhang, D.; Liu, C. Comparative chloroplast genomes of Paris Sect. Marmorata: Insights into repeat regions and evolutionary implications. BMC Genom. 2018, 19, 133–144. [Google Scholar] [CrossRef]
  71. Park, I.; Choi, B.; Weiss-Schneeweiss, H.; So, S.; Myeong, H.-H.; Jang, T.-S. Comparative analyses of complete chloroplast genomes and karyotypes of allotetraploid Iris koreana and its putative diploid parental species (Iris series Chinenses, Iridaceae). Int. J. Mol. Sci. 2022, 23, 10929. [Google Scholar] [CrossRef]
  72. Boël, G.; Letso, R.; Neely, H.; Price, W.N.; Wong, K.-H.; Su, M.; Luff, J.D.; Valecha, M.; Everett, J.K.; Acton, T.B. Codon influence on protein expression in E. coli correlates with mRNA levels. Nature 2016, 529, 358–363. [Google Scholar] [CrossRef] [PubMed]
  73. Duan, H.; Zhang, Q.; Wang, C.; Li, F.; Tian, F.; Lu, Y.; Hu, Y.; Yang, H.; Cui, G. Analysis of codon usage patterns of the chloroplast genome in Delphinium grandiflorum L. reveals a preference for AT-ending codons as a result of major selection constraints. PeerJ 2021, 9, e10787. [Google Scholar] [CrossRef] [PubMed]
  74. Liu, C.; Chen, H.-H.; Tang, L.-Z.; Khine, P.K.; Han, L.-H.; Song, Y.; Tan, Y.-H. Plastid genome evolution of a monophyletic group in the subtribe Lauriineae (Laureae, Lauraceae). Plant Divers. 2022, 44, 377–388. [Google Scholar] [CrossRef] [PubMed]
Figure 1. Chloroplast genome structure map of L. aggregata to the left and 35 Lauraceae species. The genes inside and outside the circle are transcribed clockwise and counterclockwise, respectively. Genes with different functions are given different colors. The gray in the inner circle represents the GC content and shows the corresponding regions and corresponding lengths of the four blocks (LSC/SSC/IRa/IRb).
Genes 15 00263 g001
Figure 2. Comparison of junction boundaries in four regions (LSC/SSC/IRa/IRb) between L. aggregata and species of the same genus (a) and different genera (b). The number on the color gene indicates the distance between the gene and the edge of the border. Some details of junction boundaries between L. aggregata and species from the same genus are shown in Figure S1.
Genes 15 00263 g002
Figure 3. MAUVE alignment of chloroplast genomes between L. aggregata and species of the same genus (a) and species of different genera (b). L. aggregata is shown at the top as a reference genome. In each alignment, local collinear blocks are represented by areas of the same color connected by lines.
Genes 15 00263 g003
Figure 4. Comparison of nucleotide diversity (Pi) values of chloroplast genomes. (a) Comparison of Pi values between L. aggregata and 26 species of the same genus. (b) Comparison of Pi values between L. aggregata and 9 different genera of Lauraceae. X-axis: positions of the midpoints of a window, Y-axis: nucleotide diversity in each 600 bp window.
Genes 15 00263 g004
Figure 5. Comparison of SSRs and interspersed repeat sequences across 36 Lauraceae chloroplast genomes. (a) The number of the different SSRs types. (b) The number of SSR motifs in different repeat types. (c) The number of different interspersed repeat types.
Genes 15 00263 g005
Figure 6. Codon bias analysis of chloroplast genomes (a) and selection pressure analysis of protein coding genes (b) in 36 Lauraceae species. The amino acids corresponding to different codons in a graph are represented by arcs of different colors. The species of the same genus of Lindera and different genera of Lauraceae are distinguished by purple and green backgrounds.
Genes 15 00263 g006
Figure 7. The maximum likelihood (ML) method in (a) and Bayesian inference (BI) method in (b) for generating phylogenetic trees based on the common protein coding genes from 39 Lauraceae plants. The support rate values were shown on the branches of the trees.
Genes 15 00263 g007
Figure 8. An evolution tree with divergence time. The grey bar chart on the evolutionary branch represents the 95% HPD boundary, and the number represents the average of differentiation time. The two red, five-pointed stars represent the time of the fossil calibration. Different colors are used to represent different geological periods under the evolutionary tree.
Genes 15 00263 g008
Disclaimer/Publisher’s Note: The statements, opinions and data contained in all publications are solely those of the individual author(s) and contributor(s) and not of MDPI and/or the editor(s). MDPI and/or the editor(s) disclaim responsibility for any injury to people or property resulting from any ideas, methods, instructions or products referred to in the content.

