Article

Identification and Transcriptome Analysis of a Novel Allelic Mutant of NAL1 in Rice

1
College of Agricultural Science, Panxi Crops Research and Utilization Key Laboratory of Sichuan Province, Xichang University, Liangshan 615013, China
2
State Key Laboratory of Crop Gene Exploration and Utilization in Southwest China, Sichuan Agricultural University, Chengdu 611130, China
3
Institute of Crop Germplasm Resources, Guizhou Academy of Agricultural Sciences, Guiyang 550006, China
*
Author to whom correspondence should be addressed.
These authors contributed equally to this work.
Genes 2024, 15(3), 325; https://doi.org/10.3390/genes15030325
Submission received: 2 February 2024 / Revised: 28 February 2024 / Accepted: 29 February 2024 / Published: 2 March 2024
(This article belongs to the Section Plant Genetics and Genomics)

Abstract

:
Leaf morphology is a crucial aspect of plant architecture, yet the molecular mechanisms underlying leaf development remain incompletely understood. In this study, a narrow leaf mutant, m625, was identified in rice (Oryza sativa L.), exhibiting pleiotropic developmental defects. Pigment measurement revealed reduced levels of photochromic pigments in m625. Cytological analysis demonstrated that the m625 gene affected vascular patterns and cell division. Specifically, the narrowing of the leaf was attributed to a decrease in small vein number, shorter vein spacing, and an abnormal V-shaped arrangement of bulliform cells, while the thickening was caused by longer leaf veins, thicker mesophyll cells, and an increased number of parenchyma cell layers. The dwarf stature and thickened internode were primarily due to shortened internodes and an increase in cell layers, respectively. Positional cloning and complementation assays indicated that the m625 gene is a novel allele of NAL1. In the m625 mutant, a nucleotide deletion at position 1103 in the coding sequence of NAL1 led to premature termination of protein translation. Further RNA-Seq and qRT-PCR analyses revealed that the m625 gene significantly impacted regulatory pathways related to IAA and ABA signal transduction, photosynthesis, and lignin biosynthesis. Moreover, the m625 mutant displayed thinner sclerenchyma and cell walls in both the leaf and stem, particularly showing reduced lignified cell walls in the midrib of the leaf. In conclusion, our study suggests that NAL1, in addition to its known roles in IAA transport and leaf photosynthesis, may also participate in ABA signal transduction, as well as regulate secondary cell wall formation and sclerenchyma thickness through lignification.

1. Introduction

Leaf architecture, as one of the important agronomic traits, regulates photosynthesis, respiration, and transpiration, thereby impacting plant growth and development [1,2,3]. In rice, the top three leaves are considered to be the mainly source of carbohydrates that accumulate in the grains and are proposed to be long, erect, narrow, rolled, and thick in super-high-yielding hybrid rice [4,5]. Moderate leaf narrowing can increase dry matter accumulation by enhancing light capture, carbon fixation, and gas exchange during photosynthesis. Hence, identifying narrow leaf mutants and isolating genes associated with narrow leaf characteristic would be advantageous for genetic improvement and ideotype breeding in rice.
To date, numerous rice mutants related to narrow leaf have been discovered, with a reduction in leaf vein number, especially small veins being an obvious peculiarity [6,7,8,9]. It has been found that some narrow-leaf genes are related to plant hormones, particularly the IAA and GA pathways. For instance, NAL1, a putative trypsin-like serine and cysteine protease gene, regulates leaf vascular patterns, polar auxin transport, and leaf lateral outgrowth. Mutants with defects in NAL1 exhibit narrow leaves due to a significant reduction in the capacity of polar auxin transport [10,11]. NAL7 encodes a flavin monooxygenase and participates in tryptophan-dependent IAA biosynthesis. Its mutation leads to decreased IAA levels in the narrow leaf mutant nal7 [12]. Paralogs NAL2 and NAL3 encode the same transcriptional activator OsWOX3A protein, which influences the development of multiple organs, including the formation of vascular bundles and leaf lateral-axis outgrowth [13]. Moreover, OsWOX3A is a GA-responsive gene involved in the feedback regulation of GA biosynthesis to maintain GA homeostasis in rice. The double mutant nal2/3 displays extremely narrow leaves, while overexpressing transgenic plants exhibit wide leaves [14]. Additionally, some narrow-leaf genes are also connected to cell wall formation, such as NRL1, which encodes the cellulose synthase-like D4 protein and is responsible for cell wall biosynthesis and plant growth. In the nd1 mutant, the primary cell walls in stem and root tip cells exhibit structural defects [15,16]. NRL2 encodes a novel plant-specific protein and mediates leaf development by influencing secondary cell wall formation and phenylalanine metabolism. Its deficiency results in pleiotropic effects, including reduced leaf width and vein number, as well as impaired differentiation of abaxial sclerenchyma cells [3,17]. In addition, other genes, such as NAL9 regulating chloroplast biosynthesis, are also responsible for the regulation of narrow leaf [18]. Despite the identification of an increasing number of narrow-leaf genes in rice, the underlying regulatory mechanisms of leaf development remain unclear.
To improve comprehension of the genetic underpinnings governing leaf morphology, here we reported a rice narrow leaf mutant m625. It displayed a narrow-leaf phenotype due to a decrease in small vein number, shorter vein spacing, and an abnormal V-shaped arrangement of bulliform cells. Gene cloning and complementation assays revealed that the m625 gene is a novel allelic variant of NAL1. Through pigment measurement, paraffin section, RNA-Seq, and qRT-PCR analyses, we uncover new findings concerning the regulatory roles of NAL1 in rice growth and development. The present results suggest that apart from its known functions in IAA transport and leaf photosynthesis, NAL1 may also be involved in ABA signal transduction, as well as regulating secondary cell wall formation and sclerenchyma thickness through its impact on lignification.

2. Materials and Methods

2.1. Plant Materials and Growth Conditions

The mutagenesis library was constructed using 60Co radiation on Qiaogangzhenzhu, a local japonica rice variety in Guizhou province. A narrow leaf mutant, named m625, was screened from this library. For genetic analysis, the F2 population was used through crossing m625 with its wild parent Qiaogangzhenzhu. For gene mapping, the F2 population was obtained through crossing m625 with an indica restorer line R100. Plants were cultivated in the local fields in Xichang (latitude 27°57′ N, longitude 102°12′ E, and altitude 1531.1 m), Liangshan Yi Autonomous Prefecture, Sichuan, China.

2.2. Pigment Measurement

The photosynthetic pigment contents in the latest fully extended leaves were measured using an acetone extraction method at both the seedling and heading stages. Each sample containing 0.2 g of fresh leaves was immersed in an 80% acetone solution for 48 h. Afterwards, the samples were adjusted to a volume of 25 mL and measured using a UV-6000 UV–visible spectrophotometer (Metash, Shanghai, China) at three specific wavelengths (470 nm, 663 nm, and 646 nm). The entire process was conducted in darkness. The contents of chlorophylls and carotenoids were analyzed based on a calculation method described by Lichtenthaler and Wellburn [19].

2.3. Cytological Analysis

Paraffin sections were prepared as in the procedure described by Li et al. [20] to examine the morphological characteristics of tissues and cells. Leaves at the booting and heading stages, as well as stems at the heading stage, were individually fixed using a 50% formaldehyde–acetic acid–ethanol fixative (FAA) solution (Servicebio, Wuhan, China). Given the firmness of the stems, a softening process was necessary to facilitate slicing [21]. As such, we softened the stems with an ethylenediamine solution before slicing. After dehydration, transparency, embedding, sectioning, and staining, cross-sections of all samples were observed using a DS-U3 light microscope (Nikon, Tokyo, Japan). All samples were stained in accordance with the saffron-O and Fast Green Stain Kit (For Plant) (Solarbio, Beijing, China).

2.4. Gene Mapping and Marker Development

Two hundred and sixty recessive plants displaying the narrow-leaf phenotype from the (m625 × R100) F2 segregating population were chosen for gene mapping. Individual extractions of the whole genome DNA were carried out for m625, R100, and the 260 mutant individuals to facilitate linkage mapping analysis. Initially, over 300 pairs of simple sequence repeat (SSR) markers were screened for initial mapping. Subsequently, insertion/deletion (InDel) markers were designed for fine mapping according to genome sequence polymorphism between japonica and indica (Table S1). To expedite the identification of the m625 gene, leaves from 30 WT plants and 30 mutant plants from the (m625 × Qiaogangzhenzhu) F2 population were sent to Novogene Biotech Co., Ltd. (Beijing, China) for whole-genome sequencing. The MutMap analysis was performed between m625 and WT using Nipponbare as the reference genome sequence [22].

2.5. Complementation Analysis

To complement the m625 mutant, a 1749 bp cDNA sequence of LOC_Os04g52479 was acquired from Qiaogangzhenzhu using high-fidelity polymerase and the primers M625-CoF: 5′-GGTACCCGGGGATCCCTGCAGATGAAGCCTTCGGACGATAA-3′ and M625-CoR: 5′-TGCCTGCAGGTCGACCTGCAGTCATTTCTCCAGGTCAAGGC-3′ (both M625-CoF and M625-CoR contained the XbaI site). The resultant cDNA fragment was constructed to the vector pCAMBIA2300 carrying the rice Actin 1 promoter through homologous recombination. The plasmid pC2300-M625 was delivered into m625 via Agrobacterium-mediated genetic transformation. The complementary transgenic lines were identified using specific primers M625-TraF/R, which targeted the M625 gene and the pCAMBIA2300 vector, respectively (Table S1).

2.6. RNA-Seq Analysis

Leaves at the tillering and the top three leaves at the heading stage, as well as stems at the heading stage, were used to extract total RNA using an RNA extraction kit (Qiagen, Hilden, Germany). Construction and sequencing of cDNA libraries were performed by Novogene Biotech Co., Ltd. (Beijing, China). Identification of the differentially expressed genes (DEGs) were carried out following a previously described method [23,24]. DEGs were subjected to the Kyoto Encyclopedia of Genes and Genomes (KEGG) analysis using KEGG databases [25].

2.7. qRT-PCR Analysis

Leaves at the tillering and the top three leaves at the heading stage, as well as stems at the heading stage, were used to extract total RNA using an RNA isolator kit (Vazyme, Nanjing, China). Reverse transcription was performed on the extracted RNA using a reverse transcription kit from the same manufacturer. The cDNA was utilized for qRT-PCR analysis employing a real-time PCR system (Bio-Rad, Berkeley, CA, USA), with Actin 1 serving as an internal control. The expression levels of five genes related to IAA and ABA signal transduction, four genes associated with photosynthesis, and seven genes involved in phenylpropanoid biosynthesis were analyzed through qRT-PCR. The qRT-PCR primers can be found in Table S2.

3. Results

3.1. Phenotypic Characterization of the m625 Mutant

The m625 mutant, derived from the Guizhou landrace rice Qiaogangzhenzhu (japonica cv.) through radiation mutagenesis, exhibited narrow leaves and short plant height during the tillering stage, which became more pronounced after heading (Figure 1A–H). At the heading stage, the lengths of the top three leaves in m625 were significantly reduced by 69.2%, 59.9%, and 48.5%, with a corresponding dramatic reduction in leaf width by 66.7%, 62.1%, and 55.5%, respectively (Figure 1I,J). By maturity, m625 was around 50% shorter in plant height compared to the WT (Figure 1K). To explore the cause of dwarfism, we further measured the length of internodes I–V. The results showed that the dwarfing phenotype in m625 was due to the shortening of each internode (Figure 1L,M). Additionally, other agronomic traits were also examined. Apart from the seed setting rate, m625 exhibited a significant increase in effective panicle number but decreases in panicle length, primary branch number, secondary branch number, and grain number per panicle (Figure S1). These observations strongly suggest that m625 displays pleiotropic developmental defects.

3.2. Pigment Contents of the m625 Mutant

For analyzing the impact of the narrow leaf mutation in m625 on photosynthesis, the levels of photosynthetic pigments were examined at different growth stages. The m625 mutant showed a notable reduction in total chlorophyll, chlorophyll a, chlorophyll b, and carotenoids compared to the WT at the seedling and heading stages (Figure 2). This indicates that the narrow-leaf characteristic of m625 influences the photosynthetic pigment levels in leaves.

3.3. Cytological Characteristics of the m625 Mutant

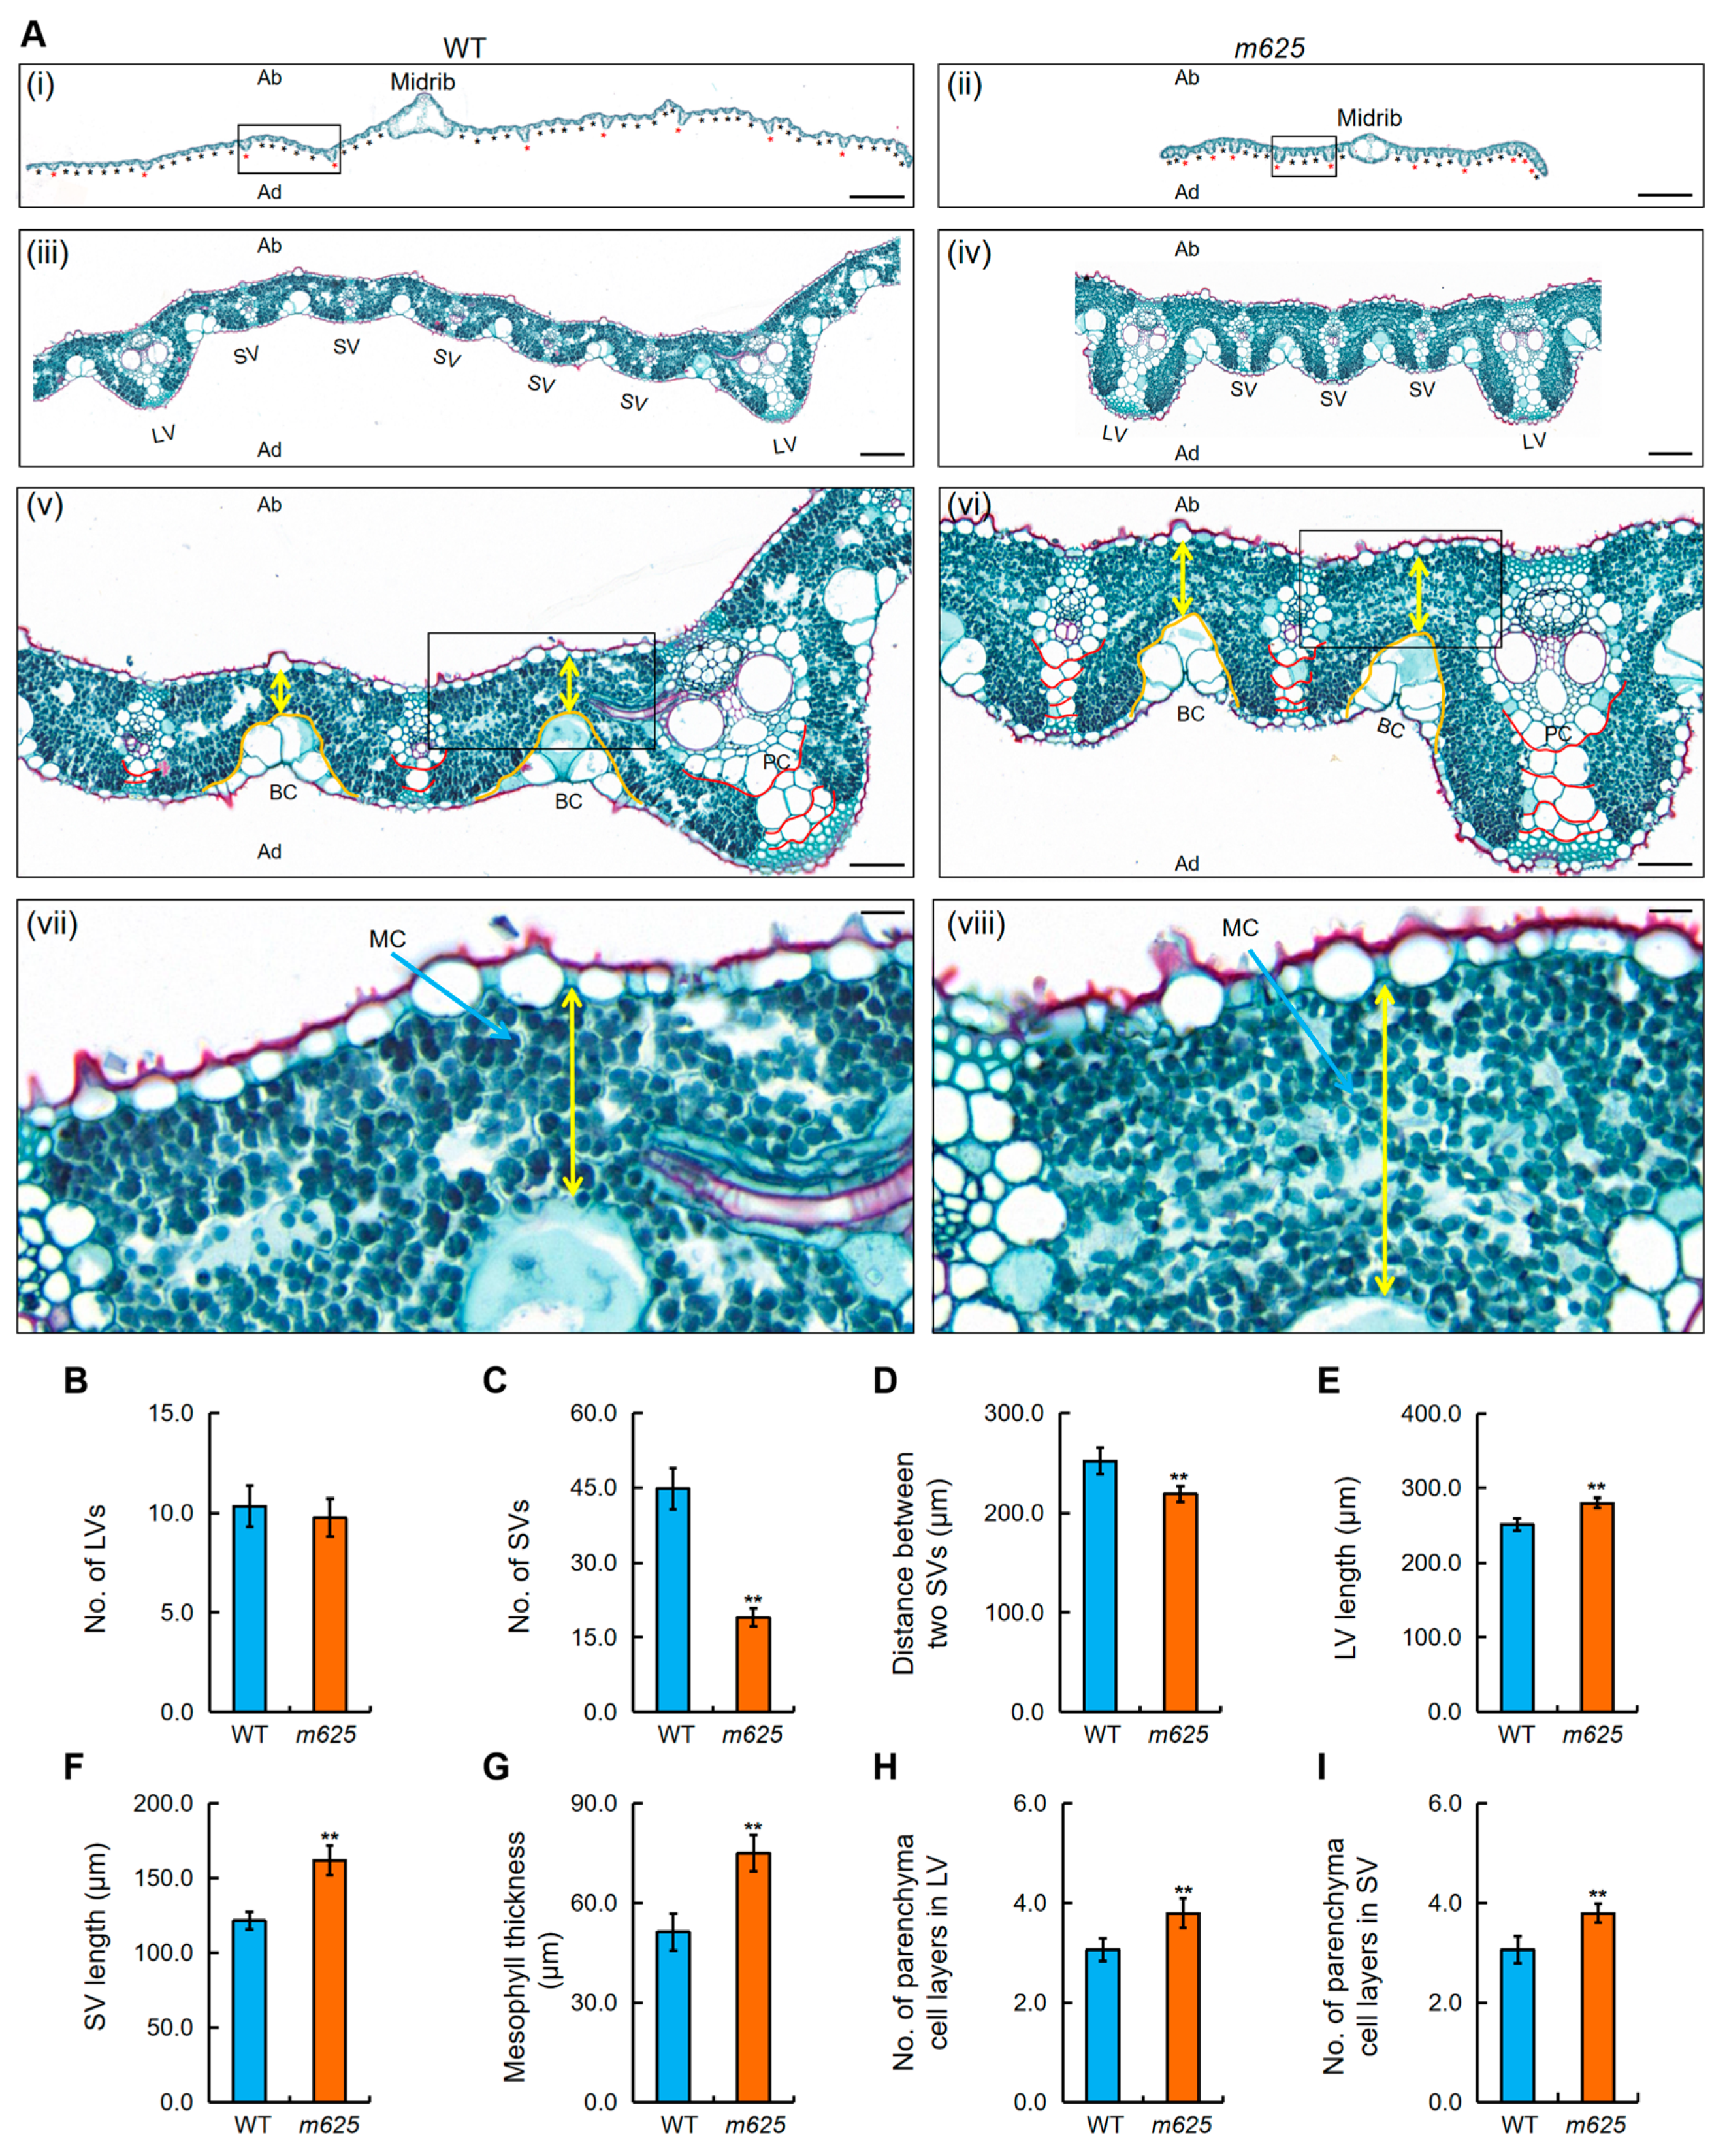
To investigate the cause of leaf narrowing, paraffin sections of the leaves were produced. When comparing the leaf vascular systems of m625 and the WT, we found no significant difference in large vein (LV) number. However, there was a significant decrease in small vein (SV) number in m625 (Figure 3A–C). The WT typically had five to six SVs between LVs, whereas m625 only had two to three SVs, with a noticeably shorter distance between them (Figure 3A,D). Moreover, the bulliform cells (BCs) in the WT exhibited a slight U-shaped arrangement, while those in m625 showed a slight V-shape (Figure 3A). These findings suggested that the narrow leaf in m625 was attributed to a decreased number of SVs, shorter vein spacing, and an abnormal V-shaped arrangement of BCs. Another notable characteristic of m625 was its thickened leaves. Based on a series of cross-sectional images, we observed remarkable increases in the length of LVs and SVs in m625 leaves (Figure 3A,E,F). Subsequently, we quantified the mesophyll thickness and the number of parenchyma cell layers. The mesophyll thickness in m625 was significantly higher, indicating an increase in the number of mesophyll cell layers in m625 (Figure 3A,G). Additionally, the m625 leaves exhibited four layers of parenchyma cells within LVs and SVs, while most wild-type leaves contained two to three layers (Figure 3A,H,I). Therefore, the above results demonstrate that the m625 gene affects the vascular pattern and cell division in the leaf.
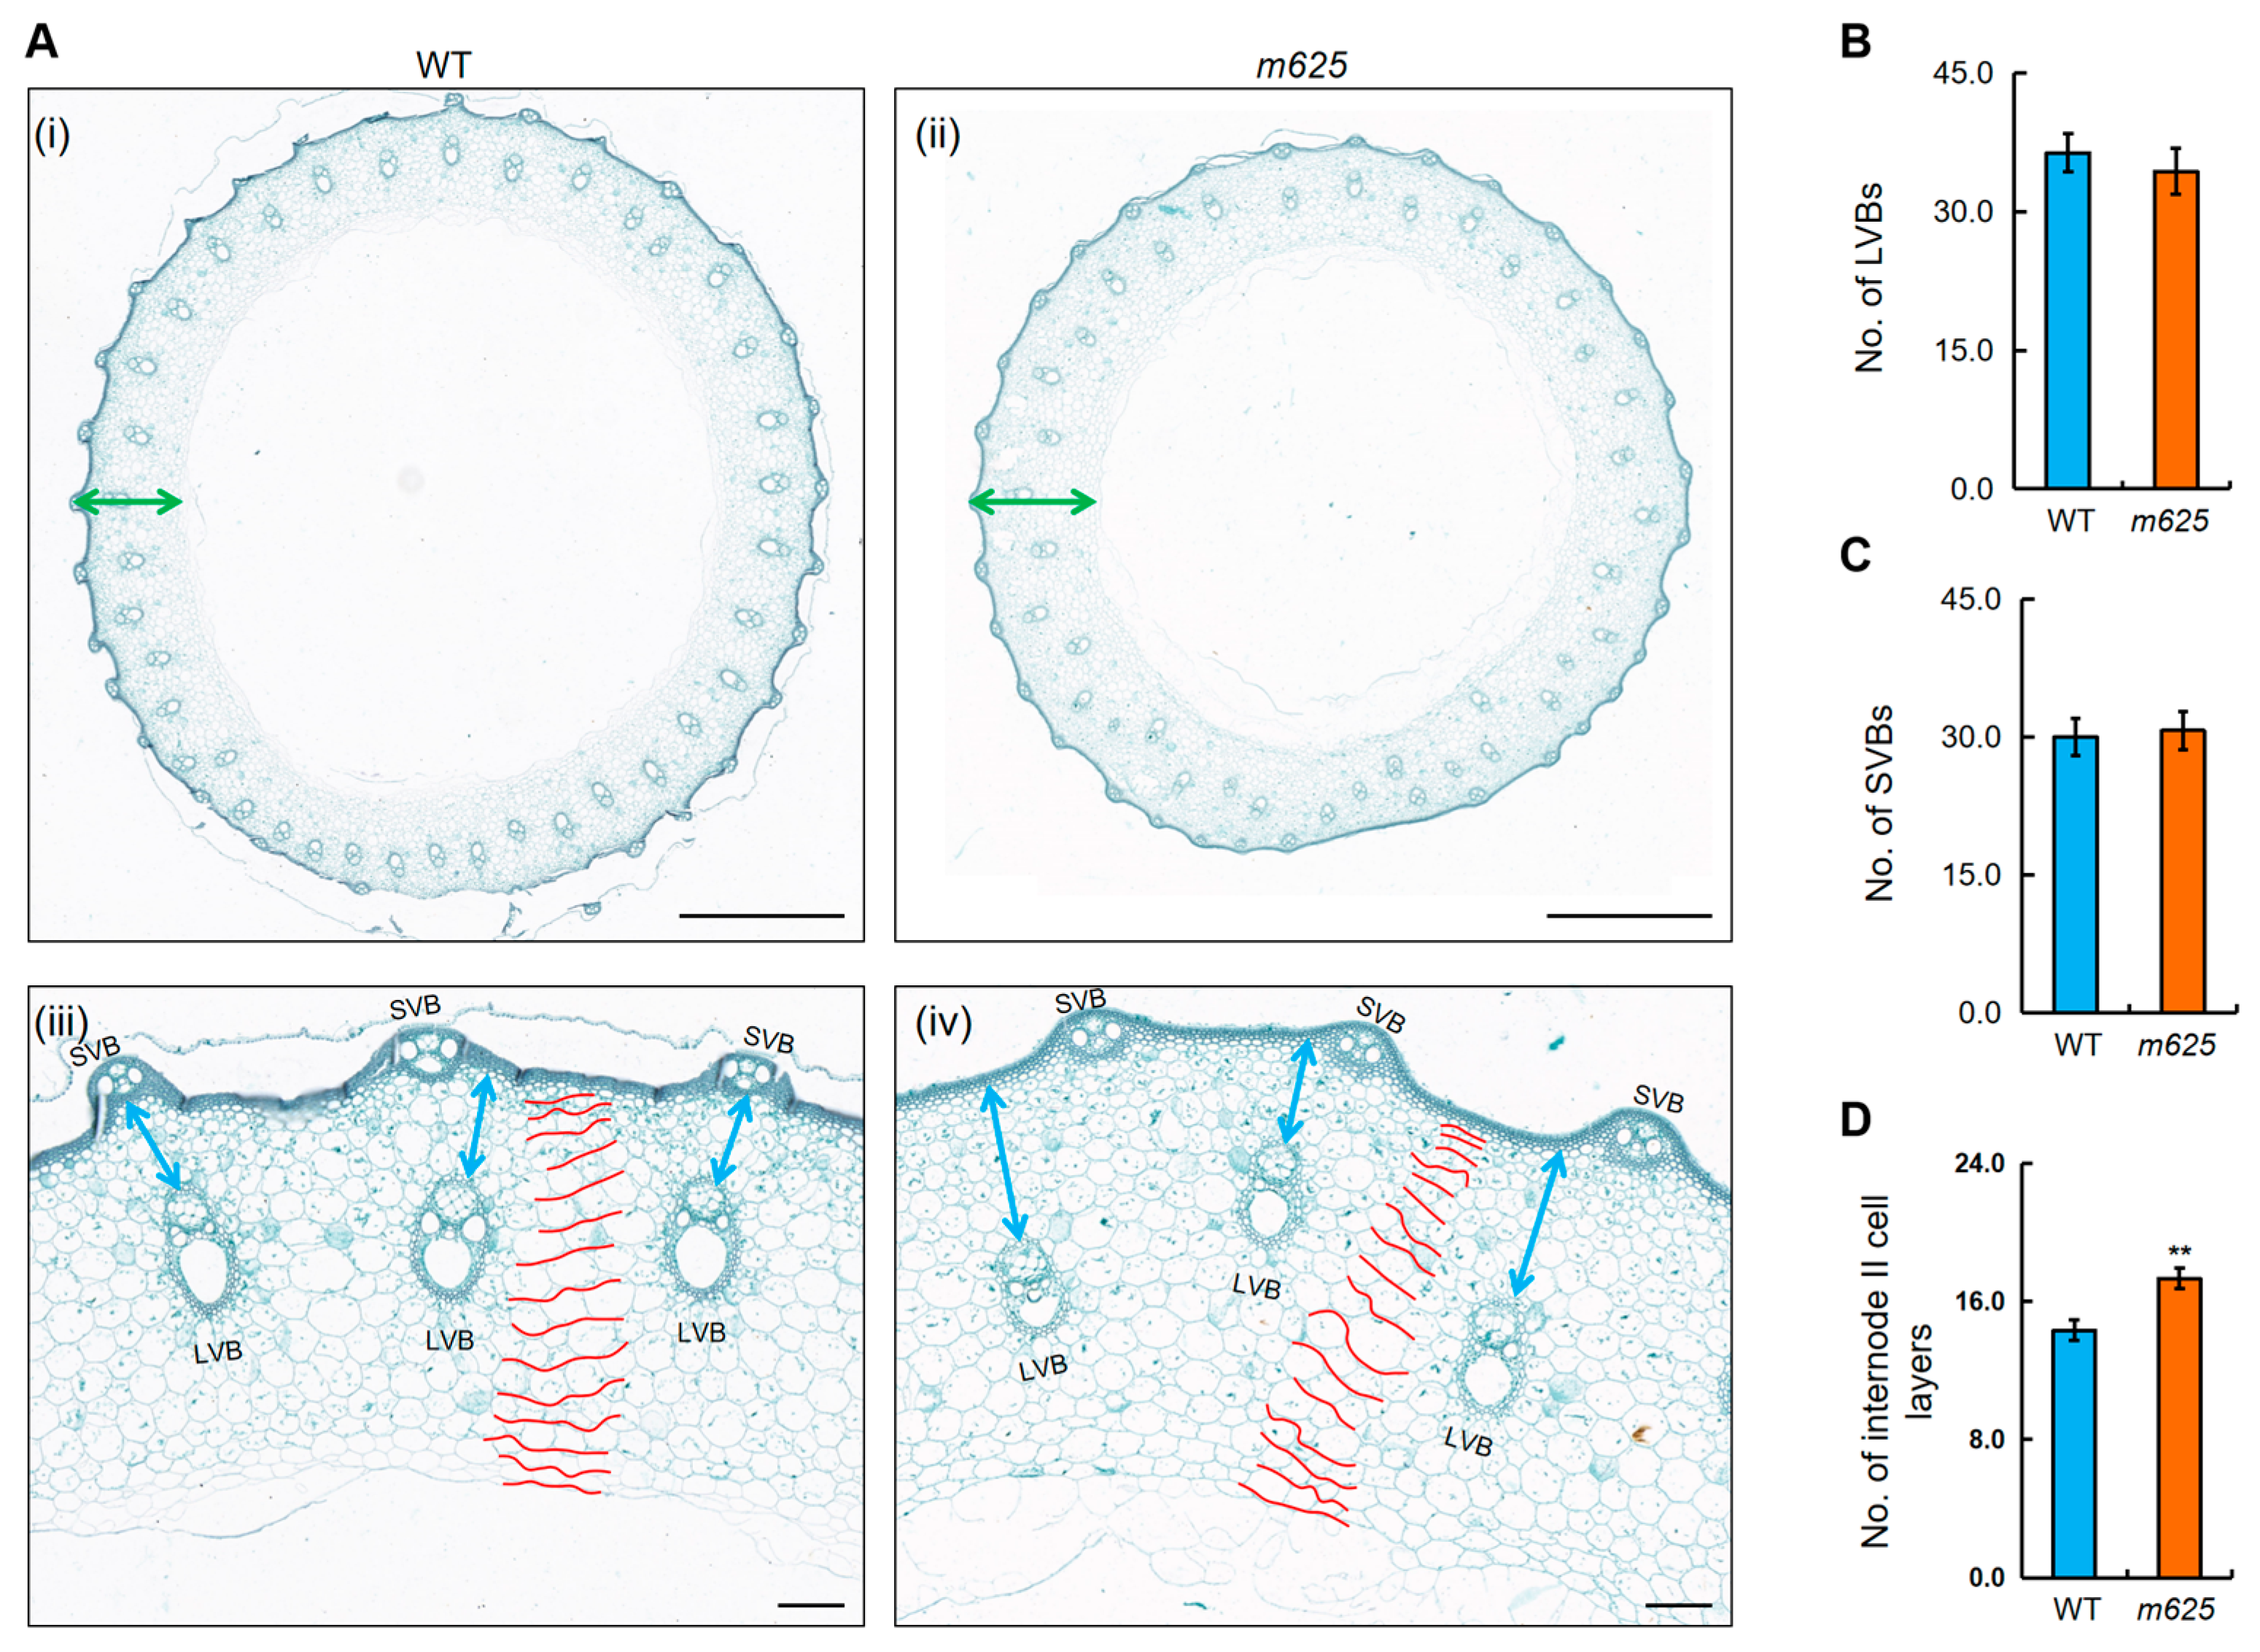
To investigate whether this mutation has a similar effect on the stem as on the leaf, paraffin sections of internode II of the main stem were produced. Although the number of large and small vascular bundles in m625 did not show significant changes, we observed alterations in the distribution and size of large vascular bundles (LVBs) (Figure 4A–C). In the cross-sections of the WT internode II, LVBs were well-organized, whereas in m625, LVBs were smaller and disorganized, and were located closer to the inner ring and further from the epidermis (Figure 4A). Subsequently, we manually recorded the cell layer number and found that the average number of cell layers in internode II of m625 was significantly higher (Figure 4D). These findings suggest that the thickened internode in m625 resulted from an increase in cell layers. Therefore, the m625 gene has a similar effect on the vascular pattern and cell division in the stem.

3.4. Cloning of the m625 Gene

For genetic analysis, the F2 (m625 × Qiaogangzhenzhu) population was constructed. All F1 plants displayed a normal phenotype, while the narrow-leaf phenotype in the F2 population followed a segregation ratio of 3:1 (Table S3), indicating that a single Mendelian factor controlled the narrow-leaf phenotype of the mutant m625.
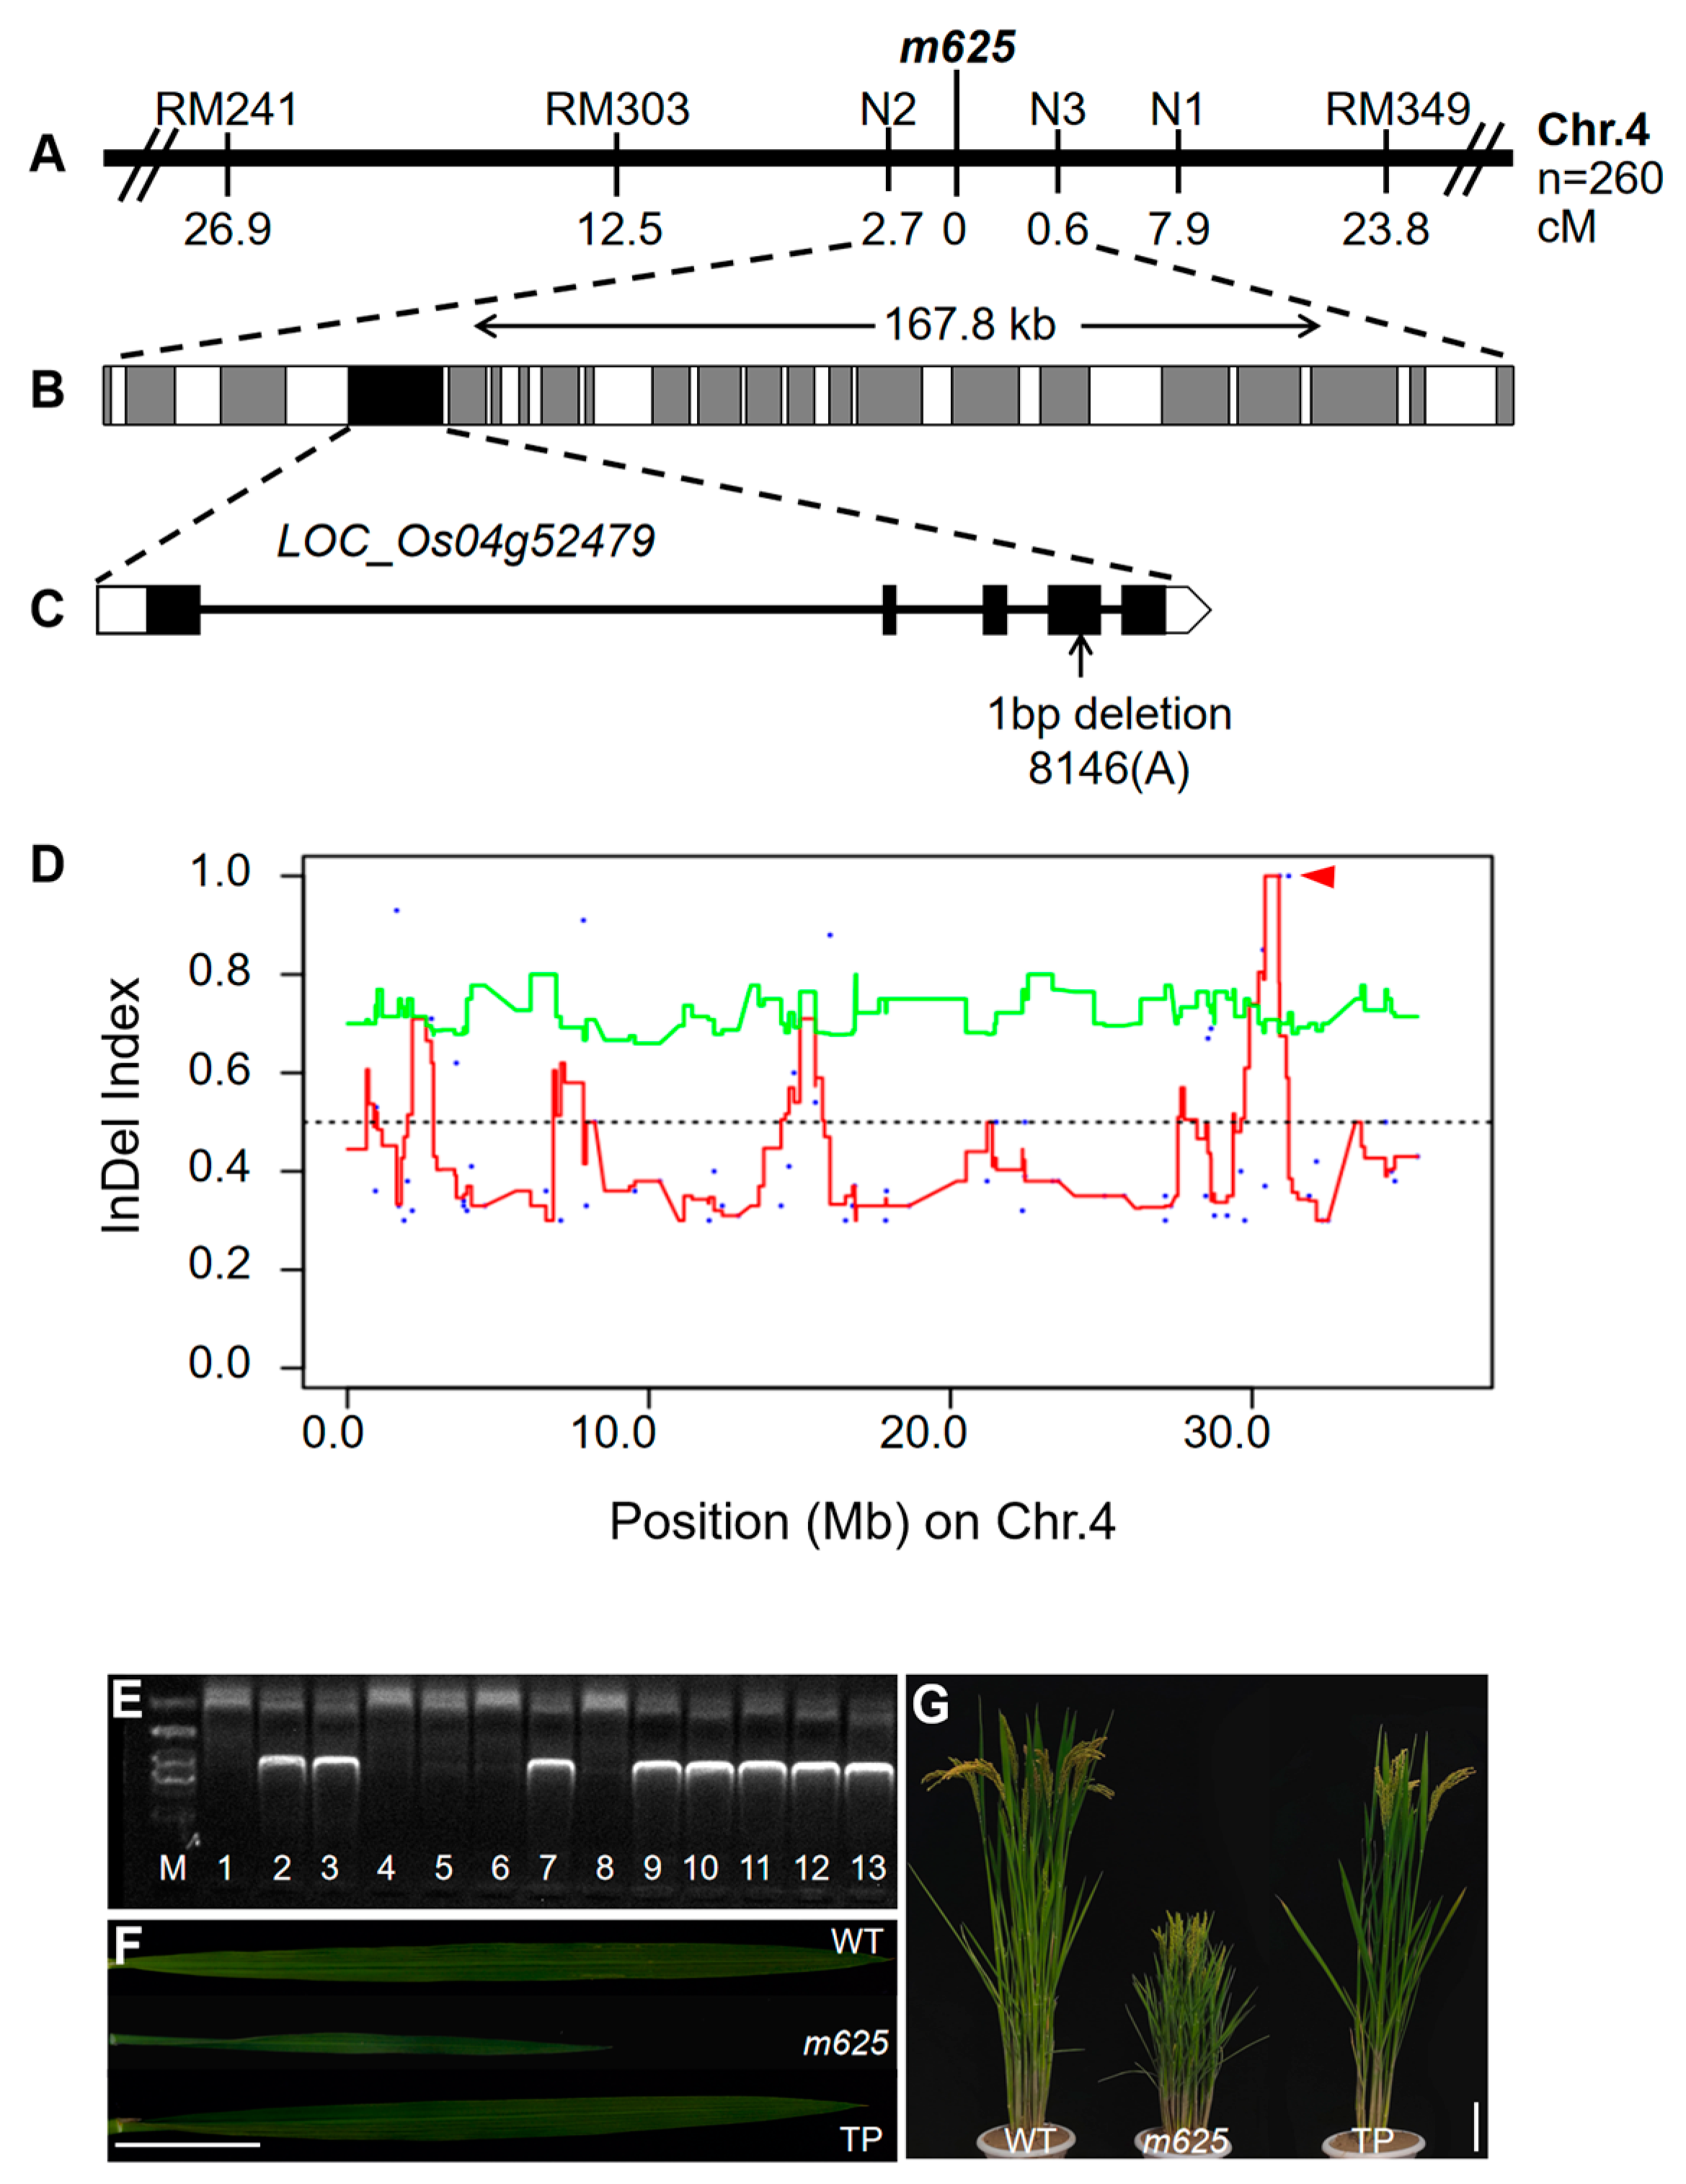
To fine map the m625 locus, a total of 260 individuals with the narrow leaf trait were selected from the F2 (m625 × R100) population. The initial mapping indicated that the m625 gene was positioned between the SSR markers RM241 and RM349 on the long arm of chromosome 4. Then, one SSR and three InDel markers (Table S1) were developed to further narrow down the m625 gene to a 167.8 kb region between N2 and N3 (Figure 5A). Within this region, 22 putative genes have been annotated by the Michigan State University (MSU) Rice Genome Annotation Project, including a narrow-leaf gene NAL1 (LOC_Os04g52479), which has been cloned (Figure 5B; Table S4). Additionally, we performed whole-genome resequencing on 30 normal plants from the WT parent and 30 narrow-leaf plants from the F2 (m625 × Qiaogangzhenzhu) population. MutMap analysis identified a nucleotide deletion with an InDel index value of 1.0 in this region. This deletion was found in the fourth exon region of LOC_Os04g52479 (Figure 5D). Therefore, LOC_Os04g52479 was firstly considered as the candidate gene for m625.
Subsequently, the LOC_Os04g52479 gene was amplified and sequenced in m625 and the WT, confirming a single nucleotide deletion at position 8146 (A) in the genomic sequence of LOC_Os04g52479 in m625, consistent with the MutMap analysis. Moreover, cDNA sequencing analysis revealed a nucleotide deletion at position 1103 in the cDNA of this gene (Figure 5C), causing a change in the amino acid at position 368 from Asp to Ala, and affecting the translation of all subsequent amino acids. Ultimately, a stop codon was formed at amino acid position 391, resulting in premature termination of protein translation.

3.5. Complementation of the m625 Mutant

For confirming that the narrow-leaf phenotype of m625 was due to the mutation in the NAL1 (LOC_Os04g52479) gene, functional complementation was conducted by introducing the cDNA of NAL1 from Qiaogangzhenzhu driven by the rice Actin 1 promoter into m625. Seven independent transgenic lines possessed positive PCR bands (Figure 5E) and displayed a normal phenotype similar to the WT (Figure 5F,G and Figure S2), demonstrating that NAL1 is the candidate gene responsible for the mutation in m625.

3.6. Transcriptome Analysis of the m625 Mutant

To further understand the biological function of NAL1, RNA-Seq experiments were conducted. A total of 571 DEGs were identified in the leaf at the tillering stage, with 164 genes upregulated and 407 genes downregulated. Moving on to the heading stage, 676 DEGs were found in the leaf, with 310 genes upregulated and 366 genes downregulated. Similarly, 746 DEGs were identified in the stem, with 469 genes upregulated and 277 genes downregulated (Figure S3; Table S5). Subsequently, based on the function annotations of DEGs, we completed KEGG analysis in different groups.
In the leaf at the tillering stage, we found that the pathways related to plant hormone signal transduction and plant–pathogen interaction had the highest number of DEGs (Figure 6A; Table S6). Given previous studies highlighting the function of NAL1 in regulating polar auxin transport [10,11], we specifically focused on the plant hormone signal transduction pathway. Within this pathway, the DEGs were mainly involved in IAA and ABA signaling, such as OsIAA2 and OsIAA15 (auxin-responsive Aux/IAA gene family members) [26], as well as OsPP2C09, OsbZIP23, and OsSIPP2C1 (ABA signal regulators) [27,28,29]. As such, we detected these five genes using qRT-PCR. As a result, except for OsIAA15, the expression of the other four genes showed a significant reduction in m625 (Figure 6D). The data not only suggested the involvement of NAL1 in regulating IAA and ABA signal transduction in the leaf but also validated the reliability of our RNA-Seq analysis.
Furthermore, in the leaf at the heading stage, we identified 33 DEGs related to photosynthesis, which were primarily involved in photosynthesis, glyoxylate and dicarboxylate metabolism, carbon fixation in photosynthetic organisms, porphyrin and chlorophyll metabolism, and photosynthesis-antenna proteins (Figure 6B; Table S7). Among these DEGs, 27 genes were downregulated, including OsCPL1 (chloroplastic-like protein) [30], OsPsbS1 (photosystem II protein) [31], OsPsbP (polypeptide of the oxygen-evolving complex of photosystem II) [32], OsPsbR3 (photosystem II polypeptide) [33], OsFd1 (photosynthetic ferredoxin) [34], OsRBCS3 and OsRBCS4 (small subunits of Rubisco) [35]. The expression levels of several of them were examined by qRT-PCR and the results were consistent with the RNA-Seq analysis (Figure 6E), indicating the important role of NAL1 in leaf photosynthesis.
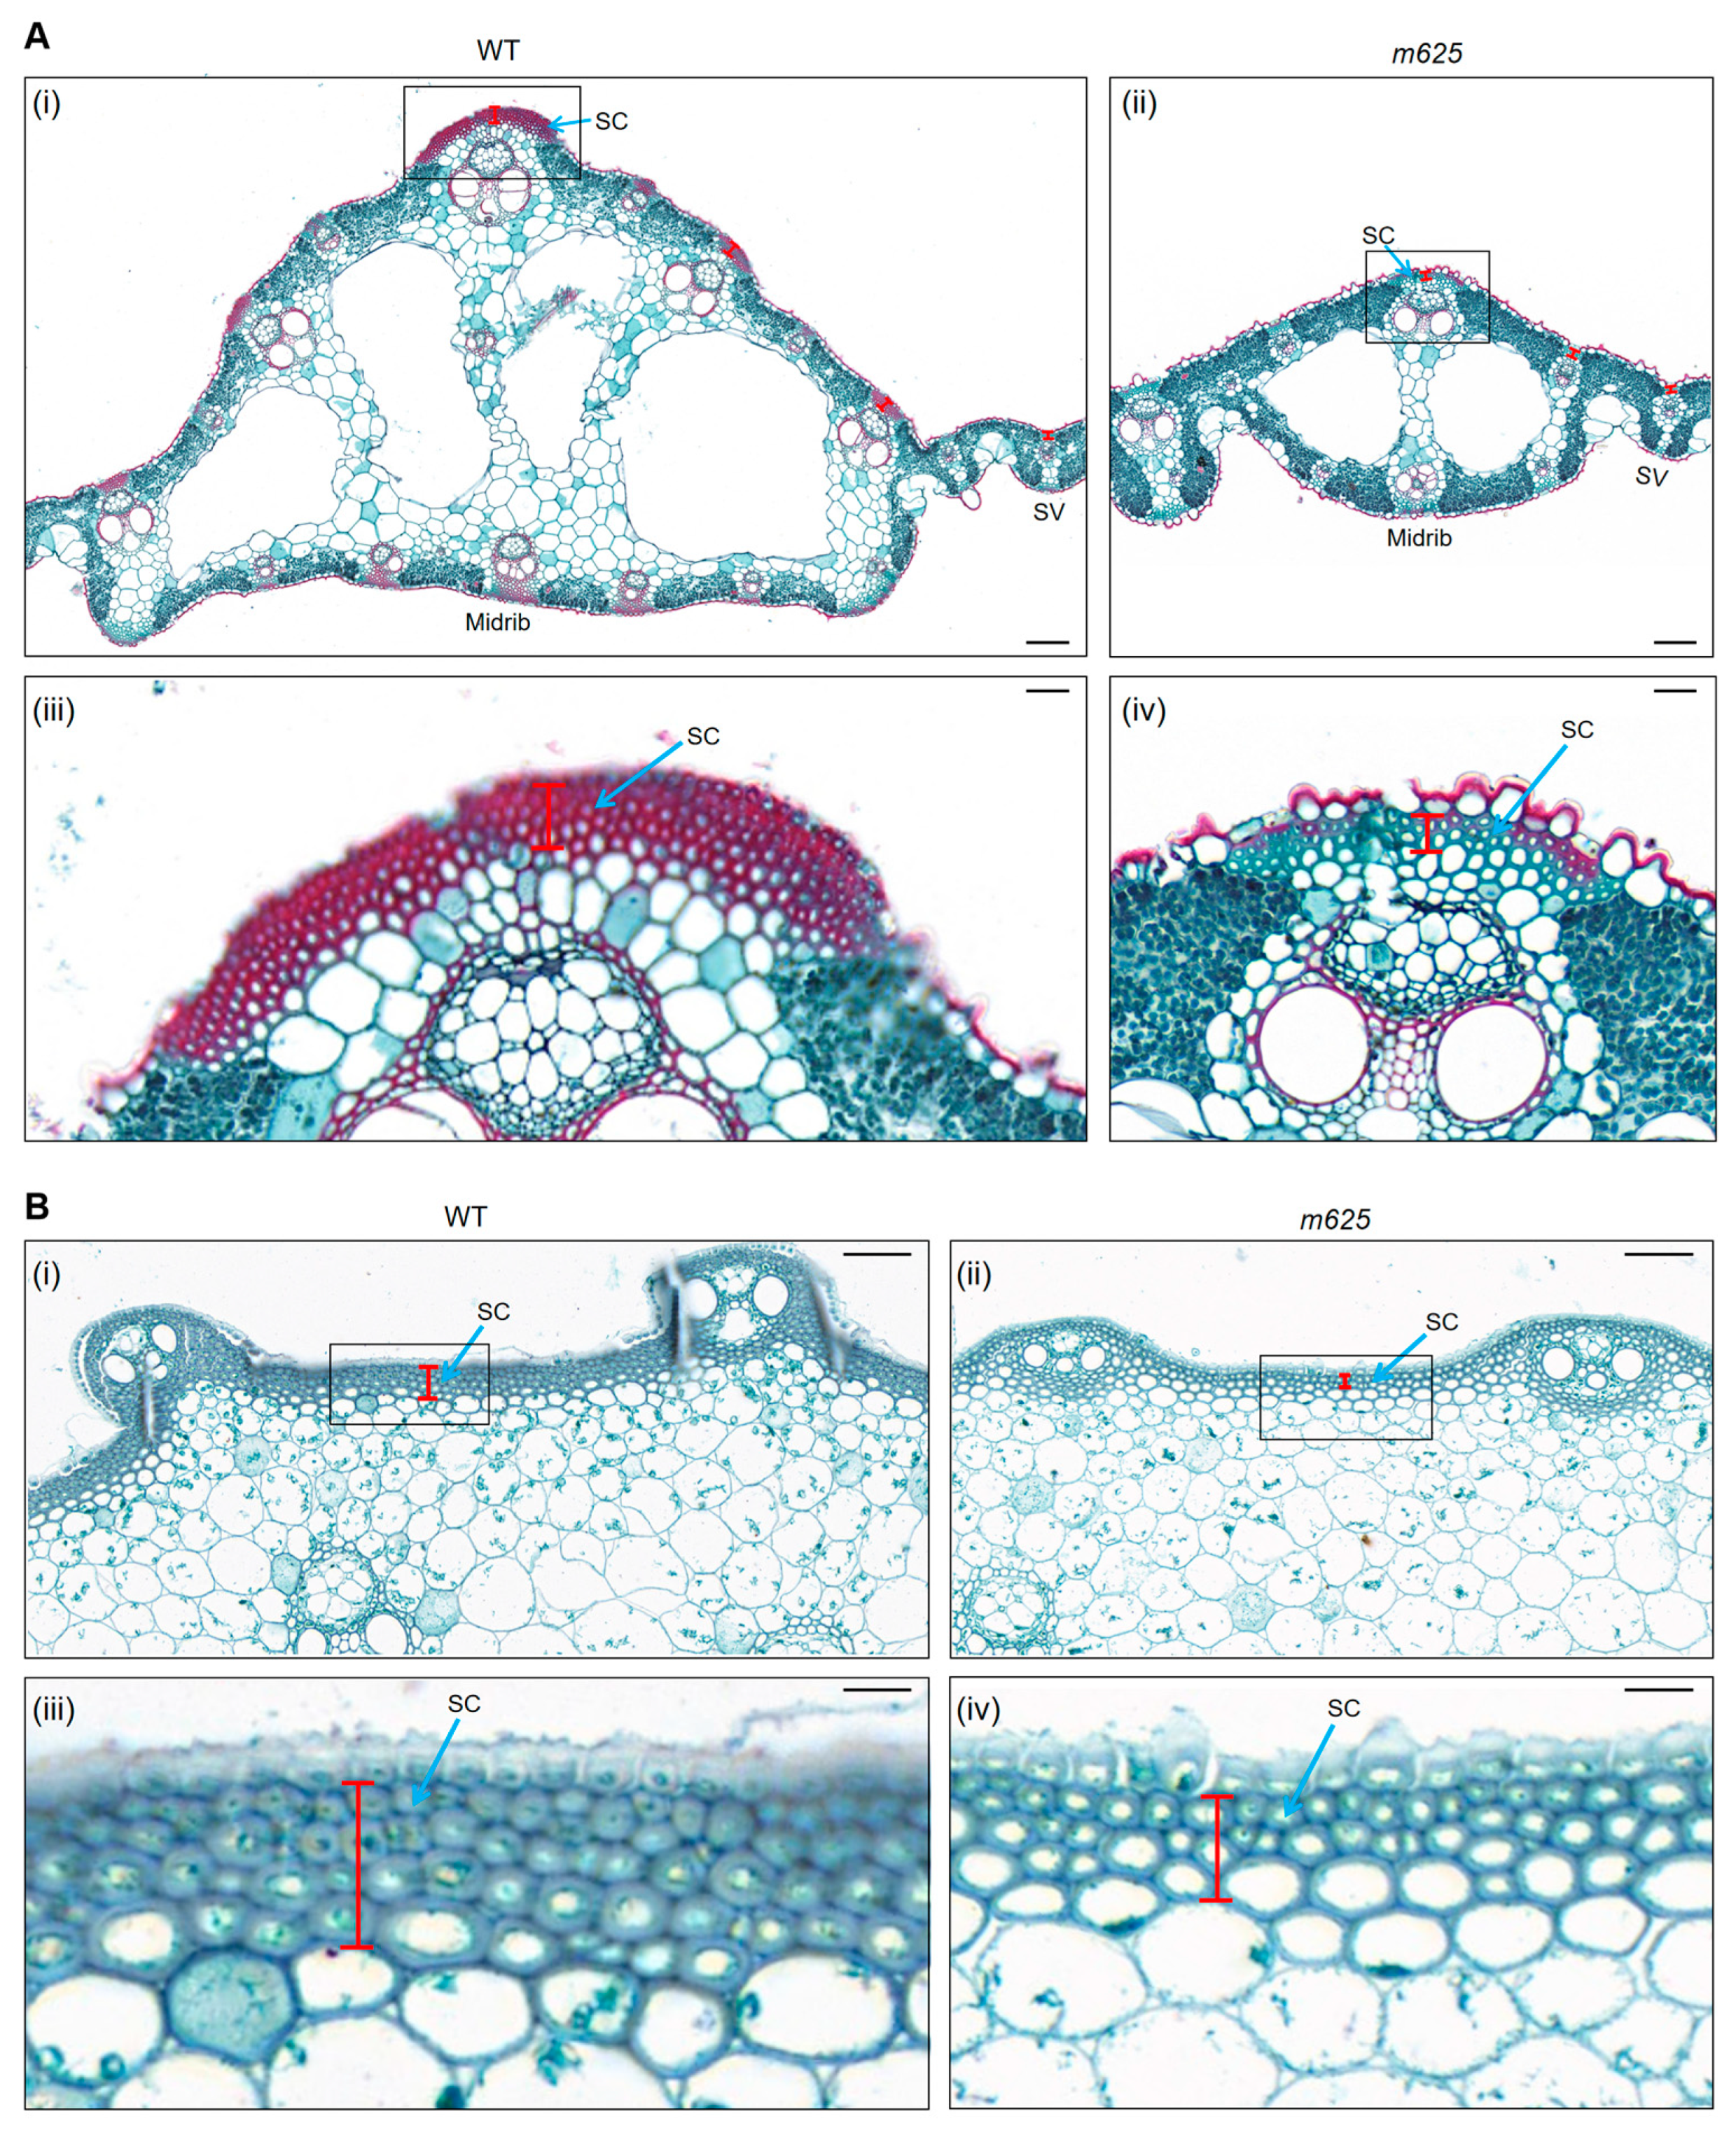
Additionally, we have made another finding that the DEGs in both leaf and stem at the heading stage were primarily associated with phenylpropanoid biosynthesis, specifically focusing on lignin biosynthesis (Figure 6B,C; Tables S7 and S8). Some of these genes are crucial for the formation and maintenance of cell walls. For example, Os4CL2, Os4CL3 and Os4CL5 encode 4-Coumarate:Coenzyme A Ligase, which participates in the phenylpropanoid metabolic pathway for the biosynthesis of monolignols and flavonoids. The enhanced expression of Os4CL3 and Os4CL5 significantly promotes the accumulation of lignin subunits G and S, leading to the strengthening of cell walls, particularly in the sclerenchyma thickness [36,37]. OsCCR14 encodes a cinnamoyl–CoA reductase that affects lignification and the thickening of secondary cell walls in rice anthers and roots [38]. OsPAL5, OsPAL6, and OsPAL7 are phenylalanine ammonia–lyase genes that regulate the biosynthesis and accumulation of lignin [39,40]. Therefore, we further examined the expressions of these genes, and found that all the detected genes were downregulated in the m625 leaf and stem (Figure 6F,G). Considering that the accumulation of lignins directly affects the secondary cell wall formation and sclerenchyma thickness, we observed the sclerenchyma in the leaf and stem at the heading stage. Compared to the WT, the mutant m625 displayed thinner sclerenchyma in both leaf and stem, with quantitative analysis confirming a significant decrease in sclerenchyma thickness (Figure 7 and Figure S4). Furthermore, a reduction in cell wall thickness was observed in the sclerenchyma cells of the m625 leaf and stem, especially in the stem. In addition, a notable observation was less lignified cell walls in the midrib of the leaf in m625 (Figure 7). Softening typically affects lignified staining under the same conditions, which may result in the absence of results for lignified cell wall staining in the stem. Although red stained lignified cells were not clearly observed in the stem, the existing findings have provided further support for the role of NAL1 in lignification, secondary cell wall formation, and sclerenchyma thickness.

4. Discussion

NAL1 (LOC_Os04g52479), which encodes a plant-specific protein, has been reported to regulate leaf size [10,41], leaf photosynthesis [42,43], leaf chlorophyll content [44], root development [11,45], plant height [10,45,46,47], large vascular bundle phloem area (LVPA) in the panicle neck [48], secondary branch number [49], and grain number and grain yield [45,49,50]. In previous studies, some allelic mutants and natural variants of NAL1 have been identified in rice. Most of these natural variants exhibit normal stature in plants and have positive effects on many agronomic traits, including enhanced photosynthesis, increased flag leaf size, leaf width, panicle length, grain number, LVPA in the panicle neck, and regulation of source–sink–flow relationship [42,43,44,47,49]. Consequently, NAL1 has been suggested as a valuable tool for improving photosynthesis and yield by manipulating leaf characteristics [31]. However, the precise mechanisms through which NAL1 influences multiple biological processes in rice are still not fully understood. To gain a deeper understanding of how NAL1 regulates rice growth and development, it is essential to identify additional allelic mutants of NAL1 and explore novel regulatory pathways.
Here, we discovered a novel allelic mutant of NAL1, m625, which exhibited pleiotropic phenotypes, including narrow leaf, dwarfism, multiple tillers, decreased panicle length, panicle branch number, and grain number per panicle (Figure 1 and Figure S1). Although the phenotypes of m625 were similar to those previously reported in other NAL1 allelic mutants, such as nal1 (ZheFu802) [10], nal1 (FL244) [11], nal5 [11], nal1-2 [46], and nal1-3 [46], there were still some differences in mutation traits. By analyzing these subtle phenotypic variations in m625, we found that NAL1 is not only involved in photosynthesis and IAA signaling, but also potentially plays important roles in ABA signaling, lignin biosynthesis, secondary cell wall formation, and sclerenchyma thickness.

4.1. NAL1 Regulate Leaf Photosynthesis

Several studies have emphasized the significance of NAL1 in photosynthesis. Takanari (indica cv.) was shown to enhance mesophyll cell number, leaf thickness, leaf width, and photosynthesis rate by carrying the high-photosynthesis allele of NAL1 [42]. Additionally, 9311-NIL with the Nipponbare NAL1 exhibited increased leaf length, width, and chlorophyll content compared to 9311 [44]. A gradual decrease in leaf length and width was observed from 9311-NIL (full NAL1 function) to 9311 (partial loss of NAL1 function) and 9311-nal1 (complete loss of NAL1 function), while the leaf photosynthetic rate, expression of photosynthesis-related DEGs, and leaf thickness showed a gradual increase in the same order [43]. Meanwhile, we can clearly know from the above that the relationship between leaf dimensions (length, width, thickness) and photosynthesis is not consistently positive, as it is influenced by various factors.
Similarly, our results also provided evidence for the role of NAL1 in controlling leaf photosynthesis. Specifically, the mutant m625 exhibited reduced levels of photosynthetic pigments and downregulation of numerous photosynthesis-related DEGs (Figure 2 and Figure 6B; Table S7). However, our findings presented inconsistencies when compared to previously reported results that the partial or complete loss of NAL1 function can increase expressions of photosynthesis-related DEGs [43]. Upon analysis, we hypothesized two potential reasons for this disparity. Firstly, previous studies usually analyzed RNA-Seq data from flag leaves, whereas our analysis focused on the top three leaves, which could be a contributing factor to the inconsistent outcomes. Secondly, it is important to note that m625 is a japonica rice, whereas Takanari, 9311-NIL, 9311, and 9311-nal1 are indica rice. In the NAL1 gene, two rice subspecies have three SNP substitutions, leading to three amino acid changes, one of which affects the protein domain of NAL1, resulting in structural and functional differences [44]. In addition to NAL1, other upstream and downstream genes of NAL1 in the photosynthesis pathway may also display genetic variations among different subspecies and cultivars. Furthermore, different mutation sites in NAL1 mutants can alter protein structure, potentially influencing interactions with other proteins and overall protein functions. A comparison of Takanari, 9311-NIL, 9311, and 9311-nal1 with m625 revealed discrepancies in mutations within the NAL1 gene. Takanari displayed 10 SNPs with 3 causing amino acid substitutions [42]. Fruthermore, 9311 has the same three amino acid substitutions, while 9311-NIL carried a Nipponbare NAL1 from the japonica rice variety, and 9311-nal1 showed a 1 bp insertion and a 1 bp deletion in the NAL1 coding region, resulting in the loss of NAL1 function [43,44]. On the other hand, the m625 mutant presented a 1 bp deletion in the NAL1 protein domain, causing premature termination of protein translation. Although m625, along with Takanari, 9311, and 9311-nal1, belongs to the NAL1 function loss category, its genetic background and mutation site differ from them. Therefore, discrepancies in mutation sites and genetic backgrounds in m625 may be the primary reasons for the inconsistent results.

4.2. NAL1 May Be Involved in IAA and ABA Signal Transduction to Regulate Rice Growth and Development

Plant hormones are known to regulate various physiological and developmental processes in rice. Mutations of NAL1 have been identified to affect polar auxin transport activity [10,11]. However, in this study, our results suggested a novel finding that NAL1 may be involved in regulating the ABA signal transduction in addition to IAA. RNA-Seq and qRT-PCR analyses revealed that the transcript levels of AUX/IAA genes (OsIAA2, OsIAA15) and ABA signal regulators (OsPP2C09, OsbZIP23, and OsSIPP2C1) were reduced in m625 (Figure 6A,D; Table S6). As early IAA response genes in IAA signaling, AUX/IAA regulate the expression of auxin-response genes by interactions with ARFs [51,52], and the IAA and ABA signaling genes also experience significant crosstalk. Furthermore, OsPP2C09 exhibits PP2C phosphatase activity, and its mutation inhibits growth, including plant height and panicle length [27]. OsbZIP23 is a transcriptional regulator, and its overexpression shows a significant improvement in yield-related traits [28,53]. OsSIPP2C1 is negatively regulated by ABL1 and is responsible for panicle development in rice [29]. Based on the above analyses, we propose that the reduced expression levels of these genes may contribute to the phenotypes of narrow leaves, dwarfism, and small panicles in m625. Additionally, NAL1 protein has been identified to degrade FZP and OsTPR2. Reducing FZP expression or enhancing NAL1 expression have been shown to increase secondary branch number, grain number, and grain yield [49]. Mutations in NAL1 protein result in elevated OsTPR2 expression and reduced expression of downstream genes associated with IAA and strigolactone (SL) signaling, leading to narrower flag leaf, decreased plant height, lower grain number, and reduced grain yield [45]. Therefore, as a pleiotropic gene, NAL1 is likely to be involved in IAA and ABA signal transduction to regulate rice growth and development.

4.3. NAL1 May Regulate the Secondary Cell Wall Formation and Sclerenchyma Thickness through Lignification

Compared to previous studies, our research has made another novel discovery regarding the function of NAL1. In paraffin sections, we observed that the mutant m625 exhibited thinner sclerenchyma and cell walls in the leaf and stem, with particularly less lignified cell walls in the midrib of the leaf (Figure 7). Additionally, RNA-Seq analysis showed that a majority of DEGs related to lignin biosynthesis were downregulated, which was further confirmed through qRT-PCR (Figure 6B,C,F,G; Tables S7 and S8). These findings strongly indicate that NAL1 likely plays a crucial role in regulating secondary cell wall formation and sclerenchyma thickness by influencing lignin biosynthesis. Previous studies have demonstrated that several genes controlling leaf shape can regulate cell wall formation, such as NRL1 [15,16], NRL2 [17], and SRL1 [54]. However, apart from previous RNA-Seq analysis briefly mentioning that NAL1 may regulate cell wall formation [41,43], there are no detailed reports that NAL1 regulates the secondary cell wall formation and sclerenchyma thickness through lignification. Therefore, our findings provide clear evidence for further studies on the regulatory role of NAL1 in this pathway.

5. Conclusions

m625 is a novel allelic mutant of NAL1 which exhibited pleiotropic traits, including narrower leaves, dwarfism, increased tillers, and decreased panicle length, panicle branch number, and grain number. A nucleotide deletion in the fourth exon of NAL1 in m625 affected photosynthetic pigment levels, vascular patterns, and cell division. Through RNA-Seq analysis, this study revealed two new insights into the function of NAL1. Firstly, besides its previously known role in IAA transport, NAL1 may also be involved in ABA signal transduction to regulate rice growth and development. Secondly, NAL1 may play a role in regulating secondary cell wall formation and sclerenchyma thickness through lignification, as supported by cytological analysis. These findings contribute to a better understanding of the multifaceted functions of NAL1.

Supplementary Materials

The following supporting information can be downloaded at: https://www.mdpi.com/article/10.3390/genes15030325/s1, Figure S1: Comparison of major agronomic traits of wild-type (WT) and m625 mutant; Figure S2: Comparison of leaf length, leaf width, and plant height of WT and TP; Figure S3: Venn analysis of DEGs; Figure S4: Comparison of sclerenchyma thickness in the leaf and stem between WT and m625; Table S1: Primers used in gene mapping, amplification sequencing, vector construction and detection; Table S2: Primers used in qRT-PCR; Table S3: Segregation of F2 populations from the crosses between m625 and wild type (WT); Table S4: Putative genes within the 167.8 kb region; Table S5: The number of DEGs in m625 compared to the WT; Table S6: DEGs associated with plant hormone signal transduction and plant-pathogen interaction pathways in the leaf at the tillering stage; Table S7: DEGs associated with photosynthesis and phenylpropanoid biosynthesis pathways in the leaf at the heading stage; Table S8: DEGs associated with phenylpropanoid biosynthesis and phenylalanine metabolism pathways in the stem at the heading stage.

Author Contributions

Y.W. and W.Z. planned and designed the research. Y.W., W.X., Y.L., J.Y., X.G., J.Z., J.P., N.C. and W.Z. performed experiments and conducted fieldwork. Y.W., W.X., Y.L. and J.Y. analyzed data. Y.W., W.X. and Y.L. wrote the manuscript. Y.W. and W.X. contributed equally. All authors have read and agreed to the published version of the manuscript.

Funding

This research was funded by the National Natural Science Foundation of China (32260502), Natural Science Foundation of Sichuan Province (2022NSFSC1748), the Open Project Program of State Key Laboratory of Crop Gene Exploration and Utilization in Southwest China (SKL-KF202221), Liangshan Science and Technology Program (No. 21ZDYF0020), the Open Project Program of Panxi Crops Research and Utilization Key Laboratory of Sichuan Province (No. XNFZ2116), Xichang Science and Technology Program (No. kjcx-2021-02), and the Xichang University Program (LGLZ201908).

Institutional Review Board Statement

Not applicable.

Informed Consent Statement

Not applicable.

Data Availability Statement

The data presented in this study are available on request from the corresponding author Yang Wang. The data are not publicly available due to privacy restrictions.

Conflicts of Interest

The authors declare no conflicts of interest.

References

  1. Govaerts, Y.M.; Jacquemoud, S.; Verstraete, M.M.; Ustin, S.L. Three-dimensional radiation transfer modeling in a dicotyledon leaf. Appl. Opt. 1996, 35, 6585–6598. [Google Scholar] [CrossRef] [PubMed]
  2. Zhang, J.S.; Zhang, H.; Srivastava, A.K.; Pan, Y.J.; Bai, J.J.; Fang, J.J.; Shi, H.Z.; Zhu, J.K. Knockdown of Rice MicroRNA166 Confers Drought Resistance by Causing Leaf Rolling and Altering Stem Xylem Development. Plant Physiol. 2018, 176, 2082–2094. [Google Scholar] [CrossRef] [PubMed]
  3. Liu, X.F.; Li, M.; Liu, K.; Tang, D.; Sun, M.F.; Li, Y.F.; Shen, Y.; Du, G.J.; Cheng, Z.K. Semi-Rolled Leaf2 modulates rice leaf rolling by regulating abaxial side cell differentiation. J. Exp. Bot. 2016, 67, 2139–2150. [Google Scholar] [CrossRef] [PubMed]
  4. Yuan, L.P. Hybrid Rice Breeding for Super High Yield. Hybrid Rice 1997, 12, 1–6. [Google Scholar]
  5. Yin, C.B.; Li, H.H.; Zhao, Z.G.; Wang, Z.Q.; Liu, S.J.; Chen, L.M.; Liu, X.; Tian, Y.L.; Ma, J.; Xu, L.D.; et al. Genetic dissection of top three leaf traits in rice using progenies from a japonica × indica cross. J. Integr. Plant Biol. 2017, 59, 866–880. [Google Scholar] [CrossRef] [PubMed]
  6. Ishiwata, A.; Ozawa, M.; Nagasaki, H.; Kato, M.; Noda, Y.; Yamaguchi, T.; Nosaka, M.; Shimizu-Sato, S.; Nagasaki, A.; Maekawa, M.; et al. Two WUSCHEL-related homeobox Genes, narrow leaf2 and narrow leaf3, Control Leaf Width in Rice. Plant Cell Physiol. 2013, 54, 779–792. [Google Scholar] [CrossRef]
  7. Shen, W.Q.; Sun, J.J.; Xiao, Z.; Feng, P.; Zhang, T.; He, G.H.; Sang, X. Narrow and Stripe Leaf 2 Regulates Leaf Width by Modulating Cell Cycle Progression in Rice. Rice 2023, 16, 20. [Google Scholar] [CrossRef]
  8. Uzair, M.; Long, H.X.; Zafar, S.A.; Patil, S.B.; Chun, Y.; Li, L.; Fang, J.J.; Zhao, J.F.; Peng, L.X.; Yuan, S.J.; et al. Narrow Leaf21, encoding ribosomal protein RPS3A, controls leaf development in rice. Plant Physiol. 2021, 186, 497–518. [Google Scholar] [CrossRef]
  9. He, P.L.; Wang, X.W.; Zhang, X.B.; Jiang, Y.D.; Tian, W.J.; Zhang, X.D.; Li, Y.Y.; Sun, Y.; Xie, J.; Ni, J.; et al. Short and narrow flag leaf1, a GATA zinc finger domain-containing protein, regulates flag leaf size in rice (Oryza sativa). BMC Plant Biol. 2018, 18, 273. [Google Scholar] [CrossRef]
  10. Qi, J.; Qian, Q.; Bu, Q.Y.; Li, S.Y.; Chen, Q.; Sun, J.Q.; Liang, W.X.; Zhou, Y.H.; Chu, C.C.; Li, X.G.; et al. Mutation of the Rice Narrow leaf1 Gene, Which Encodes a Novel Protein, Affects Vein Patterning and Polar Auxin Transport. Plant Physiol. 2008, 147, 1947–1959. [Google Scholar] [CrossRef]
  11. Cho, S.H.; Yoo, S.C.; Zhang, H.T.; Lim, J.H.; Paek, N.C. Rice NARROW LEAF1 Regulates Leaf and Adventitious Root Development. Plant Mol. Biol. Rep. 2014, 32, 270–281. [Google Scholar] [CrossRef]
  12. Fujino, K.; Matsuda, Y.; Ozawa, K.; Nishimura, T.; Koshiba, T.; Fraaije, M.W.; Sekiguchi, H. NARROW LEAF 7 controls leaf shape mediated by auxin in rice. Mol. Genet. Genom. 2008, 279, 499–507. [Google Scholar] [CrossRef]
  13. Cho, S.H.; Yoo, S.C.; Zhang, H.T.; Pandeya, D.; Koh, H.J.; Hwang, J.Y.; Kim, G.T.; Paek, N.C. The rice narrow leaf2 and narrow leaf3 loci encode WUSCHEL-related homeobox 3A (OsWOX3A) and function in leaf, spikelet, tiller and lateral root development. New Phytol. 2013, 198, 1071–1084. [Google Scholar] [CrossRef] [PubMed]
  14. Cho, S.H.; Kang, K.; Lee, S.H.; Lee, I.J.; Paek, N.C. OsWOX3A is involved in negative feedback regulation of the gibberellic acid biosynthetic pathway in rice (Oryza sativa). J. Exp. Bot. 2016, 67, 1677–1687. [Google Scholar] [CrossRef]
  15. Li, M.; Xiong, G.Y.; Li, R.; Cui, J.J.; Tang, D.; Zhang, B.C.; Pauly, M.; Cheng, Z.K.; Zhou, Y.H. Rice cellulose synthase-like D4 is essential for normal cell-wall biosynthesis and plant growth. Plant J. 2009, 60, 1055–1069. [Google Scholar] [CrossRef] [PubMed]
  16. Hu, J.; Zhu, L.; Zeng, D.L.; Gao, Z.Y.; Guo, L.B.; Fang, Y.X.; Zhang, G.H.; Dong, G.J.; Yan, M.X.; Liu, J.; et al. Identification and characterization of NARROW AND ROLLED LEAF 1, a novel gene regulating leaf morphology and plant architecture in rice. Plant Mol. Biol. 2010, 73, 283–292. [Google Scholar] [CrossRef]
  17. Zhao, S.S.; Zhao, L.; Liu, F.X.; Wu, Y.Z.; Zhu, Z.F.; Sun, C.Q.; Tan, L.B. NARROW AND ROLLED LEAF 2 regulates leaf shape, male fertility, and seed size in rice. J. Integr. Plant Biol. 2016, 58, 983–996. [Google Scholar] [CrossRef]
  18. Li, W.; Wu, C.; Hu, G.C.; Xing, L.; Qian, W.J.; Si, H.M.; Sun, Z.X.; Wang, X.C.; Fu, Y.P.; Liu, W.Z. Characterization and Fine Mapping of a Novel Rice Narrow Leaf Mutant nal9. J. Integr. Plant Biol. 2013, 55, 1016–1025. [Google Scholar] [CrossRef]
  19. Lichtenthaler, H.K.; Wellburn, A.R. Determination of total carotenoids and chlorophylls a and b of leaf extracts in different solvents. Biochem. Soc. Trans. 1983, 11, 591–592. [Google Scholar] [CrossRef]
  20. Li, S.B.; Qian, Q.; Fu, Z.M.; Zeng, D.L.; Meng, X.B.; Kyozuka, J.; Maekawa, M.; Zhu, X.D.; Zhang, J.; Li, J.Y.; et al. Short panicle1 encodes a putative PTR family transporter and determines rice panicle size. Plant J. 2009, 58, 592–605. [Google Scholar] [CrossRef]
  21. Carlquist, S. The use of ethylenediamine in softening hard plant structures for paraffin sectioning. Stain Technol. 1982, 57, 311–317. [Google Scholar] [CrossRef]
  22. Abe, A.; Kosugi, S.; Yoshida, K.; Natsume, S.; Takagi, H.; Kanzaki, H.; Matsumura, H.; Yoshida, K.; Mitsuoka, C.; Tamiru, M.; et al. Genome sequencing reveals agronomically important loci in rice using MutMap. Nat. Biotechnol. 2012, 30, 174–178. [Google Scholar] [CrossRef]
  23. Livak, K.J.; Schmittgen, T.D. Analysis of Relative Gene Expression Data Using Real-Time Quantitative PCR and the 2−ΔΔCT Method. Methods 2001, 25, 402–408. [Google Scholar] [CrossRef] [PubMed]
  24. Wang, L.K.; Feng, Z.X.; Wang, X.; Wang, X.W.; Zhang, X.G. DEGseq: An R package for identifying differentially expressed genes from RNA-seq data. Bioinformatics 2010, 26, 136–138. [Google Scholar] [CrossRef] [PubMed]
  25. Kanehisa, M.; Goto, S. KEGG: Kyoto Encyclopedia of Genes and Genomes. Nucleic Acids Res. 2000, 28, 27–30. [Google Scholar] [CrossRef] [PubMed]
  26. Jain, M.; Kaur, N.; Garg, R.; Thakur, J.K.; Tyagi, A.K.; Khurana, J.P. Structure and expression analysis of early auxin-responsive Aux/IAA gene family in rice (Oryza sativa). Funct. Integr. Genom. 2006, 6, 47–59. [Google Scholar] [CrossRef] [PubMed]
  27. Miao, J.; Li, X.F.; Li, X.B.; Tan, W.C.; You, A.Q.; Wu, S.J.; Tao, Y.J.; Chen, C.; Wang, J.; Zhang, D.P.; et al. OsPP2C09, a negative regulatory factor in abscisic acid signalling, plays an essential role in balancing plant growth and drought tolerance in rice. New Phytol. 2020, 227, 1417–1433. [Google Scholar] [CrossRef] [PubMed]
  28. Xiang, Y.; Tang, N.; Du, H.; Ye, H.Y.; Xiong, L.Z. Characterization of OsbZIP23 as a Key Player of the Basic Leucine Zipper Transcription Factor Family for Conferring Abscisic Acid Sensitivity and Salinity and Drought Tolerance in Rice. Plant Physiol. 2008, 148, 1938–1952. [Google Scholar] [CrossRef] [PubMed]
  29. Li, Y.S.; Sun, H.; Wang, Z.F.; Duan, M.; Huang, S.D.; Yang, J.; Huang, J.; Zhang, H.S. A Novel Nuclear Protein Phosphatase 2C Negatively Regulated by ABL1 is Involved in Abiotic Stress and Panicle Development in Rice. Mol. Biotechnol. 2013, 54, 703–710. [Google Scholar] [CrossRef] [PubMed]
  30. Li, S.; Zhou, L.M.; Xiang, S.B.; Wei, S.H. UVI_02019870, a Puptive Effector from Ustilaginoidea virens, Interacts with a Chloroplastic-Like Protein OsCPL1. Phyton-Int. J. Exp. Bot. 2020, 89, 681–690. [Google Scholar] [CrossRef]
  31. Ishida, S.; Morita, K.; Kishine, M.; Takabayashi, A.; Murakami, R.; Takeda, S.; Shimamoto, K.; Sato, F.; Endo, T. Allocation of Absorbed Light Energy in PSII to Thermal Dissipations in the Presence or Absence of PsbS Subunits of Rice. Plant Cell Physiol. 2011, 52, 1822–1831. [Google Scholar] [CrossRef] [PubMed]
  32. Yoshiba, Y.; Yamaguchi-Shinozaki, K.; Shinozaki, K.; Harada, Y. Characterization of a cDNA Clone Encoding 23 kDa Polypeptide of the Oxygen-Evolving Complex of Photosystem II in Rice. Plant Cell Physiol. 1995, 36, 1677–1682. [Google Scholar] [PubMed]
  33. Li, L.H.; Ye, T.Z.; Gao, X.L.; Chen, R.J.; Xu, J.D.; Xie, C.; Zhu, J.Q.; Deng, X.J.; Wang, P.R.; Xu, Z.J. Molecular characterization and functional analysis of the OsPsbR gene family in rice. Mol. Genet. Genom. 2017, 292, 271–281. [Google Scholar] [CrossRef] [PubMed]
  34. He, L.; Li, M.; Qiu, Z.N.; Chen, D.D.; Zhang, G.H.; Wang, X.Q.; Chen, G.; Hu, J.; Gao, Z.Y.; Dong, G.J.; et al. Primary Leaf-type Ferredoxin 1 Participates in Photosynthetic Electron Transport and Carbon Assimilation in Rice. Plant J. 2020, 104, 44–58. [Google Scholar] [CrossRef] [PubMed]
  35. Suzuki, Y.; Makino, A. Availability of Rubisco Small Subunit Up-Regulates the Transcript Levels of Large Subunit for Stoichiometric Assembly of Its Holoenzyme in Rice. Plant Physiol. 2012, 160, 533–540. [Google Scholar] [CrossRef] [PubMed]
  36. Gui, J.S.; Shen, J.J.; Li, L.G. Functional Characterization of Evolutionarily Divergent 4-Coumarate: Coenzyme A Ligases in Rice. Plant Physiol. 2011, 157, 574–586. [Google Scholar] [CrossRef]
  37. Li, W.T.; Wang, K.; Chern, M.; Liu, Y.C.; Zhu, Z.W.; Liu, J.; Zhu, X.B.; Yin, J.J.; Ran, L.; Xiong, J.; et al. Sclerenchyma cell thickening through enhanced lignification induced by OsMYB30 prevents fungal penetration of rice leaves. New Phytol. 2020, 226, 1850–1863. [Google Scholar] [CrossRef]
  38. Borah, P.; Sharma, A.; Sharma, A.K.; Khurana, P.; Khurana, J.P. SCFOsFBK1 E3 ligase mediates jasmonic acid-induced turnover of OsATL53 and OsCCR14 to regulate lignification of rice anthers and roots. J. Exp. Bot. 2023, 74, 6188–6204. [Google Scholar] [CrossRef]
  39. Tonnessen, B.W.; Manosalva, P.; Lang, J.M.; Baraoidan, M.; Bordeos, A.; Mauleon, R.; Oard, J.; Hulbert, S.; Leung, H.; Leach, J.E. Rice phenylalanine ammonia-lyase gene OsPAL4 is associated with broad spectrum disease resistance. Plant Mol. Biol. 2015, 87, 273–286. [Google Scholar] [CrossRef] [PubMed]
  40. He, J.; Liu, Y.Q.; Yuan, D.Y.; Duan, M.J.; Liu, Y.L.; Shen, Z.J.; Yang, C.Y.; Qiu, Z.Y.; Liu, D.M.; Wen, P.Z.; et al. An R2R3 MYB transcription factor confers brown planthopper resistance by regulating the phenylalanine ammonia-lyase pathway in rice. Proc. Natl. Acad. Sci. USA 2020, 117, 271–277. [Google Scholar] [CrossRef] [PubMed]
  41. Lin, L.; Zhao, Y.F.; Liu, F.; Chen, Q.; Qi, J. Narrow leaf 1 (NAL1) regulates leaf shape by affecting cell expansion in rice (Oryza sativa L.). Biochem. Biophys. Res. Commun. 2019, 516, 957–962. [Google Scholar] [CrossRef] [PubMed]
  42. Takai, T.; Adachi, S.; Taguchi-Shiobara, F.; Sanoh-Arai, Y.; Iwasawa, N.; Yoshinaga, S.; Hirose, S.; Taniguchi, Y.; Yamanouchi, U.; Wu, J.Z.; et al. A natural variant of NAL1, selected in high-yield rice breeding programs, pleiotropically increases photosynthesis rate. Sci. Rep. 2013, 3, 2149. [Google Scholar] [CrossRef] [PubMed]
  43. Ouyang, X.; Zhong, X.Y.; Chang, S.Q.; Qian, Q.; Zhang, Y.Z.; Zhu, X.G. Partially functional NARROW LEAF1 balances leaf photosynthesis and plant architecture for greater rice yield. Plant Physiol. 2022, 189, 772–789. [Google Scholar] [CrossRef] [PubMed]
  44. Zhang, G.H.; Li, S.Y.; Wang, L.; Ye, W.J.; Zeng, D.L.; Rao, Y.C.; Peng, Y.L.; Hu, J.; Yang, Y.L.; Xu, J.; et al. LSCHL4 from Japonica Cultivar, Which Is Allelic to NAL1, Increases Yield of Indica Super Rice 93-11. Mol. Plant 2014, 7, 1350–1364. [Google Scholar] [CrossRef] [PubMed]
  45. Li, W.J.; Yan, J.J.; Zhang, Y.; Zhang, F.; Guan, Z.Y.; Yao, Y.L.; Chang, Y.; Tu, H.F.; Li, X.K.; Wang, H.J.; et al. Serine protease NAL1 exerts pleiotropic functions through degradation of TOPLESS-related corepressor in rice. Nat. Plants 2023, 9, 1130–1142. [Google Scholar] [CrossRef] [PubMed]
  46. Jiang, D.; Fang, J.; Lou, L.; Zhao, J.; Yuan, S.; Yin, L.; Sun, W.; Peng, L.; Guo, B.; Li, X. Characterization of a Null Allelic Mutant of the Rice NAL1 Gene Reveals Its Role in Regulating Cell Division. PLoS ONE 2015, 10, e0118169. [Google Scholar] [CrossRef]
  47. Subudhi, P.K.; Garcia, R.S.; Coronejo, S.; De Leon, T.B. A Novel Mutation of the NARROW LEAF 1 Gene Adversely Affects Plant Architecture in Rice (Oryza sativa L.). Int. J. Mol. Sci. 2020, 21, 8106. [Google Scholar] [CrossRef]
  48. Zhai, L.Y.; Yan, A.; Shao, K.; Wang, S.; Wang, Y.; Chen, Z.H.; Xu, J.L. Large Vascular Bundle Phloem Area 4 enhances grain yield and quality in rice via source-sink-flow. Plant Physiol. 2023, 191, 317–334. [Google Scholar] [CrossRef]
  49. Huang, Y.Y.; Zhao, S.S.; Fu, Y.C.; Sun, H.D.; Ma, X.; Tan, L.B.; Liu, F.X.; Sun, X.Y.; Sun, H.Y.; Gu, P.; et al. Variation in the regulatory region of FZP causes increases in secondary inflorescence branching and grain yield in rice domestication. Plant J. 2018, 96, 716–733. [Google Scholar] [CrossRef]
  50. Fujita, D.; Trijatmiko, K.R.; Tagle, A.G.; Sapasap, M.V.; Koide, Y.; Sasaki, K.; Tsakirpaloglou, N.; Gannaban, R.B.; Nishimura, T.; Yanagihara, S.; et al. NAL1 allele from a rice landrace greatly increases yield in modern indica cultivars. Proc. Natl. Acad. Sci. USA 2013, 110, 20431–20436. [Google Scholar] [CrossRef]
  51. Lavy, M.; Estelle, M. Mechanisms of auxin signaling. Development 2016, 143, 3226–3229. [Google Scholar] [CrossRef] [PubMed]
  52. Luo, J.; Zhou, J.J.; Zhang, J.Z. Aux/IAA Gene Family in Plants: Molecular Structure, Regulation, and Function. Int. J. Mol. Sci. 2019, 19, 259. [Google Scholar] [CrossRef] [PubMed]
  53. Dey, A.; Samanta, M.K.; Gayen, S.; Sen, S.K.; Maiti, M.K. Enhanced Gene Expression Rather than Natural Polymorphism in Coding Sequence of the OsbZIP23 Determines Drought Tolerance and Yield Improvement in Rice Genotypes. PLoS ONE 2016, 11, e0150763. [Google Scholar] [CrossRef]
  54. Li, W.Q.; Zhang, M.J.; Gan, P.F.; Qiao, L.; Yang, S.Q.; Miao, H.; Wang, G.F.; Zhang, M.M.; Liu, W.T.; Li, H.F.; et al. CLD1/SRL1 modulates leaf rolling by affecting cell wall formation, epidermis integrity and water homeostasis in rice. Plant J. 2017, 92, 904–923. [Google Scholar] [CrossRef] [PubMed]
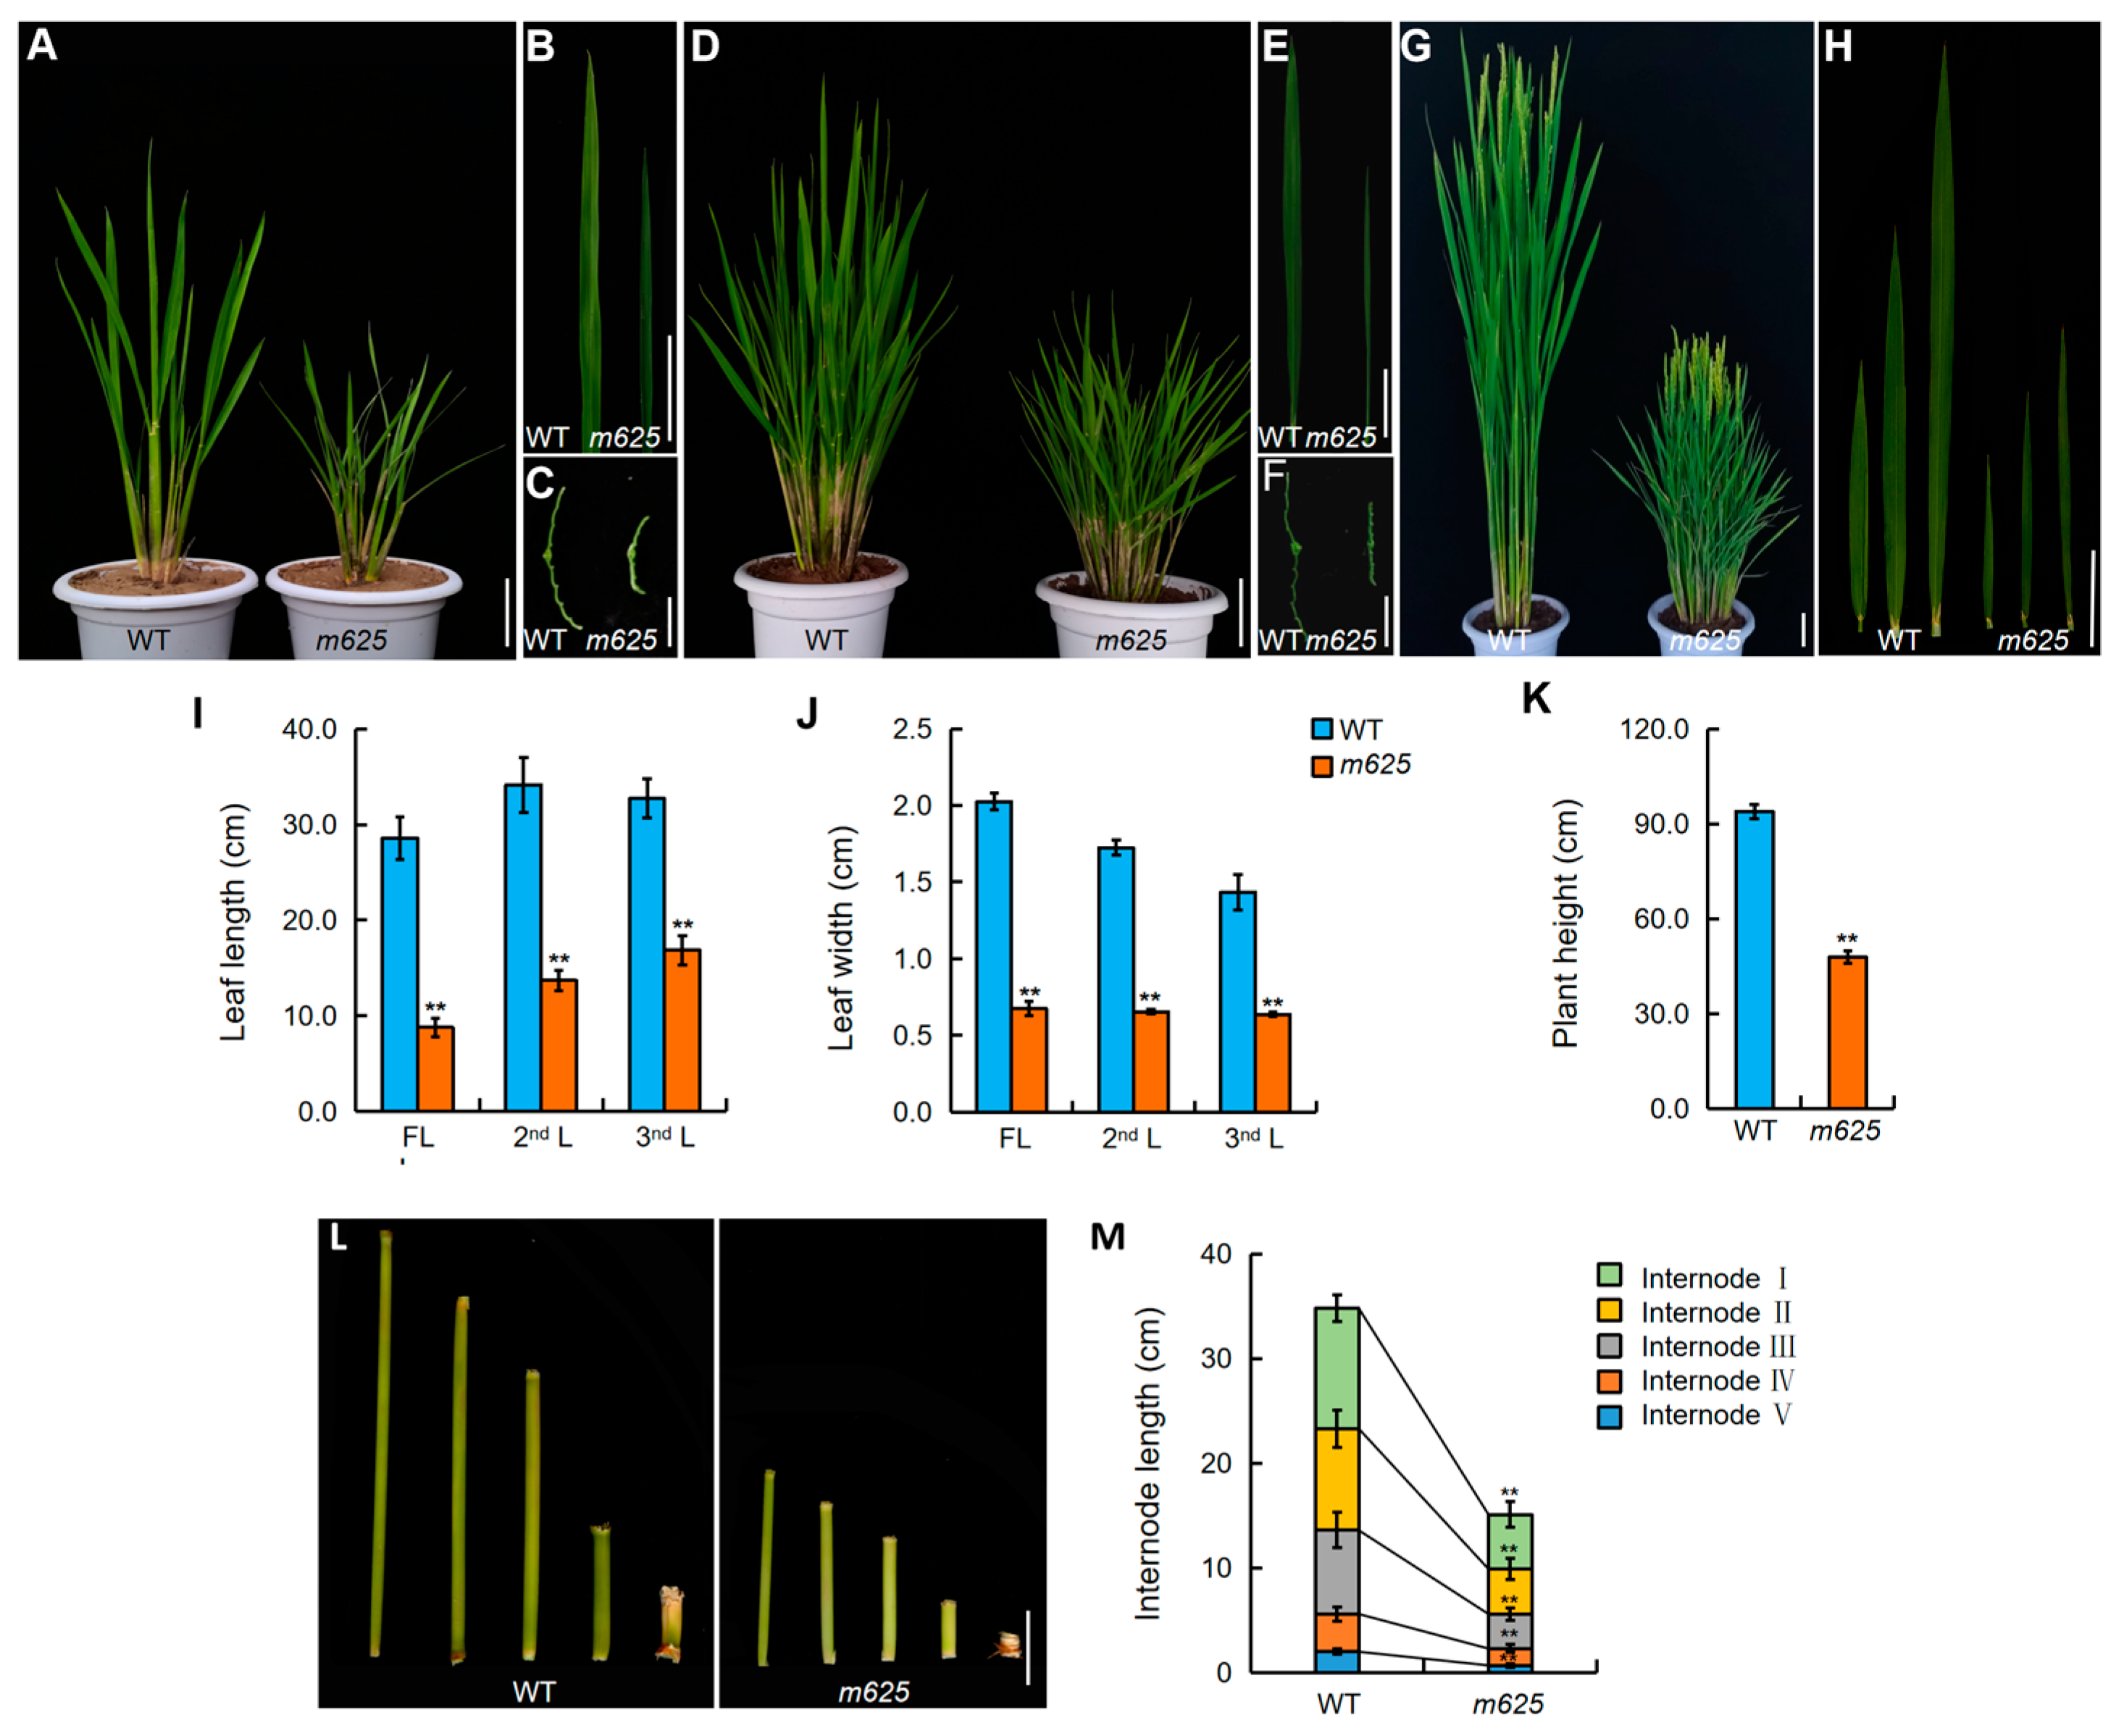
Figure 1. Phenotypic characterization of wild-type (WT) and m625. (A,D,G) Plant architecture at the tillering, elongation and heading stages, respectively. Scale bars, 5 cm. (B,E) Leaf morphology at the tillering and elongation stages, respectively. Scale bars, 5 cm. (C,F) Transverse section of the leaves at the tillering and elongation stages, respectively. Scale bars, 5 mm. (H) Morphology of the top three leaves at the heading stage. Scale bar, 5 cm. (I,J) Statistical analysis of the length and width of the top three leaves. Data are means ± SD (n = 24). The blue and orange columns represent WT and m625 in the histogram, respectively, the same as below. (K) Statistical analysis of plant height. Data are means ± SD (n = 24). (L) Characteristics of internodes (I–V) in WT and m625. Scale bar, 2 cm. (M) Quantification of WT and m625 internode length. Data are means ± SD (n = 9). Asterisks represent significant differences using Student’s t-test (** p < 0.01) in (IK,M).
Genes 15 00325 g001
Figure 2. Pigment contents in leaves of WT and m625. (A) The levels of pigments in leaves at the seedling stage. (B) The levels of pigments in leaves at the booting stage. Chls, total chlorophyll; Chla, chlorophyll a; Chlb, chlorophyll b; Caro, carotenoids. Data are means ± SD (n = 9). Asterisks represent significant differences using Student’s t-test (* p < 0.05; ** p < 0.01).
Genes 15 00325 g002
Figure 3. Cytological analysis of the leaf in WT and m625. (A) Transverse section of the leaf at the booting stage. (i,ii) Appearance comparison of the leaf. Red and black asterisks denote large vein (LV) and small vein (SV), respectively. (iii,iv) Comparison of LV number, SV number, and vein spacing. (iii) and (iv) are the zoomed-in images of black rectangles in (i) and (ii), respectively. (v,vi) Comparison of bulliform cells, mesophyll thickness, and number of parenchyma cell layers in veins. Orange curves outline the shape of bulliform cells. Yellow double-headed arrows represent mesophyll thickness. Red curves outline the parenchyma cell layers. (vii,viii) Enlarged images of mesophyll thickness. Blue arrows denote mesophyll cells. Ab, abaxial surface. Ad, adaxial surface; BC, bulliform cell; MC, mesophyll cell; PC, parenchyma cell. Scale bars, 1000 μm (i,ii); 100 μm (iii,vi); 50 μm (v,vi); 10 μm (vii,viii). (BI) Numerical comparison of LV number, SV number, distance between two SVs, LV length, SV length, mesophyll thickness, and number of parenchyma cell layers in LVs and SVs. Data are means ± SD from five leaves. Asterisks represent significant differences using Student’s t-test (** p < 0.01).
Genes 15 00325 g003
Figure 4. Cytological analysis of the stem in WT and m625. (A) Transverse section of internode II at the heading stage. (i,ii) Appearance comparison of internode II. Green double-headed arrows denote the internode thickness. (iii,iv) Zoomed-in images of transverse section. Blue double-headed arrows show the distance from the large vascular bundle to the outer ring. Red curves outline the internode II cell layers. LVB, large vascular bundle; SVB, small vascular bundle. Scale bars, 1000 μm (i,ii); 100 μm (iii,iv). (BD) Numerical comparison of LVB number, SVB number, and cell layer number in internode II. Data are means ± SD from three biological replicates. Asterisks represent significant differences using Student’s t-test (** p < 0.01).
Genes 15 00325 g004
Figure 5. Gene cloning and function verification of m625. (A) The m625 gene was located in a 167.8 kb region between N2 and N3 on chromosome 4 using 260 homozygous F2 plants. (B) The 167.8 kb region contains 22 genes, and the candidate gene LOC_Os04g52479 was indicated with the black box. (C) The structure of LOC_Os04g52479 contains five exons and four introns. The black arrow represents a single nucleotide deletion at position 8146 bp in LOC_Os04g52479 in m625. (D) InDel index plots for m625 showed genetic linkage on chromosomes 4, in which a nucleotide deletion (InDel index value of 1.0) was found in 167.8 kb region. This deletion was positioned in the fourth exon region of LOC_Os04g52479, as indicated with the red triangles. (E) PCR identification of positive transgenic plants. M, DL-2000 marker; 1, m625 (negative control) 2, pC2300-M625 plasmid (positive control); 3–13, transgenic plants. (F) Leaf morphology in WT, m625, and TP (transgenic plants) at the booting stage. Scale bar, 5 cm. (G) Plant architecture of WT, m625, and TP during the grain filling stage. Scale bar, 10 cm.
Genes 15 00325 g005
Figure 6. RNA-Seq and qRT-PCR analyses among WT and m625. (A) KEGG analysis of DEGs in the leaf at the tillering stage. (B) KEGG analysis of DEGs in the leaf at the heading stage. (C) KEGG analysis of DEGs in the stem at the heading stage. (D) Expression analysis of DEGs associated with IAA and ABA signal transduction in the leaf at the tillering stage. OsIAA2 and OsIAA15 are auxin-responsive Aux/IAA family genes; OsPP2C09, OsbZIP23, and OsSIPP2C1 are ABA signal regulator genes. (E) Expression analysis of DEGs associated with photosynthesis in the leaf at the heading stage. OsCPL1 is a plastocyanin gene; OsPsbS1 and OsPsbP are photosystem II genes; OsFd1 is a photosynthetic ferredoxin gene. (F,G) Expression analysis of DEGs associated with phenylpropanoid biosynthesis in the leaf and stem at the heading stage, respectively. Os4CL2, Os4CL3 and Os4CL5 are 4-Coumarate:Coenzyme A Ligase genes; OsCCR14 is a cinnamoyl-CoA reductase gene; OsPAL5, OsPAL6, and OsPAL7 are phenylalanine ammonia–lyase genes. Data in (DG) are means ± SD from three biological replications. Asterisks represent significant differences using Student’s t-test (** p < 0.01).
Genes 15 00325 g006
Figure 7. The analysis of sclerenchyma in the leaf and stem between WT and m625. (A) Comparison of sclerenchyma in the leaf at the heading stage. (i,ii) Sclerenchyma thickness in the leaf. (iii,iv) Enlarged images of sclerenchyma in the midrib. Scale bars, 100 μm (i,ii); 20 μm (iii,iv). (B) Comparison of sclerenchyma in the internode II at the heading stage. (i,ii) Sclerenchyma thickness in the stem. (iii,iv) Enlarged images of sclerenchyma in the internode II. Scale bars, 50 μm (i,ii); 10 μm (iii,iv). In sections, the lignified cell walls were stained red by saffron O staining solution in the midrib of the leaf. Blue arrows denote sclerenchyma cell. Red markers indicate sclerenchyma thickness. SC, sclerenchyma cell.
Genes 15 00325 g007
Disclaimer/Publisher’s Note: The statements, opinions and data contained in all publications are solely those of the individual author(s) and contributor(s) and not of MDPI and/or the editor(s). MDPI and/or the editor(s) disclaim responsibility for any injury to people or property resulting from any ideas, methods, instructions or products referred to in the content.