
Dynamics of Mitochondrial DNA Copy Number and Membrane Potential in Mouse Pre-Implantation Embryos: Responses to Diverse Types of Oxidative Stress

 , ,
, , 
Abstract
1. Introduction
2. Materials and Methods
2.1. Animals, Hormone Treatment, and Drug Administration
2.2. Derivation of Oocytes, Early Embryos, and Blastocysts
2.3. Isolation of Blastocyst Cell Populations
2.4. Sample Collection and DNA Extraction
2.5. Quantitative PCR (mtDNA, Rn18S, and SRY)
2.6. Transfer of Blastocyst Embryos to Pseudo-Pregnant Female Mice and Fetal Tissue Analysis
2.7. TMRM Staining of Mitochondrial Membrane Potential
2.8. MitoSOX Red (MSR) Staining
2.9. Statistical Analysis
3. Results
3.1. Mitochondrial DNA across Pre-Implantation Development and in Blastocysts
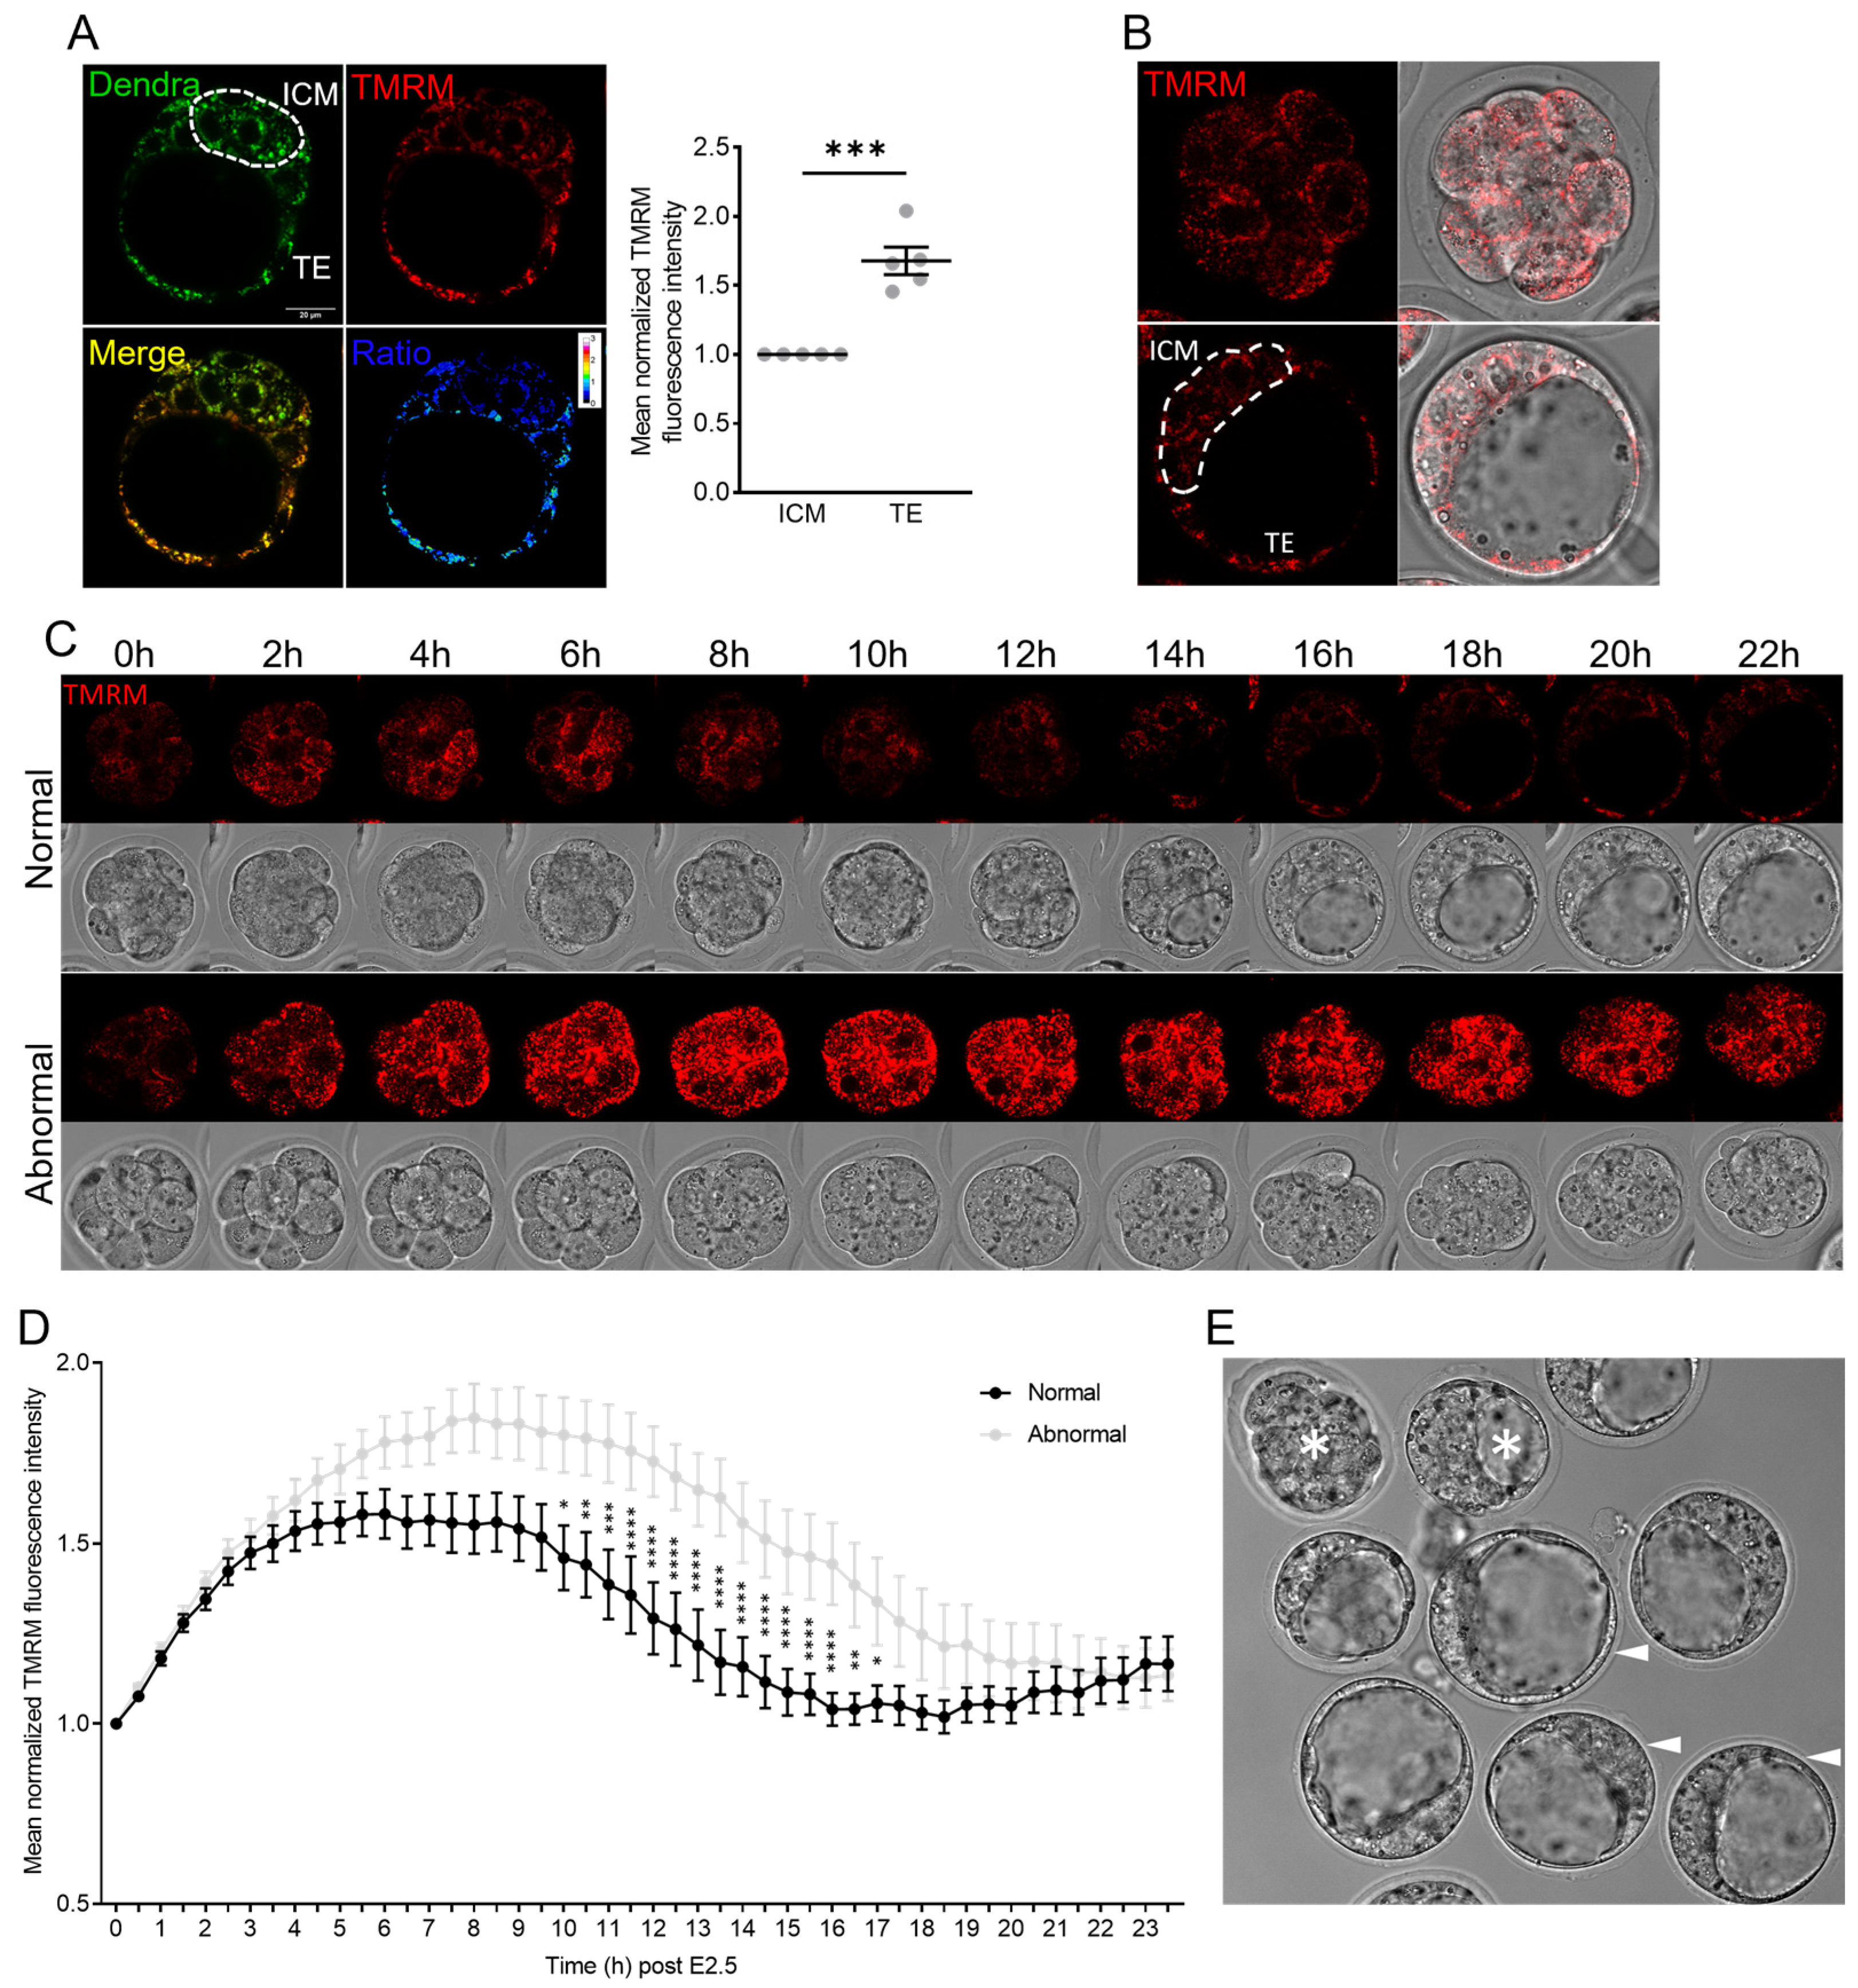
3.2. Mitochondrial Membrane Potential across Pre-Implantation Development and in Blastocysts
3.3. Mitochondrial Membrane Potential and mtDNA Dysregulated by High-Oxygen Culture
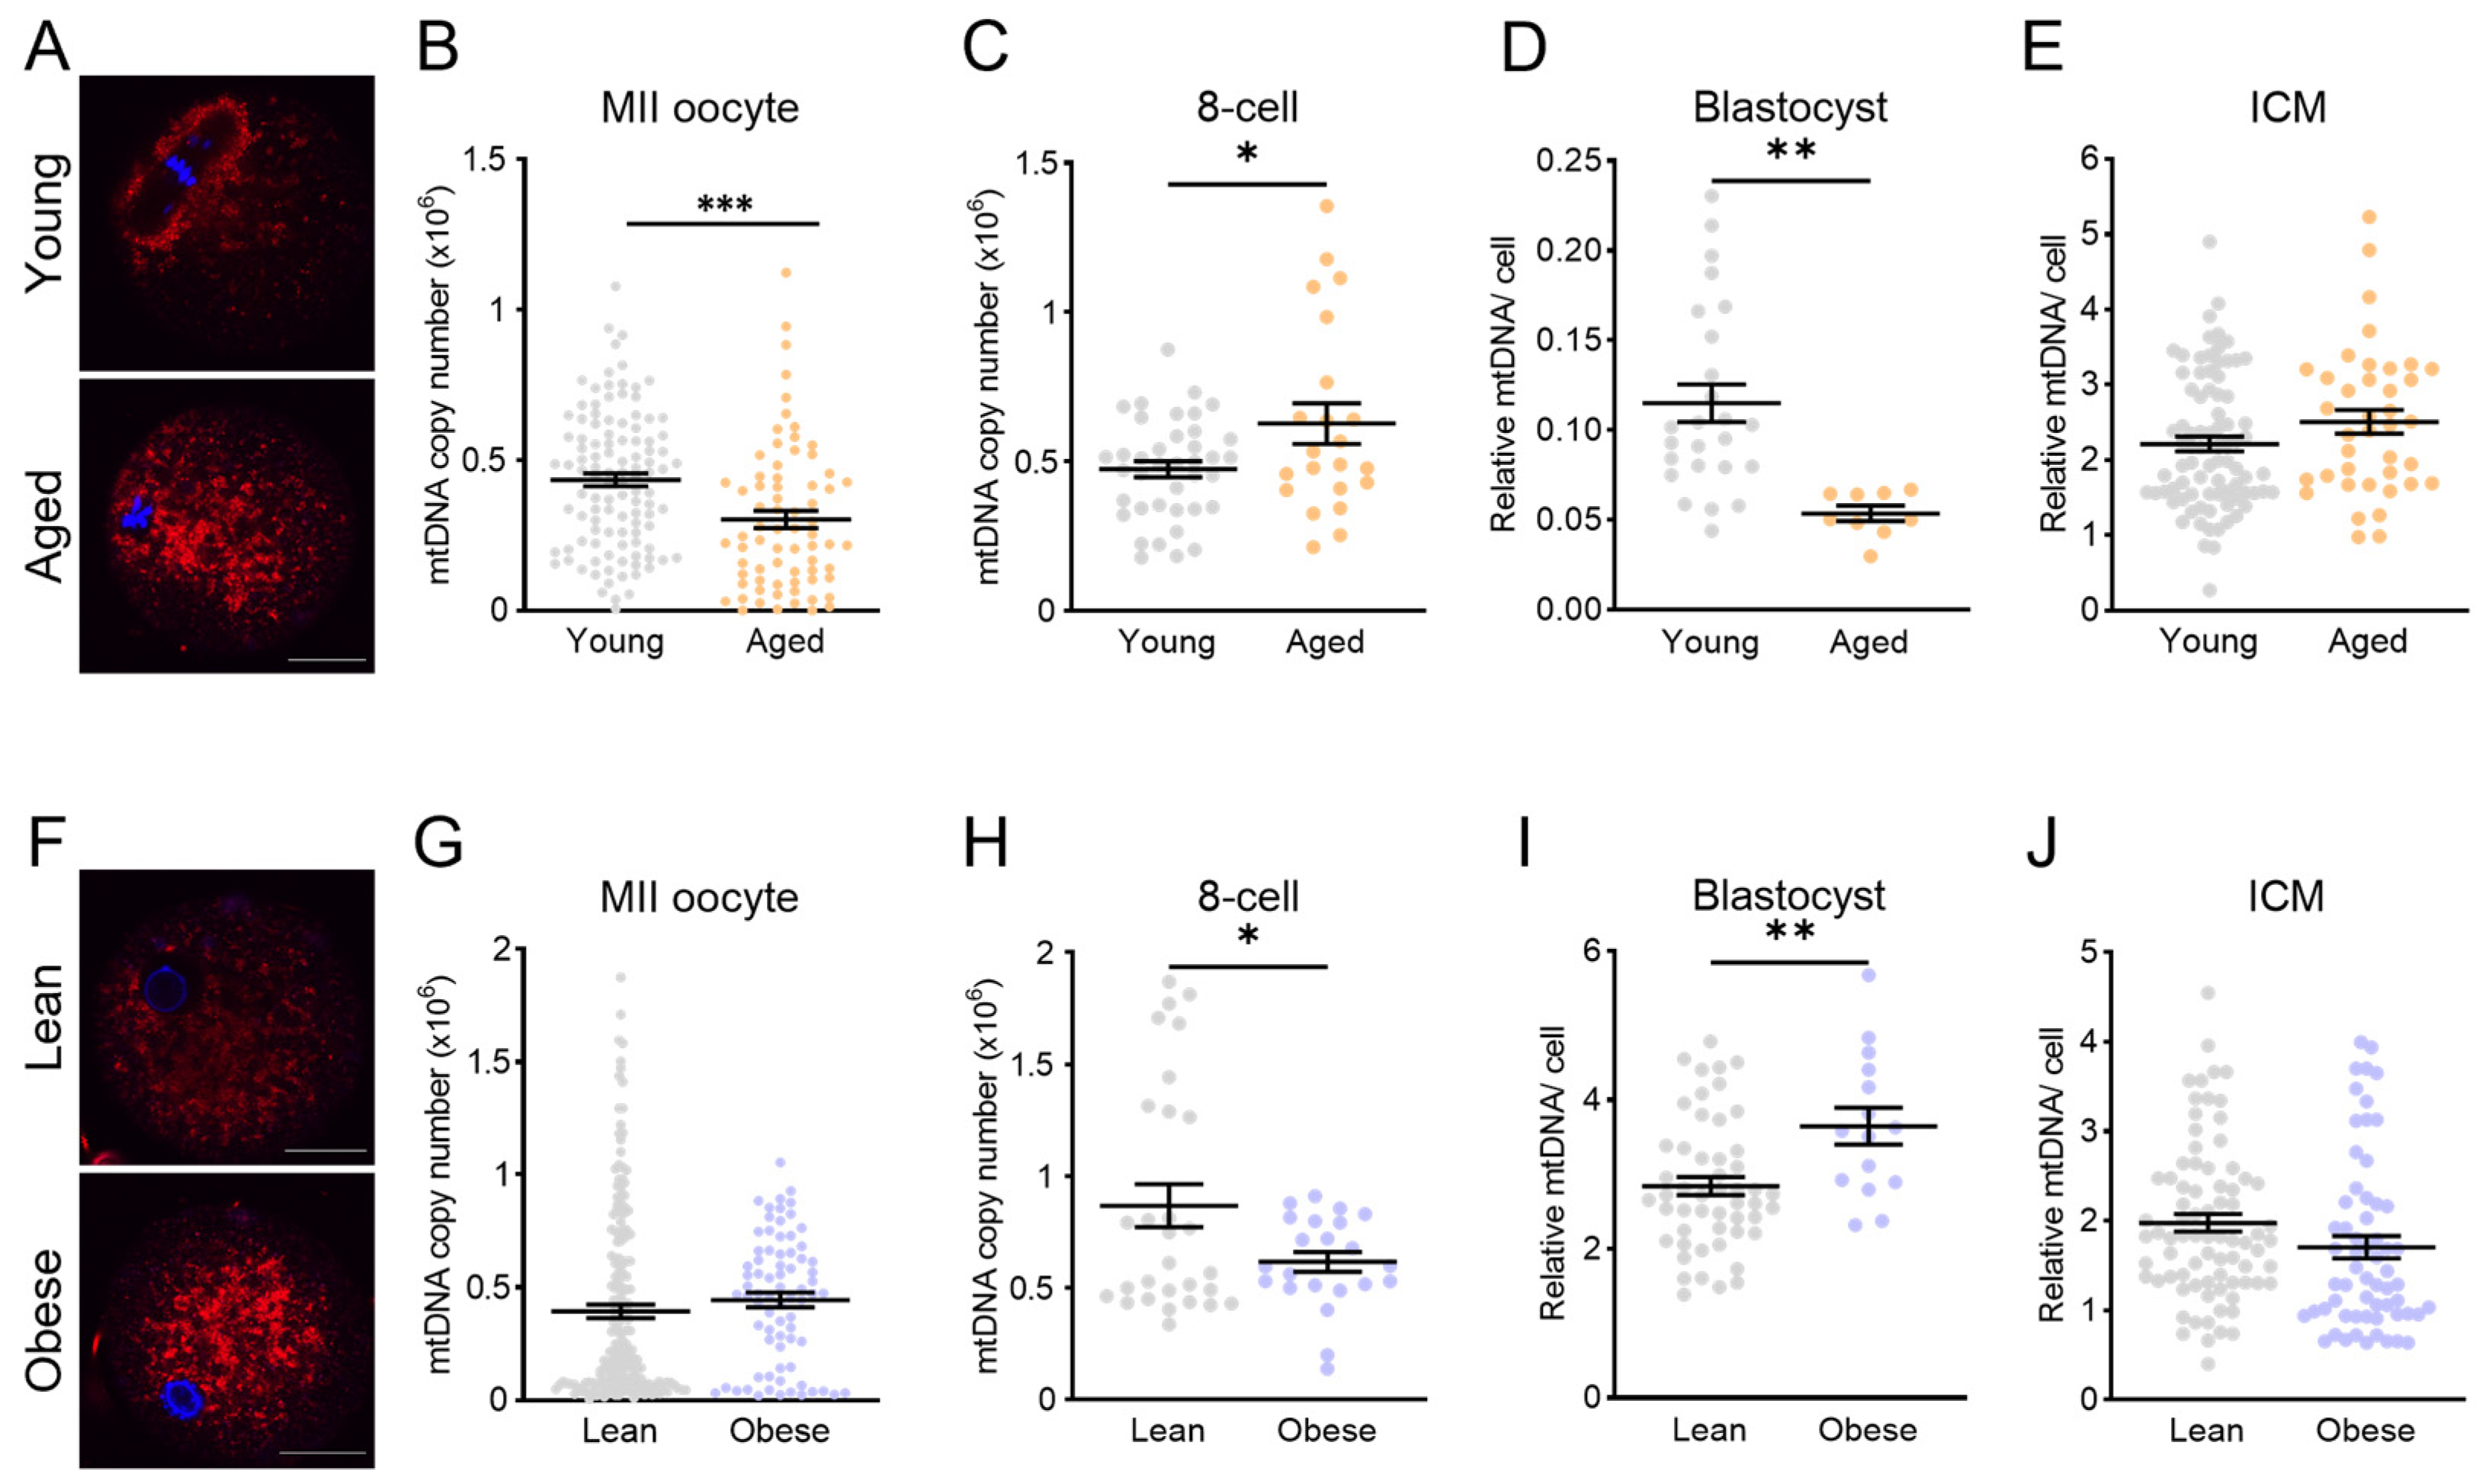
3.4. Mitochondrial Disruption (Rotenone, Aging, or Obesity) Prior to IVF Does Not Alter mtDNA in ICM
4. Discussion
Supplementary Materials
Author Contributions
Funding
Institutional Review Board Statement
Informed Consent Statement
Data Availability Statement
Acknowledgments
Conflicts of Interest
References
- Dumollard, R.; Duchen, M.; Carroll, J. The role of mitochondrial function in the oocyte and embryo. Curr. Top. Dev. Biol. 2007, 77, 21–49. [Google Scholar] [CrossRef]
- Van Blerkom, J. Mitochondrial function in the human oocyte and embryo and their role in developmental competence. Mitochondrion 2011, 11, 797–813. [Google Scholar] [CrossRef]
- Adhikari, D.; Lee, I.W.; Yuen, W.S.; Carroll, J. Oocyte mitochondria-key regulators of oocyte function and potential therapeutic targets for improving fertility. Biol. Reprod. 2022, 106, 366–377. [Google Scholar] [CrossRef]
- Harvey, A.J. Mitochondria in early development: Linking the microenvironment, metabolism and the epigenome. Reproduction 2019, 157, R159–R179. [Google Scholar] [CrossRef] [PubMed]
- Chandel, N.S. Mitochondria as signaling organelles. BMC Biol. 2014, 12, 34. [Google Scholar] [CrossRef]
- Elias-Lopez, A.L.; Vazquez-Mena, O.; Sferruzzi-Perri, A.N. Mitochondrial dysfunction in the offspring of obese mothers and it’s transmission through damaged oocyte mitochondria: Integration of mechanisms. Biochim. Biophys. Acta Mol. Basis Dis. 2023, 1869, 166802. [Google Scholar] [CrossRef] [PubMed]
- Turner, N.; Robker, R.L. Developmental programming of obesity and insulin resistance: Does mitochondrial dysfunction in oocytes play a role? Mol. Hum. Reprod. 2015, 21, 23–30. [Google Scholar] [CrossRef]
- Gyllenhammer, L.E.; Entringer, S.; Buss, C.; Wadhwa, P.D. Developmental programming of mitochondrial biology: A conceptual framework and review. Proc. Biol. Sci. 2020, 287, 20192713. [Google Scholar] [CrossRef] [PubMed]
- May-Panloup, P.; Boguenet, M.; Hachem, H.E.; Bouet, P.E.; Reynier, P. Embryo and Its Mitochondria. Antioxidants 2021, 10, 139. [Google Scholar] [CrossRef]
- Acton, B.M.; Jurisicova, A.; Jurisica, I.; Casper, R.F. Alterations in mitochondrial membrane potential during preimplantation stages of mouse and human embryo development. Mol. Hum. Reprod. 2004, 10, 23–32. [Google Scholar] [CrossRef]
- Anderson, S.; Bankier, A.T.; Barrell, B.G.; de Bruijn, M.H.; Coulson, A.R.; Drouin, J.; Eperon, I.C.; Nierlich, D.P.; Roe, B.A.; Sanger, F.; et al. Sequence and organization of the human mitochondrial genome. Nature 1981, 290, 457–465. [Google Scholar] [CrossRef] [PubMed]
- St John, J.C.; Okada, T.; Andreas, E.; Penn, A. The role of mtDNA in oocyte quality and embryo development. Mol. Reprod. Dev. 2023, 90, 621–633. [Google Scholar] [CrossRef] [PubMed]
- St John, J.C.; Facucho-Oliveira, J.; Jiang, Y.; Kelly, R.; Salah, R. Mitochondrial DNA transmission, replication and inheritance: A journey from the gamete through the embryo and into offspring and embryonic stem cells. Hum. Reprod. Update 2010, 16, 488–509. [Google Scholar] [CrossRef]
- Thundathil, J.; Filion, F.; Smith, L.C. Molecular control of mitochondrial function in preimplantation mouse embryos. Mol. Reprod. Dev. 2005, 71, 405–413. [Google Scholar] [CrossRef]
- May-Panloup, P.; Vignon, X.; Chretien, M.F.; Heyman, Y.; Tamassia, M.; Malthiery, Y.; Reynier, P. Increase of mitochondrial DNA content and transcripts in early bovine embryogenesis associated with upregulation of mtTFA and NRF1 transcription factors. Reprod. Biol. Endocrinol. 2005, 3, 65. [Google Scholar] [CrossRef] [PubMed]
- Spikings, E.C.; Alderson, J.; St John, J.C. Regulated mitochondrial DNA replication during oocyte maturation is essential for successful porcine embryonic development. Biol. Reprod. 2007, 76, 327–335. [Google Scholar] [CrossRef]
- Sun, X.; St John, J.C. The role of the mtDNA set point in differentiation, development and tumorigenesis. Biochem. J. 2016, 473, 2955–2971. [Google Scholar] [CrossRef]
- Wilding, M.; Dale, B.; Marino, M.; di Matteo, L.; Alviggi, C.; Pisaturo, M.L.; Lombardi, L.; De Placido, G. Mitochondrial aggregation patterns and activity in human oocytes and preimplantation embryos. Hum. Reprod. 2001, 16, 909–917. [Google Scholar] [CrossRef]
- Wu, L.L.; Russell, D.L.; Wong, S.L.; Chen, M.; Tsai, T.S.; St John, J.C.; Norman, R.J.; Febbraio, M.A.; Carroll, J.; Robker, R.L. Mitochondrial dysfunction in oocytes of obese mothers: Transmission to offspring and reversal by pharmacological endoplasmic reticulum stress inhibitors. Development 2015, 142, 681–691. [Google Scholar] [CrossRef]
- Keefe, D.L.; Niven-Fairchild, T.; Powell, S.; Buradagunta, S. Mitochondrial deoxyribonucleic acid deletions in oocytes and reproductive aging in women. Fertil. Steril. 1995, 64, 577–583. [Google Scholar] [CrossRef]
- Fischer, B.; Bavister, B.D. Oxygen tension in the oviduct and uterus of rhesus monkeys, hamsters and rabbits. J. Reprod. Fertil. 1993, 99, 673–679. [Google Scholar] [CrossRef] [PubMed]
- Belli, M.; Zhang, L.; Liu, X.; Donjacour, A.; Ruggeri, E.; Palmerini, M.G.; Nottola, S.A.; Macchiarelli, G.; Rinaudo, P. Oxygen concentration alters mitochondrial structure and function in in vitro fertilized preimplantation mouse embryos. Hum. Reprod. 2019, 34, 601–611. [Google Scholar] [CrossRef] [PubMed]
- Ciray, H.N.; Aksoy, T.; Yaramanci, K.; Karayaka, I.; Bahceci, M. In vitro culture under physiologic oxygen concentration improves blastocyst yield and quality: A prospective randomized survey on sibling oocytes. Fertil. Steril. 2009, 91 (Suppl. S4), 1459–1461. [Google Scholar] [CrossRef] [PubMed]
- Kovacic, B.; Sajko, M.C.; Vlaisavljevic, V. A prospective, randomized trial on the effect of atmospheric versus reduced oxygen concentration on the outcome of intracytoplasmic sperm injection cycles. Fertil. Steril. 2010, 94, 511–519. [Google Scholar] [CrossRef]
- Kovacic, B.; Vlaisavljevic, V. Influence of atmospheric versus reduced oxygen concentration on development of human blastocysts in vitro: A prospective study on sibling oocytes. Reprod. Biomed. Online 2008, 17, 229–236. [Google Scholar] [CrossRef] [PubMed]
- Waldenstrom, U.; Engstrom, A.B.; Hellberg, D.; Nilsson, S. Low-oxygen compared with high-oxygen atmosphere in blastocyst culture, a prospective randomized study. Fertil. Steril. 2009, 91, 2461–2465. [Google Scholar] [CrossRef]
- Pham, A.H.; McCaffery, J.M.; Chan, D.C. Mouse lines with photo-activatable mitochondria to study mitochondrial dynamics. Genesis 2012, 50, 833–843. [Google Scholar] [CrossRef]
- Lan, Z.J.; Xu, X.; Cooney, A.J. Differential oocyte-specific expression of Cre recombinase activity in GDF-9-iCre, Zp3cre, and Msx2Cre transgenic mice. Biol. Reprod. 2004, 71, 1469–1474. [Google Scholar] [CrossRef]
- Umehara, T.; Winstanley, Y.E.; Andreas, E.; Morimoto, A.; Williams, E.J.; Smith, K.M.; Carroll, J.; Febbraio, M.A.; Shimada, M.; Russell, D.L.; et al. Female reproductive life span is extended by targeted removal of fibrotic collagen from the mouse ovary. Sci. Adv. 2022, 8, eabn4564. [Google Scholar] [CrossRef]
- Lozoya, O.A.; Xu, F.; Grenet, D.; Wang, T.; Grimm, S.A.; Godfrey, V.; Waidyanatha, S.; Woychik, R.P.; Santos, J.H. Single Nucleotide Resolution Analysis Reveals Pervasive, Long-Lasting DNA Methylation Changes by Developmental Exposure to a Mitochondrial Toxicant. Cell Rep. 2020, 32, 108131. [Google Scholar] [CrossRef]
- de Frutos, C.; Lopez-Cardona, A.P.; Fonseca Balvis, N.; Laguna-Barraza, R.; Rizos, D.; Gutierrez-Adan, A.; Bermejo-Alvarez, P. Spermatozoa telomeres determine telomere length in early embryos and offspring. Reproduction 2016, 151, 1–7. [Google Scholar] [CrossRef] [PubMed]
- Kameyama, Y.; Ohnishi, H.; Shimoi, G.; Hashizume, R.; Ito, M.; Smith, L.C. Asymmetrical allocation of mitochondrial DNA to blastomeres during the first two cleavages in mouse embryos. Reprod. Fertil. Dev. 2010, 22, 1247–1253. [Google Scholar] [CrossRef]
- Han, Y.M.; Yoo, O.J.; Lee, K.K. Sex determination in single mouse blastomeres by polymerase chain reaction. J. Assist. Reprod. Genet. 1993, 10, 151–156. [Google Scholar] [CrossRef] [PubMed]
- Gardner, D.K.; Wale, P.L.; Collins, R.; Lane, M. Glucose consumption of single post-compaction human embryos is predictive of embryo sex and live birth outcome. Hum. Reprod. 2011, 26, 1981–1986. [Google Scholar] [CrossRef] [PubMed]
- Creed, S.; McKenzie, M. Measurement of Mitochondrial Membrane Potential with the Fluorescent Dye Tetramethylrhodamine Methyl Ester (TMRM). Methods Mol. Biol. 2019, 1928, 69–76. [Google Scholar] [CrossRef]
- Adhikari, D.; Lee, I.W.; Al-Zubaidi, U.; Liu, J.; Zhang, Q.H.; Yuen, W.S.; He, L.; Winstanley, Y.; Sesaki, H.; Mann, J.R.; et al. Depletion of oocyte dynamin-related protein 1 shows maternal-effect abnormalities in embryonic development. Sci. Adv. 2022, 8, eabl8070. [Google Scholar] [CrossRef]
- Jin, X.L.; O’Neill, C. Systematic analysis of the factors that adversely affect the rate of cell accumulation in mouse embryos during their culture in vitro. Reprod. Biol. Endocrinol. 2014, 12, 35. [Google Scholar] [CrossRef]
- Leese, H.J.; Brison, D.R.; Sturmey, R.G. The Quiet Embryo Hypothesis: 20 years on. Front. Physiol. 2022, 13, 899485. [Google Scholar] [CrossRef]
- Leese, H.J.; Baumann, C.G.; Brison, D.R.; McEvoy, T.G.; Sturmey, R.G. Metabolism of the viable mammalian embryo: Quietness revisited. Mol. Hum. Reprod. 2008, 14, 667–672. [Google Scholar] [CrossRef]
- Sun, X.; Zhan, L.; Chen, Y.; Wang, G.; He, L.; Wang, Q.; Zhou, F.; Yang, F.; Wu, J.; Wu, Y.; et al. Increased mtDNA copy number promotes cancer progression by enhancing mitochondrial oxidative phosphorylation in microsatellite-stable colorectal cancer. Signal Transduct. Target. Ther. 2018, 3, 8. [Google Scholar] [CrossRef]
- El-Hattab, A.W.; Craigen, W.J.; Scaglia, F. Mitochondrial DNA maintenance defects. Biochim. Biophys. Acta Mol. Basis Dis. 2017, 1863, 1539–1555. [Google Scholar] [CrossRef]
- Seo, B.J.; Yoon, S.H.; Do, J.T. Mitochondrial Dynamics in Stem Cells and Differentiation. Int. J. Mol. Sci. 2018, 19, 3893. [Google Scholar] [CrossRef] [PubMed]
- Consensus Group, C. ‘There is only one thing that is truly important in an IVF laboratory: Everything’ Cairo Consensus Guidelines on IVF Culture Conditions. Reprod. Biomed. Online 2020, 40, 33–60. [Google Scholar] [CrossRef] [PubMed]
- Leary, C.; Leese, H.J.; Sturmey, R.G. Human embryos from overweight and obese women display phenotypic and metabolic abnormalities. Hum. Reprod. 2015, 30, 122–132. [Google Scholar] [CrossRef] [PubMed]
- Sainte-Rose, R.; Petit, C.; Dijols, L.; Frapsauce, C.; Guerif, F. Extended embryo culture is effective for patients of an advanced maternal age. Sci. Rep. 2021, 11, 13499. [Google Scholar] [CrossRef]
- Wells, D. Mitochondrial DNA quantity as a biomarker for blastocyst implantation potential. Fertil. Steril. 2017, 108, 742–747. [Google Scholar] [CrossRef] [PubMed]
- Cecchino, G.N.; Garcia-Velasco, J.A. Mitochondrial DNA copy number as a predictor of embryo viability. Fertil. Steril. 2019, 111, 205–211. [Google Scholar] [CrossRef] [PubMed]
- Shang, W.; Zhang, Y.; Shu, M.; Wang, W.; Ren, L.; Chen, F.; Shao, L.; Lu, S.; Bo, S.; Ma, S.; et al. Comprehensive chromosomal and mitochondrial copy number profiling in human IVF embryos. Reprod. Biomed. Online 2018, 36, 67–74. [Google Scholar] [CrossRef]
- Fragouli, E.; Spath, K.; Alfarawati, S.; Kaper, F.; Craig, A.; Michel, C.E.; Kokocinski, F.; Cohen, J.; Munne, S.; Wells, D. Altered levels of mitochondrial DNA are associated with female age, aneuploidy, and provide an independent measure of embryonic implantation potential. PLoS Genet. 2015, 11, e1005241. [Google Scholar] [CrossRef]
- Diez-Juan, A.; Rubio, C.; Marin, C.; Martinez, S.; Al-Asmar, N.; Riboldi, M.; Diaz-Gimeno, P.; Valbuena, D.; Simon, C. Mitochondrial DNA content as a viability score in human euploid embryos: Less is better. Fertil. Steril. 2015, 104, e534–e541.e1. [Google Scholar] [CrossRef]
- Ravichandran, K.; McCaffrey, C.; Grifo, J.; Morales, A.; Perloe, M.; Munne, S.; Wells, D.; Fragouli, E. Mitochondrial DNA quantification as a tool for embryo viability assessment: Retrospective analysis of data from single euploid blastocyst transfers. Hum. Reprod. 2017, 32, 1282–1292. [Google Scholar] [CrossRef] [PubMed]
- Ritu, G.; Veerasigamani, G.; Ashraf, M.C.; Singh, S.; Laheri, S.; Colaco, S.; Modi, D. Mitochondrial DNA Levels in Trophectodermal Cells Show No Association with Blastocyst Development and Pregnancy Outcomes. J. Hum. Reprod. Sci. 2022, 15, 82–89. [Google Scholar] [CrossRef] [PubMed]
- Fragouli, E.; McCaffrey, C.; Ravichandran, K.; Spath, K.; Grifo, J.A.; Munne, S.; Wells, D. Clinical implications of mitochondrial DNA quantification on pregnancy outcomes: A blinded prospective non-selection study. Hum. Reprod. 2017, 32, 2340–2347. [Google Scholar] [CrossRef] [PubMed]


Disclaimer/Publisher’s Note: The statements, opinions and data contained in all publications are solely those of the individual author(s) and contributor(s) and not of MDPI and/or the editor(s). MDPI and/or the editor(s) disclaim responsibility for any injury to people or property resulting from any ideas, methods, instructions or products referred to in the content. |
© 2024 by the authors. Licensee MDPI, Basel, Switzerland. This article is an open access article distributed under the terms and conditions of the Creative Commons Attribution (CC BY) license (https://creativecommons.org/licenses/by/4.0/).
Share and Cite
Winstanley, Y.E.; Liu, J.; Adhikari, D.; Gonzalez, M.B.; Russell, D.L.; Carroll, J.; Robker, R.L. Dynamics of Mitochondrial DNA Copy Number and Membrane Potential in Mouse Pre-Implantation Embryos: Responses to Diverse Types of Oxidative Stress. Genes 2024, 15, 367. https://doi.org/10.3390/genes15030367
Winstanley YE, Liu J, Adhikari D, Gonzalez MB, Russell DL, Carroll J, Robker RL. Dynamics of Mitochondrial DNA Copy Number and Membrane Potential in Mouse Pre-Implantation Embryos: Responses to Diverse Types of Oxidative Stress. Genes. 2024; 15(3):367. https://doi.org/10.3390/genes15030367
Chicago/Turabian StyleWinstanley, Yasmyn E., Jun Liu, Deepak Adhikari, Macarena B. Gonzalez, Darryl L. Russell, John Carroll, and Rebecca L. Robker. 2024. "Dynamics of Mitochondrial DNA Copy Number and Membrane Potential in Mouse Pre-Implantation Embryos: Responses to Diverse Types of Oxidative Stress" Genes 15, no. 3: 367. https://doi.org/10.3390/genes15030367
APA StyleWinstanley, Y. E., Liu, J., Adhikari, D., Gonzalez, M. B., Russell, D. L., Carroll, J., & Robker, R. L. (2024). Dynamics of Mitochondrial DNA Copy Number and Membrane Potential in Mouse Pre-Implantation Embryos: Responses to Diverse Types of Oxidative Stress. Genes, 15(3), 367. https://doi.org/10.3390/genes15030367